Article

Early Effects of No-Till Use on Durum Wheat (Triticum durum Desf.): Productivity and Soil Functioning Vary between Two Contrasting Mediterranean Soils

by
Giuseppe Badagliacca
1,
Emilio Lo Presti
1,*,
Andrea Ferrarini
2,
Flavio Fornasier
3,
Vito Armando Laudicina
4,
Michele Monti
1 and
Giovanni Preiti
1
1
Agraria Department, University “Mediterranea” of Reggio Calabria, 89122 Reggio Calabria, Italy
2
Department of Sustainable Crop Production, Università Cattolica del Sacro Cuore, 29122 Piacenza, Italy
3
Council for Agricultural Research and Economics (CREA-VE), Via Trieste 23, 34170 Gorizia, Italy
4
Department of Agricultural, Food and Forest Science, University of Palermo, 90128 Palermo, Italy
*
Author to whom correspondence should be addressed.
Agronomy 2022, 12(12), 3136; https://doi.org/10.3390/agronomy12123136
Submission received: 24 October 2022 / Revised: 24 November 2022 / Accepted: 8 December 2022 / Published: 10 December 2022
(This article belongs to the Section Farming Sustainability)

Abstract

:
The diffusion of no-tillage (NT) is to be encouraged because of the benefits it can provide in terms of improving soil fertility and counteracting global warming and climate change as part of climate-smart agriculture practices. However, the introduction of this management can be difficult, especially in the first years of application, and can lead to unpredictable yield results depending on the soil type. Therefore, the aim of this experiment was to evaluate the early effect of NT use, compared to the conventional mouldboard ploughing (CT), on two different soils, a clay-loam (GAL) and a sandy-clay-loam soil (SMA), by monitoring a set of 43 different soil and plant variables that were expected to vary with tillage and/or soil type. At both experimental sites, NT showed lower wheat total biomass (−29%) and grain yields (−17%) than CT with a more pronounced decrease in GAL than in SMA. Yield differences were accompanied by modifications in nutrient, microbial community and soil enzyme activity dynamics which highlighted higher stress in GAL, than in SMA soil, attributable to lower crop residues decomposition and substrate availability. Therefore, our findings suggest that the negative consequences due to the transition to NT depend on specific soil characteristics, like texture and organic matter concentration, with different repercussions on soil quality as well as on wheat growth and productivity.

1. Introduction

No-tillage (NT) use, as a part of conservation and climate-smart agriculture, is proposed as an effective management for facing global warming and climate change [1,2]. Indeed, the NT application can play an important role for the adaptation and mitigation, at the same time, of the climate crisis by reducing soil erodibility [3], enhancing aggregation and aggregate stability [4,5], lowering soil heat capacity and thermal conductivity [6], increasing soil water retention [7,8], cutting energy use and carbon (C) emissions [9], promoting the sequestration into the soil of atmospheric C as stable organic matter, as well as enhancing wildlife habitat [10,11]. Moreover, NT use allows to save fossil fuels, labour, and time [12,13]. With regard to the C sequestration, the application and diffusion of NT soil management can have a pivotal role in order to achieve the ambitious target set by the four per 1000 initiative, which aims to offset atmospheric CO2 emissions from fossil fuels by increasing the amount of C stored in the soil by 4‰ per year [14]. Moreover, considering the different benefits provided by its application, NT use can be a valuable practice in order to counteract soil degradation phenomena and restore the fertility of soils in arid and semi-arid regions [15,16]. However, in many cases, the effect of NT use, and of many conservation managements in general, require a number of years of continuous application to become apparent [17,18].
Although NT use can lead to positive effects, it cannot always be successfully applied in all agroecosystems highlighting deficiencies in providing agroecosystem services. In particular, especially in the first years of conversion, combining the improvement of soil fertility and the environmental benefits with productivity can be very difficult. Indeed, contradictory results are reported regarding the effects of conservation tillage on crop growth and yield varying from positive [19,20,21] to negative [22,23,24] with additional studies that report no differences among soil managements [25,26] or fluctuating results depending on the rainfall pattern of the year [27,28]. The numerous changes caused by the use of no-tillage are mediated by several soil-specific factors (like soil texture, organic C concentration, structure, etc.) and have significant effects on plant growth and nutrient dynamics and, consequently, on crop production. This is one reason for the different responses of agroecosystems to the introduction of this technique. Among these changes, effects on soil aeration, crop residue distribution along the profile, temperature, and moisture regimes can strongly affect soil detritusphere organisms and processes that selectively can increase or decrease, also showing trends that can change over time with consequences on substrates’ availability for plant and the growth of the microbial community itself [18,29,30,31,32,33]. Therefore, it appears that immediately after the application of NT some changes occur more quickly while others take a long time, and the occurrence of this response is linked to soil properties [34,35]. Although several mid- and long-term studies have been conducted in the Mediterranean environment in order to assess soil management's effect on soil properties and wheat productivity (e.g., [28,36,37,38]), few studies were focused to assess which soil chemical and biochemical variables are most sensitive to the implementation of NT. These variables can be a useful indicator of soil processes and may highlight critical aspects that often hinder the successful implementation of NT and induce farmers to abandon this management.
Therefore, to fill this knowledge gap, this experiment aimed to investigate in depth the short-term effects of the application of NT in two soils with constraining properties under the Mediterranean semiarid environment. The aspects analysed were wheat productivity and uptakes, soil C, N, and P dynamics, microbial community structure, and enzymatic activity in order to have a complete assessment of the effects on both plant and soil functioning in soil with different characteristics.

2. Materials and Methods

2.1. Experimental Sites Description

The field experiment was established during the 2019/2020 growing season in two arable soils (a clay-loam and a sandy-clay-loam) located within the Calabrian region (Southern Italy) characterized by different soil textures, organic matter, and carbonate concentrations (Figure 1).
The first experimental location, henceforth referred to as “GAL”, was the experimental station of the University “Mediterranea” of Reggio Calabria, located in Gallina of Reggio Calabria, Calabria, Italy (38° 10′ N, 15° 45′ E, 232 m a.s.l.). The soil of this experimental site is a Typic Haploxeralf [39] and its properties, referring to the 0–20 cm top layer (Ap horizon), were as follows: 35% clay, 25% silt and 40% sand (clay-loam texture), pH 7.05 (1:2.5 H2O), electrical conductivity (EC) 0.165 dS m−1 (1:2), cation exchange capacity (CEC) 17.2 cmol+ kg−1, total carbonates 8.4 g kg−1, total organic C (Walkley–Black) 19.3 g kg−1, total nitrogen (N) (Kjeldahl) 1.8 g kg−1, available phosphorus (P) (Olsen) 9.30 mg kg−1. The climate is semiarid Mediterranean characterized by mild and rainy winters and warm and dry summers. Mean annual rainfall is 617 mm (20 years average), mostly in the autumn and winter (77%) and in the spring (22%) while the mean yearly air temperature is 17.2 °C (20 years average) with 19.5 °C in autumn, 12.0 °C in winter, 15.9 °C in spring, and 25.1 °C in summer. The average minimum and maximum annual temperatures are 11.6 °C and 27.5 °C, respectively (ARPACAL).
The second experimental site, referred as “SMA”, was at the agricultural experimental centre “Casello” of the Regional Agency for Agriculture “ARSAC” located in San Marco Argentano, Calabria, Italy (39° 38′ N, 16° 13′ E, 100 m a.s.l.). The experiment was carried out on a sandy-clay-loam soil, classified as Fluventic Haploxerept, coarse silty, mixed, and thermic [39]. The main soil properties, referred to in the 0–20 cm top layer (Ap horizon), are as follows: 21% clay, 24% silt, and 55% sand, pH 7.67 (1:2.5 KCl), EC 0.21 dS m−1 (1:2), CEC 26.2 cmol+ kg−1, total carbonates 18.0 g kg−1, total organic C (Walkley–Black) 9.81 g kg−1, total N (Kjeldahl) 0.95 g kg−1, and available P (Olsen) 16.95 mg kg−1. The climate of the experimental site is Mediterranean characterized by mild and rainy winters and warm and dry summers. Mean annual rainfall is 706 mm (20-years average), mostly in the autumn and winter (68%) and in the spring (22%), while the mean yearly air temperature is 14.7 °C (20-years average) with 17.0 °C in autumn, 8.8 °C in winter, 13.3 °C in spring, and 24.6 °C in summer. The average minimum and maximum annual temperatures are 6.8 °C and 27.9 °C, respectively (ARPACAL). At both experimental sites, the weather data were collected from a weather station located nearby.

2.2. Experimental Design and Crop Management Sites Description

At both experimental sites, the field trial was set up as a completely randomized block design (RCBD) with four replications. The plot area was 540 m2 (30 × 18 m). At both locations, during the previous year, soil was covered with a polyphite forage cover. The two soil managements tested were conventional tillage (CT) and no-tillage (NT). CT consisted of mouldboard ploughing to a depth of 30 cm in October 2019 followed by one shallow harrowing operation, at 15 cm soil depth, before sowing. NT consisted of one passage of mulcher and chemical herbicide, to grind weed biomass and control their emergence, followed by sowing through direct drilling. In order to assess the tillage effect on soil properties and plant growth, no fertilization was provided to all plots. Durum wheat (Triticum durum Desf.), cv. Ramirez was sown in December 2019 (17/12 at GAL and 5/12 at SMA) in rows spaced 16 cm apart at density of 350 viable seeds m−2 and harvested at the end of June 2020 (25/6 at GAL and 24/6 at SMA).

2.3. Plant Biomass Sampling and Analyses

At the harvest stage, full ripe (89 BBCH phenological stage; Zadok growth stage 90), total durum wheat aboveground plant biomass was sampled from three areas of 1 m2 within each plot. Total above-ground dry matter production was determined after oven drying at 60 °C until a constant weight was reached. The harvested biomass was then separated and threshed into grains and straw, and both were weighed to calculate grain and straw yield, thousand kernels weight (TKW) and, harvest index (HI). Then, straw and grain were ground by using a laboratory mill (1-mm sieve) before further analysis. Grain test weight (TW) was determined by using a grain analysis computer (GAC II instrument, Dickey-John, Auburn, IL, USA). Nitrogen concentration of straw and grain were determined on 2.0 g sample by the Kjeldahl method [40] by using a digestor Foss Tecator digest auto (Foss Italia, Padova, Italia) coupled with a Foss Kjeltec 8400 distillation unit (Foss Italia, Padova, Italia). Nitrogen concentration in grain was converted into protein by using a conversion factor of 5.81 [41]. Phosphorus concentration of straw and grain were determined by wet-acid digestion of samples by using nitric and perchloric acid mixture and the subsequent application of ammonium molybdate spectrophotometric method [42,43] by using Flow Injection Analysis System (FIAS 400 PerkinElmer, Inc., Shelton, CT, USA) equipped with an AS90 Autosampler (PerkinElmer) and connected to a UV/Vis spectrophotometer Lambda 25 (PerkinElmer). The N and P straw and grain uptakes were calculated by multiplying the straw and grain biomass for the respective N and P concentrations, while total N and P uptakes were calculated by the sum of straw and grain uptake for each element.

2.4. Soil Sampling and Analyses

Soil samples were collected at wheat sowing (December, T0) and at harvest (end-June, T1). Four individual soil samples (approx. 500 g each) were collected at 0–20 cm soil depth from each plot, by using a manual auger, and then thoroughly mixed to form a unique composite sample. Four composite samples were taken per treatment, eight for each sampling time, sixteen per experimental site, and thirty-two in total. On return to the laboratory, each sample was split in two aliquots in order to be used according to the analysis type: a representative amount of field moist soil (200 g) was promptly stored at −20 °C; whereas the remaining aliquot (300 g) was air-dried, sieved to pass through a 2-mm sieve, and then stored at room temperature. Soil permanganate oxidizable C (POxC) was determined according to the method developed by Weil et al. [44] and Culman et al. [45], reading supernatant absorbance at 550 nm with a UV/Vis Lambda 25 (PerkinElmer, Norwalk, CT, USA) spectrophotometer and using UVWinLab Software (PerkinElmer). Nitrate-N (NO3-N) and ammonium-N (NH4+-N) were determined by Berthelot reaction and Griess–Ilosvay method, respectively, in 2 M KCl soil extracts (1:10, w/v) using the FIAS system described above. In 2M KCl soil extracts, total soluble N (TSN) was determined by the sum of total Kjeldahl N (Kjeldahl method) and NO3-N (FIAS method) while the extractable organic N (EON) was calculated as the difference between the total Kjeldahl N and NH4+-N (FIAS method). Available phosphorus (Olsen, OlsP) was determined by extracting phosphate from the soil with 0.5 N sodium bicarbonate solution adjusted to pH 8.5 (1:20, w/v) [46] and measuring its concentration through ammonium molybdate spectrophotometric method and the FIAS system described above. At end of the cropping season, soil bulk density (BD) was determined by the core method [47].
Phospholipid fatty acids (PLFAs) were extracted from soils and analysed according to the modified Bligh and Dyer method [48]. Lipids were extracted from 5 g of soil with a single-phase mixture of chloroform-methanol-citrate buffer (1 : 2 : 0.8, v/v/v) as described by Wu et al. [49]. The resulting extract was fractionated into neutral lipids, glycolipids and polar lipids with 10 cm3 chloroform, 20 cm3 acetone and 10 cm3 methanol through a silicic acid column, respectively. The polar lipids were trans-esterified to the fatty acid methyl esters (FAMEs) by mild alkaline methanolysis [50]. The FAMEs were recovered with an n-hexane:chloroform mixture (4:1, v/v), reduced to dryness by rotavapor and re-dissolved in 200 cm3 of n-hexane. The FAMEs were detected by a gas chromatograph (FOCUS GC-Thermo Scientific, Milano, Italy) equipped with a flame ionization detector and a Mega-10 fused-silica capillary column (50 m long, 0.32 mm I.D., 0.25 μm film thickness). The GC temperature progression was as follows: initial isotherm at 115 °C for 5 min, increased at a rate of 1.5 °C per minute from 115 to 230 °C, and final isotherm at 230 °C for 2 min. Both the injection port and detector were set up at 250 °C, and helium at 1 cm3 min−1 in a constant flow mode was used as carrier. The injected volume was 1 cm3 in splitless mode. Nonadecanoic acid methyl ester (19:0; cat no. N-5377, Sigma-Aldrich Co., St. Louis, MO, USA) was used as an internal standard for the quantification of FAMEs. Identification of the peaks was based on the comparison of retention times to known standards (Supelco bacterial acid methyl esters and Supelco 37 component fatty acid methyl esters). The abundance of each FAME was expressed as nanomoles per gram of dry soil and as mole percent (mol %) of total fatty acids. Fatty acids (FA) with fewer than 14 C-atoms or more than 20 C-atoms were excluded as considered to originate from non-microbial sources. The FAs i15:0, a15:0, 15:0, i16:0, i17:0, 17:0, cy17:0, 18:1ω7, and cy19:0 were used to represent bacterial biomass (BAC) while the FA 18:2ω6,9 was used for fungal biomass [51]. The FAs i15:0, a15:0, i16:0, and i17:0 were chosen to represent Gram-positive bacteria (Bac+), the FAs 18:1ω7, cy17:0, and cy19:0 for Gram-negative bacteria (Bac) [52].
The activity of twenty-one enzymes involved in the key steps of C, N, P, and S cycling were measured following [53]: (i) α-glucosidase (alfaG), β-glucosidase (betaG), α-galactosidase (alfaGAL), β-galactosidase (betaGAL), α-mannosidase (alfaMAN), β-mannosidase (betaMAN), β-1,4-glucanase (cell), β-1,4-xylanase (xilo), α-arabinase (arabin), β-D-glucuronidase (uroni) involved in C cycling; (ii) N-acetyl-b-D-glucosaminidase (chit), leucine amino-peptidase (leu), trypsin-like protease (arginina) involved in N cycling; (iii) acid (acP) and alkaline phosphomonoesterase (alkP), pyrophosphodiesterase (piroP), phosphodiesterase (bisP), inositol-P phosphatase (inositP) involved in P cycling; (iv) arylsulfatase (aryS) involved in S cycling; and (v) butirate (butir) and nonanoate (nona) esterase involved in the hydrolysis of ester bonds. Enzymes' activities were determined on soil extracts [54] using fluorogenic substrates containing 4-methyl-umbelliferyl (MUF) and 7-amino-4-methyl coumarin (AMC) as fluorophores. Enzymes were desorbed by heteromolecular exchange procedure via bead-beating according to Cowie et al. [55]. Briefly, 0.4 g of moist soil was placed into 2-cm3 tubes, together with 1.4 cm3 of a solution containing 3% lysozyme and glass plus ceramic beads. Tubes were then shaken at 30 strokes s−1 for 3 min, using a Retsch 400 MM beating mill, and then centrifuged at 20.000× g for 5 min. The supernatant containing desorbed enzymes was dispensed into 384-well white microplates with the appropriate buffers to fluorometrically quantify enzymatic activities using the above-mentioned fluorogenic substrates.

2.5. Statistical Analyses

Experimental data were first tested for deviation from normality (Kolmogorov–Smirnov test) and homogeneity of within-group variances (Levene’s test). To assess the soil and tillage effects, data were analysed as follows: production data (biomass yield, grain yield, HI, TW, TKW, N, and P concentrations and N and P uptakes) and soil BD were subject to a two-way analysis of variance (ANOVA) (Soil × Tillage) while soil variables (POxC, N pools, available P, microbial group, and enzymes) were analysed by a two-way analysis of variance (ANOVA) with repeated measures (Time × Soil × Tillage). Data were compared using Tukey’s HSD test at the 5% probability level (p-value < 0.05). Statistical analyses were performed by using SAS/STAT Version 9.1 (SAS Institute Inc., Cary, NC, USA). A principal component analysis (PCA) was performed, using plant and soil data, in order to differentiate treatments and to identify the major sources of difference between the four cropping systems (combinations of the two soils and the two tillage systems) identified by their centroid values; the significance between means was determined using Mahalanobis distance. PCA was performed by using R v4.1.2 statistical software (R Foundation for Statistical Computing, Vienna, Austria ) [56] with FactoMineR v1.41 [57] and Factoextra [58] packages. To study the relationship between the investigated plant and soil variables, Pearson’s correlation coefficients were calculated in R v4.1.2 by using the command “cor” and the related results were plotted by using the Corrplot library [59]. To assess the influence of the investigated soil variables on grain yield, stepwise multiple linear regressions (MLR) were carried out globally considering the entire dataset and individually per soil type by using SAS/STAT Version 9.1 (proc reg). Other graphs in the article were plotted by MS Excel 2016.

3. Results

3.1. Weather Conditions

The weather conditions during the experimental period at both locations are presented in Figure 2.
At GAL site, total rainfall was 607 mm, similar to the long-term average rainfall for this site (617 mm), of which about 58% occurred from September to November in 26 rainy days (i.e., before crop sowing) while from December to June it rained the other 42% (58 rainy days). The mean air temperature was 1.4 °C higher than that of the long-term period (17.2 °C) with mean daily values ranging from 8.1 °C to 30.3 °C. Compared to the long-term mean air temperature data, the trend was similar but wider fluctuations on a daily basis were observed in the winter period from December to February (Figure 2). At SMA site, total rainfall was 721 mm, similar to the long-term average value, of which 29% (207 mm) occurred from September to November on 25 rainy days, while the wettest period was between December and May when it rained 462 mm on 70 rainy days. The mean air temperature was 1.2 °C higher than that of the long-term period (14.7 °C), with mean daily values varying between 4.1 °C and 30.7 °C (Figure 2).

3.2. Wheat Growth, Yield and Grain Quality

Biomass yield was affected by both soil and tillage but not by their interaction (Table 1).
Straw P concentration (P-Straw) exhibited a significant difference only among soils with higher values in SMA (+17%), while P grain concentration (P-Grain) was affected by the interaction soil × tillage with higher values retrieved in GAL (2.45‰ vs. 2.34‰) and, among managements, under NT (+26% than CT on average) (Table 1).
Higher biomass yield was obtained at SMA site compared to GAL one (+20%, on average) whereas, at both sites, higher biomass yields were observed in CT plots than in NT ones (+29%, on average). Grain yield was affected by the interaction soil × tillage showing slightly higher mean value in GAL than in SMA (+4%, on average) and greater values under CT compared to NT (+17%, on average). Differences among soil managements were more relevant in GAL, where the greatest difference between treatments was found (+28% in CT than in NT, equal to 1.1 t ha−1) due to the highest value in CT (4.9 t ha−1) and the lowest value in NT (3.8 t ha−1) retrieved; on the contrary, a smaller difference between the treatments was observed in SMA (+6% in CT than in NT, +0.26 t ha−1).
The HI was affected only by soil, highlighting higher values in GAL than in SMA (0.39 vs. 0.32, on average) (Table 1). TW and TKW were both significantly affected by the interaction soil × tillage showing higher values in GAL (+5% for the test weight and +12% for the TKW), with no differences among tillage systems, than in SMA, where higher values were retrieved under CT. Straw N concentration (N-Straw) was affected by the interaction among both investigated factors; in particular, between the two experimental sites SMA > GAL (+43%, on average), with higher values under CT (+14%) than NT in SMA and no difference among tillages in GAL. Otherwise, no effect from treatments was observed on N grain concentration (N-Grain) (p > 0.05), with the retrieved mean values of 2.06% (Table 1).

3.3. Crop N and P Concentrations and Uptakes

Straw N uptake was affected by the interaction between soil and tillage systems (Table 2) showing higher values in SMA, where also a greater uptake was retrieved in CT; no difference between tillage systems was observed in GAL.
N grain uptake showed a significant effect from the applied tillage; in particular, in both experimental sites, greater grain uptakes were observed under CT (+16%, average) than under NT (Table 2). Total N uptake was affected by both soil and tillage systems but not by their interaction; on average, total uptakes were higher in SMA than in GAL whereas among tillages greater values were retrieved in CT than in NT (CT +25%, on average) (Table 2). With regard to P uptakes, P-straw uptake was significantly influenced separately by the soil and tillage systems, while P-grain and total uptakes were affected by the interaction of the soil and tillage systems. In particular, P uptakes were always higher in SMA than in GAL. Moreover, between experimental sites, if in SMA significant differences among CT and NT were observed with higher values in CT (+31% for straw uptake, +20% for grain uptake and +21% for total P uptake), in GAL the gap between treatments was always smaller and never significant (Table 2).

3.4. Soil Physical, Chemical and Biochemical Properties

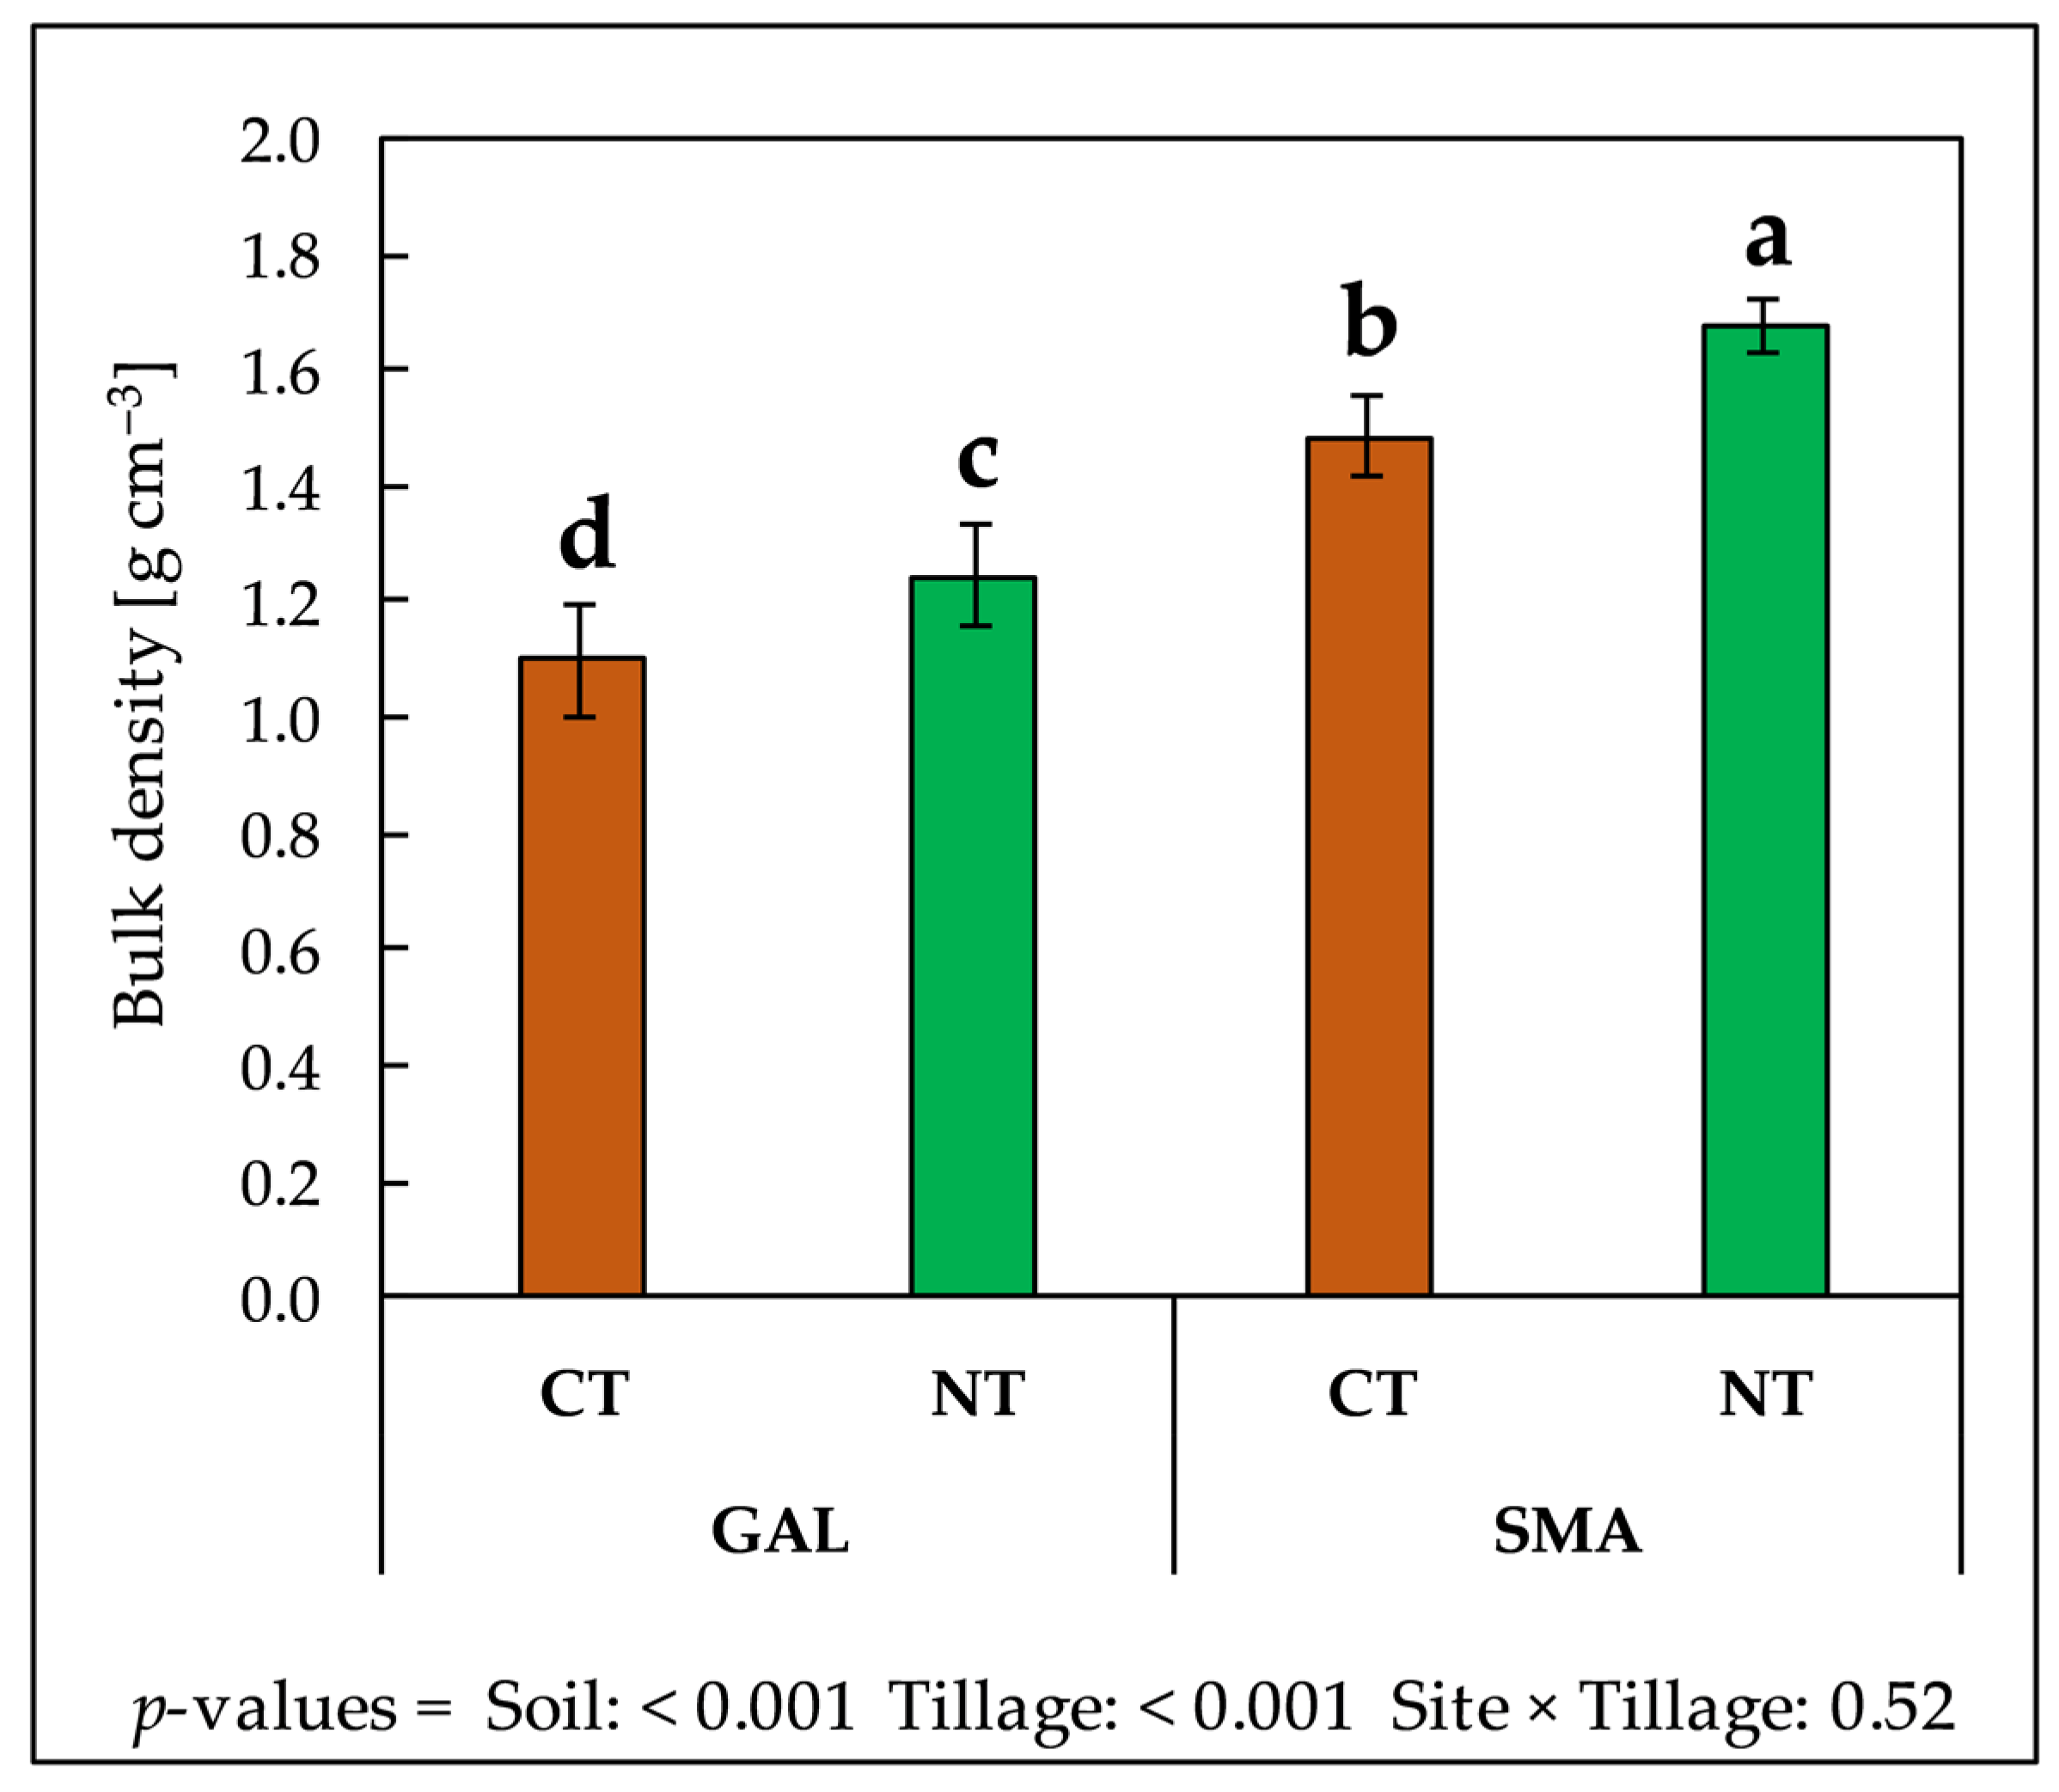
Soil BD values measured at the end of the cropping season were affected by both soil and tillage systems tested but not by their interaction (Figure 3). Higher values of soil BD were observed in SMA than in GAL (1.2 vs. 1.6 g cm−3, on average) and within each experimental location NT determined an increase of soil BD by +13% compared to CT (Figure 3).
Soil POxC was affected only by the soil resulting higher in GAL (+12%) than in SMA (Table 3).
Soil N pools were significantly affected by all tested factors (Table 3). As a general trend, NO3-N and NH4+-N had higher values in GAL than in SMA with a different behaviour between the two tillage treatments. In particular, in GAL soil NO3-N, concentrations under CT were higher (+70%, on average), showing similar values at the beginning (T0) and the end of the cropping cycle (T1), than in NT where NO3-N concentration decreased from sowing (T0) to harvest (T1). Conversely, in SMA, a different tendency between tillage systems was observed with higher NO3-N concentration in CT at sowing (T0) and in NT at harvest (T1) (Table 3). With regard to NH4+-N, at sowing sampling (T0) a contrasting trend between tillage systems in the two experimental soils was observed; in GAL higher values were retrieved in CT (+21%) than in NT, while the opposite was observed in SMA (NT +106% than CT). Then, at harvest (T1), higher values were recorded in GAL (+129%, on average) than in SMA (Table 3), while no difference between the tillage systems was detected.
Soil TSN and EON concentrations, on average, were higher (+13%) in SMA than in GAL. In particular, at sowing time (T0), in GAL, higher values (+22%, on average) of both these two parameters were retrieved in CT than in NT while the opposite trend was observed in SMA (NT +89%, on average); at harvest (T1), in GAL, CT use determined a reduction of TSN and EON with respect to their levels at sowing (T0), while NT showed higher values compared to the first sampling (sowing, T0) and the CT treatment (+74%). Otherwise, in SMA, CT application increased soil TSN and EON concentrations (+36%) while in NT their values, higher than CT (+34%), remain constant (Table 3).
Soil OlsP was affected only by soil and tillage. With regard to the soil, it was highest in SMA than in GAL (+92%) whereas, among the tillages, under NT (+51% in GAL and +38% in SMA) compared to CT (Table 3).
Soil MB was significantly affected by the time and the interaction time × tillage. Generally, soil MB was higher at sowing (T0) than at harvest (T1). At sowing (T0), the lowest value was found in GAL soil under CT, although no difference occurred in SMA soil, whereas, at harvest (T1), the lowest values occurred under NT in both sites (Figure 4).
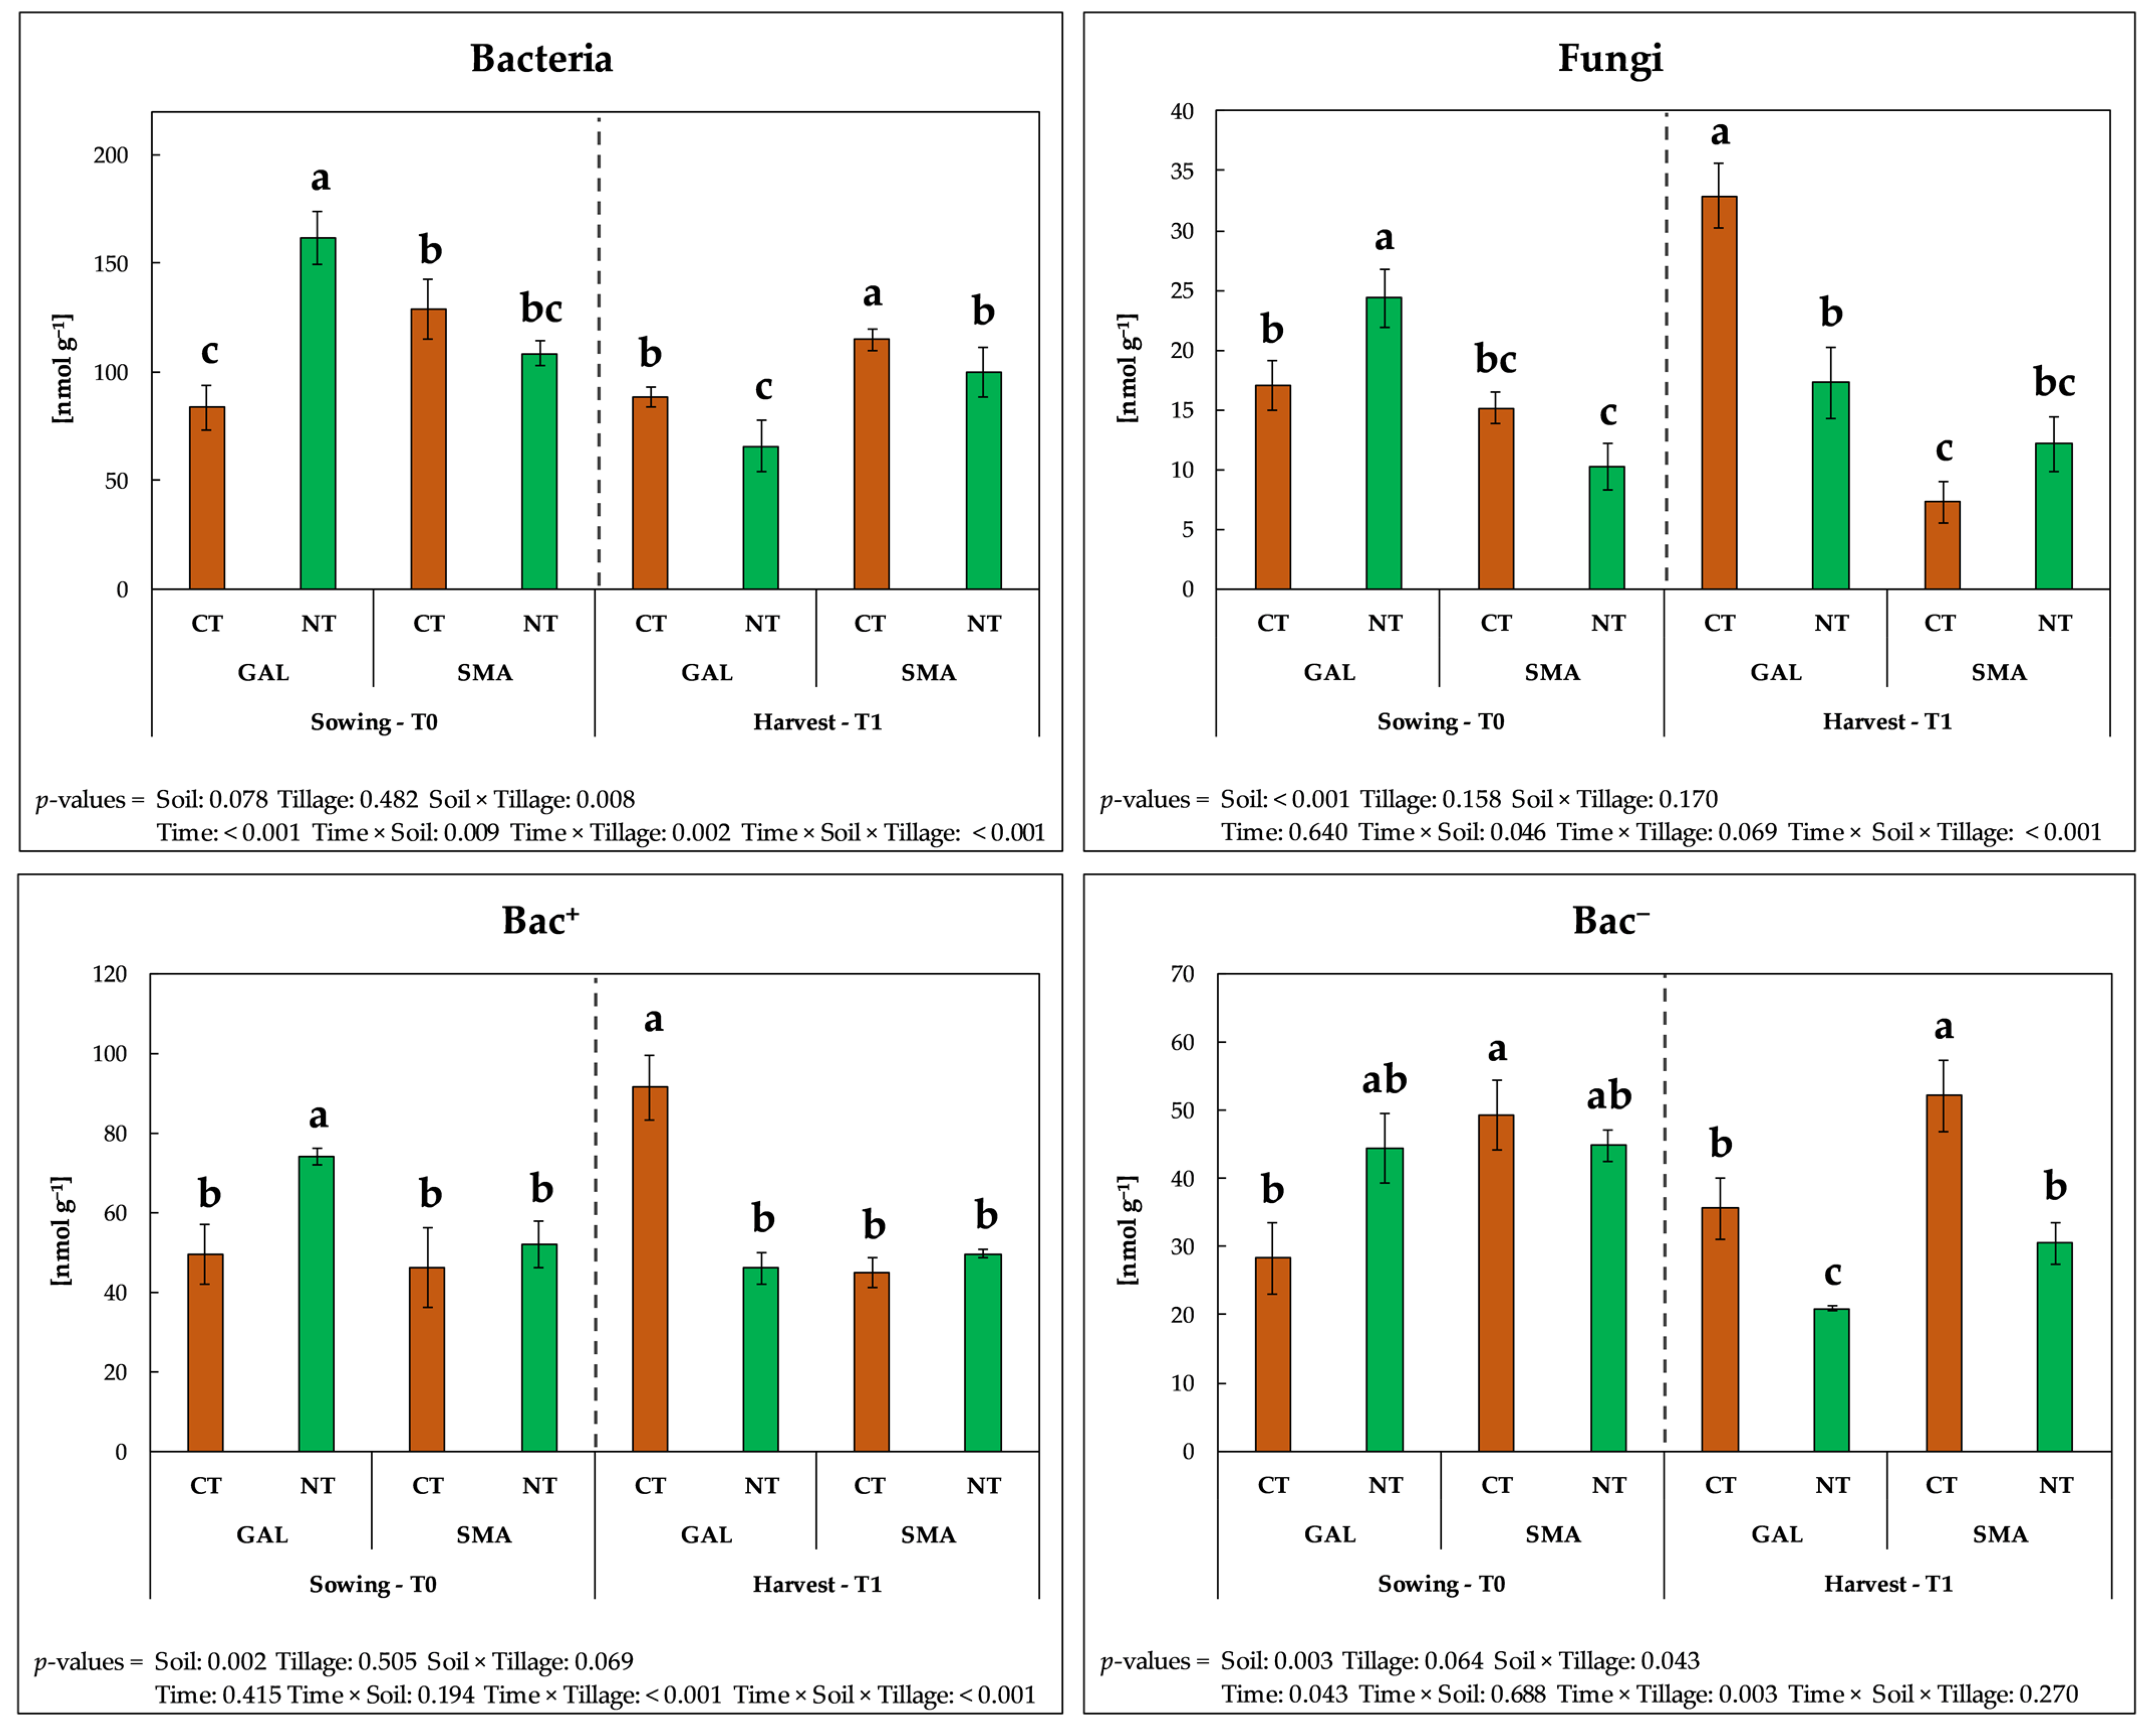
Soil microbial groups were not affected specifically by tillage. Soil BAC abundance was significantly affected by soil and soil × tillage interaction as well as by time and its interactions with both soil and tillage systems (Figure 5).
On average, higher BAC values were retrieved in SMA (+13%) than in GAL. Between the two tillage managements, at sowing (T0), in GAL, BAC was higher in NT (+93%) than under CT, while the opposite trend was observed in SMA (CT +19% than NT); at harvest (T1), the differences between the management systems were reduced with slightly higher values in CT (+23%, on average) than NT at both sites.
Fungal biomass was significantly influenced by soil and by the interaction time × soil and time × soil × tillage. On average, the fungal biomass was twice in GAL than in SMA (22.9 vs. 11.2 nmol g−1); among treatments, in GAL at sowing (T0), NT showed higher values (+43%) than CT, whereas the opposite trend was retrieved at harvest (T1) (CT +90% > NT); in SMA, if similar values between treatments were observed at sowing (T0) (12.7 nmol g−1, on average), at harvest (T1), lower fungal biomass was retrieved in CT than in NT (−40%) (Figure 5).
Among the bacterial group, Bac+ abundance was affected only by soil, while Bac resulted influenced by soil and soil × tillage interaction (Figure 5); about the time factor, interactions time × tillage and time × soil × tillage affected Bac+ while time and time × tillage were significant for Bac. With regard to Bac+, in GAL at sowing (T0), a higher value was retrieved in NT (+50%) than in CT while at harvest (T1) the opposite trend occurred. No significant differences were observed in SMA on Bac+ between management nor between sampling times. Bac abundance was affected by soil and soil × tillage interaction; time and time × tillage were also significant for this parameter. In GAL, Bac abundance at sowing (T0) was higher in NT (+57%) than in CT, whereas the opposite trend was observed at harvest (T1) (CT +71% than NT); in SMA, if at sowing (T0) CT and NT showed similar values, at harvest a greater abundance of this group of bacteria was observed in CT (+71%) (Figure 5).
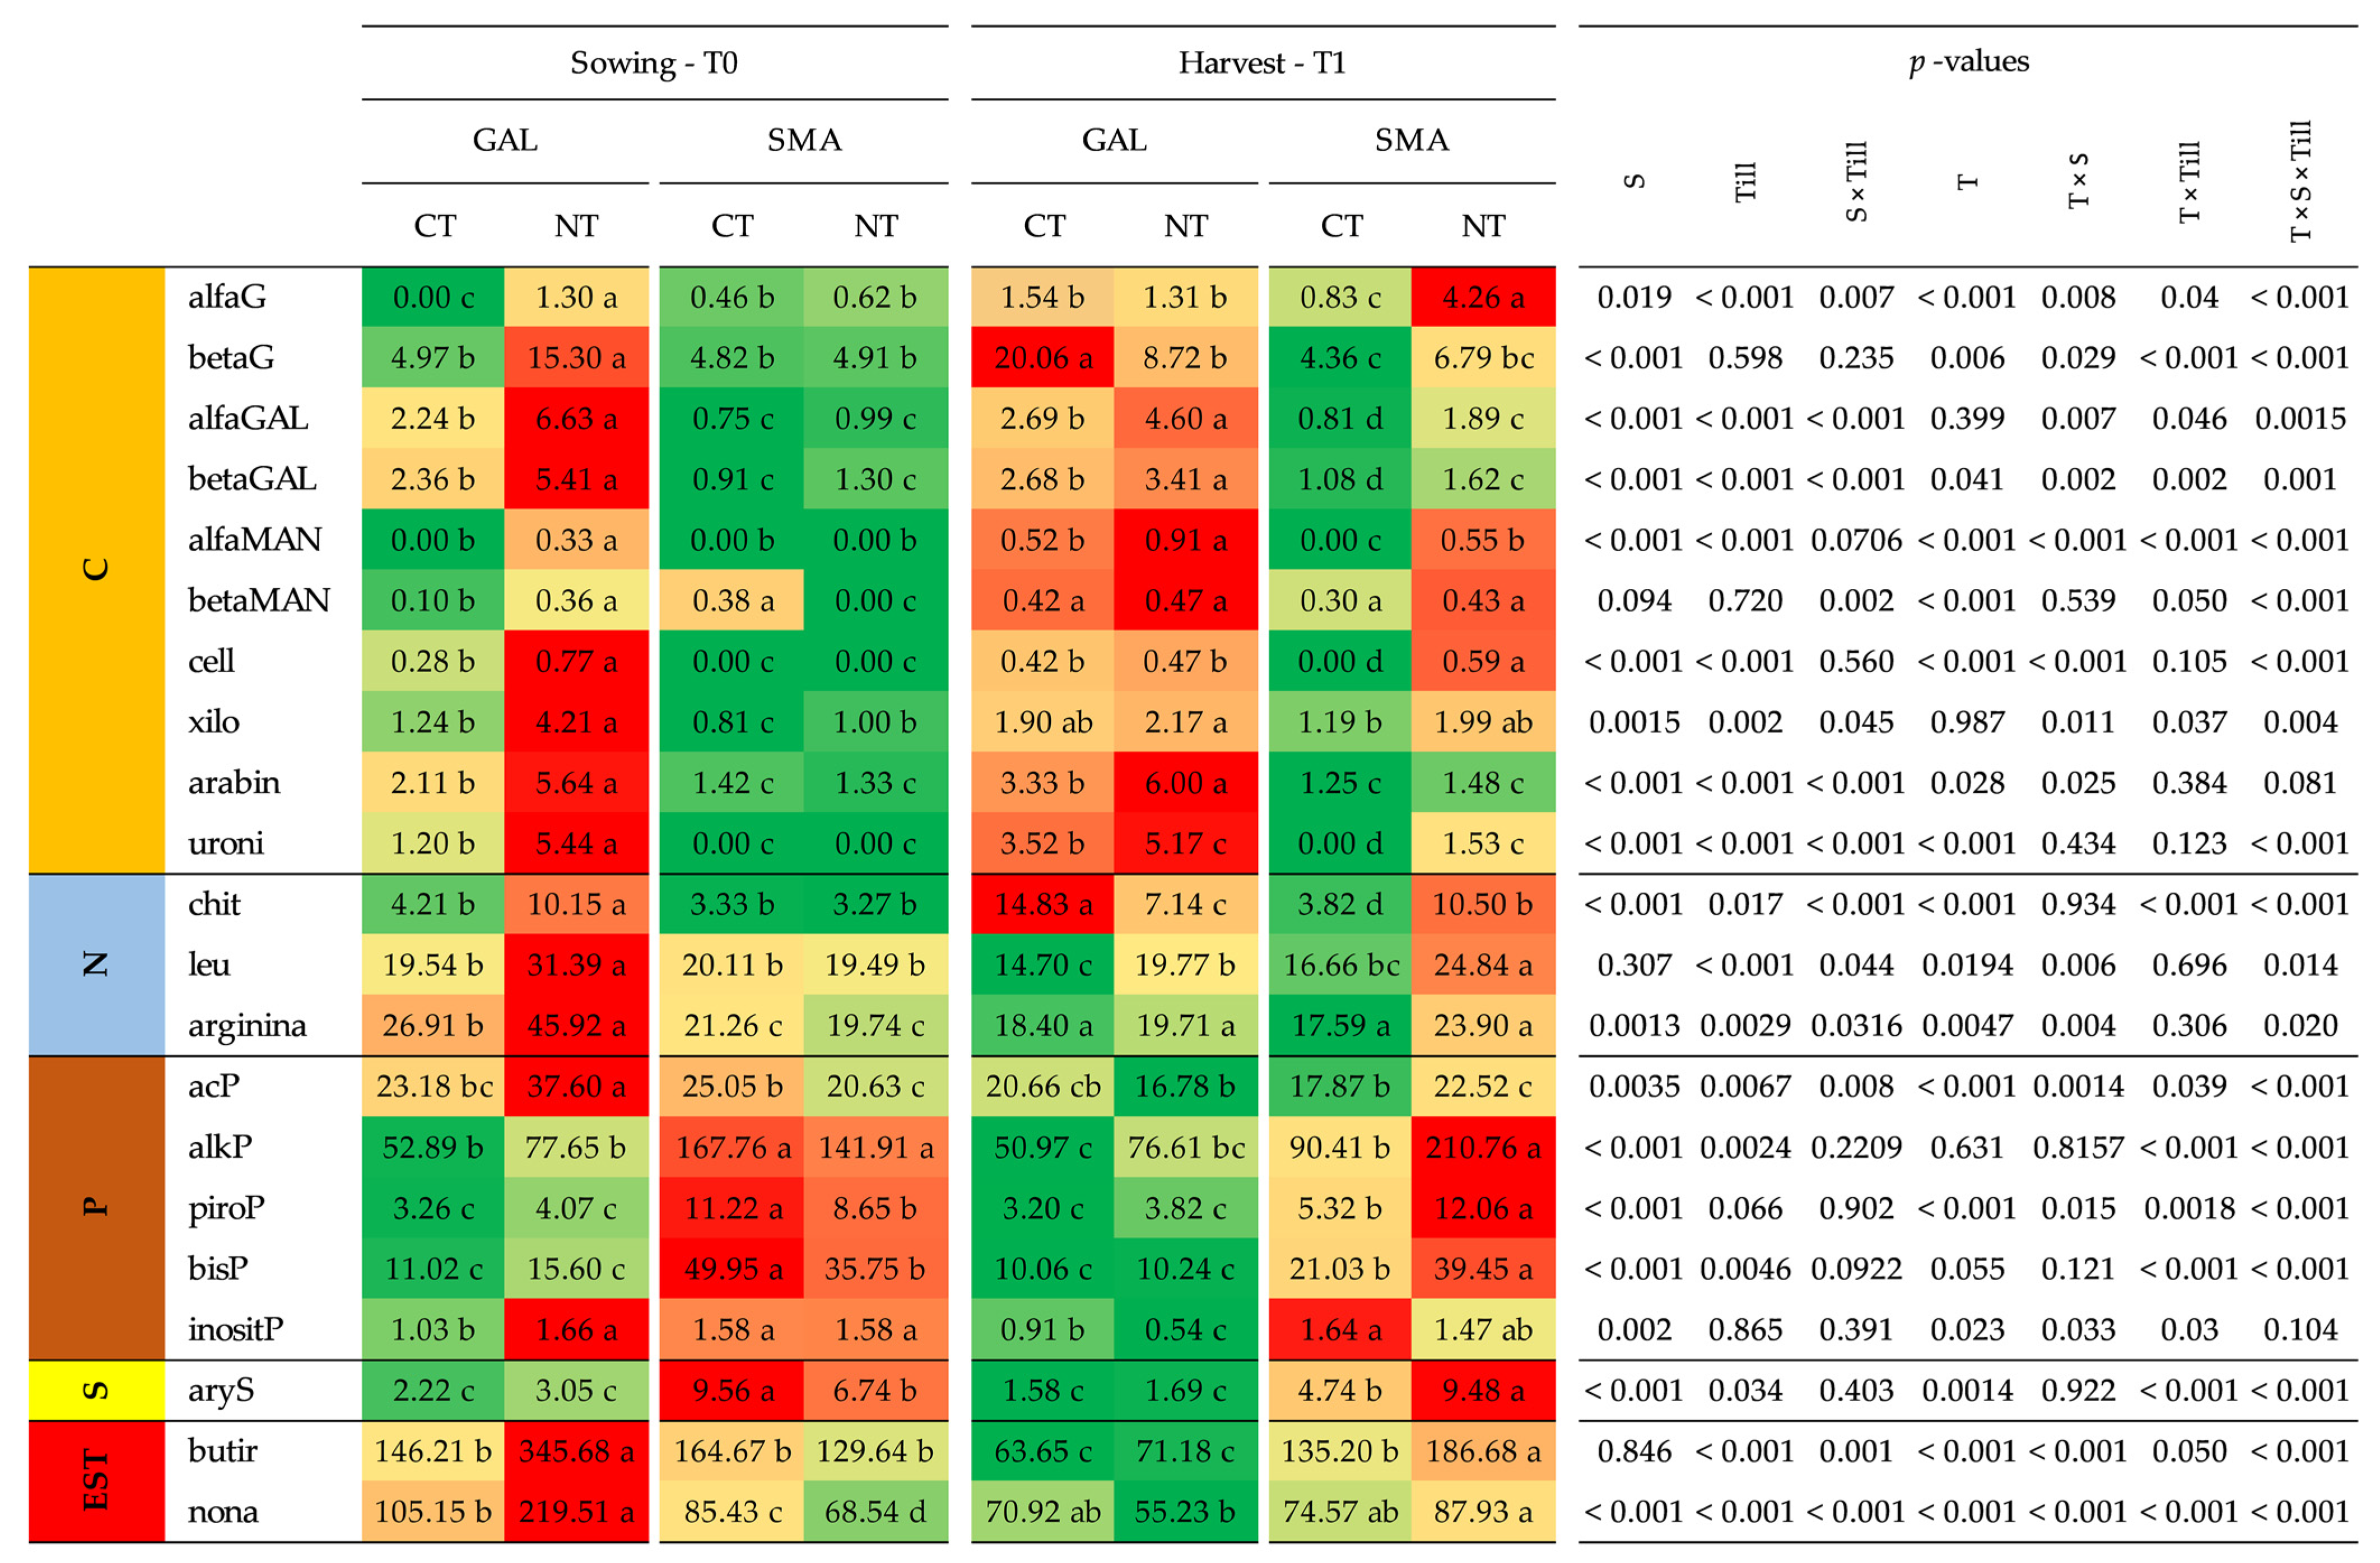
The treatments’ effects on soil enzymatic activity are reported in the heat table in Figure 6.
Generally, except for some of the enzymes involved in the P cycle (alkP, piroP, bisP) and S cycle (aryS), higher enzymatic activity was retrieved in GAL than in SMA soil (Figure 6). Moreover, more pronounced differences between treatments were observed at sowing sampling (T0) than at harvest (T1). The C cycle enzymes, at sowing (T0), in GAL all of them showed greater values under NT, while in SMA only betaMAN (CT > NT) and xilo (NT > CT) showed significant differences between treatments. At harvest (T1), in GAL, on average, greater C enzymes concentrations were observed under NT, than in CT, but with smaller differences between treatments (NT > CT only for alfaGAL, betaGAL, alfaMAN, arabin, uroni; CT > NT for betaG) compared to sowing time (T1); in SMA, the positive effect of NT has arisen at this sampling epoch (harvest, T1) (NT > CT for alfaG, alfaGAL, betaGAL, alfaMAN, cell, uroni) (Figure 6). N acquiring enzymes, at sowing (T0) showed higher values and significant differences among soil management only in GAL (NT > CT); at harvest (T1) in GAL the trend of the different enzymes was not unique (CT > NT for chit and NT > CT for leu) while at SMA both chit and leu were greater in NT than in CT.
As mentioned above, higher P-cycle enzymes values were retrieved in SMA than in GAL (Figure 6). In GAL, at sowing (T0), only acP and inositP were found higher in NT than in CT while, on the contrary, in SMA acP, piroP, and bisP were greater in CT than in NT; at harvest (T1), in GAL, no differences were observed between the treatments with the exception of inosit-P higher in CT than in NT, while in SMA, on the contrary to what was observed in the first sampling period, alkP, piroP, and bisP were higher in NT (Figure 6). The aryS enzyme, also, in this case, higher values were recorded in SMA than in GAL; in particular, no treatments effect was observed in GAL whereas in SMA at sowing (T0) a higher value as observed under CT while at harvest (T1) under NT. Among esterase enzymes, at sowing (T1), in GAL greater values were observed in NT and in SMA only nona had higher values in CT than in NT, while at harvest (T1), the differences among treatments were less evident and only in SMA a significantly appreciable positive difference was observed on butir under NT (Figure 6).

3.5. Principal Component Analysis

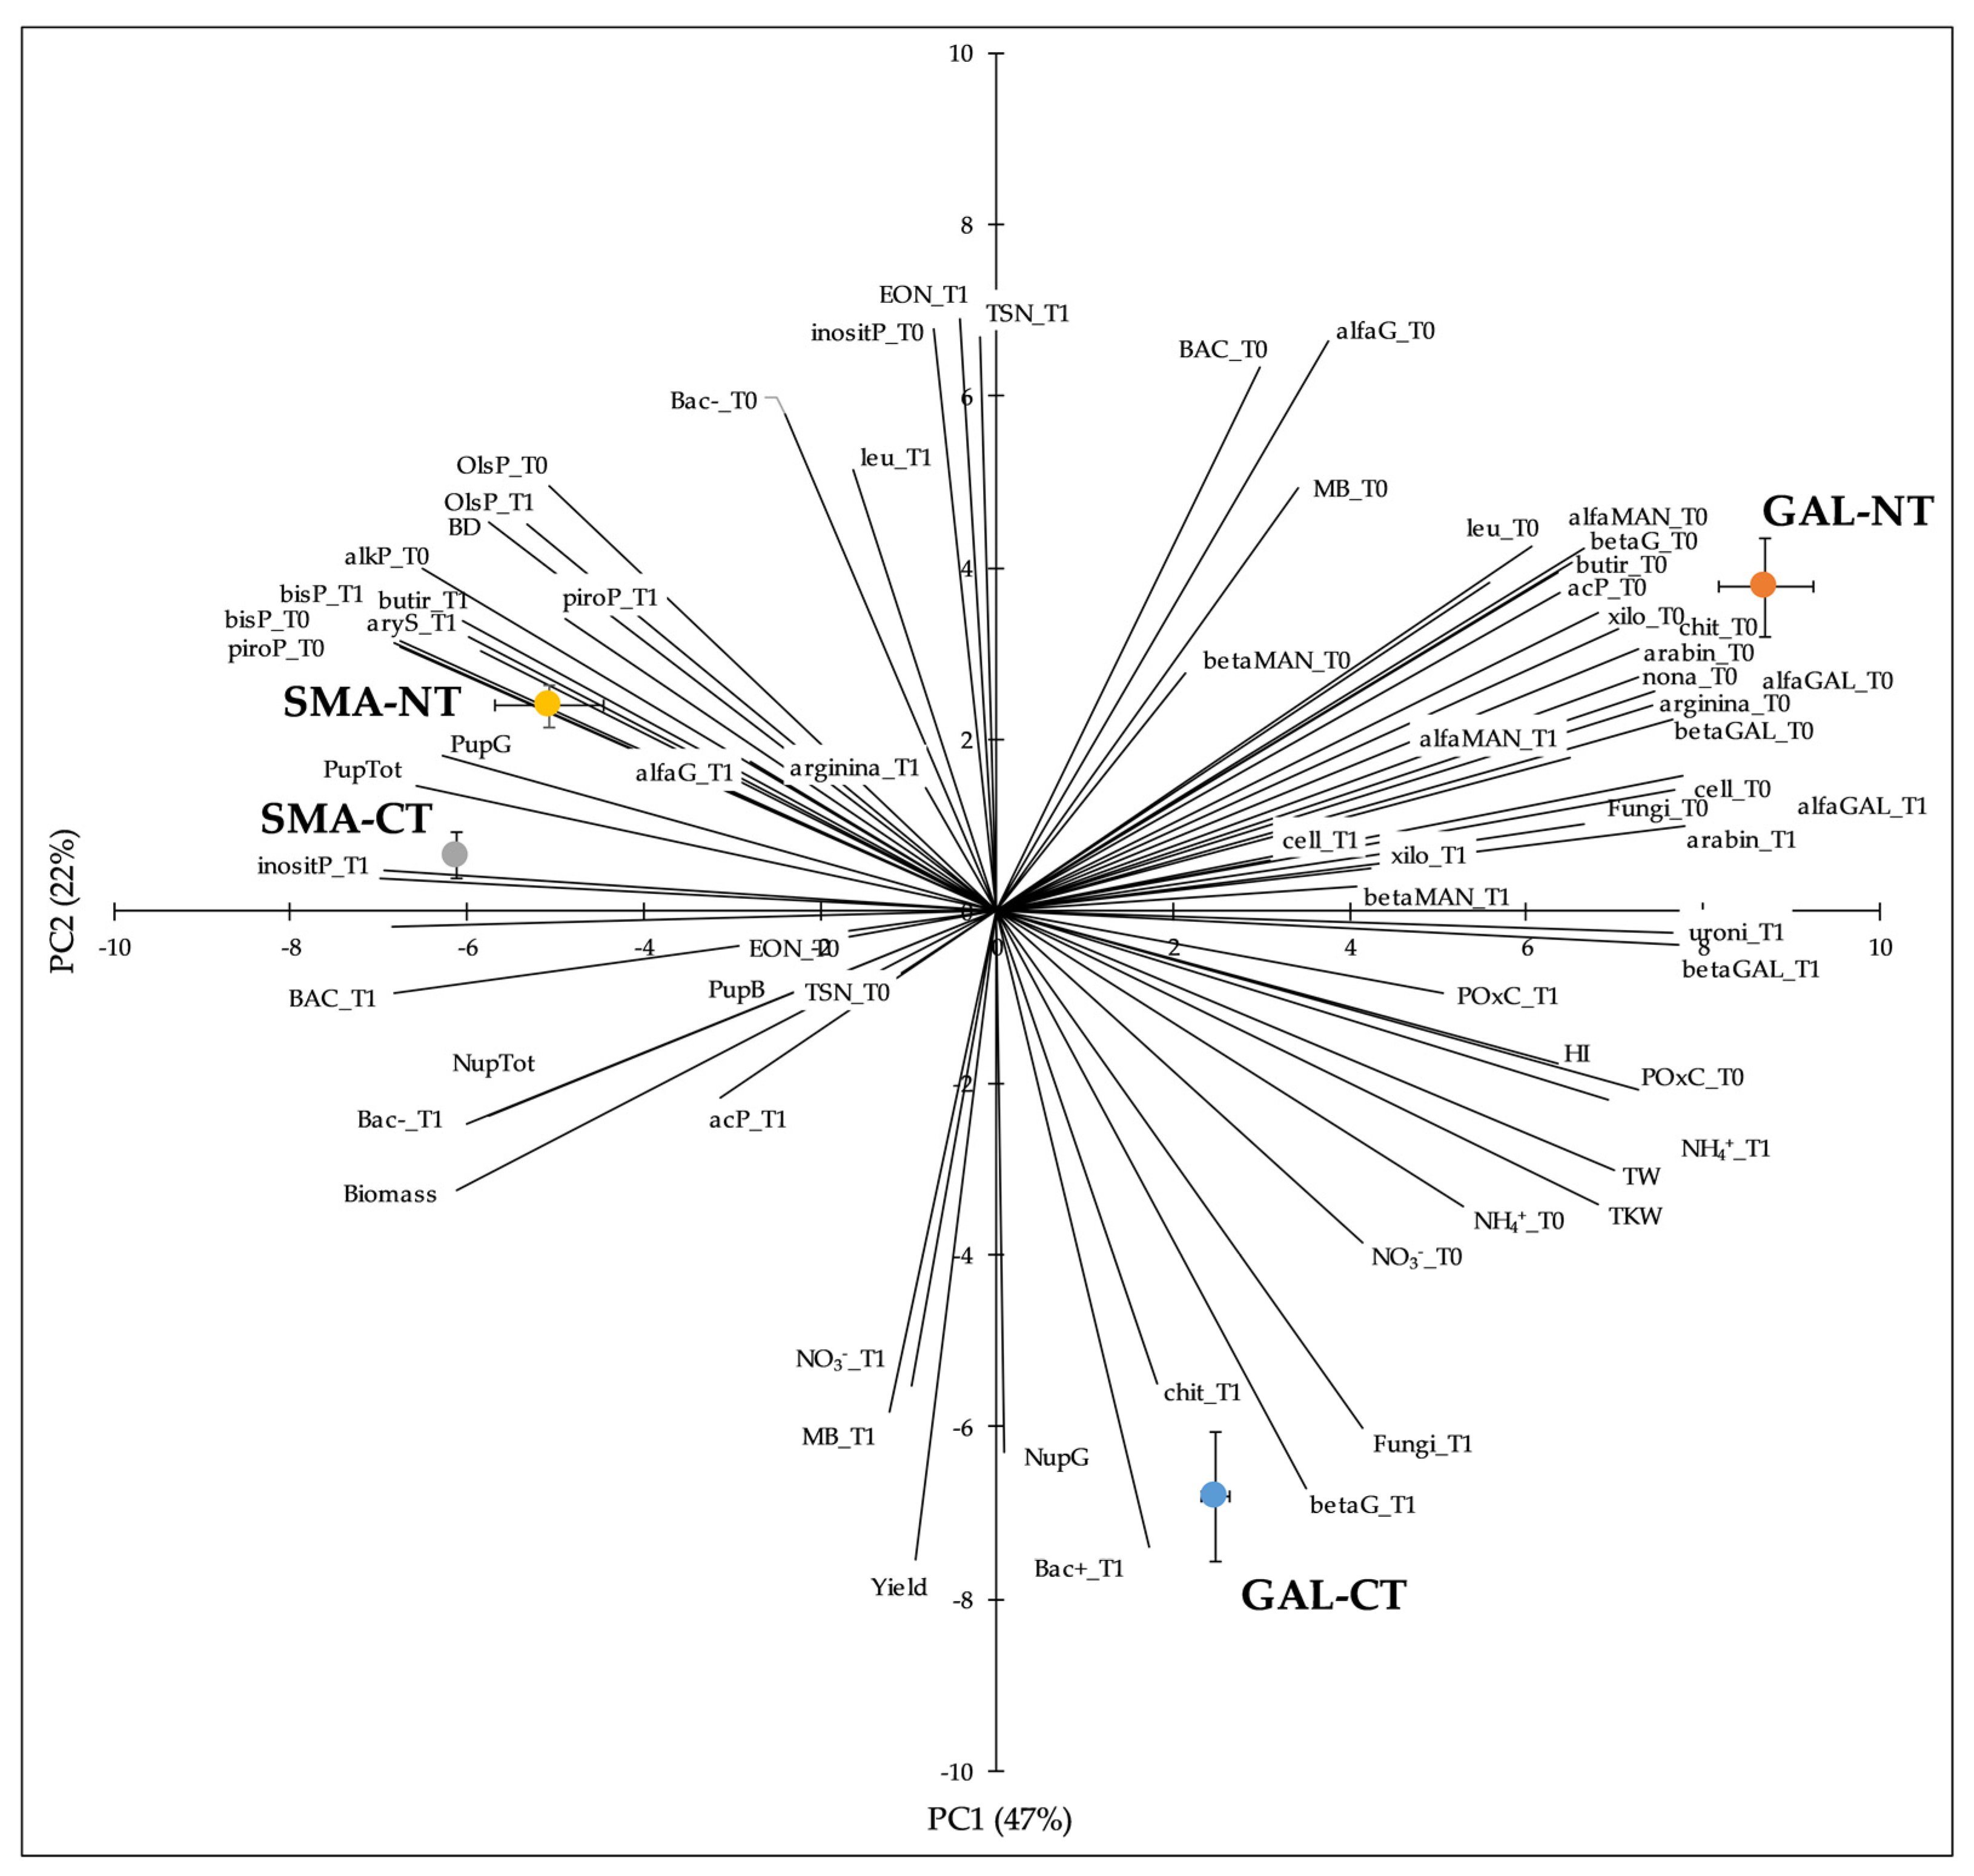
The PCA performed for all the soil × treatments combinations and based on all the experimental data collected, represented by vectors, clearly discriminated among the experimental soils and managements. Mainly, PC1 distinguished the two tillage treatments at the GAL site, whereas PC2 separated the SMA site from GAL one (Figure 7).
PC1 accounted for 47% of the total variance and was defined by plant biomass, BD, OlsP, P uptakes, POxC, TSN and EON at T0, BAC at T1, Bac, fungi at T0, and the majority of soil enzymes. PC2 accounted for 22% of the total variance and was defined by grain yield, N grain uptake, NO3-N at T1, EON and TSN at T1, MB at T0 and T1, BAC at T0, Bac at T0, Bac+ at T1, fungi at T1, and some soil enzymatic activities.

3.6. Pearson’s Correlations Analysis

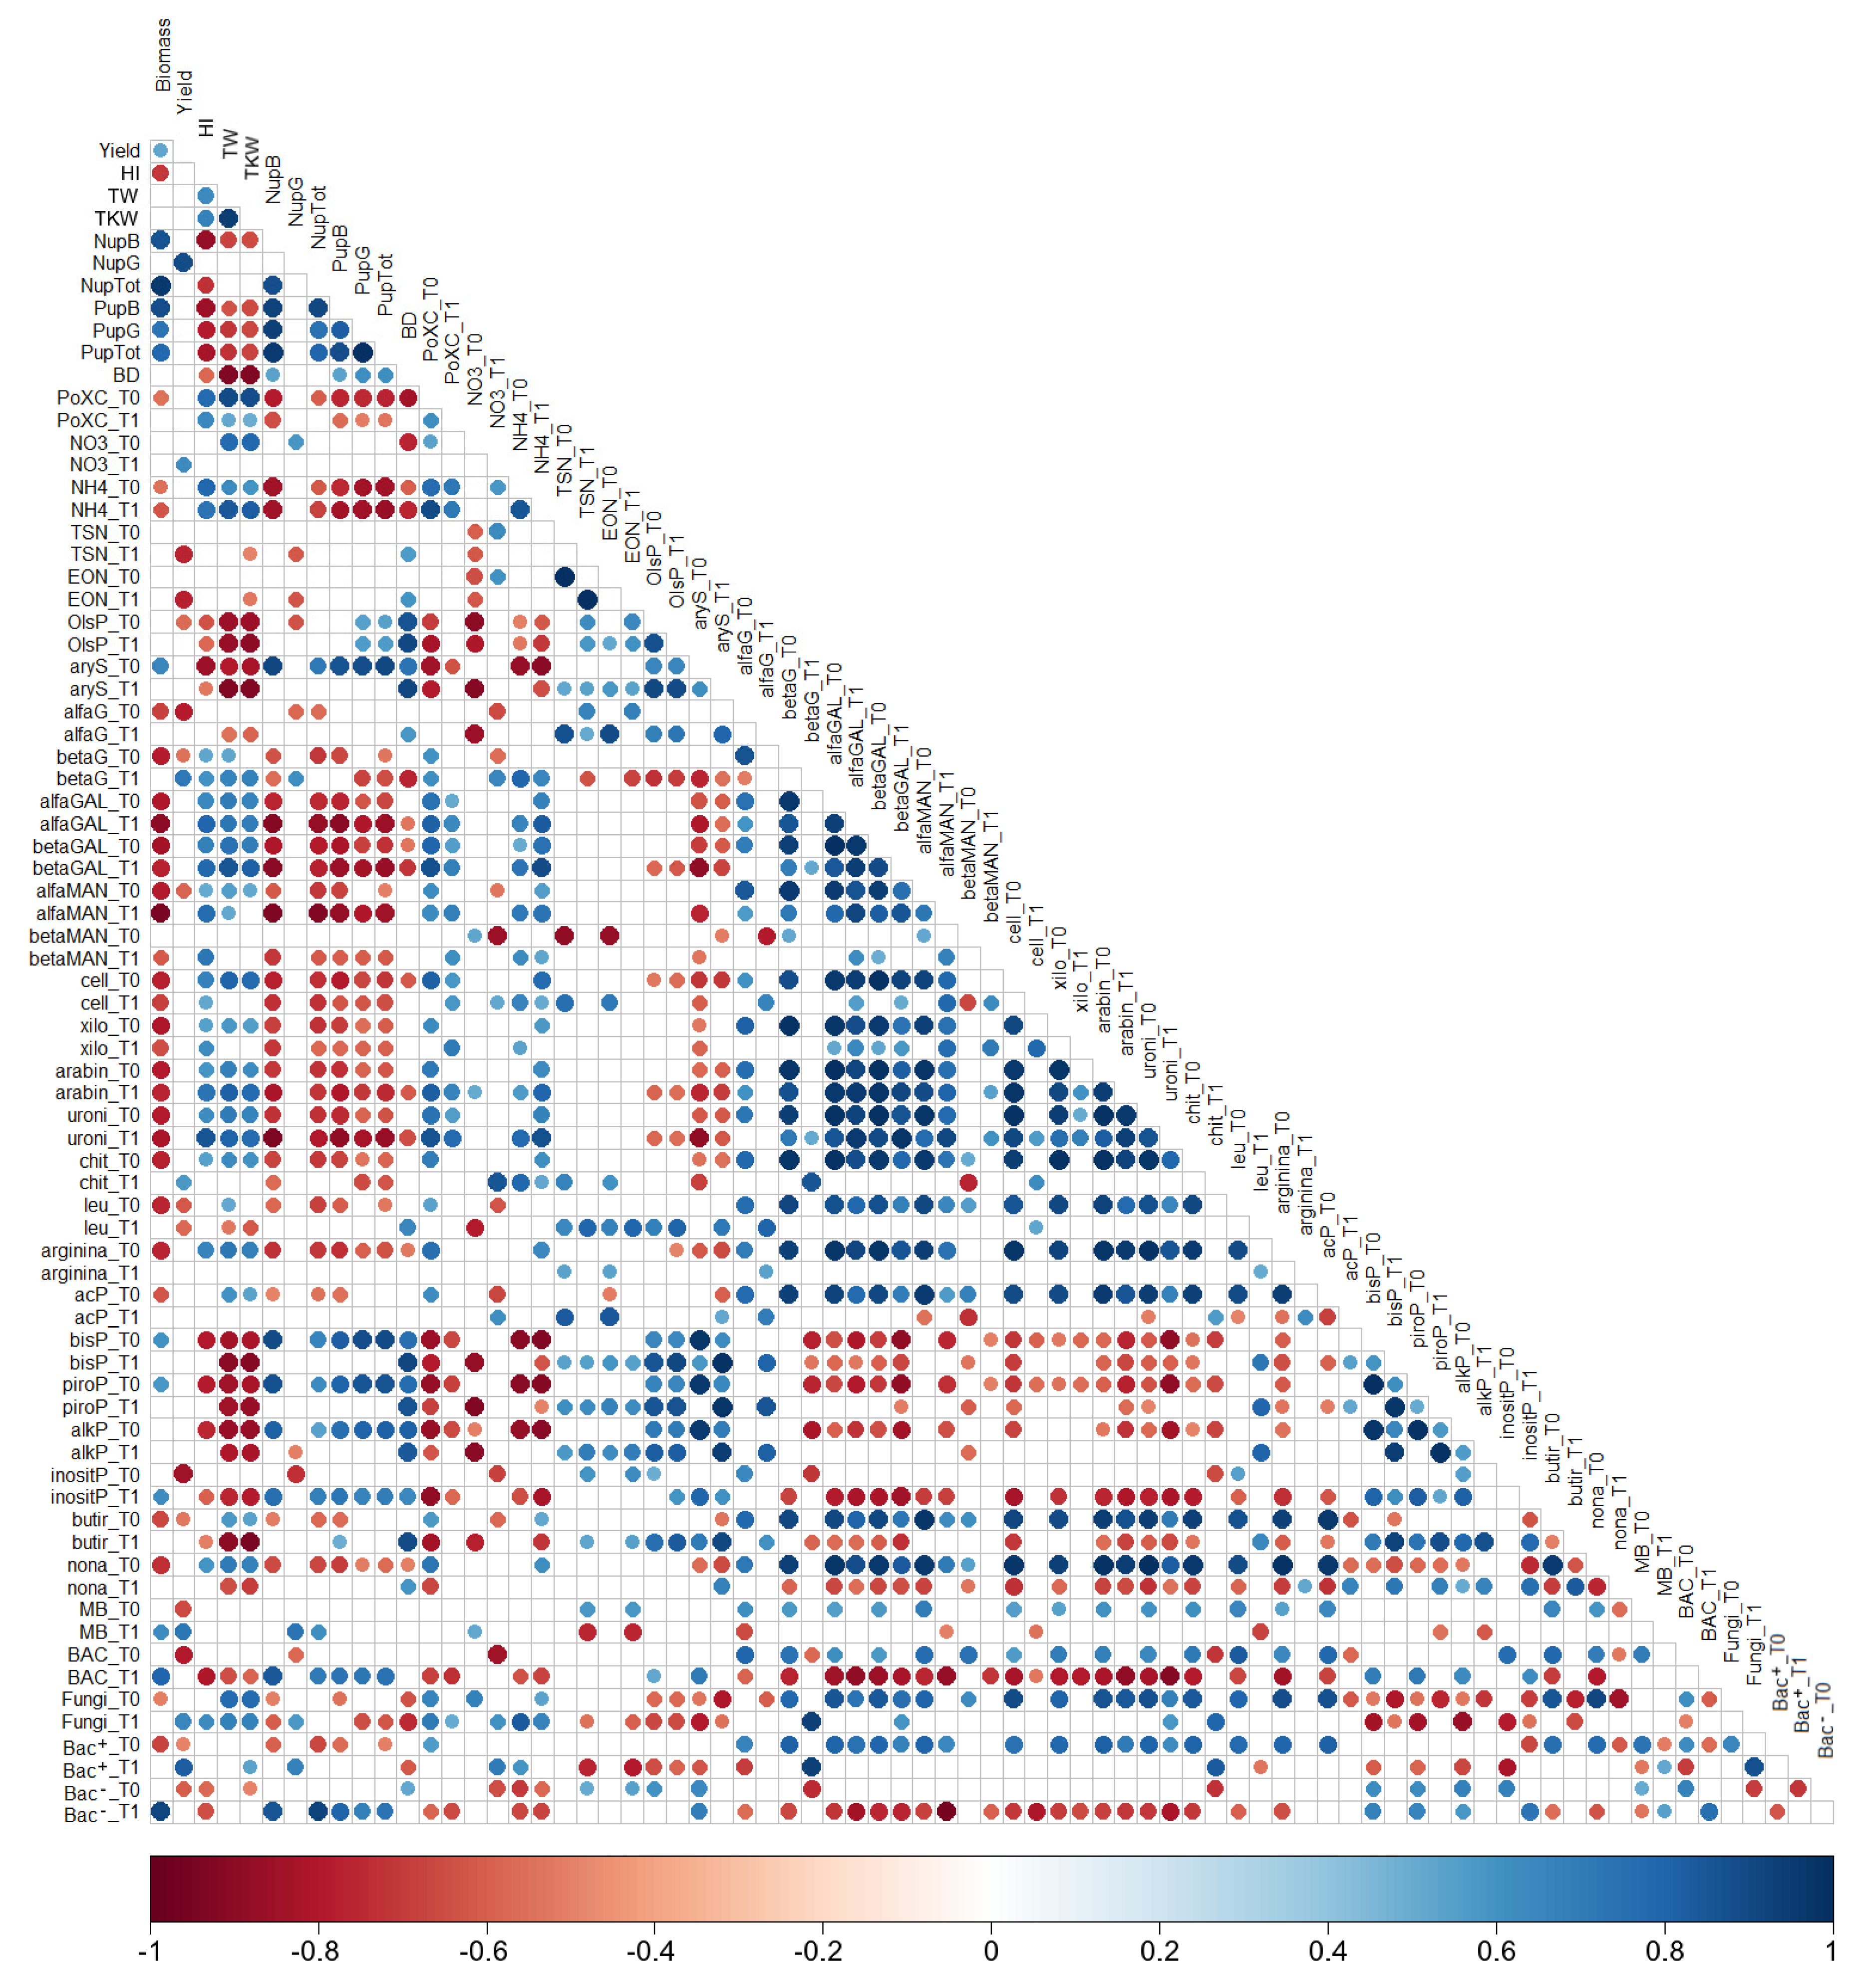
Pearson’s correlation analyses carried out among all the measured variables in order to assess the presents of correlation among them (Figure 8).
Plant biomass was negatively correlated with POxC at T0, NH4+-N at both sampling epochs, fungi, and Bac+ at T0, and several enzymes involved in soil C and N cycle whereas was positively correlated with N and P uptakes (straw and total N uptakes; all P uptakes), MB, BAC, and especially Bac at T1, and some enzymes such as aryS, bisP, and piroP at T0 and inositP at T1. Grain yield was negatively correlated with EON and TSN at T1, OlsP at T0, MB, BAC, Bac+ and Bac at T0, and alfaG, betaG, alfaMAN, leu, inositP at T0; positive correlations were found with N grain uptake, NO3-N, MB, fungi and Bac+, betaG and chit enzymes at T1. With regard to N uptake, positive correlations were retrieved with P uptake, BD, soil NO3-N, MB, BAC, and both Bac+ and Bac at T1, aryS, bisP, piroP, and inositP enzymes, whereas negative correlations were observed with POxC, NH4+-N, TSN, and EON, BAC, and fungi at T0, and most of the enzymes involved in the C and N cycles.
P uptakes were positively correlated with N uptakes, OlsP, BAC, and Bac at T1, bisP, piro P, and alkP at T0, inositP at T1 and aryS enzymes, while negative correlations were retrieved with POxC and NH4+-N soil concentration, fungi, and Bac+, and almost all C and N cycle-involved enzymes. Among soil N pools, mineral N forms were correlated positively with fungi, Bac+, and several C and N cycle enzymes, while consistent negative correlations were found with BAC, Bac, and P-acquiring enzymes; TSN and EON were negatively correlated with MB and Bac+ a T1. The OlsP soil concentrations were positively correlated with the majority of soil P-cycle enzymes and negatively correlated with fungi and Bac+. Finally, with regards to the microbial group, significant positive correlations were observed among C cycle enzymes, fungi, and Bac+ at T0, while on the contrary, negative correlations among the same enzymes were retrieved with BAC and Bac at T1.

3.7. Multiple Linear Regressions

The stepwise MLR models were calculated for yield prediction based on the soil’s physical, chemical and biochemical properties analyzed (Table 4). In particular, three different MLRs were calculated, a global one, that considers the grain yield data from both experimental soils, and another two which consider the two soils individually.
Regressions revealed the different impact of soil variables on wheat yield with high precision as testified by the observed coefficient of determination (R2) greater than 0.98. Total MLR revealed that, in general, the main significant factors that affected wheat grain yield were NH4+-N at T0 and OlsP at T1, MB and Bac at T1, and inositP at T0 and nona at T1, respectively, among soil chemical variables, microbial group and enzymes. Concerning the two soils, MLR for GAL soil highlighted that grain yield was mainly affected by NH4+-N (positively) and by BAC (negatively) at T0, whereas the MLR for SMA showed relationships that were positive with different soil enzymes and negative with NH4+-N and fungi abundance at T0.

4. Discussion

Among the effects on soil properties related to NT use, BD change is one of the most evident and readily observable consequences with significant effects on soil liveability and physico-chemical variables. Indeed, the increase of soil BD in NT systems was reported by several studies related to different environments and soils in the long term [11,60,61] but also in short-term experiments [62]. Between the two experimental sites, a more pronounced effect was observed in SMA soil than in GAL; this soil (GAL, Typic Haploxeralfs), probably due to the higher organic matter (19.3 g C kg−1 vs. 9.81 g C kg−1) and clay (35% vs. 21%) concentration, has evolved a better structure that was less prone to compaction over time, according with that postulated by Keller and Håkansson [63] and Reichert et al. [64]. This evidence allows us to hypothesise a better adaptation of the GAL soil, considering its physical fertility, to the no-tillage technique, with maintenance over time for a better structure and aeration, hence better conditions for the microbial community and plants.
Soil POxC, contrary to what was expected, does not show effects due to the tillage systems, while significant differences were retrieved among soils, with values in line with those previously retrieved by Badagliacca et al. [65] in a survey that covered these same agroecosystems. With this regard, higher values of labile C were observed in GAL, a soil with a higher concentration of organic C, than in SMA characterized by meaningfully lower values.
With regard to soil N pools, the information retrieved from the two samplings allows us to know the soil conditions at sowing, which resulted from the changes that occurred from the end of the preceding crop cycle until planting, and at harvest, that derived from the alterations emerged during the cropping cycle and related to the plant growth.
The monitored N variables suggest a generalized lower decomposition of organic matter in the NT system in GAL before sowing. This evidence agrees with other experiments that retrieved lower mineralization rates in NT compared to CT [11,66,67]. In particular, the different behaviour observed among soils suggests that in GAL its specific characteristic, and precisely its high clay concentration, can protect organic matter from decomposition by promoting the creation of greater soil aggregates that are preserved under NT [68,69] or through absorption by mineral particles [70,71]. On the contrary, in SMA, higher NH4+-N, EON, and TSN under NT indicate a higher release of soluble N forms from organic matter decomposition and thus mineralization, improved also by the greater crop residue concentration in the superficial soil layers that in CT are distributed in a larger volume of soil; in this contest, lower NO3-N could be ascribed to weed absorption (that continue to grow during the autumn season) and microbial immobilization [72,73], as well as, denitrification [62,74] considering the greater susceptibility of this less structured soil to compaction testified also by the higher BD values retrieved. Subsequently, at harvest, at both experimental sites, higher concentrations of EON and TSN were retrieved in NT than in CT, as a result of crop residue decomposition on the first centimetres of topsoil. However, greater EON concentration in the NT system and the specific EON trends in CT, with a depletion observed in GAL and a slight increase retrieved in SMA, have not resulted in an increased NH4+-N. In particular, in GAL, a lower decomposition of crop residues in the NT system determined a delayed increase of EON that was slowly mineralized (but still enough to compensate for the difference in NH4+-N concentration with CT) and nitrified, being unable to copy NO3-N removals from the system (plants and soil microorganisms). On the contrary, in SMA, the higher decomposition of crop residues in the superficial soil layer in NT determined always higher soil EON concentration readily mineralised and nitrified. A lower rate of mineralisation than nitrification might have determined EON accumulation; this behaviour could be ascribed, aside from less removal from the system, to a deficit in soil aeration that slowed mineral N conversion. Conversely, under CT, as mentioned before, the distribution of residues over a larger volume of soil and increased decomposition promptly after tillage (before sowing), favoured by greater aeration and better contact between soil and residues, drove the mineralisation process and determined lower mineral N in the investigated soil layer [68,75,76]. Therefore, between the two tillage systems, CT allowed a constant and continuous soil N availability during the cropping cycle compared to NT. Between the two experimental sites, in GAL, NT does not permit an adequate N availability due to a lower N mineralization while in SMA, although the amount of N in this system was potentially greater, the N release was not continuous and progressive along the cropping cycle to copy system requirements.
The different distribution of residues and their retention on the soil surface, played a significant role in determining the levels of available P. Indeed, our results reveal that NT use induces higher OlsP concentration in the upper soil layer, compared to CT, in accordance with several studies [16,77,78,79].
With regard to soil microbial community, in GAL NT use determined higher values than CT at sowing with a subsequent decrease of all microbial groups during the cropping season; conversely in SMA, CT maintained the microbial community structure from sowing to harvesting, while NT caused a decrease of the microbial biomass and, in particular, of Bac. Therefore, data of microbial biomass and main microbial groups suggest that at sowing in GAL the undisturbed condition, coupled with an adequate N supply and a generally more fertile condition of this soil, favoured the microbial growth, without distinction between microbial groups as postulated by Cookson et al. [80] and observed by Gil et al. [81], García-Orenes et al. [82] and Stevenson et al. [83]. On the contrary in SMA, soil conditions, like lower organic matter compared to GAL and coarse texture, resulted in a similar growth of the microbial community up to the time of sampling at planting although, as argued above, that could be possible due to a greater immobilisation in NT (as suggested by the lower level of NO3-N) in order to decompose the organic C, according to several authors [84,85,86]. The lower microbial biomass observed under NT at harvest, regardless of the experimental site, may be linked to a general lack of substrates for microbial growth while the selective increase of fungi and Bac+ under CT can be related to a specific substrate availability useful to sustain their activity. In the same way, data showed a generalized reduction of microbial population in SMA, and in particular of Bac, which can be attributed to a similar cause (substrate availability). Considering that Bac had a relative copiotrophic behaviour, with high growth rates and fast turnover, preferring plant-derived and labile C compared to Bac+ and fungi, which show oligotrophic metabolism using more recalcitrant organic and stable C compounds [87,88,89]. Our results suggest a shift in soil microbial community from Bac to Bac+ and fungi along the cropping cycle in CT systems, with a more pronounced effect observed in GAL and with a slight effect observed in SMA. In particular, this effect may be derived from two different concomitant and opposite conditions: a) the consumption of labile C source preferred from Bac and b) the relative abundance increase of more complex organic C substrates used by Bac+ and fungi. As postulated by Kramer and Gleixner [87], taking into account that these two microbial groups depend from different substrates, changes in their relative abundance could suggest variations or limitations in C substrates in the soil. Despite the short time span of application of treatments, in both soils, a positive effect of NT application (especially at harvest) was observed on soil enzyme activity in accordance with the experience of other studies (i.e.,: López-Garrido et al. [90]; Zhang et al. [91]; Sekaran et al. [8], and clearly demonstrated from PCA, as a result of crop residue superficial distribution and the increased labile pools availability. Therefore, our study confirms the positive effect of NT use on soil enzyme activities under Mediterranean conditions. Taking into account the lower microbial biomass observed in NT systems, in particular at harvest, the increased enzyme activity in this soil could be promoted by the need for soil micro-organisms to cover nutrients requirements according to the resource demands stoichiometric control [92,93]. In particular, under the NT system, the increase of soil enzymes in GAL could be ascribed to the generalized reduction of microbial groups (with a higher effect) while in SMA this effect can be more specifically linked to a Bac C starvation condition (as revealed by Pearson’s correlation); in fact, this type of bacteria is characterised by high N demands, labile C reliance and higher enzyme production. In particular, soil N cycling enzymatic activity under NT was particularly intense and correlated with mineral N, in GAL, and EON availability, in SMA, indicating also greater protection of extractable organic matter in clay-loam soil (GAL) according to Alluvione et al. [94], Six and Paustian [95] and Han et al. [96]. On the contrary, in CT, and especially in GAL, the greater abundance of fungi and Bac+ at harvest may be linked to the increase of enzymes involved in C (β-glucosidase) and N cycle (chitinase) to decompose complex organic compounds [96,97,98,99] following the results achieved from Pearson’s correlation analysis and PCA. Further, it is evident that in GAL the increase in Bac+ oligotrophic population is correlated with an increase in the consumption of EON, which was poorly available because protected by soil, associated with a higher enzymatic activity [89,100]. The higher protection of more complex organic compounds by the soil could be an additional cause of the increase in these types of microorganisms at the end of the crop cycle [101].
Our results highlighted the important role that soil properties have on soil enzyme activity. Soil organic C physical protection mechanisms determined higher enzyme concentration in fine texture and higher organic matter soil of GAL according to Lagomarsino et al. [102] and Xu et al. [103]. Our experiment revealed that NT uses increased enzymes involved in the P cycle, according to other experiments [8,99], with a positive correlation with soil OlsP (in particular for bisP and alkP that operates sequentially). In addition, a positive effect of NT application was retrieved on both investigated soil esterases, as a consequence of higher residue decomposition activity.
The effects derived from NT on soil properties and specific conditions along the cropping cycle, in terms of available N and P, microbial community and enzyme activity, then had consequences on the productivity and the uptakes of N and P from the soil by wheat. In particular, our results are consistent with other studies (i.e., Lal et al., [104]; López-Garrido et al., [90]) confirming the reduction of wheat productivity in the first years of NT application especially when no N fertilization was provided (i.e., Ruisi et al., [19]) as in the case of the present experiment. In particular, the yield differences retrieved among treatments and experimental sites comply with the N and P availability as well as soil microbial community trends. Although a similar tendency between tillage systems was retrieved on grain yield and N and P uptakes, among soils, the difference between tillages was significantly influenced by the interaction with the site-specific soil properties. In GAL, the higher mineral N concentration under CT leads to maximize yield and N uptake while the reduced accessibility of available N during plant growth, proven by the lower NO3-N and from the contraction of soil microbial community, determined a considerably lower yield of about 1.1 t ha−1 (3.3 t ha−1 in terms of plant biomass) under NT. Conversely, in SMA, the minor differences in N supply during the crop cycle, with higher NO3-N soil concentration in NT and small differences among microbial community structure and enzyme activity, determined a reduced yield difference among CT and NT (−0.2 t ha−1). These differences were highlighted by the PCA and the two different MLRs calculated. Therefore, what has been observed regarding yields directly finds confirmation with what has been said above regarding crop residue fate and the dynamics of organic matter mineralisation in the two soils, slower in GAL and faster in SMA. Even so, it is important to point out that higher total biomass and grain yields observed in CT than in NT can be ascribed to several improved conditions related to porosity and aeration, ability to warm up, reduced weed growth in the first growing stages [6,35,105,106] which, in addition to the increased mineralisation of organic matter, resulted in better plant growth. With this regard, in SMA characterized by soil with a lower total available water, higher plant growth in CT could have determined a greater water demand by decreasing the water reserve, compared to NT, causing a lower yield observed in this site compared to GAL. Grain N concentration does not show significant differences among treatments and soils as a result of the inverse correlation between yield and N concentration [107,108]. The different availability of P in the two soils and systems, on the other hand, does not seem to have affected wheat productivity, likely due to the equally high activity of enzymes related to the P cycle in the two tillage systems that resulted in a satisfactory supply of this element for the crop.

5. Conclusions

Overall, the results of the present research showed that the NT application can determine a reduced release of labile N and C forms into the soil, as a result of lower crop residue mineralization, affecting wheat productivity and the microbial community. Under the NT system, along the cropping cycle, the soil microbial community reduced its dimension and mutated to copy substrate availability highlighting also an increased enzyme activity. Moreover, the present research shows that the effects, and related dynamics, of NT use depended on the type of soil in which this technique was applied, in particular, with more significant effects on clay-loam soil than on sandy-clay-loam soil, as a result of greater physico-chemical protection from the soil mineral particles over the organic pools.
Although NT use shows early positive effects, fertilisation is of paramount importance to support the conversion to this system in the first year of application in order to overcome possible emerging negative setbacks. With this regard, under NT use, localised and split organic fertilisation could play a very important role in supporting the crop and the soil microbial community (especially on fine-textured soils), even better than chemical fertilisers, by releasing soluble and readily-mineralisable forms of C and N. Further study will be addressed on this topic in medium and long-term experiments to consolidate the observed results.

Author Contributions

Conceptualization, G.B., E.L.P., M.M. and G.P.; formal analysis, G.B., E.L.P., A.F., F.F., V.A.L. and G.P.; investigation, G.B., E.L.P., A.F., F.F. and G.P.; resources, M.M. and V.A.L.; writing—original draft preparation, G.B.; writing—review and editing, G.B., M.M., V.A.L., A.F., F.F. and G.P.; supervision, M.M. and G.P. All authors have read and agreed to the published version of the manuscript.

Funding

The research activity of Giuseppe Badagliacca was partially funded by the project “PON Research and Innovation 2014–2020—European Social Fund, Action I.2 Attraction and International Mobility of Researchers—AIM-1832342-1”.

Institutional Review Board Statement

Not applicable.

Informed Consent Statement

Not applicable.

Acknowledgments

We thank V. Barreca, F. Cogliandro, S. Montilla, and G. Turano for their technical support for the management of the field experiment and M. Romeo for technical advice and support during samplings and analysis. The authors thank the Regional (Regione Calabria) Agency for Agriculture of Calabria “ARSAC” for providing technical assistance and support for the SMA field experiment.

Conflicts of Interest

The authors declare no conflict of interest.

References

  1. Pittelkow, C.M.; Linquist, B.A.; Lundy, M.E.; Liang, X.; van Groenigen, K.J.; Lee, J.; van Gestel, N.; Six, J.; Venterea, R.T.; van Kessel, C. When does no-till yield more? A global meta-analysis. Field Crops Res. 2015, 183, 156–168. [Google Scholar] [CrossRef] [Green Version]
  2. Paustian, K.; Lehmann, J.; Ogle, S.; Reay, D.; Robertson, G.P.; Smith, P. Climate-smart soils. Nature 2016, 532, 49–57. [Google Scholar] [CrossRef] [PubMed] [Green Version]
  3. Jordan, V.W.L.; Leake, A.R.; Ogilvy, S. Agronomic and environmental implications of soil management practices in integrated farming systems. Asp. Appl. Biol. 2000, 62, 61–66. [Google Scholar]
  4. Madari, B.; Machado, P.L.O.A.; Torres, E.; de Andrade, A.G.; Valencia, L.I.O. No tillage and crop rotation effects on soil aggregation and organic carbon in a Rhodic Ferralsol from southern Brazil. Soil Tillage Res. 2005, 80, 185–200. [Google Scholar] [CrossRef]
  5. Badagliacca, G.; Petrovičovà, B.; Pathan, S.I.; Roccotelli, A.; Romeo, M.; Monti, M.; Gelsomino, A. Use of solid anaerobic digestate and no-tillage practice for restoring the fertility status of two Mediterranean orchard soils with contrasting properties. Agric. Ecosyst. Environ. 2020, 300, 107010. [Google Scholar] [CrossRef]
  6. Shen, Y.; McLaughlin, N.; Zhang, X.; Xu, M.; Liang, A. Effect of tillage and crop residue on soil temperature following planting for a Black soil in Northeast China. Sci. Rep. 2018, 8, 4500. [Google Scholar] [CrossRef] [Green Version]
  7. Skaalsveen, K.; Ingram, J.; Clarke, L.E. The effect of no-till farming on the soil functions of water purification and retention in north-western Europe: A literature review. Soil Tillage Res. 2019, 189, 98–109. [Google Scholar] [CrossRef]
  8. Sekaran, U.; Sagar, K.L.; Denardin, L.G.D.O.; Singh, J.; Singh, N.; Abagandura, G.O.; Kumar, S.; Farmaha, B.S.; Bly, A.; Martins, A.P. Responses of soil biochemical properties and microbial community structure to short and long-term no-till systems. Eur. J. Soil Sci. 2020, 71, 1018–1033. [Google Scholar] [CrossRef]
  9. West, T.O.; Marland, G. A synthesis of carbon sequestration, carbon emissions, and net carbon flux in agriculture: Comparing tillage practices in the United States. Agric. Ecosyst. Environ. 2002, 91, 217–232. [Google Scholar] [CrossRef]
  10. Crotty, F.V.; Fychan, R.; Sanderson, R.; Rhymes, J.R.; Bourdin, F.; Scullion, J.; Marley, C.L. Understanding the legacy effect of previous forage crop and tillage management on soil biology, after conversion to an arable crop rotation. Soil Biol. Biochem. 2016, 103, 241–252. [Google Scholar] [CrossRef] [Green Version]
  11. Badagliacca, G.; Benítez, E.; Amato, G.; Badalucco, L.; Giambalvo, D.; Laudicina, V.A.; Ruisi, P. Long-term effects of contrasting tillage on soil organic carbon, nitrous oxide and ammonia emissions in a Mediterranean Vertisol under different crop sequences. Sci. Total Environ. 2018, 619–620, 18–27. [Google Scholar] [CrossRef]
  12. Kirkegaard, J. A review of trends in wheat yield responses to conservation cropping in Australia. Aust. J. Exp. Agric. 1995, 35, 835. [Google Scholar] [CrossRef]
  13. Kassam, A.; Friedrich, T.; Derpsch, R.; Lahmar, R.; Mrabet, R.; Basch, G.; González-Sánchez, E.J.; Serraj, R. Conservation agriculture in the dry Mediterranean climate. Field Crops Res. 2012, 132, 7–17. [Google Scholar] [CrossRef] [Green Version]
  14. Minasny, B.; Malone, B.P.; McBratney, A.B.; Angers, D.A.; Arrouays, D.; Chambers, A.; Chaplot, V.; Chen, Z.-S.S.; Cheng, K.; Das, B.S.; et al. Soil carbon 4 per mille. Geoderma 2017, 292, 59–86. [Google Scholar] [CrossRef]
  15. Escolano, J.J.; Pedreño, J.N.; Lucas, I.G.; Almendro Candel, M.B.; Zorpas, A.A. Decreased organic carbon associated with land management in Mediterranean environments. In Soil Management and Climate Change; Academic Press: Cambridge, MA, USA, 2018; pp. 1–13. [Google Scholar]
  16. Boselli, R.; Fiorini, A.; Santelli, S.; Ardenti, F.; Capra, F.; Maris, S.C.; Tabaglio, V. Cover crops during transition to no-till maintain yield and enhance soil fertility in intensive agro-ecosystems. Field Crops Res. 2020, 255, 107871. [Google Scholar] [CrossRef]
  17. Johnston, A.E.; Poulton, P.R. The importance of long-term experiments in agriculture: Their management to ensure continued crop production and soil fertility; the Rothamsted experience. Eur. J. Soil Sci. 2018, 69, 113–125. [Google Scholar] [CrossRef] [Green Version]
  18. Mbuthia, L.W.; Acosta-Martínez, V.; DeBruyn, J.; Schaeffer, S.; Tyler, D.; Odoi, E.; Mpheshea, M.; Walker, F.; Eash, N. Long term tillage, cover crop, and fertilization effects on microbial community structure, activity: Implications for soil quality. Soil Biol. Biochem. 2015, 89, 24–34. [Google Scholar] [CrossRef]
  19. Ruisi, P.; Giambalvo, D.; Saia, S.; Di Miceli, G.; Frenda, A.S.; Plaia, A.; Amato, G. Conservation tillage in a semiarid Mediterranean environment: Results of 20 years of research. Ital. J. Agron. 2014, 9, 1. [Google Scholar] [CrossRef] [Green Version]
  20. Schlegel, A.J.; Assefa, Y.; Haag, L.A.; Thompson, C.R.; Stone, L.R. Long-term tillage on yield and water use of grain sorghum and winter wheat. Agron. J. 2018, 110, 269–280. [Google Scholar] [CrossRef] [Green Version]
  21. Peng, Z.; Wang, L.; Xie, J.; Li, L.; Coulter, J.A.; Zhang, R.; Luo, Z.; Cai, L.; Carberry, P.; Whitbread, A. Conservation tillage increases yield and precipitation use efficiency of wheat on the semi-arid Loess Plateau of China. Agric. Water Manag. 2020, 231, 106024. [Google Scholar] [CrossRef]
  22. Ernst, O.R.; Dogliotti, S.; Cadenazzi, M.; Kemanian, A.R. Shifting crop-pasture rotations to no-till annual cropping reduces soil quality and wheat yield. Field Crops Res. 2018, 217, 180–187. [Google Scholar] [CrossRef]
  23. Woźniak, A.; Rachoń, L. Effect of tillage systems on the yield and quality of winter wheat grain and soil properties. Agriculture 2020, 10, 405. [Google Scholar] [CrossRef]
  24. Chen, S.; Yang, P.; Zhang, Y.; Dong, W.; Hu, C.; Oenema, O. Responses of cereal yields and soil carbon sequestration to four long-term tillage practices in the North China plain. Agronomy 2022, 12, 176. [Google Scholar] [CrossRef]
  25. Woźniak, A. The effect of tillage systems on yield and quality of durum wheat cultivars. Turk. J. Agric. For. 2013, 37, 133–138. [Google Scholar] [CrossRef]
  26. Kan, Z.R.; Liu, Q.Y.; He, C.; Jing, Z.H.; Virk, A.L.; Qi, J.Y.; Zhao, X.; Zhang, H.L. Responses of grain yield and water use efficiency of winter wheat to tillage in the North China Plain. Field Crops Res. 2020, 249, 107760. [Google Scholar] [CrossRef]
  27. López-Bellido, L.; Fuentes, M.; Castillo, J.E.; López-Garrido, F.J.; Fernández, E.J. Long-term tillage, crop rotation, and nitrogen fertilizer effects on wheat yield under rainfed Mediterranean conditions. Agron. J. 1996, 88, 783–791. [Google Scholar] [CrossRef]
  28. Amato, G.; Ruisi, P.; Frenda, A.S.; Di Miceli, G.; Saia, S.; Plaia, A.; Giambalvo, D. Long-term tillage and crop sequence effects on wheat grain yield and quality. Agron. J. 2013, 105, 1317–1327. [Google Scholar] [CrossRef]
  29. Six, J.; Ogle, S.M.; Jay Breidt, F.; Conant, R.T.; Mosier, A.R.; Paustian, K. The potential to mitigate global warming with no-tillage management is only realized when practised in the long term. Glob. Chang. Biol. 2004, 10, 155–160. [Google Scholar] [CrossRef] [Green Version]
  30. Helgason, B.L.; Walley, F.L.; Germida, J.J. Long-term no-till management affects microbial biomass but not community composition in Canadian prairie agroecosytems. Soil Biol. Biochem. 2010, 42, 2192–2202. [Google Scholar] [CrossRef]
  31. González-Sánchez, E.J.; Ordóñez-Fernández, R.; Carbonell-Bojollo, R.; Veroz-González, O.; Gil-Ribes, J.A. Meta-analysis on atmospheric carbon capture in Spain through the use of conservation agriculture. Soil Tillage Res. 2012, 122, 52–60. [Google Scholar] [CrossRef]
  32. Adetunji, A.T.; Lewu, F.B.; Mulidzi, R.; Ncube, B. The biological activities of β-glucosidase, phosphatase and urease as soil quality indicators: A review. J. Soil Sci. Plant Nutr. 2017, 17, 794–807. [Google Scholar] [CrossRef]
  33. Zuber, S.M.; Villamil, M.B. Soil Biology & Biochemistry Meta-analysis approach to assess effect of tillage on microbial biomass and enzyme activities. Soil Biol. Biochem. 2016, 97, 176–187. [Google Scholar]
  34. Stagnari, F.; Perpetuini, G.; Tofalo, R.; Campanelli, G.; Leteo, F.; Della Vella, U.; Schirone, M.; Suzzi, G.; Pisante, M. Long-term impact of farm management and crops on soil microorganisms assessed by combined DGGE and PLFA analyses. Front. Microbiol. 2014, 5, 644. [Google Scholar] [CrossRef] [Green Version]
  35. Giambalvo, D.; Amato, G.; Badagliacca, G.; Ingraffia, R.; Di Miceli, G.; Frenda, A.S.; Plaia, A.; Venezia, G.; Ruisi, P. Switching from conventional tillage to no-tillage: Soil N availability, N uptake, 15 N fertilizer recovery, and grain yield of durum wheat. Field Crops Res. 2018, 218, 171–181. [Google Scholar] [CrossRef]
  36. Melero, S.; López-Bellido, R.J.; López-Bellido, L.; Muñoz-Romero, V.; Moreno, F.; Murillo, J.M. Long-term effect of tillage, rotation and nitrogen fertiliser on soil quality in a Mediterranean Vertisol. Soil Tillage Res. 2011, 114, 97–107. [Google Scholar] [CrossRef]
  37. López-Bellido, L.; Muñoz-Romero, V.; Benítez-Vega, J.; Fernández-García, P.; Redondo, R.; López-Bellido, R.J. Wheat response to nitrogen splitting applied to a Vertisols in different tillage systems and cropping rotations under typical Mediterranean climatic conditions. Eur. J. Agron. 2012, 43, 24–32. [Google Scholar] [CrossRef]
  38. Badagliacca, G.; Laudicina, V.A.; Amato, G.; Badalucco, L.; Frenda, A.S.; Giambalvo, D.; Ingraffia, R.; Plaia, A.; Ruisi, P. Long-term effects of contrasting tillage systems on soil C and N pools and on main microbial groups differ by crop sequence. Soil Tillage Res. 2021, 211, 104995. [Google Scholar] [CrossRef]
  39. Soil Survey Staff. Keys to soil taxonomy. Soil Conserv. Serv. 2014, 12, 410. [Google Scholar]
  40. AOAC International. Official Methods of Analysis, 15th ed.; AOAC International: Arlington, VA, USA, 2016. [Google Scholar]
  41. Fujihara, S.; Sasaki, H.; Aoyagi, Y.; Sugahara, T. nitrogen-to-protein conversion factors for some cereal products in japan. J. Food Sci. 2008, 73, C204–C209. [Google Scholar] [CrossRef]
  42. List, D.; Ruwisch, I.; Langhans, P. Potential applications of flow injection analysis in fruit juice analysis. Fleuss. Obst. 1986, 53. [Google Scholar]
  43. Ruzicka, J.; Růžička, J.; Hansen, E.H. Flow Injection Analysis; John Wiley & Sons: Hoboken, NJ, USA, 1981; Volume 62, ISBN 0471081922. [Google Scholar]
  44. Weil, R.R.; Islam, K.R.; Stine, M.A.; Gruver, J.B.; Samson-Liebig, S.E. Estimating active carbon for soil quality assessment: A simplified method for laboratory and field use. Am. J. Altern. Agric. 2003, 18, 3–17. [Google Scholar]
  45. Culman, S.W.; Snapp, S.S.; Freeman, M.A.; Schipanski, M.E.; Beniston, J.; Lal, R.; Drinkwater, L.E.; Franzluebbers, A.J.; Glover, J.D.; Grandy, A.S.; et al. Permanganate oxidizable carbon reflects a processed soil fraction that is sensitive to management. Soil Sci. Soc. Am. J. 2012, 76, 494. [Google Scholar] [CrossRef] [Green Version]
  46. Olsen, S.R.; Cole, C.V.; Watandbe, F.; Dean, L. Estimation of Available Phosphorus in Soil by Extraction with sodium Bicarbonate. J. Chem. Inf. Model. 1954, 53, 1689–1699. [Google Scholar]
  47. Grossman, R.B.; Reinsch, T.G. Core method. In Methods of Soil Analysis. Part 4 Physical Methods; Dane, J.B.H.G., Topp, C., Eds.; Soil Science Society of America Inc.: Madison, WI, USA, 2002; Volume 4, pp. 207–210. [Google Scholar]
  48. White, D.C.; Davis, W.M.; Nickels, J.S.; King, J.D.; Bobbie, R.J. Determination of the sedimentary microbial biomass by extractible lipid phosphate. Oecologia 1979, 40, 51–62. [Google Scholar] [CrossRef]
  49. Wu, Y.; Ding, N.; Wang, G.; Xu, J.; Wu, J.; Brookes, P.C. Effects of different soil weights, storage times and extraction methods on soil phospholipid fatty acid analyses. Geoderma 2009, 150, 171–178. [Google Scholar] [CrossRef]
  50. Guckert, J.B.; Antworth, C.P.; Nichols, P.D.; White, D.C. Phospholipid, ester-linked fatty acid profiles as reproducible assays for changes in prokaryotic community structure of estuarine sediments. FEMS Microbiol. Lett. 1985, 31, 147–158. [Google Scholar] [CrossRef]
  51. Frostegard, A.; Baath, E. The use of phospholipid fatty acid analysis to estimate bacterial and fungal biomass in soil. Biol. Fertil. Soils 1996, 22, 59–65. [Google Scholar] [CrossRef]
  52. Zelles, L. Phospholipid fatty acid profiles in selected members of soil microbial communities. Chemosphere 1997, 35, 275–294. [Google Scholar] [CrossRef]
  53. Ferrarini, A.; Martani, E.; Fornasier, F.; Amaducci, S. High C input by perennial energy crops boosts belowground functioning and increases soil organic P content. Agric. Ecosyst. Environ. 2021, 308, 107247. [Google Scholar] [CrossRef]
  54. Bardelli, T.; Gómez-Brandón, M.; Ascher-Jenull, J.; Fornasier, F.; Arfaioli, P.; Francioli, D.; Egli, M.; Sartori, G.; Insam, H.; Pietramellara, G. Effects of slope exposure on soil physico-chemical and microbiological properties along an altitudinal climosequence in the Italian Alps. Sci. Total Environ. 2017, 575, 1041–1055. [Google Scholar] [CrossRef]
  55. Cowie, A.L.; Lonergan, V.E.; Rabbi, S.M.F.; Fornasier, F.; MacDonald, C.; Harden, S.; Kawasaki, A.; Singh, B.K. Impact of carbon farming practices on soil carbon in northern New South Wales. Arid Soil Res. Rehabil. 2013, 51, 707–718. [Google Scholar] [CrossRef]
  56. R CoreTeam. A Language and Environment for Statistical Computing; R Foundation for Statistical Computing: Vienna, Austria, 2021. [Google Scholar]
  57. Lê, S.; Josse, J.; Husson, F. FactoMineR: An R Package for Multivariate Analysis. J. Stat. Softw. 2008, 25, 1–18. [Google Scholar] [CrossRef] [Green Version]
  58. Kassambara, A.; Mundt, F. Factoextra: Extract and visualize the results of multivariate data analyses. R Packag. Version 2017, 1, 337–354. [Google Scholar]
  59. Wei, T.; Simko, V. R Package “Corrplot”: Visualization of a Correlation Matrix. Version 0.84; 2017; Available online: https://github.com/taiyun/corrplot (accessed on 23 October 2022).
  60. Blanco-Canqui, H.; Stone, L.R.; Schlegel, A.J.; Lyon, D.J.; Vigil, M.F.; Mikha, M.M.; Stahlman, P.W.; Rice, C.W. No-till induced increase in organic carbon reduces maximum bulk density of soils. Soil Sci. Soc. Am. J. 2009, 73, 1871–1879. [Google Scholar] [CrossRef]
  61. Gozubuyuk, Z.; Sahin, U.; Ozturk, I.; Celik, A.; Adiguzel, M.C. Tillage effects on certain physical and hydraulic properties of a loamy soil under a crop rotation in a semi-arid region with a cool climate. Catena 2014, 118, 195–205. [Google Scholar] [CrossRef]
  62. Monti, M.; Badagliacca, G.; Romeo, M.; Gelsomino, A. No-Till and solid digestate amendment selectively affect the potential denitrification activity in two Mediterranean orchard soils. Soil Syst. 2021, 5, 31. [Google Scholar] [CrossRef]
  63. Keller, T.; Håkansson, I. Estimation of reference bulk density from soil particle size distribution and soil organic matter content. Geoderma 2010, 154, 398–406. [Google Scholar] [CrossRef]
  64. Reichert, J.M.; Mentges, M.I.; Rodrigues, M.F.; Cavalli, J.P.; Awe, G.O.; Mentges, L.R. Compressibility and elasticity of subtropical no-till soils varying in granulometry organic matter, bulk density and moisture. Catena 2018, 165, 345–357. [Google Scholar] [CrossRef]
  65. Badagliacca, G.; Romeo, M.; Lo Presti, E.; Gelsomino, A.; Monti, M. Factors governing total and permanganate oxidizable C pools in agricultural soils from southern Italy. Agriculture 2020, 10, 99. [Google Scholar] [CrossRef] [Green Version]
  66. López-Bellido, R.J.; Fontán, J.M.; López-Bellido, F.J.; López-Bellido, L. Carbon sequestration by tillage, rotation, and nitrogen fertilization in a Mediterranean Vertisol. Agron. J. 2010, 102, 310. [Google Scholar] [CrossRef]
  67. Liu, E.; Teclemariam, S.G.; Yan, C.; Yu, J.; Gu, R.; Liu, S.; He, W.; Liu, Q. Long-term effects of no-tillage management practice on soil organic carbon and its fractions in the northern China. Geoderma 2014, 213, 379–384. [Google Scholar] [CrossRef]
  68. Six, J.; Elliott, E.; Paustian, K. Soil macroaggregate turnover and microaggregate formation: A mechanism for C sequestration under no-tillage agriculture. Soil Biol. Biochem. 2000, 32, 2099–2103. [Google Scholar] [CrossRef]
  69. Sarker, J.R.; Singh, B.P.; Cowie, A.L.; Fang, Y.; Collins, D.; Dougherty, W.J.; Singh, B.K. Carbon and nutrient mineralisation dynamics in aggregate-size classes from different tillage systems after input of canola and wheat residues. Soil Biol. Biochem. 2018, 116, 22–38. [Google Scholar] [CrossRef]
  70. Majumder, B.; Kuzyakov, Y. Effect of fertilization on decomposition of 14C labelled plant residues and their incorporation into soil aggregates. Soil Tillage Res. 2010, 109, 94–102. [Google Scholar] [CrossRef]
  71. Shi, A.; Marschner, P. Drying and rewetting frequency influences cumulative respiration and its distribution over time in two soils with contrasting management. Soil Biol. Biochem. 2014, 72, 172–179. [Google Scholar] [CrossRef]
  72. Vázquez, E.; Teutscherova, N.; Dannenmann, M.; Töchterle, P.; Butterbach-Bahl, K.; Pulleman, M.; Arango, J. Gross nitrogen transformations in tropical pasture soils as affected by Urochloa genotypes differing in biological nitrification inhibition (BNI) capacity. Soil Biol. Biochem. 2020, 151, 108058. [Google Scholar] [CrossRef]
  73. Dai, Z.; Hu, J.; Fan, J.; Fu, W.; Wang, H.; Hao, M. No-tillage with mulching improves maize yield in dryland farming through regulating soil temperature, water and nitrate-N. Agric. Ecosyst. Environ. 2021, 309, 107288. [Google Scholar] [CrossRef]
  74. Badagliacca, G.; Benítez, E.; Amato, G.; Badalucco, L.; Giambalvo, D.; Laudicina, V.A.; Ruisi, P. Long-term no-tillage application increases soil organic carbon, nitrous oxide emissions and faba bean (Vicia faba L.) yields under rain-fed Mediterranean conditions. Sci. Total Environ. 2018, 639, 350–359. [Google Scholar] [CrossRef]
  75. Khan, A.R. Influence of tillage on soil aeration. J. Agron. Crop Sci. 1996, 177, 253–259. [Google Scholar] [CrossRef]
  76. Laudicina, V.A.; Palazzolo, E.; Piotrowska-Długosz, A.; Badalucco, L. Soil profile dismantlement by land levelling and deep tillage damages soil functioning but not quality. Appl. Soil Ecol. 2016, 107, 298–306. [Google Scholar] [CrossRef]
  77. Essington, M.E.; Howard, D.D. Phosphorus availability and speciation in long-term no-till and disk-till soil. Soil Sci. 2000, 165, 144–152. [Google Scholar] [CrossRef]
  78. Martinrueda, I.; Munozguerra, L.; Yunta, F.; Esteban, E.; Tenorio, J.; Lucena, J. Tillage and crop rotation effects on barley yield and soil nutrients on a Calciortidic Haploxeralf. Soil Tillage Res. 2007, 92, 1–9. [Google Scholar] [CrossRef]
  79. Obour, A.K.; Mikha, M.M.; Holman, J.D.; Stahlman, P.W. Changes in soil surface chemistry after fifty years of tillage and nitrogen fertilization. Geoderma 2017, 308, 46–53. [Google Scholar] [CrossRef]
  80. Cookson, W.R.; Murphy, D.V.; Roper, M.M. Characterizing the relationships between soil organic matter components and microbial function and composition along a tillage disturbance gradient. Soil Biol. Biochem. 2008, 40, 763–777. [Google Scholar] [CrossRef]
  81. Gil, S.V.; Meriles, J.; Conforto, C.; Basanta, M.; Radl, V.; Hagn, A.; Schloter, M.; March, G.J. Response of soil microbial communities to different management practices in surface soils of a soybean agroecosystem in Argentina. Eur. J. Soil Biol. 2011, 47, 55–60. [Google Scholar]
  82. García-Orenes, F.; Morugán-Coronado, A.; Zornoza, R.; Scow, K. Changes in Soil Microbial Community Structure Influenced by Agricultural Management Practices in a Mediterranean Agro-Ecosystem. PLoS ONE 2013, 8, e80522. [Google Scholar] [CrossRef]
  83. Stevenson, B.A.; Hunter, D.W.F.; Rhodes, P.L. Temporal and seasonal change in microbial community structure of an undisturbed, disturbed, and carbon-amended pasture soil. Soil Biol. Biochem. 2014, 75, 175–185. [Google Scholar] [CrossRef]
  84. Corbeels, M.; Scopel, E.; Cardoso, A.; Bernoux, M.; Douzet, J.-M.; Neto, M.S. Soil carbon storage potential of direct seeding mulch-based cropping systems in the Cerrados of Brazil. Glob. Chang. Biol. 2006, 12, 1773–1787. [Google Scholar] [CrossRef]
  85. Balota, E.L.; Colozzi Filho, A.; Andrade, D.S.; Dick, R.P. Long-term tillage and crop rotation effects on microbial biomass and C and N mineralization in a Brazilian Oxisol. Soil Tillage Res. 2004, 77, 137–145. [Google Scholar] [CrossRef]
  86. Jin, V.L.; Haney, R.L.; Fay, P.A.; Polley, H.W. Soil type and moisture regime control microbial C and N mineralization in grassland soils more than atmospheric CO2-induced changes in litter quality. Soil Biol. Biochem. 2013, 58, 172–180. [Google Scholar] [CrossRef] [Green Version]
  87. Kramer, C.; Gleixner, G. Soil organic matter in soil depth profiles: Distinct carbon preferences of microbial groups during carbon transformation. Soil Biol. Biochem. 2008, 40, 425–433. [Google Scholar] [CrossRef]
  88. Feng, X.; Simpson, M.J. Temperature and substrate controls on microbial phospholipid fatty acid composition during incubation of grassland soils contrasting in organic matter quality. Soil Biol. Biochem. 2009, 41, 804–812. [Google Scholar] [CrossRef]
  89. Fanin, N.; Kardol, P.; Farrell, M.; Nilsson, M.-C.; Gundale, M.J.; Wardle, D.A. The ratio of Gram-positive to Gram-negative bacterial PLFA markers as an indicator of carbon availability in organic soils. Soil Biol. Biochem. 2019, 128, 111–114. [Google Scholar] [CrossRef]
  90. López-Garrido, R.; Madejón, E.; León-Camacho, M.; Girón, I.; Moreno, F.; Murillo, J.M. Reduced tillage as an alternative to no-tillage under Mediterranean conditions: A case study. Soil Tillage Res. 2014, 140, 40–47. [Google Scholar] [CrossRef]
  91. Zhang, B.; Li, Y.; Ren, T.; Tian, Z.; Wang, G.; He, X.; Tian, C. Short-term effect of tillage and crop rotation on microbial community structure and enzyme activities of a clay loam soil. Biol. Fertil. Soils 2014, 50, 1077–1085. [Google Scholar] [CrossRef]
  92. Mooshammer, M.; Wanek, W.; Zechmeister-Boltenstern, S.; Richter, A. Stoichiometric imbalances between terrestrial decomposer communities and their resources: Mechanisms and implications of microbial adaptations to their resources. Front. Microbiol. 2014, 5, 22. [Google Scholar] [CrossRef] [Green Version]
  93. Zechmeister-Boltenstern, S.; Keiblinger, K.M.; Mooshammer, M.; Peñuelas, J.; Richter, A.; Sardans, J.; Wanek, W. The application of ecological stoichiometry to plant–microbial–soil organic matter transformations. Ecol. Monogr. 2015, 85, 133–155. [Google Scholar] [CrossRef] [Green Version]
  94. Alluvione, F.; Fiorentino, N.; Bertora, C.; Zavattaro, L.; Fagnano, M.; Chiarandà, F.Q.; Grignani, C. Short-term crop and soil response to C-friendly strategies in two contrasting environments. Eur. J. Agron. 2013, 45, 114–123. [Google Scholar] [CrossRef]
  95. Six, J.; Paustian, K. Aggregate-associated soil organic matter as an ecosystem property and a measurement tool. Soil Biol. Biochem. 2014, 68, A4–A9. [Google Scholar] [CrossRef]
  96. Han, Z.; Walter, M.T.; Drinkwater, L.E. N2O emissions from grain cropping systems: A meta-analysis of the impacts of fertilizer-based and ecologically-based nutrient management strategies. Nutr. Cycl. Agroecosyst. 2017, 107, 335–355. [Google Scholar] [CrossRef] [Green Version]
  97. Geisseler, D.; Horwath, W.R.; Scow, K.M. Soil moisture and plant residue addition interact in their effect on extracellular enzyme activity. Pedobiologia 2011, 54, 71–78. [Google Scholar] [CrossRef]
  98. Enggrob, K.L.; Larsen, T.; Peixoto, L.; Rasmussen, J. Gram-positive bacteria control the rapid anabolism of protein-sized soil organic nitrogen compounds questioning the present paradigm. Sci. Rep. 2020, 10, 15840. [Google Scholar] [CrossRef] [PubMed]
  99. Pittarello, M.; Ferro, N.D.; Chiarini, F.; Morari, F.; Carletti, P. Influence of tillage and crop rotations in organic and conventional farming systems on soil organic matter, bulk density and enzymatic activities in a short-term field experiment. Agronomy 2021, 11, 724. [Google Scholar] [CrossRef]
  100. Potthast, K.; Hamer, U.; Makeschin, F. Impact of litter quality on mineralization processes in managed and abandoned pasture soils in Southern Ecuador. Soil Biol. Biochem. 2010, 42, 56–64. [Google Scholar] [CrossRef]
  101. Mariano, E.; Jones, D.L.; Hill, P.W.; Trivelin, P.C.O. Mineralisation and sorption of dissolved organic nitrogen compounds in litter and soil from sugarcane fields. Soil Biol. Biochem. 2016, 103, 522–532. [Google Scholar] [CrossRef]
  102. Lagomarsino, A.; Grego, S.; Kandeler, E. Soil organic carbon distribution drives microbial activity and functional diversity in particle and aggregate-size fractions. Pedobiologia 2012, 55, 101–110. [Google Scholar] [CrossRef]
  103. Xu, Z.; Yu, G.; Zhang, X.; Ge, J.; He, N.; Wang, Q.; Wang, D. The variations in soil microbial communities, enzyme activities and their relationships with soil organic matter decomposition along the northern slope of Changbai Mountain. Appl. Soil Ecol. 2015, 86, 19–29. [Google Scholar] [CrossRef]
  104. Lal, R. Constraints to adopting no-till farming in developing countries. Soil Tillage Res. 2007, 94, 1–3. [Google Scholar] [CrossRef]
  105. Vakali, C.; Zaller, J.G.; Köpke, U. Reduced tillage effects on soil properties and growth of cereals and associated weeds under organic farming. Soil Tillage Res. 2011, 111, 133–141. [Google Scholar] [CrossRef]
  106. Mentges, M.I.; Reichert, J.M.; Rodrigues, M.F.; Awe, G.O.; Mentges, L.R. Capacity and intensity soil aeration properties affected by granulometry, moisture, and structure in no-tillage soils. Geoderma 2016, 263, 47–59. [Google Scholar] [CrossRef]
  107. Motzo, R.; Fois, S.; Giunta, F. Relationship between grain yield and quality of durum wheats from different eras of breeding. Euphytica 2004, 140, 147–154. [Google Scholar] [CrossRef]
  108. Giambalvo, D.; Ruisi, P.; Di Miceli, G.; Frenda, A.S.; Amato, G. Nitrogen use efficiency and nitrogen fertilizer recovery of durum wheat genotypes as affected by interspecific competition. Agron. J. 2010, 102, 707. [Google Scholar] [CrossRef]
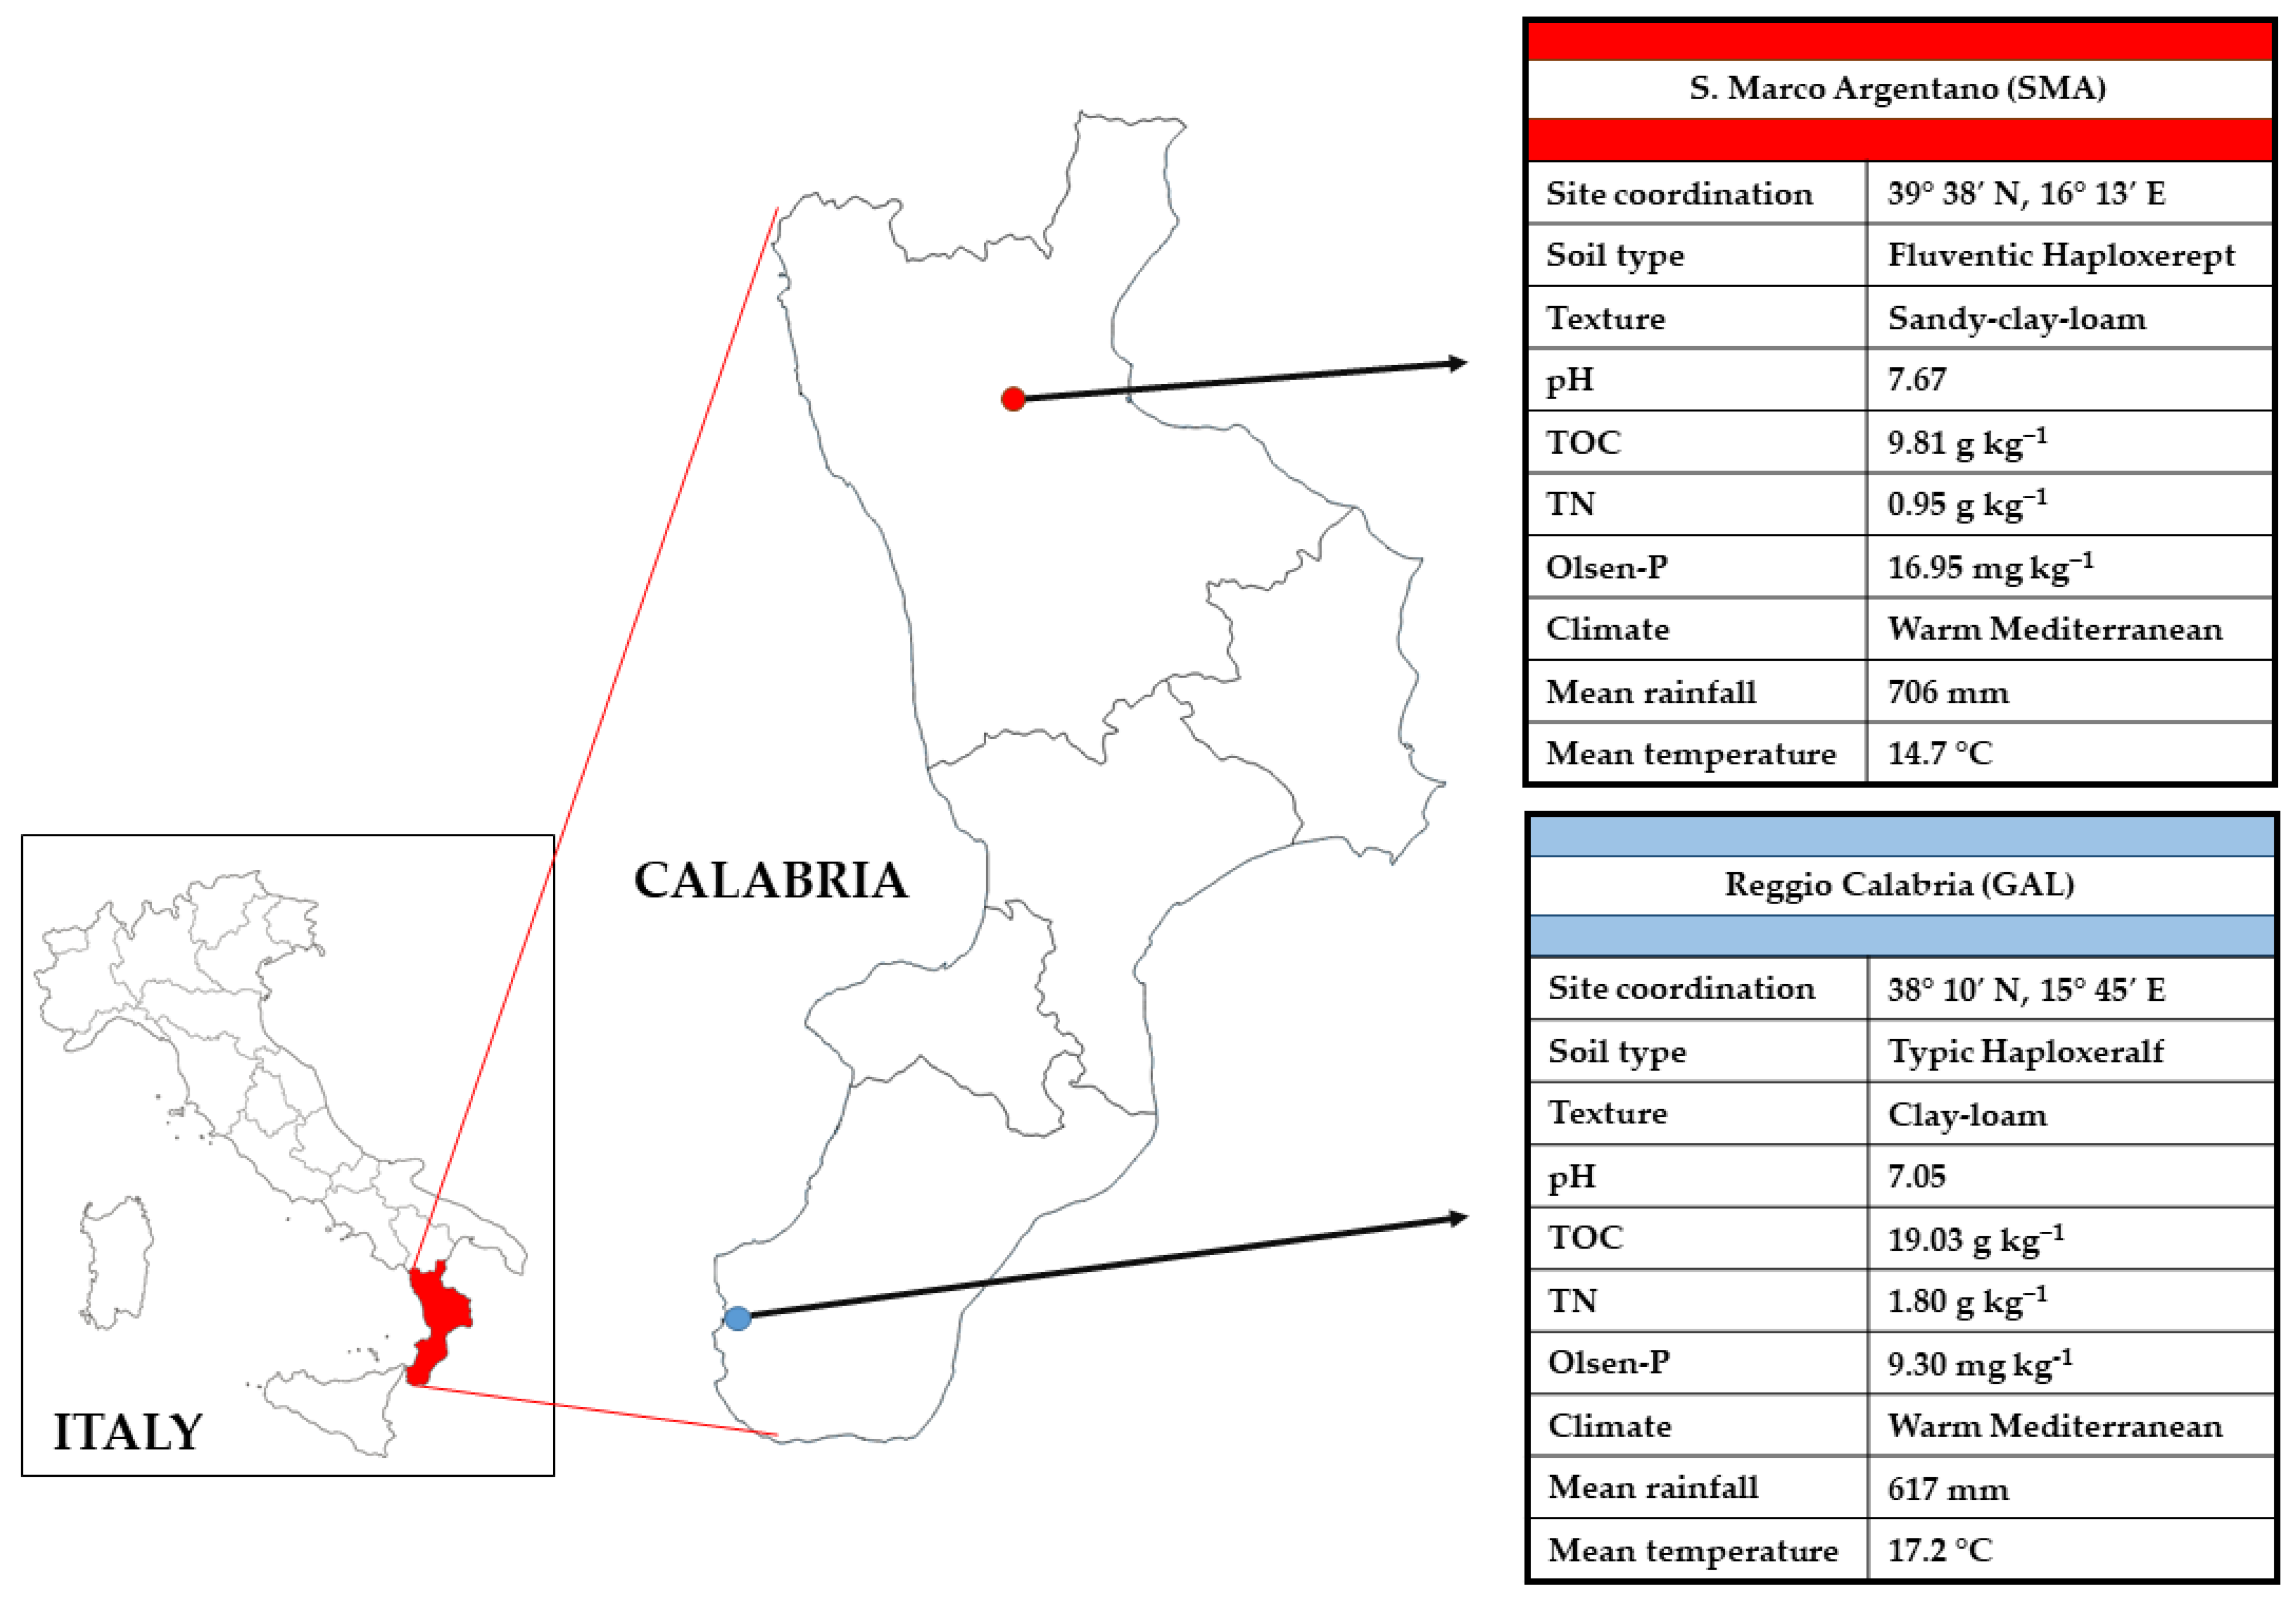
Figure 1. Overview of the two experimental sites: the first located at Reggio Calabria (GAL) (blue frame) and the second one at S. Marco Argentano (SMA) (red frame). Onset tables show geographic coordination reference, major soil data and soil taxonomy, climate classification, mean annual rainfall, and temperature.
Agronomy 12 03136 g001
Figure 2. Daily and accumulated rainfall and daily mean air temperature at the experimental sites (GAL, on the left, and SMA, on the right) during the growing seasons (2019–2020); the graphs include a 20-yr average of accumulated rainfall and 20-yr average mean daily temperature trends.
Agronomy 12 03136 g002
Figure 3. Effect of soil (GAL, on the left, and SMA, on the right), tillage system (CT, in brown, and NT, in green), and their interaction on soil bulk density (BD) at harvest. Reported values are means (n = 4) ± SE (bars). Different letters indicate significant differences (Tukey’s HSD test at p < 0.05) between treatments.
Agronomy 12 03136 g003
Figure 4. Effect of soil (GAL and SMA), tillage system (CT, in brown, and NT, in green), sampling time (sowing—T0 and harvest—T1), and their interaction on soil microbial biomass (MB). Reported values are means (n = 4) ± SE (bars). Different letters indicate significant differences within each sampling time (Tukey’s HSD test at p <0.05) between treatments (Soil × Tillage).
Agronomy 12 03136 g004
Figure 5. Effect of soil (GAL and SMA), tillage system (CT, in brown, and NT, in green), sampling time (sowing—T0 and harvest—T1), and their interaction on soil bacteria (BAC), fungi, Gram-positive (BAC+), and Gram-negative bacteria (BAC) abundance. Reported values are means (n = 4) ± SE (bars). Different letters indicate significant differences within each sampling time (Tukey’s HSD test at p < 0.05) between treatments (Soil × Tillage).
Agronomy 12 03136 g005
Figure 6. Effect of soil (GAL and SMA), tillage system (CT and NT), sampling time (sowing—T0 and harvest—T1), and their interaction on soil enzymes: α-glucosidase (alfaG), β-glucosidase (betaG), α-galactosidase (alfaGAL), β-galactosidase (betaGAL), α-mannosidase (alfaMAN), β-mannosidase (betaMAN), β-1,4-glucanase (cell), β-1,4-xylanase (xilo), α-arabinase (arabin), β-D-glucuronidase (uroni) involved in C cycling; N-acetyl-b-D-glucosaminidase (chit), leucine amino-peptidase (leu), trypsin-like protease (arginina) involved in N cycling; acid (acP) and alkaline phosphomonoesterase (alkP), pyrophosphodiesterase (piroP), phosphodiesterase (bisP), inositol-P phosphatase (inositP) involved in P cycling; (iv) arylsulfatase (aryS) involved in S cycling and (v) butirate (butir) and nonanoate (nona) esterase. Reported values are means (n= 4). Cell colours vary from green (low concentration) to red (high concentration). Different letters indicate significant differences within each sampling time (Tukey’s HSD test at p < 0.05) between treatments (Soil × Tillage).
Agronomy 12 03136 g006
Figure 7. Principal component analysis biplot of the four cropping systems centroids calculated (means ± SEs) as combinations of experimental soils (GAL and SMA) and tillage managements (CT and NT). PC1, first principal component; PC2, second principal component. The direction and length of vector lines indicate the degree of association between each variable, as specified in the M&M section, and the cropping system.
Agronomy 12 03136 g007
Figure 8. Pairwise Pearson’s correlation analysis. The circle indicates the significant correlation among considered variables (p < 0.05) described in the M&M section. Blue and red colours indicate positive and negative correlations, respectively, while the circle size reflects the intensity of correlation (r-value).
Agronomy 12 03136 g008
Table 1. Effect of soil (GAL and SMA), tillage system (CT and NT) and their interaction on wheat biomass and grain yields, harvest index (HI), test weight (TW), thousand kernels weight (TKW), straw and grain N (N-Straw and N-Grain) and P (P-Straw and P-Grain) concentrations. Reported values are means (n = 4). Different letters indicate significant differences (Tukey’s HSD test at p < 0.05) between treatments (Soil × Tillage).
SoilTillageBiomass YieldGrain YieldHITWTKWN-StrawN-GrainP-StrawP-Grain
t ha−1t ha−1%kg hL−1g%%
GALCT12.8 b4.9 a0.39 a82.7 a47 a0.44 c2.0 a0.29 b2.1 c
NT9.5 c3.8 d0.39 a82.8 a46 a0.45 c2.1 a0.29 b2.8 a
SMACT14.9 a4.3 b0.30 c79.7 b42 b0.68 a2.1 a0.33 a2.2 c
NT11.8 b4.1 c0.34 b78.5 c41 c0.60 b2.0 a0.35 a2.5 b
p-values
Soil<0.0010.031<0.001<0.001<0.001<0.0010.4270.0080.133
Tillage<0.001<0.0010.1860.0240.0070.0210.6790.533<0.001
Soil × Tillage0.748<0.0010.2340.0180.0480.0040.0940.8460.004
Table 2. Effect of soil (GAL and SMA), tillage system (CT and NT), and their interaction on wheat straw, grain, and total N and P uptakes. Reported values are means (n = 4). Different letters indicate significant differences (Tukey’s HSD test at p < 0.05) between treatments (Soil × Tillage).
SoilTillageN-UptakeP-Uptake
StrawGrainTotalStrawGrainTotal
kg ha−1kg ha−1kg ha−1kg ha−1kg ha−1kg ha−1
GALCT34.4 c99.9 a134.4 b2.3 bc16.0 c18.3 c
NT25.6 c82.1 b107.8 c1.7 c16.1 c17.8 c
SMACT71.6 a89.5 ab161.1 a3.6 a23.0 a26.6 a
NT46.5 b81.2 b127.8 b2.7 b19.3 b22.0 b
p-values
Soil<0.0010.107<0.001<0.001<0.001<0.001
Tillage<0.0010.002<0.0010.0020.0280.007
Soil × Tillage0.0030.1710.4180.5010.0230.025
Table 3. Effect of soil (GAL and SMA), tillage system (CT and NT), sampling time (sowing—T0 and harvest—T1), and their interaction on soil permanganate oxidizable C (POxC), nitrate-N (NO3-N), ammonium-N (NH4+-N), extractable organic N (EON), total soluble N (TSN), and available P (OlsP). Reported values are means (n = 4). Different letters indicate significant differences within each sampling time (Tukey’s HSD test at p < 0.05) between treatments (Soil × Tillage).
SoilTillagePOxCNO3-NNH4+-NEONTSNOlsP
mg kg−1mg kg−1mg kg−1mg kg−1mg kg−1mg kg−1
T0T1T0T1T0T1T0T1T0T1T0T1
GALCT423.3 a429.4 a1.86 a1.80 a3.94 a1.69 a48.6 b30.9 c54.4 b34.4 d6.7 c7.8 d
NT431.5 a439.4 a1.69 b0.45 c3.27 b1.76 a39.8 c57.5 b44.8 c59.7 b11.2 c10.8 c
SMACT372.5 b387.6 b1.60 b0.48 c1.33 d0.59 b33.1 c46.2 b36.0 d47.3 c15.2 b14.3 b
NT369.3 b412.9 b0.80 c1.41 b2.74 c0.92 b63.6 a61.5 a67.2 a63.8 a21.3 a19.6 a
p-values
Soil0.001<0.001<0.0010.0020.012<0.001
Tillage0.300<0.0010.076<0.001<0.001<0.001
Soil × Tillage0.919<0.0010.0020.002<0.0010.191
Time 0.061<0.001<0.0010.2250.7470.571
Time × Soil0.2180.0200.0060.2250.1580.284
Time × Tillage0.3910.0760.0350.0370.0360.441
Time × Soil × Tillage0.447<0.001<0.001<0.001<0.0010.843
Table 4. Stepwise multiple linear regressions for the estimation of wheat grain yield, based on the soil variables described in the M&M section, for each experimental soil individually (GAL and SMA) and together (Global). Letter b represents the equation constant while letter p is the observed significance level.
GlobalGALSMA
Yield R2 = 0.9883Yield R2 = 0.9836Yield R2 = 0.9998
Constant = 5.7119Constant = 6.6065Constant = 3.2668
VariablebpVariablebpVariablebp
NH4+-N_T00.4573<0.001NH4+-N_T00.30890.0486aryS_T00.1346<0.001
inositP_T01.0221<0.001BAC_T0−0.0136<0.001inositP_T00.0596<0.001
nona_T10.0115<0.001 bisP_T00.0037<0.001
MB_T10.0033<0.001 arabin_T10.0018<0.001
Bac_T10.0121<0.001 NH4+-N_T1−0.1089<0.001
OlsP_T1−0.0552<0.001 Fungi_T0−0.0341<0.001
Publisher’s Note: MDPI stays neutral with regard to jurisdictional claims in published maps and institutional affiliations.