Article

Utilization of Biochar for Eliminating Residual Pharmaceuticals from Wastewater Used in Agricultural Irrigation: Application to Ryegrass

1
Department of Hydro Science, Faculty of Environmental Sciences, Technische Universität Dresden, 01062 Dresden, Germany
2
Department of Environmental Chemistry and Technology, Faculty of Environment, Jan Evangelista Purkyně University in Ústí nad Labem, Pasteurova 3632/15, 400 96 Ústí nad Labem, Czech Republic
*
Author to whom correspondence should be addressed.
Agronomy 2022, 12(12), 2987; https://doi.org/10.3390/agronomy12122987
Submission received: 4 November 2022 / Revised: 18 November 2022 / Accepted: 23 November 2022 / Published: 28 November 2022

Abstract

:
Biochar is known to be a promising material for the treatment of contaminants in wastewater and soil. In this research, wastewater samples collected at the tertiary stage from a WWTP located in the North Bohemia region of Czechia and containing 20 pharmaceutical contaminants were treated with the same biochar (wood and maize cob feedstocks, pyrolysis temperature of 470 °C), but of different doses (0.1 g L−1, 0.25 g L−1, 0.5 g L−1). In this case study, we aimed to verify the impacts of biochar application and/or concentration on the sorption of pharmaceuticals in water. The treated water was later used for irrigating planted (ryegrass taken as the plant model) and unplanted agricultural soils in a pot experiment. Soils and ryegrass samples were examined again for potential pharmaceutical existence, and the soil microbial activities were determined through fluorescein diacetate hydrolytic activities (FDHA). Results showed that most pharmaceuticals concentrations were significantly, but not totally, reduced from the wastewater upon biochar addition. Contaminants such as 3-hydroxycarbamazepine and metoprolol were entirely removed from the wastewater after 0.25 g L−1, whilst bezafibrate did not decline even at 0.5 g L−1. Moreover, the concentrations of pharmaceuticals in ryegrass biomass and soils were dominantly below detection limits or at very low doses. Finally, there were no significant differences in the microbial activities of the soils. This implicates that biochar could be approached as a good substrate for eliminating pharmaceuticals from wastewaters used for agricultural irrigation; however, more similar studies need to be carried out.

1. Introduction

Agricultural experts and many economists have identified that intensive participation in agriculture would alleviate poverty and hunger in the world, especially in countries with large populations [1]. Agriculture is expected to feed the growing population only at the expense of the environment [2]. Wastewater increase has become a global challenge because of agricultural, household, commercial and industrial activities [3]. Soil pollution of agricultural lands is becoming more dangerous due to the growth of agricultural industries, which enhance the discharge of increasing amounts of trace elements and pesticides into the farmland [4]. Considering the continued population growth and challenges in agriculture, environmentally friendly biochar can be used to increase agricultural activity and yields [5]. Biochar adsorption processes and behavior differs from one agricultural contaminant to another [4]. The amount of minerals in carbon substances can hugely affect the adsorption of varying pollutants either through co-precipitation or inner sphere complexation, and/or both [6]. The roles of pore spaces in the carbon-based material supposed to be used for wastewater treatment is of uttermost importance. A comparison between biochar macropores and granular activated carbon micropores shows that the efficiency of adsorption between both materials is similar [7]. However, the micropores of the granular activated carbon could be clogged or blocked by larger organic matter of biofilm in a complicated wastewater environment. Therefore, micropores contribute to higher biochar adsorption capacity [7]. According to Ambaye et al. [8], the quantity of biochar applied to wastewater can contribute to the adsorption and removal efficiency of contaminants. Biochar application to wastewater works in three steps, which are the clean step, the mass transfer zone and the equilibrium step where adsorption takes place, and it is mostly the exhausted stage [8]. Physical sorption, precipitation and complexation as well as pore filling are the steps involved in biochar adsorption [8].
Moreover, agricultural irrigation could be one of the ultimate fates of biochar-treated wastewater; thus, it is crucial to understand the substrate properties including pyrolysis conditions and application rate, which may affect the water quality and eventually the soil state [9]. Other decisive factors that determine the biochar efficiency comprise the surface area, temperature of pyrolysis, pore size distribution, feedstock, etc. [10]. Interestingly, the biochar feedstock greatly contributes to environmental friendliness. These sources are often biomass waste, which could be feces, straw, etc. [10]. These biomass wastes are recycled or reutilized in the production of biochar, which is advantageous to the environment (cost effective and environmentally friendly) [3,11].
Finally, many studies have been conducted on how biochar could be a good treatment for pharmaceutical contaminants in wastewaters [12,13,14]. Much focus has been on adsorption mechanism, kinetics and isotherms. Nevertheless, data about the quantity of biochar needed to remove the pharmaceuticals from the treated wastewater, as well as its subsequent utilization for agricultural irrigation and impacts on soil and plant parameters, is still scarce and rarely explored by researchers.
Therefore, this research investigated the influence of different biochar concentrations on pharmaceuticals reduction in wastewater and the impacts of the resulting treated water (with possible remainders of pharmaceuticals) on plant and soil health; while, in addition, investigating the irrigation of agricultural soils and verifying the impacts of the plant cultivation on the fate of the remaining pharmaceuticals as well as the soil microbial activities. For this sake, different biochar concentrations (0.1 g L−1, 0.25 g L−1, 0.5 g L−1) were added to wastewater collected at the tertiary stage. Later on, the treated water was used for irrigating ryegrass planted and unplanted agricultural soils. Throughout the experiment, we studied (i) the pharmaceutical concentrations in wastewater before and after biochar addition, (ii) as well as in the soil and plant samples upon irrigation and, finally, (iii) certain plant and soil health parameters, including the ryegrass fresh weight and soil microbial activities.

2. Materials and Methods

2.1. Wastewater and Biochar Sources and Characterization

Wastewater samples were collected at the tertiary stage from a wastewater treatment plant located in the Northern Bohemia region of the Czech Republic. Solid phase extraction was used to determine the presence and concentration of pharmaceuticals in the collected samples. An amount of 50 mL of the sample were gradually transferred (via 5 mL pipette) into an extraction cartridge (Oasis Prime HLB 6 cc, 200 mg, Waters Corp, Milford, MA, USA). The liquid was allowed to drip through the column using a pump and then collected into a beaker. Finally, in the elution step, 2.5 mL of LC-MS methanol, 2.5 mL of a mixture of H2O (90%) and methanol (10%) were acidified with 0.1% formic acid (Optima™ LC/MS Grade, Fisher Chemical™, Fair Lawn, NJ, USA). The eluate was then mixed, and 1.8 mL of the purified concentrated mixture was extracted with a pipette into a 2 mL small vial and ready for injection. The sample was then analyzed for pharmaceutical concentrations by LC (Infinity II 1290, Agilent Technologies, Santa Clara, CA, USA), MS/MS (6495 triplequad, Agilent Technologies, USA). Furthermore, the wastewater used in the experiment was tested for other parameters according to the Czech, European and ISO standards (Table 1).
The biochar (Biochar 4073) used in this experiment was derived from the combination of wood and maize cob feedstocks via pyrolysis at 470 °C for approximately 25 min. The produced biochar was examined for different properties. The pH was determined by stirring 0.5 g of biochar in 20 mL of deionized water for 1 h, after which, the mixture was allowed to settle, and the pH was measured using the inoLab pH7110-WTW pH meter. Another 0.5 g of biochar was weighed and poured into 20 mL of de-ionized water. The sample was titrated by 0.1 M HCl using Titrino 925 (Metrohm, Switzerland). From the consumption of hydrochloric acid, the amount of -OH groups corresponding to the neutralization reaction was calculated. The specific surface area and area of micropores were determined by Brunauer–Emmett–Teller (BET) analysis, measuring the physical adsorption of nitrogen using automatic analyzers ASAP 2020 and ASAP 2050 (Micromeritics, Norcross, GA, USA). Properties are presented in Table 2. Further details about the biochar processing and characterization can be found in the Supplementary material S1, Part A.

2.2. Wastewater Treatment with Different Biochar Doses

The biochar concentrations, experimental design and chronology were adapted from the research report of the Department of Environmental Chemistry and Technology at UJEP, (Supplementary material S1, Part B) who studied different biochar concentrations as well as the kinetics to determine the optimal time needed to reach equilibrium. In that work, two biochars (B4073 and PRAu) were selected for sorption capacity and biochar reactivity testing. To determine the efficiency of pharmaceutical removal, two dosages of biochar (0.5 g L−1 and 1 g L−1) were added to the wastewater and the samples were mixed. Water samples were successively taken at time intervals of 30, 60 and 180 min to determine the analyte concentrations. The results showed the Biochar 4073 was more efficient than PRAu with high analytes adsorption/removal capacities even at low concentrations and within a short period of time. Therefore, in the current work, wastewater samples were treated with three different doses of biochar, 0.1 g L−1 (trt0.1), 0.25 g L−1 (trt0.25) and 0.5 g L−1 biochar (trt0.5). The experiment control was wastewater without biochar treatment (trt0). For each treatment, the biochar quantity was weighed on the balance, then gradually added into the wastewater container while mixing using a mixer at 250 rpm for 2 h. The same procedure of mixing was carried out for all treatments. Each treatment was carried out in three replicates. After 2 h, the filtration of each sample treatment was also carried out with Munktell filter paper (Diameter 150 mm, Grade 390). The filtration procedure was performed to remove the undissolved biochar residue, and the samples were then subjected to solid phase extraction (as performed in the initial stage) to determine the concentration of pharmaceuticals. The difference in concentration for every treatment was then noticed and recorded. Each treatment contained 20 L of biochar-treated wastewater that was conserved in containers (20 L capacity) at a temperature of 4 °C for further utilization and analysis

2.3. Application of Wastewater for Irrigation

A pot experiment was conducted in a greenhouse under a semi-controlled environment (sun light, temperature 20 °C, humidity 80%), where the treated wastewater was used for irrigation. Forty pots were filled with 400 g of non-contaminated sandy loam soil each (soil parameters in Supplementary material S1, Part C). Due to time constraints and previous experience, the perennial ryegrass (Lolium perene) was taken as the plant model. Seeds were sown in twenty pots (1 g pot−1), whereas another twenty pots were kept unplanted. The experiment was conducted over a five-week vegetation period. The soils were kept moist at 70% water holding capacity (WHC) by regular irrigation (three times per week, 100 mL per pot) with the different wastewater/biochar treatments (four replicates of soils with ryegrass and another four replicates of soils without ryegrass). Unplanted samples were termed S0, S0.1, S0.25 and S0.5, corresponding to the biochar concentrations used and the grass planted samples were termed G0, G0.1, G0.25 and G0.5, respectively. At the end of the experiment, the ryegrass samples were collected, and their fresh weight was determined in the different treatments.

2.4. Pharmaceutical Concentrations in Soil and Ryegrass Samples

At the end of the pot experiment, soil and plant samples were collected and prepared for the determination of pharmaceutical concentrations according to Tolaszová [15]. First of all, the samples were lyophilized and sieved afterwards. The extraction procedure started by weighing 5 g of soil and 0.5 g of ryegrass from each sample into a 50 mL plastic tube. Then, 10 mL of deionized water and 10 mL of acetonitrile were added, and the samples were mixed for 5 min using the miniG shaker at 1500 rpm. Later, 4 g of MgSO4 and 1 g of NaCl were added and thoroughly mixed for 2 min. Afterwards, the samples were centrifuged for 5× g min, the upper phase of the acetonitrile was collected into a glass tube and the extract was evaporated to dryness under nitrogen. Then, 1 mL of acetonitrile and 1 mL of deionized water were added to the soil samples, while 0.5 mL of acetonitrile and 0.5 mL of deionized water were added to the plant grass samples. The samples were transferred into an ultrasonic bath and then mixed on vortex for a few seconds. Subsequently, the extract was filtered through the 0.22 µm nylon filter to small glass vials of 2 mL. Finally, the extract was diluted with deionized water and analyzed with liquid chromatography, LC (Infinity II 1290, Agilent Technologies, USA) and MS/MS (6495 triplequad, Agilent Technologies, USA).

2.5. Fluorescein Diacetate Hydrolytic Activities (FDHA) Experiment

Since microbial decomposers use nearly 90% of the energy in the soil environment, the total microbial activity offers a broad indicator of organic matter turnover in natural settings [16]. As an assessment tool, fluorescein diacetate hydrolytic activities (FDHA) were measured according to Al Souki et al. [17] via the quantification of fluorescein liberated upon soil incubation in sodium phosphate buffer. Optimal conditions of pH, temperature and substrate quantities were maintained to obtain the maximal soil enzymatic activities’ potentials.

2.6. Statistical Analysis

All statistical analyses were performed using R software and Microsoft office Excel. One-way analysis of variance (ANOVA) at a 95% confidence level was then used to examine the difference in the treatments (0, 0.1, 0.25, 0.5 g L−1) upon evaluating the normality by Shapiro–Wilk testing. When significant difference was proved, a Tukey HSD test was performed for pair-wise comparison at a 95% confidence level (p value ≤ 0.05). The treatments were then categorized through letters (in descending order) based on the outcome.

3. Results

3.1. Wastewater Treatment with Biochar

On average, approximately 95% of all pharmaceutical contaminants were reduced upon the addition of biochar. Bezafibrate was the sole exception as its concentration was not significantly reduced, regardless of the biochar dose added. The reduction in the concentrations of all other contaminants was different based on the amount of added biochar. The concentrations of 30% of the contaminants were not significantly reduced with the addition of biochar of 0.1 g L−1 (trt0.1). Furthermore, 90% and 60% of all contaminants were significantly reduced upon the addition of 0.25 g L−1 biochar (trt0.25) compared to the control (trt0) and trt0.1, respectively. With the addition of 0.5 g L−1 biochar (trt0.5), 95% of contaminants were significantly reduced compared to the control, 85% of contaminants were significantly reduced compared to trt0.1, and compared to trt0.25, 30% of all contaminants were reduced. Of note, after the addition of 0.25 g L−1 and 0.5 g L−1 biochar (trt0.25 and trt0.5), the concentrations of some contaminants, including 3-hydroxycarbamazepine and metoprolol, became below the detection limit (25 ng L−1). On the other hand, and in spite of the significant decrease in their concentrations, considerable amounts of certain pharmaceuticals (caffeine, iopamidol and N-acetylsulfamethoxazole) were still detected even at the highest biochar dose.
The changes in the concentration of every pharmaceutical detected before and after the addition of biochar are presented in Table 3.

3.2. Pharamceutical Concentrations in Soil and Plant Samples after Irrigation with Biochar-Treated Wastewater

The wastewater samples treated with different biochar concentrations were applied for irrigation on both unplanted and planted ryegrass soils. To begin with, none of the tested pharmaceuticals were detected in the ryegrass biomass. Moreover, several compounds were also not verified in the soil samples. The results of the traced pharmaceuticals in Table 4 show no real significant differences in the concentrations of contaminants in soils with and without ryegrass. Nevertheless, there were few exceptions. Acebutolol concentrations under ryegrass gradually decreased in the planted pots that were irrigated by wastewater treated by 0.25 and 0.5 g L−1 biochar from 0.19 ± 0.0.08 ng g−1 in G0 to less than the limits of detection (0.08 ng g−1). The other two pharmaceuticals that declined in soils cultivated by ryegrass were phenazone and sulfamethoxazole, which recorded a 60 and 90% drop between G0 and G0.5, respectively.

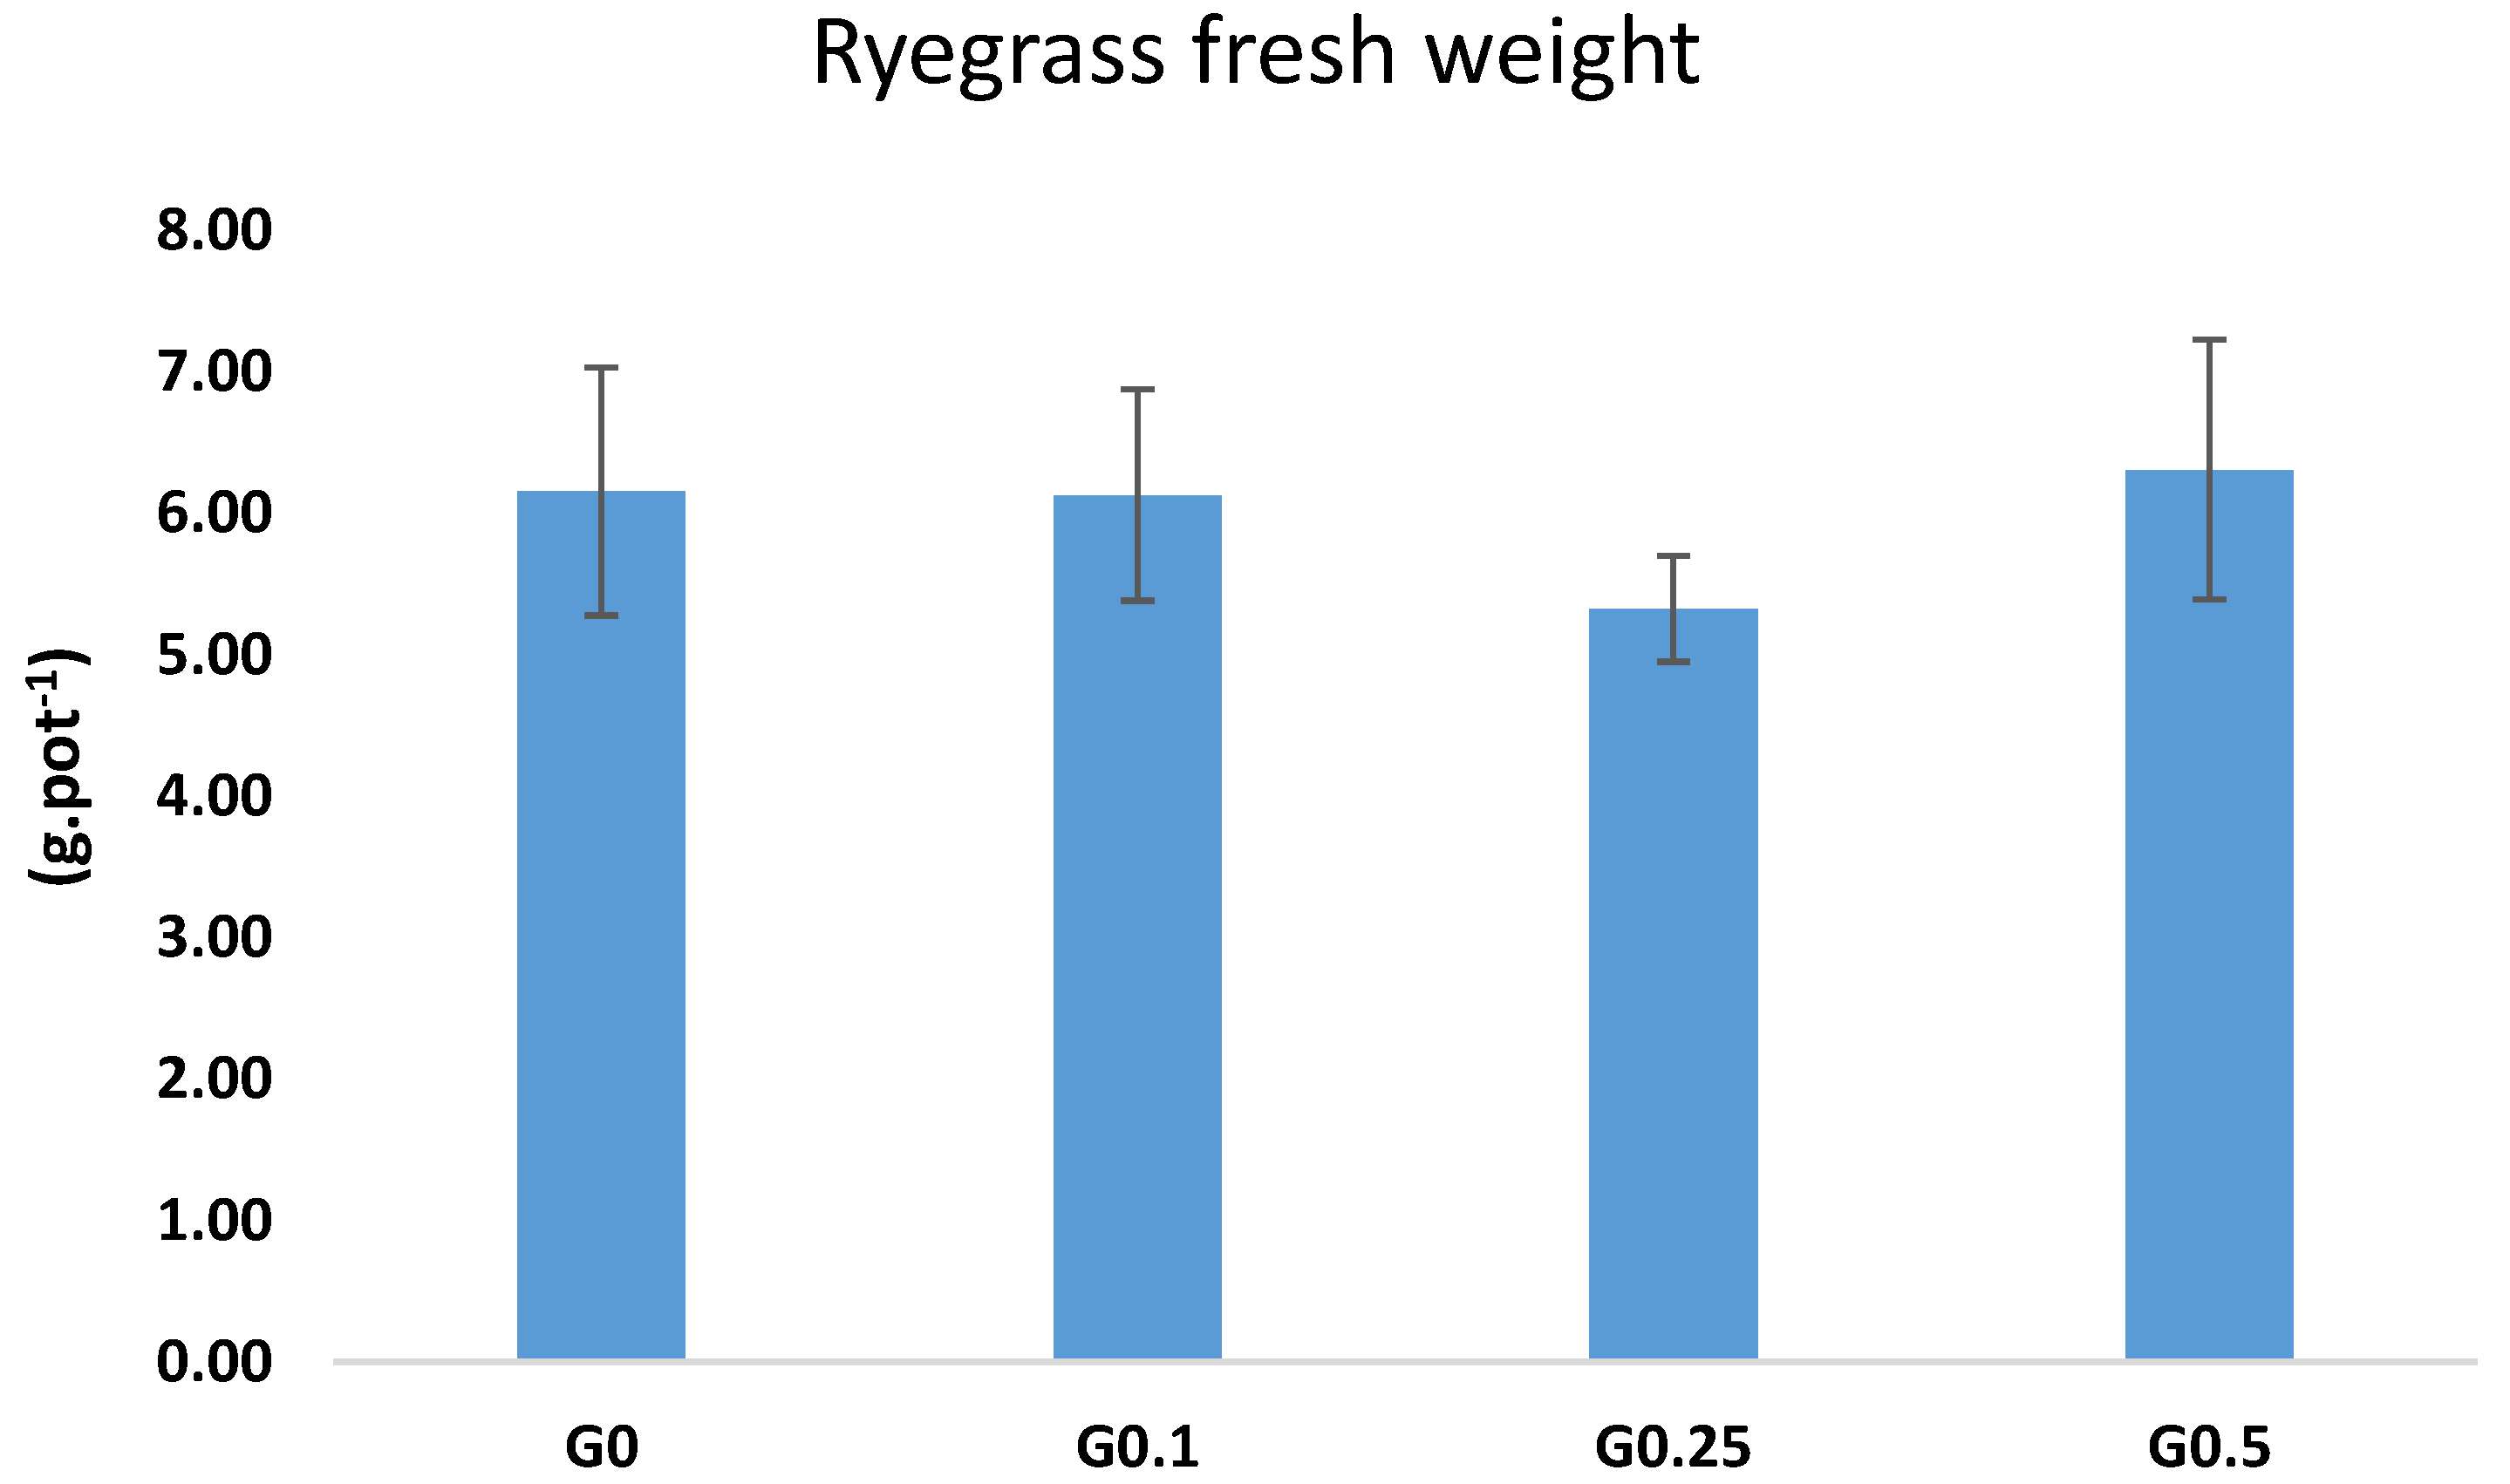
3.3. Ryegrass Fresh Biomass after Irrigation with Biochar Treated Wastewater

The fresh biomass of ryegrass was determined at the end of the pot experiment. Results presented in Figure 1 show that there were no significant differences among the different treatments. Values ranged between 5.32 ± 0.38 g pot−1 in G0.25 and 6.31 ± 0.92 g pot−1 in G0.5.

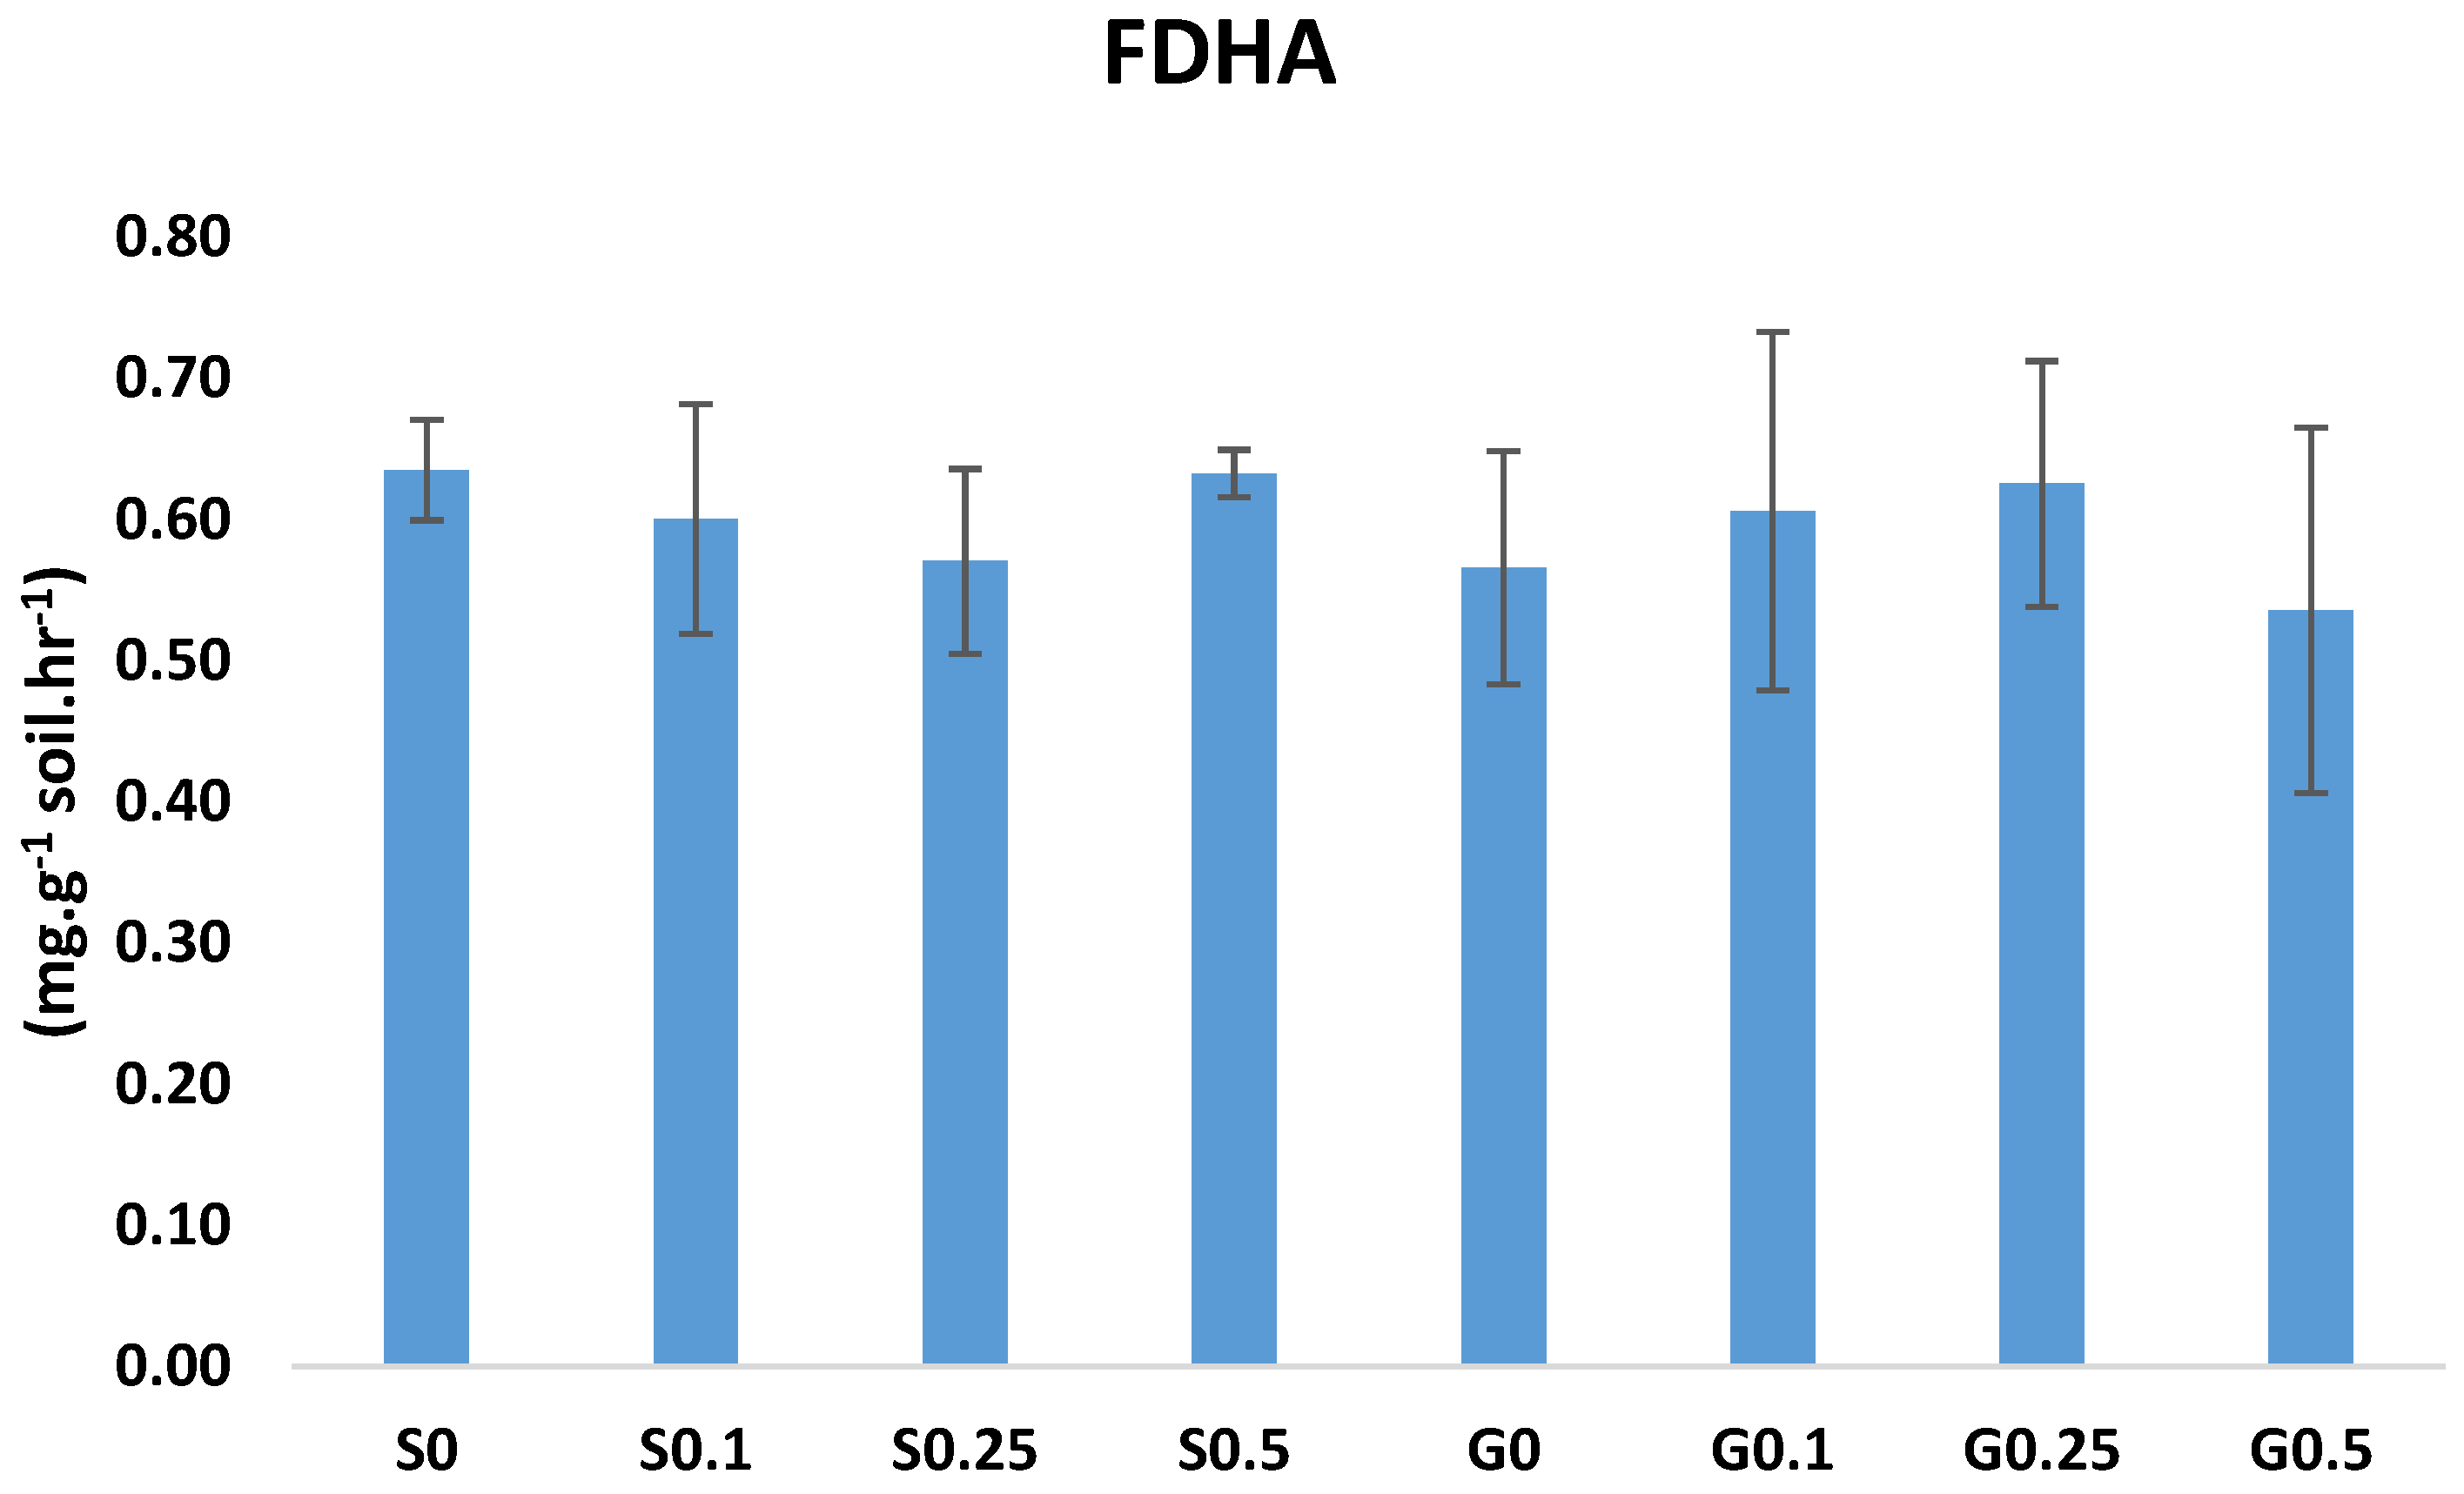
3.4. Fluorescein Diacetate Hydrolytic Activities (FDHA)

The soil microbial activities expressed by the FDHA were examined and the result is shown in Figure 2. No significant differences were noticed among the FDHA results between the different soil treatments. Values fluctuated between 0.54 ± 0.13 mg g−1 soil hr−1 in G0.5 and 0.63 ± 0.04 mg g−1 soil hr−1 in S0.

4. Discussion

4.1. Wastewater Treatments with Biochar

To begin with, it is of pivotal importance to stress the fact that until now, there are no defined legislative limitations on pharmaceutical concentrations in treated wastewaters being discharged into recipient waters or those used for irrigation. Therefore, the importance of this study is that it sheds light on efficient biochar doses to remove maximal pharmaceutical concentrations from the water.
The effective treatment and removal of pharmaceuticals from wastewater is dependent on multiple factors, such as climatic conditions, temperature and hydraulic retention time [18]. Biochar addition had a positive impact by reducing most of the contaminants’ concentrations, and the increase in biochar dose applied also led to further reduction in most contaminants. Generally, higher biochar concentrations affect the adsorption of the contaminant, whether organic or inorganic. However, an optimum amount needs to be achieved for every contaminant to save cost production and avoid exhausting time in application [8]. The results in this study are consistent with results in the literature for pharmaceuticals, including atenolol [19,20], caffeine [13,21], carbamazepine [13,22], tramadol [14] and sulfamethoxazole [23]. However, a contradictory outcome compared to that in the literature was identified for phenazone in which vom Eyser et al. [23] recorded an increase in the concentration of phenazone from 210 ± 33 to 230 ± 6 μg/Kg DM (dry mass). The authors indicated that precursors or structurally similar chemicals in the native sewage sludge may be the cause of the increase.
There were a few cases where the biochar application resulted in the total removal of contaminants. 3-hydroxycarbamazepine is known to be one of the metabolites of carbamazepine. These metabolites are complex because of the properties they possess. 3-hydroxycarbamazepine is a metabolite created from second degradation pathways formed in the human body usually found in urine [24]. A slight decrease in 3-hydroxycarbamazepine was noticed in the wastewater samples after the treatment. Even with the persistence of 3-hydroxycarbamazepine, the increase in biochar quantity tends to adsorb more amounts of this compound and could be assumed to be a good treatment for it. Similarly, metoprolol concentration declined with the increase in the biochar doses. There was a drastic decrease in metoprolol from trt0 to trt0.1 and at trt0.25. Metoprolol was completely removed from the waste water. The result is in harmony with Dalahmeh et al. [13], who identified effective and rapid removal of metoprolol at >99 ± 1% after an initial concentration of 1900 ± 990 ng L−1 with biochar inactive biofilm.
On the other hand, in very few cases, the biochar addition even at the highest dose proved ineffective. Regardless of the quantity of biochar applied, the results showed no significant reduction in bezafibrate, in contrast to vom Eyser et al. [23], where a reduction from 180 ± 8 to <40 μg/kg DM was observed, in which the feedstock of biochar used was from sewage sludge. Moreover, certain contaminants were reduced with the addition of biochar, however, not in a dose-dependent manner. For instance, acridine and diclofenac levels were only reduced significantly with the addition of the lowest quantity of biochar without recording any significant differences upon augmenting the biochar concentration. In contrast, diclofenac is one of the few antibiotics that has shown a significant level of treatment with biochar-based substances based on results from the literature [5]. As shown in the study of vom Eyser et al. [23], there was reduction in diclofenac concentration from 200 μg/kg DM to below the detection limit, in spite of the fact that the biochar feedstock used was from sewage sludge. Primidone, on the other hand, demonstrated a significant gradual reduction with the addition of higher doses of biochar (trt0.25 and trt0.5, without significant differences recorded). In such a case, further increase in biochar might not yield a recognizable difference in its concentration, unless a different biochar is used. Yanala and Pagill [25] showed that the initial concentration of 619 ng L−1 was reduced to 18 ng L−1 and 318 ng L−1 when different types of biochar were used, implying that the biochar origin and properties could contribute to the variations in the fate of pharmaceuticals in wastewaters.

4.2. Pharmaceuticals Concentrations in Soil and Ryegrass

It is noteworthy to mention again that the pharmaceutical concentrations in the plant samples were below the detection limits. Therefore, the results were not demonstrated. Moreover, due to the absence of significant differences between the majority of the pharmaceutical results obtained in the planted and unplanted soils, the discussion will focus on the latter only, yet it is applicable to the former as well.
To begin with, in certain cases, the pharmaceuticals that were not completely removed or reduced during treatment with biochar were not identified in the soil after irrigation. Some contaminants including iopamidol, primidone and bezafibrate were not found in the soil in all the replicates. Bezafibrate, for instance, has a high potential of leaching and is also an easily biodegradable contaminant. The result obtained is in conformity with other studies. For instance, an initial concentration of 0.70 ng L−1 was added to the soil but was found to be below the detection limit after cultivation [26].
Furthermore, acebutolol in soil was evidently reduced compared to the concentration in water. The reduction in concentration could be attributed to the sorption of acebutolol in soil. In a study conducted, 50 and 500 μg L−1 concentrations of acebutolol decreased by 90% through sorption [27]. Acridine concentration, on the other hand, showed a gradual increase in soil for the four treatments. Compared to the concentration in the wastewater, the reduction in acridine in the soil could be a result of its degradation in the soil. In spite of the scarcity of the literature related to acridine degradation, the experiments by Meyer and Steinhart [28] on different soil samples indicated that acridine is very persistent in the soil and has little microbial degradation as well. Carbamazepine and clarithromycin concentrations were extremely low in the soil, contradicting the outcome of other papers that considered these elements to be persistent in soil [21,29]. Moreover, Grossberger et al. [26] showed that there was an increase in soil carbamazepine concentration from 3.6 ng g−1 to 5.67 ng g−1 after the addition of between approximately 1.18 and 2.25 ng L−1 of the substance through irrigation. Therefore, a reasonable amount was expected to be seen in the soil, which was not the case of the present experiment. According to Thelusmond et al. [30], it is true that carbamazepine is quite persistent in soil; however, the slow microbial biodegradation of this pollutant is possible through different phylotypes, such as Bacteroidetes, Actinobacteria, Proteobacteria and Verrucomicrobia. In addition, the low concentrations of some contaminants, such as diclofenac and hydrochlorothiazide, in the soils can be associated with their high to intermediate adsorption and degradation characteristics, while there are conflicting results regarding the degradation and adsorption characteristics of sulfamethoxazole and trimethoprim albeit their low concentrations in the soils [21,26,29,31]. Finally, the distinguished diminution of certain contaminants under the ryegrass plants (acebutolol, phenazone and sulfamethoxazole) in comparison with the unplanted soils could be attributed to the root exudates that play a crucial role in increasing the sorption behavior of biochar towards these pollutants [32] and/or positively enhancing their biodegradation [33].

4.3. Impacts on Plant Biomass and Soil Microbial Activities

The ryegrass fresh biomass results indicated the absence of an impact of the biochar-treated wastewater on the plant growth. This outcome is rather positive, considering the extremely low pharmaceutical concentrations in the soils of different treatments, which indicates that they are uncontaminated to a large extent.
In addition, the FDHA is subjected to and influenced by several factors. For example, optimization methods of FDHA consider the effect of buffer solution pH, incubation temperature, incubation time, shaking during incubation and substrate concentration [16]. In the current work, results showed that the microbial activities in the different soil samples were not significantly different from one another (values fluctuated between 0.54 and 0.63 mg g−1 soil hr−1). The ryegrass effect in the soil was not significant for FDHA analysis in this experiment. Grossberger et al. [26] conducted an experiment for the biodegradability of pharmaceuticals in soils; it was observed that there were no significant differences between the FDHA of soils irrigated with fresh water and secondary treated wastewater after a period of degradation of pharmaceuticals in the soil. The measured FDHA showed no significant difference among the treatments and this could be due to the short vegetation period. According to Wardle and Ghani [34], microbial activity is an indicator of how well soil bacteria uses carbon. However, planting seasons have a greater impact on the FDHA index than the vegetation or soil depth. Thus, field experimentations should validate the current outcome, as results could be overestimated in controlled conditions that permit the optimal plant and microbial performance [35]

5. Conclusions and Perspectives

The main objective of the current work was to assess the capacity of biochar to remove maximal pharmaceutical concentrations from treated wastewater and verify the possibility of using it for agricultural irrigation purposes. The results showed that the majority of the examined pharmaceuticals decreased in concentration in the wastewater with the increase in biochar concentration, suggesting a positive impact of the substrate on the contaminants removal. However, several contaminants with reasonable amounts of concentration were still present even after the application of the highest quantity of biochar (trt0.5 g L−1), indicating that different pharmaceuticals react differently to biochar of the same parameters at analogous or different quantities. Moreover, a drastic reduction in the concentration of most contaminants was noticed in the soil and ryegrass samples, and in certain cases some contaminants were not detected. This reduction could be attributed to adsorption and/or biodegradation. In addition, soil microbial activities were quite similar in all the treatments without tracing any influence of the remaining pharmaceuticals or ryegrass.
To sum up, more research on the quantity of biochar applied in the wastewater treatment of pharmaceutical contaminants should be encouraged. Most of the literature focuses on the adsorption mechanism, adsorption isotherm, adsorption kinetics and biodegradation separately; therefore, an in-depth investigation taking into consideration the interaction and influencing factors of biodegradation and the adsorption of pharmaceuticals with biochar and other substrates in soil with regards to time should be conducted. Finally, field studies comparable to this experiment should be carried out for further understanding, as it was conducted in a controlled environment.

Supplementary Materials

The following supporting information can be downloaded at: https://www.mdpi.com/article/10.3390/agronomy12122987/s1, Part A: Characterization of Biochar 4073, Part B: Justification of biochar choice and concentrations, Part C: Parameters of the soil used in the experiment.

Author Contributions

Conceptualization, M.A. (Mayowa Akintoroye) and K.S.A.S.; methodology, M.A. (Mayowa Akintoroye), S.K., S.H. and K.S.A.S.; software, M.A. (Mayowa Akintoroye) and R.A.N.; validation, P.K. (Peter Krebs), J.T., M.A. (Markus Ahnert) and P.K. (Pavel Krystyník); formal analysis, M.A. (Mayowa Akintoroye), K.S.A.S. and R.A.N.; resources, M.A. (Mayowa Akintoroye) and R.A.N.; data curation, M.A. (Mayowa Akintoroye); writing—original draft preparation, M.A. (Mayowa Akintoroye) and R.A.N.; writing—review and editing, K.S.A.S., M.A. (Markus Ahnert) and J.T.; supervision, P.K. (Peter Krebs), M.A. (Markus Ahnert) and K.S.A.S.; project administration, P.K. (Pavel Krystyník); funding acquisition, J.T. and P.K. (Pavel Krystyník). All authors have read and agreed to the published version of the manuscript.

Funding

Practical stay of Mayowa Akintoroye was funded via Erasmus+ programme. Analyses of pollutants were provided by research infrastructure NanoEnviCZ (https://nanoenvicz.cz/en) supported by the Ministry of Education, Youth and Sports of the Czech Republic (LM2018124). Finally, the wastewater sampling work was supported by the project Smart City—Smart Region—Smart Community (CZ.02.1.01/0.0/0.0/17_048/0007435).

Data Availability Statement

Not applicable.

Conflicts of Interest

The authors declare no conflict of interest.

References

  1. Lowder, S.K.; Skoet, J.; Raney, T. The Number, Size, and Distribution of Farms, Smallholder Farms, and Family Farms Worldwide. World Dev. 2016, 87, 16–29. [Google Scholar] [CrossRef] [Green Version]
  2. Godfray, H.C.J.; Beddington, J.R.; Crute, I.R.; Haddad, L.; Lawrence, D.; Muir, J.F.; Pretty, J.; Robinson, S.; Thomas, S.M.; Toulmin, C. Food Security: The Challenge of Feeding 9 Billion People. Science 2010, 327, 812–818. [Google Scholar] [CrossRef] [PubMed] [Green Version]
  3. Xiang, W.; Zhang, X.; Chen, J.; Zou, W.; He, F.; Hu, X.; Tsang, D.C.W.; Ok, Y.S.; Gao, B. Biochar Technology in Wastewater Treatment: A Critical Review. Chemosphere 2020, 252, 126539. [Google Scholar] [CrossRef] [PubMed]
  4. Wei, D.; Li, B.; Huang, H.; Luo, L.; Zhang, J.; Yang, Y.; Guo, J.; Tang, L.; Zeng, G.; Zhou, Y. Biochar-Based Functional Materials in the Purification of Agricultural Wastewater: Fabrication, Application and Future Research Needs. Chemosphere 2018, 197, 165–180. [Google Scholar] [CrossRef] [PubMed]
  5. Enaime, G.; Lübken, M. Agricultural Waste-based Biochar for Agronomic Applications. Appl. Sci. 2021, 11, 8914. [Google Scholar] [CrossRef]
  6. Liu, X.; Zhang, A.; Ji, C.; Joseph, S.; Bian, R.; Li, L.; Pan, G.; Paz-Ferreiro, J. Biochar’s Effect on Crop Productivity and the Dependence on Experimental Conditions-a Meta-Analysis of Literature Data. Plant Soil 2013, 373, 583–594. [Google Scholar] [CrossRef]
  7. Huggins, T.M.; Haeger, A.; Biffinger, J.C.; Ren, Z.J. Granular Biochar Compared with Activated Carbon for Wastewater Treatment and Resource Recovery. Water Res. 2016, 94, 225–232. [Google Scholar] [CrossRef] [PubMed] [Green Version]
  8. Ambaye, T.G.; Vaccari, M.; van Hullebusch, E.D.; Amrane, A.; Rtimi, S. Mechanisms and Adsorption Capacities of Biochar for the Removal of Organic and Inorganic Pollutants from Industrial Wastewater. Int. J. Environ. Sci. Technol. 2021, 18, 3273–3294. [Google Scholar] [CrossRef]
  9. Foereid, B. Biochar in Nutrient Recycling—The Effect and Its Use in Wastewater Treatment. Open J. Soil Sci. 2015, 5, 39–44. [Google Scholar] [CrossRef] [Green Version]
  10. Enaime, G.; Baçaoui, A.; Yaacoubi, A.; Lübken, M. Biochar for Wastewater Treatment-Conversion Technologies and Applications. Appl. Sci. 2020, 10, 3492. [Google Scholar] [CrossRef]
  11. Deng, Y.; Zhang, T.; Wang, Q. Biochar Adsorption Treatment for Typical Pollutants Removal in Livestock Wastewater: A Review. In Engineering Applications of Biochar; Huang, J.-W., Ed.; IntechOpen: London, UK, 2017. [Google Scholar] [CrossRef] [Green Version]
  12. Ahmed, M.B.; Zhou, J.L.; Ngo, H.H.; Guo, W. Adsorptive Removal of Antibiotics from Water and Wastewater: Progress and Challenges. Sci. Total Environ. 2015, 532, 112–126. [Google Scholar] [CrossRef] [PubMed]
  13. Dalahmeh, S.; Ahrens, L.; Gros, M.; Wiberg, K.; Pell, M. Potential of Biochar Filters for Onsite Sewage Treatment: Adsorption and Biological Degradation of Pharmaceuticals in Laboratory Filters with Active, Inactive and No Biofilm. Sci. Total Environ. 2018, 612, 192–201. [Google Scholar] [CrossRef]
  14. Mojiri, A.; Baharlooeian, M.; Kazeroon, R.A.; Farraji, H.; Lou, Z. Removal of Pharmaceutical Micropollutants with Integrated Biochar and Marine Microalgae. Microorganisms 2021, 9, 4. [Google Scholar] [CrossRef] [PubMed]
  15. Tolaszová, J. Organic pollutants in sediments of selected Czech rivers. Ph.D. Thesis, University of Jan Evangelista in Ústí nad Labem, Ústí nad Labem, Czech Republic, 2019. [Google Scholar]
  16. Green, V.S.; Stott, D.E.; Diack, M. Assay for Fluorescein Diacetate Hydrolytic Activity: Optimization for Soil Samples. Soil Biol. Biochem. 2006, 38, 693–701. [Google Scholar] [CrossRef]
  17. Al Souki, K.S.; Burdová, H.; Mamirova, A.; Kuráň, P.; Kříženecká, S.; Oravová, L.; Tolaszová, J.; Nebeská, D.; Popelka, J.; Ust’ak, S.; et al. Evaluation of the Miscanthus × Giganteus Short Term Impacts on Enhancing the Quality of Agricultural Soils Affected by Single and/or Multiple Contaminants. Environ. Technol. Innov. 2021, 24, 101890. [Google Scholar] [CrossRef]
  18. Shraim, A.; Diab, A.; Alsuhaimi, A.; Niazy, E.; Metwally, M.; Amad, M.; Sioud, S.; Dawoud, A. Analysis of Some Pharmaceuticals in Municipal Wastewater of Almadinah Almunawarah. Arab. J. Chem. 2017, 10, S719–S729. [Google Scholar] [CrossRef] [Green Version]
  19. Ahmad, A.A.; Din, A.T.M.; Yahaya, N.K.E.M.; Karim, J.; Ahmad, M.A. Atenolol Sequestration Using Activated Carbon Derived from Gasified Glyricidia Sepium. Arab. J. Chem. 2020, 13, 7544–7557. [Google Scholar] [CrossRef]
  20. Venditti, S.; Brunhoferova, H.; Hansen, J. Behaviour of 27 Selected Emerging Contaminants in Vertical Flow Constructed Wetlands as Post-Treatment for Municipal Wastewater. Sci. Total Environ. 2022, 819, 153234. [Google Scholar] [CrossRef] [PubMed]
  21. Biel-Maeso, M.; Corada-Fernández, C.; Lara-Martín, P.A. Monitoring the Occurrence of Pharmaceuticals in Soils Irrigated with Reclaimed Wastewater. Environ. Pollut. 2018, 235, 312–321. [Google Scholar] [CrossRef]
  22. Ahmed, M.B.; Zhou, J.L.; Ngo, H.H.; Guo, W.; Chen, M. Progress in the Preparation and Application of Modified Biochar for Improved Contaminant Removal from Water and Wastewater. Bioresour. Technol. 2016, 214, 836–851. [Google Scholar] [CrossRef] [PubMed]
  23. Vom Eyser, C.; Palmu, K.; Schmidt, T.C.; Tuerk, J. Pharmaceutical Load in Sewage Sludge and Biochar Produced by Hydrothermal Carbonization. Sci. Total Environ. 2015, 537, 180–186. [Google Scholar] [CrossRef]
  24. Bahlmann, A.; Brack, W.; Schneider, R.J.; Krauss, M. Carbamazepine and Its Metabolites in Wastewater: Analytical Pitfalls and Occurrence in Germany and Portugal. Water Res. 2014, 57, 104–114. [Google Scholar] [CrossRef] [PubMed]
  25. Yanala, S.R.; Pagilla, K.R. Use of Biochar to Produce Reclaimed Water for Irrigation Use. Chemosphere 2020, 251, 126403. [Google Scholar] [CrossRef] [PubMed]
  26. Grossberger, A.; Hadar, Y.; Borch, T.; Chefetz, B. Biodegradability of Pharmaceutical Compounds in Agricultural Soils Irrigated with Treated Wastewater. Environ. Pollut. 2014, 185, 168–177. [Google Scholar] [CrossRef] [PubMed]
  27. Lin, A.Y.C.; Lin, C.A.; Tung, H.H.; Chary, N.S. Potential for Biodegradation and Sorption of Acetaminophen, Caffeine, Propranolol and Acebutolol in Lab-Scale Aqueous Environments. J. Hazard. Mater. 2010, 183, 242–250. [Google Scholar] [CrossRef] [PubMed]
  28. Meyer, S.; Steinhart, H. Effects of Heterocyclic PAHs (N, S, O) on the Biodegradation of Typical Tar Oil PAHs in a Soil/Compost Mixture. Chemosphere 2000, 40, 359–367. [Google Scholar] [CrossRef] [PubMed]
  29. Gworek, B.; Kijeńska, M.; Wrzosek, J.; Graniewska, M. Pharmaceuticals in the Soil and Plant Environment: A Review. Water Air Soil Pollut. 2021, 232, 145. [Google Scholar] [CrossRef]
  30. Thelusmond, J.R.; Kawka, E.; Strathmann, T.J.; Cupples, A.M. Diclofenac, carbamazepine and triclocarban biodegradation in agricultural soils and the microorganisms and metabolic pathways affected. Sci. Total Environ. 2018, 640, 1393–1410. [Google Scholar] [CrossRef] [PubMed]
  31. Biel-Maeso, M.; González-González, C.; Lara-Martín, P.A.; Corada-Fernández, C. Sorption and Degradation of Contaminants of Emerging Concern in Soils under Aerobic and Anaerobic Conditions. Sci. Total Environ. 2019, 666, 662–671. [Google Scholar] [CrossRef] [PubMed]
  32. Li, X.; Song, Y.; Bian, Y.; Wang, F.; Gu, C.; Yang, X.; Jiang, X. Effects of root exudates on the sorption of polycyclic aromatic hydrocarbons onto biochar. Env. Pollut. Bioavail. 2019, 31, 156–165. [Google Scholar] [CrossRef] [Green Version]
  33. Casas, M.E.; Larzabal, E.; Matamoros, V. Exploring the usage of artificial root exudates to enhance the removal of contaminants of emerging concern in slow sand filters: Synthetic vs. real wastewater conditions. Sci. Total Environ. 2022, 824, 153978. [Google Scholar] [CrossRef] [PubMed]
  34. Wardle, D.A.; Ghani, A.A. Critique of the Microbial Metabolic Quotient (Qc02) as a Bioindicator of Disturbance and Ecosystem Development. Soil Biol. Biochem. 1995, 27, 1601–1610. [Google Scholar] [CrossRef]
  35. Al Souki, K.S.; Liné, C.; Moravec, J.; Douay, F.; Pourrut, B. Response of Three Miscanthus × giganteus Cultivars to Toxic Elements Stress: Part 2, Comparison between Two Growing Seasons. Plants 2022, 11, 945. [Google Scholar] [CrossRef] [PubMed]
Figure 1. Ryegrass fresh weight (g pot−1) in soils (G0, G0.1, G0.25, G0.5) after irrigation by the biochar-treated wastewater at different concentrations (0, 0.1, 0.25 and 0.5 g L−1). Values represent means ± standard deviations (n = 4, p ≤ 0.05).
Agronomy 12 02987 g001
Figure 2. FDHA (mg g−1 soil hr−1) in soil without ryegrass (S0, S0.1, S0.25, S0.5) and with ryegrass (G0, G0.1, G0.25, G0.5) after irrigation by the biochar-treated wastewater at different concentrations (0, 0.1, 0.25 and 0.5 g L−1). Values represent means ± standard deviations (n = 4, p ≤ 0.05).
Agronomy 12 02987 g002
Table 1. General parameters of wastewater examined: pH, Biochemical Oxygen Demand (BOD), Chemical Oxygen Demand (COD), Total Suspended Solid (TSS), Total Nitrogen, Total Phosphorus, Total Organic Carbon (TOC). Values represent means ± standard deviations (n = 3).
ParameterStandard ProtocolConcentration (mg L−1)
pHČSN ISO 10523, 7573657.2 ± 0.1
Biochemical Oxygen Demand (BOD)ČSN EN ISO 5815-1, ČSN EN 1899-23.6 ± 0.1
Chemical Oxygen Demand (COD)ČSN ISO 1570534.0 ± 0.6
Total suspended solid (TSS)ČSN EN 872, ČSN 75 735021.0 ± 1.0
Total nitrogenČSN ISO 1570516.0 ± 1
Total phosphorusČSN EN ISO 68781.8 ± 0.1
Total organic carbonČSN EN 148416.0 ± 0.7
Table 2. Properties of biochar. Values represent means ± standard deviations (n = 3).
ParameterValue
pH solution (H2O)10.0 ± 0.8
Functional groups (-COOH, -OH) (mmol g−1)0.386 ± 0.02
Area of micropores (m2 g−1)325.7 ± 30.3
Brunauer–Emmett–Teller (BET) surface area (m2 g−1)571.6 ± 9.2
Table 3. Pharmaceuticals concentrations after biochar addition at different concentrations (0, 0.1, 0.25 and 0.5 g L−1). Values represent means ± standard deviations. Different letters refer to significant differences between the values (Tukey HSD test, n = 3, p ≤ 0.05).
ContaminantConcentration at Treatment Level (ng L−1)
trt0trt0.1trt0.25trt0.5
3-Hydroxycarbamazepine88.9 ± 8 a34.9 ± 3.3 b<25 ± 5 c<25 ± 5 c
Acebutolol184 ± 16.7 a84.9 ± 7 b60.7 ± 4.1 bc41.6 ± 4.3 c
Acridine255 ± 21 a230 ± 15.9 ab212 ± 22.4 abc203 ± 10.7 bc
Atenolol104 ± 10.8 a94.2 ± 8.8 ab78.3 ± 5.7 bc68.2 ± 6.6 c
Bezafibrate72.3 ± 4.5 a70.9 ± 4.2 a70.7 ± 4.1 a69.6 ± 3.9 a
Caffeine29,191 ± 838 a20,109 ± 422 b11,664 ± 333 c3247 ± 249 d
Carbamazepine543 ± 29 a209 ± 21.9 b109 ± 9.9 c53 ± 4.6 d
Clarithromycin1070 ± 114 a673 ± 35 b227 ± 15.4 c112 ± 10.3 c
Diclofenac2195 ± 139 a132 ± 9.5 b261 ± 22.2 b130 ± 9 b
Hydrochlorothiazide2972 ± 194 a1898 ± 80 b890 ± 78 c410 ± 22 d
Iopamidol25,667 ± 133 a24,920 ± 984 ab17,879 ± 576 c15,014 ± 301 d
Metoprolol346 ± 29.3 a135 ± 7 b<25 ± 5 c<25 ± 5 c
N-acetylsulfamethoxazole2514 ± 103 a2341 ± 168 a2263 ± 53 a1226 ± 45 b
Pentoxifylline172 ± 14.4 a129 ± 8.8 b94 ± 8.8 c66.9 ± 5.4 d
Phenazone1121 ± 24 a964 ± 62 b583 ± 27 c251 ± 20 d
Primidone180 ± 16.1 a157 ± 11.4 a124 ± 8.8 b100 ± 10 b
Sulfamethoxazole236 ± 17.2 a173 ± 14.5 b185 ± 17 bc147 ± 9.5 c
Tramadol1057 ± 81 a836 ± 67 b599 ± 20 c381 ± 16.1 d
Trimethoprim467 ± 33.3 a205 ± 11 b77.7 ± 5.5 c34.3 ± 2.9 c
Venlafaxine594 ± 29 a420 ± 23.9 b259 ± 11.7 c124 ± 4.7 d
Table 4. Pharmaceutical concentrations in soil without ryegrass (S0, S0.1, S0.25, S0.5) and with ryegrass (G0, G0.1, G0.25, G0.5) after irrigation by the biochar-treated wastewater at different concentrations (0, 0.1, 0.25 and 0.5 g L−1). Values represent means ± standard deviations. Different letters refer to significant differences between the values (Tukey HSD test, n = 4, p ≤ 0.05).
ContaminantConcentration in Soil (ng g−1)
S0S0.1S0.25S0.5G0G0.1G0.25G0.5
Acebutolol0.26 ± 0.01 a0.17 ± 0.01 abc0.24 ± 0.02 a0.18 ± 0.03 ab0.19 ± 0.00 ab0.11 ± 0.03 abc<0.08 ± 0.00 c<0.08 ± 0.00 c
Acridine1.24 ± 0.07 a1.45 ± 0.23 a1.45 ± 0.28 a1.77 ± 0.37 a1.87 ± 0.40 a1.78 ± 0.43 a1.83 ± 0.41 a1.84 ± 0.67 a
Caffeine7.82 ± 1.77 a7.56 ± 1.69 a7.59 ± 0.86 a7.59 ± 0.80 a7.99 ± 0.75 a8.65 ± 1.60 a7.53 ± 0.82 a7.35 ± 0.43 a
Carbamazepine 0.56 ± 0.08 a0.41 ± 0.08 a0.35 ± 0.06 a0.29 ± 0.02 a0.55 ± 0.04 a0.37 ± 0.09 a0.32 ± 0.06 a0.25 ± 0.02 a
Clarithromycin1.76 ± 0.63 a1.20 ± 0.14 a1.25 ± 0.83 a0.93 ± 0.49 a2.25 ± 1.59 a0.93 ± 0.23 a0.61 ± 0.07 a0.62 ± 0.04 a
Hydrochlorothiazide1.63 ± 0.50 a0.90 ± 0.27 a0.70 ± 0.34 a0.43 ± 0.05 a1.99 ± 0.34 a0.97 ± 0.39 a0.58 ± 0.36 a0.23 ± 0.17 a
N-acetylsulfamethoxazole2.42 ± 0.19 a2.30 ± 0.37 a2.37 ± 0.47 a2.19 ± 0.27 a2.25 ± 0.20 a2.32 ± 0.31 a2.72 ± 0.33 a2.39 ± 0.28 a
Phenazone1.21 ± 0.30 ab0.76 ± 0.12 ab0.74 ± 0.23 ab0.74 ± 0.14 ab1.45 ± 0.69 a0.98 ± 0.47 ab0.87 ± 0.43 ab0.57 ± 0.16 b
Sulfamethoxazole0.51 ± 0.05 ab0.42 ± 0.02 ab0.32 ± 0.16 ab0.22 ± 0.03 ab0.65 ± 0.03 a0.43 ± 0.02 ab0.38 ± 0.02 ab<0.08 ± 0.00 b
Tramadol1.03 ± 0.61 a0.57 ± 0.24 ab0.54 ± 0.33 ab0.21 ± 0.05 b0.36 ± 0.21 b0.49 ± 0.23 ab0.17 ± 0.05 b0.11 ± 0.05 b
Trimethoprim0.40 ± 0.01 a0.27 ± 0.04 a0.21 ± 0.09 a0.16 ± 0.09 a0.42 ± 0.32 a0.37 ± 0.32 a0.16 ± 0.09 a<0.08 ± 0.00 a
Venlafaxine0.51 ± 0.09 a0.44 ± 0.05 a0.44 ± 0.17 a0.53 ± 0.40 a0.44 ± 0.35 a0.36 ± 0.07 a0.24 ± 0.04 a0.27 ± 0.09 a
Publisher’s Note: MDPI stays neutral with regard to jurisdictional claims in published maps and institutional affiliations.

