Article

Transfer Learning with Convolutional Neural Networks for Cider Apple Varieties Classification

by
Silverio García Cortés
1,*,
Agustín Menéndez Díaz
2,
José Alberto Oliveira Prendes
3 and
Antonio Bello García
2
1
Cartographic Engineering Area, University of Oviedo, 33600 Mieres, Spain
2
Construction and Manufacturing Engineering Dept, University of Oviedo, 33203 Gijón, Spain
3
Organisms and Systems Biology Dept, University of Oviedo, 33071 Oviedo, Spain
*
Author to whom correspondence should be addressed.
Agronomy 2022, 12(11), 2856; https://doi.org/10.3390/agronomy12112856
Submission received: 12 October 2022 / Revised: 9 November 2022 / Accepted: 11 November 2022 / Published: 15 November 2022
(This article belongs to the Section Precision and Digital Agriculture)

Abstract

:
Cider production requires detailed knowledge of the apple varieties used. Of the hundreds of varieties of cider and dessert apples in Spain, only a few are accepted for producing cider under the “Sidra de Asturias” protected designation of origin. The visual characteristics of many of these varieties are very similar, and only experts can distinguish them. In this study, an artificial intelligence system using Transfer Learning techniques was developed for classifying some Asturian apple varieties. The performance of several convolutional neural network architectures was compared for classifying an image database created by the authors that included nine of the most common apple varieties. The best overall accuracy (98.04%) was obtained with the InceptionV3 architecture, thus demonstrating the reliability of the classification system, which will be useful for all cider or apple producers.

1. Introduction

The renewed involvement in cider production of veteran apple orchards in the northwest of Spain requires the development of tools to enable the unambiguous and rapid identification of apple varieties. In most cases, marketing these products requires certification that the fruit conforms to a particular variety or is specific to a particular geographical area.
Many plant testing agencies focus on improving fruit and vegetable varieties (to make them more resistant to pests and to improve durability and yields) and chemical characterization of different cultivars. This is especially important for improving apple varieties used to produce cider to control the organoleptic characteristics (aroma, flavour, colour, appearance and gas attributes) of the final product. However, promoting knowledge of already existing varieties and preserving their uniqueness and variability is also necessary.
Organic traceability and preferential consumption of local products should encourage the recovery of veteran apple orchards (“pumaradas”) in rural areas. In the Asturias region (NW Spain), these orchards were actively maintained in the past, as they were linked to the production of artisanal cider. However, they have gradually been abandoned. Artificial intelligence tools are needed to recover knowledge lost over the years, with the gradual reduction in the number of people familiar with rural tasks.
Classification systems that enable the objective identification of apple varieties are required to study the most productive varieties systematically and to gain a more detailed knowledge of the environment in general. Classification systems are generally based on chemical patterns (acidity and phenolic content). However, the characterization is usually costly (in both time and money) and is not generally within reach of rural growers. Other morphological criteria (colour, shape, size, texture, hardness) are more subjective and depend on a wide range of factors (state of ripening, climatic conditions in the area where the plantation is located, etc.). Regarding shape parameters, morphological criteria of sphericity, symmetry and size have also been established and measured on ripe fruit in the laboratory to identify the different varieties. The morphology of the body of the apple and the size of the ocular and pendulous bowl are usually measured, establishing intervals within which the different varieties range. These parameters are compared with other chemical or physical parameters also laboratory-measured parameters, which, although very precise, largely depend on fruit ripeness (hardness/resistance to puncture, degree of acidity, sugar content, pH, presence of starch, etc.) [1]. In this study, we attempted to determine whether an artificial intelligence technology such as convolutional neural networks (CNNs) could reliably distinguish varieties of apples with very similar morphologies from images alone.
Computer vision, image processing, machine learning and deep learning techniques have been applied in the last fifteen years to similar problems in the fruit and vegetable sector (for a summary of these techniques, see [2]). In general, the techniques belong to the field of Machine Learning and have focused on two problems: classification of the type of fruit (or vegetables in general) and classification of the external quality of the fruit with a view to commercialization.
In recent years, machine learning techniques have begun to be replaced by neural networks and especially CNNs. Regarding the classification of fruit types [3] and the classification of fruit quality [4,5,6], the accuracies of these neural networks generally exceed those of machine learning techniques. In this study, the problem is even more specific than the fruit quality estimation and focuses on classifying nine common apple varieties grown in traditional orchards in the Principality of Asturias and used to produce natural cider. Few studies focus on classifying varieties of a single type of fruit, as in this case (e.g., [7]). Neural networks can be used to recognize plants [8] and fruit [9] on the basis of morphological criteria, replacing human expert knowledge and machine learning techniques. CNNs also have other applications involving the detection of specific features, such as yield estimation [10], detection of weeds in grass [11], detection of flowers on trees [12] and classification of dual-class apple-bud types [13]. In the present case, we attempted to identify seven cider apple varieties and two dessert apple varieties, from among nine varieties of apple, on the basis of their morphological appearance alone.
Different approaches are used within neural network applications. We have chosen CNNs and, more specifically, transfer learning techniques based on available architectures with high accuracy rates obtained in competitions with much larger databases such as [14]. This paper proves the ability of convolutional neural networks to perform classifications of nine apple varieties with very subtle visual appearance differences. We advise on the best public CNN architectures available for the work and show the best strategies to achieve high accuracy values during the Transfer Learning process. The article is structured as follows: Section 2 describes the creation of the image database used in the training and validation of the neural network; it also describes the architectures and networks used and the Transfer Learning techniques. Section 3 presents the results in detail and discusses the different tests performed. Section 4 presents the study conclusions.

2. Materials and Methods

2.1. Study Area

The study was carried out in an apple orchard in the municipality of Siero (Asturias). The orchard includes about 150 apple trees grafted on seedling rootstocks, distributed in a plot of 8000 m2 (Figure 1). The plantation is typical of medium-sized farms in rural environments in Asturias, where apple growing for the production of natural cider complements other agricultural and livestock activities.
The surface qualities of the fruit cannot be determined in previous stages of development, as the colour, shape, texture and size are only fixed at the end of the ripening process. Therefore, this study was carried out on mature apple specimens collected from the trees (Figure 2). Photographs of the samples were taken in a controlled environment, in lightboxes. Of the 150 available trees, a study was made of the varieties available on this farm, with samples taken in different years, because in one year, the varieties that were in the alternate bearing stage produced apples the following year.
The following apple varieties growing in the orchard under study were identified: ‘BLANQUINA’ ‘CARRIO’ ‘FLORINA’ ‘FUENTES’ ‘PRIETA’ ‘RAXAO’ ‘REINETA ENCARNADA’ ‘REINETA PINTA’ ‘REINETA ROJA DEL CANADA’. Of the varieties found in the sampling years, not enough fruit specimens with sufficient development in their specific characteristics of each variety were obtained due to deficient fruit sets (trees in alternate bearing years or affected by pests). Likewise, some of the trees on this farm are multi-grafted trees, with grafts of different varieties on the same trunk; these were not considered in the study.
The coexistence of cider apples and dessert apples on the same plantation [15] is very common in traditional orchards. It is important to classify the two dessert varieties indicated (Florina and Reineta Roja del Canadá) to exclude them from being marketed for cider with the “Sidra de Asturias” protected denomination of origin (PDO) status (Consejo Regulador DOP: “Sidra de Asturias,” n.d.). Bearing in mind that of the 2000 varieties of apple existing in the north of Spain, only 76 are “Sidra de Asturias” PDO, the use of systematic classification methods is very important and often depends on the work of nurseries and controls carried out by local producers. Although there are no rigorous studies on this aspect, in our experience, we appreciate that a human operator accustomed to working with local apple varieties may be able to visually distinguish up to 80% of the varieties used in the production of PDO cider. The introduction of automated techniques is required to speed up these identification tasks. This requirement is expected to become more important in the future due to potential new international export markets for cider apples [16].

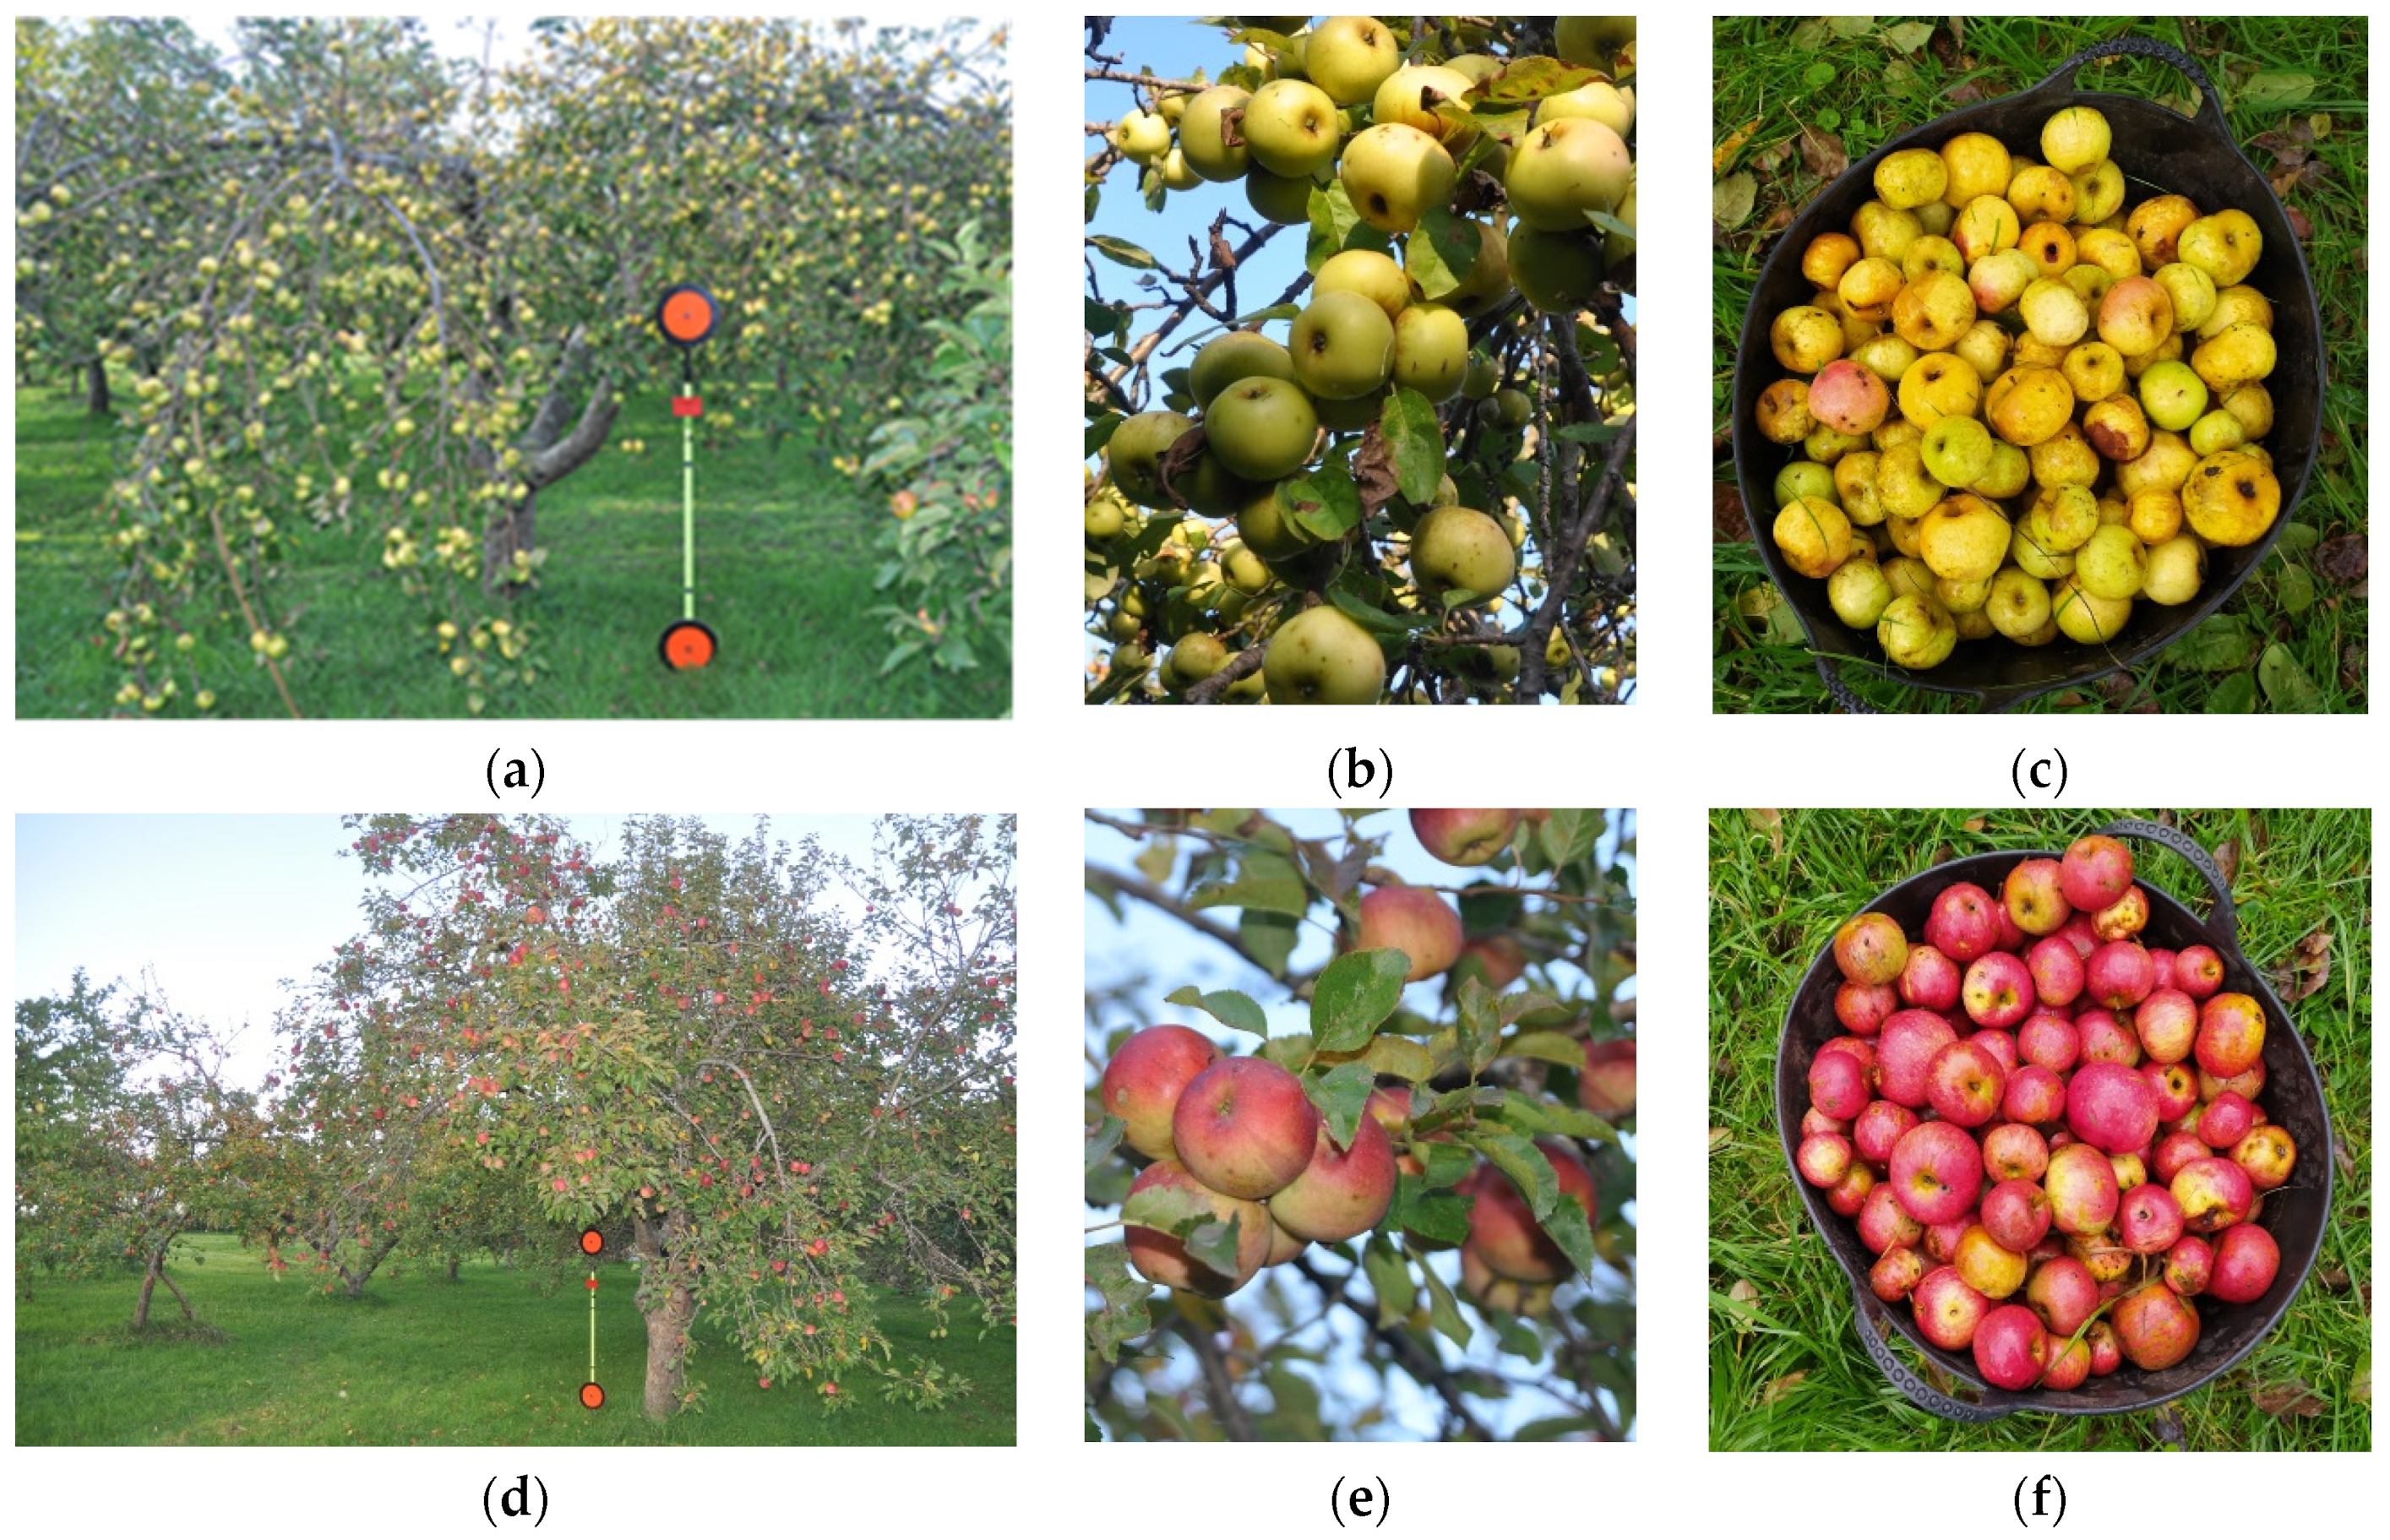
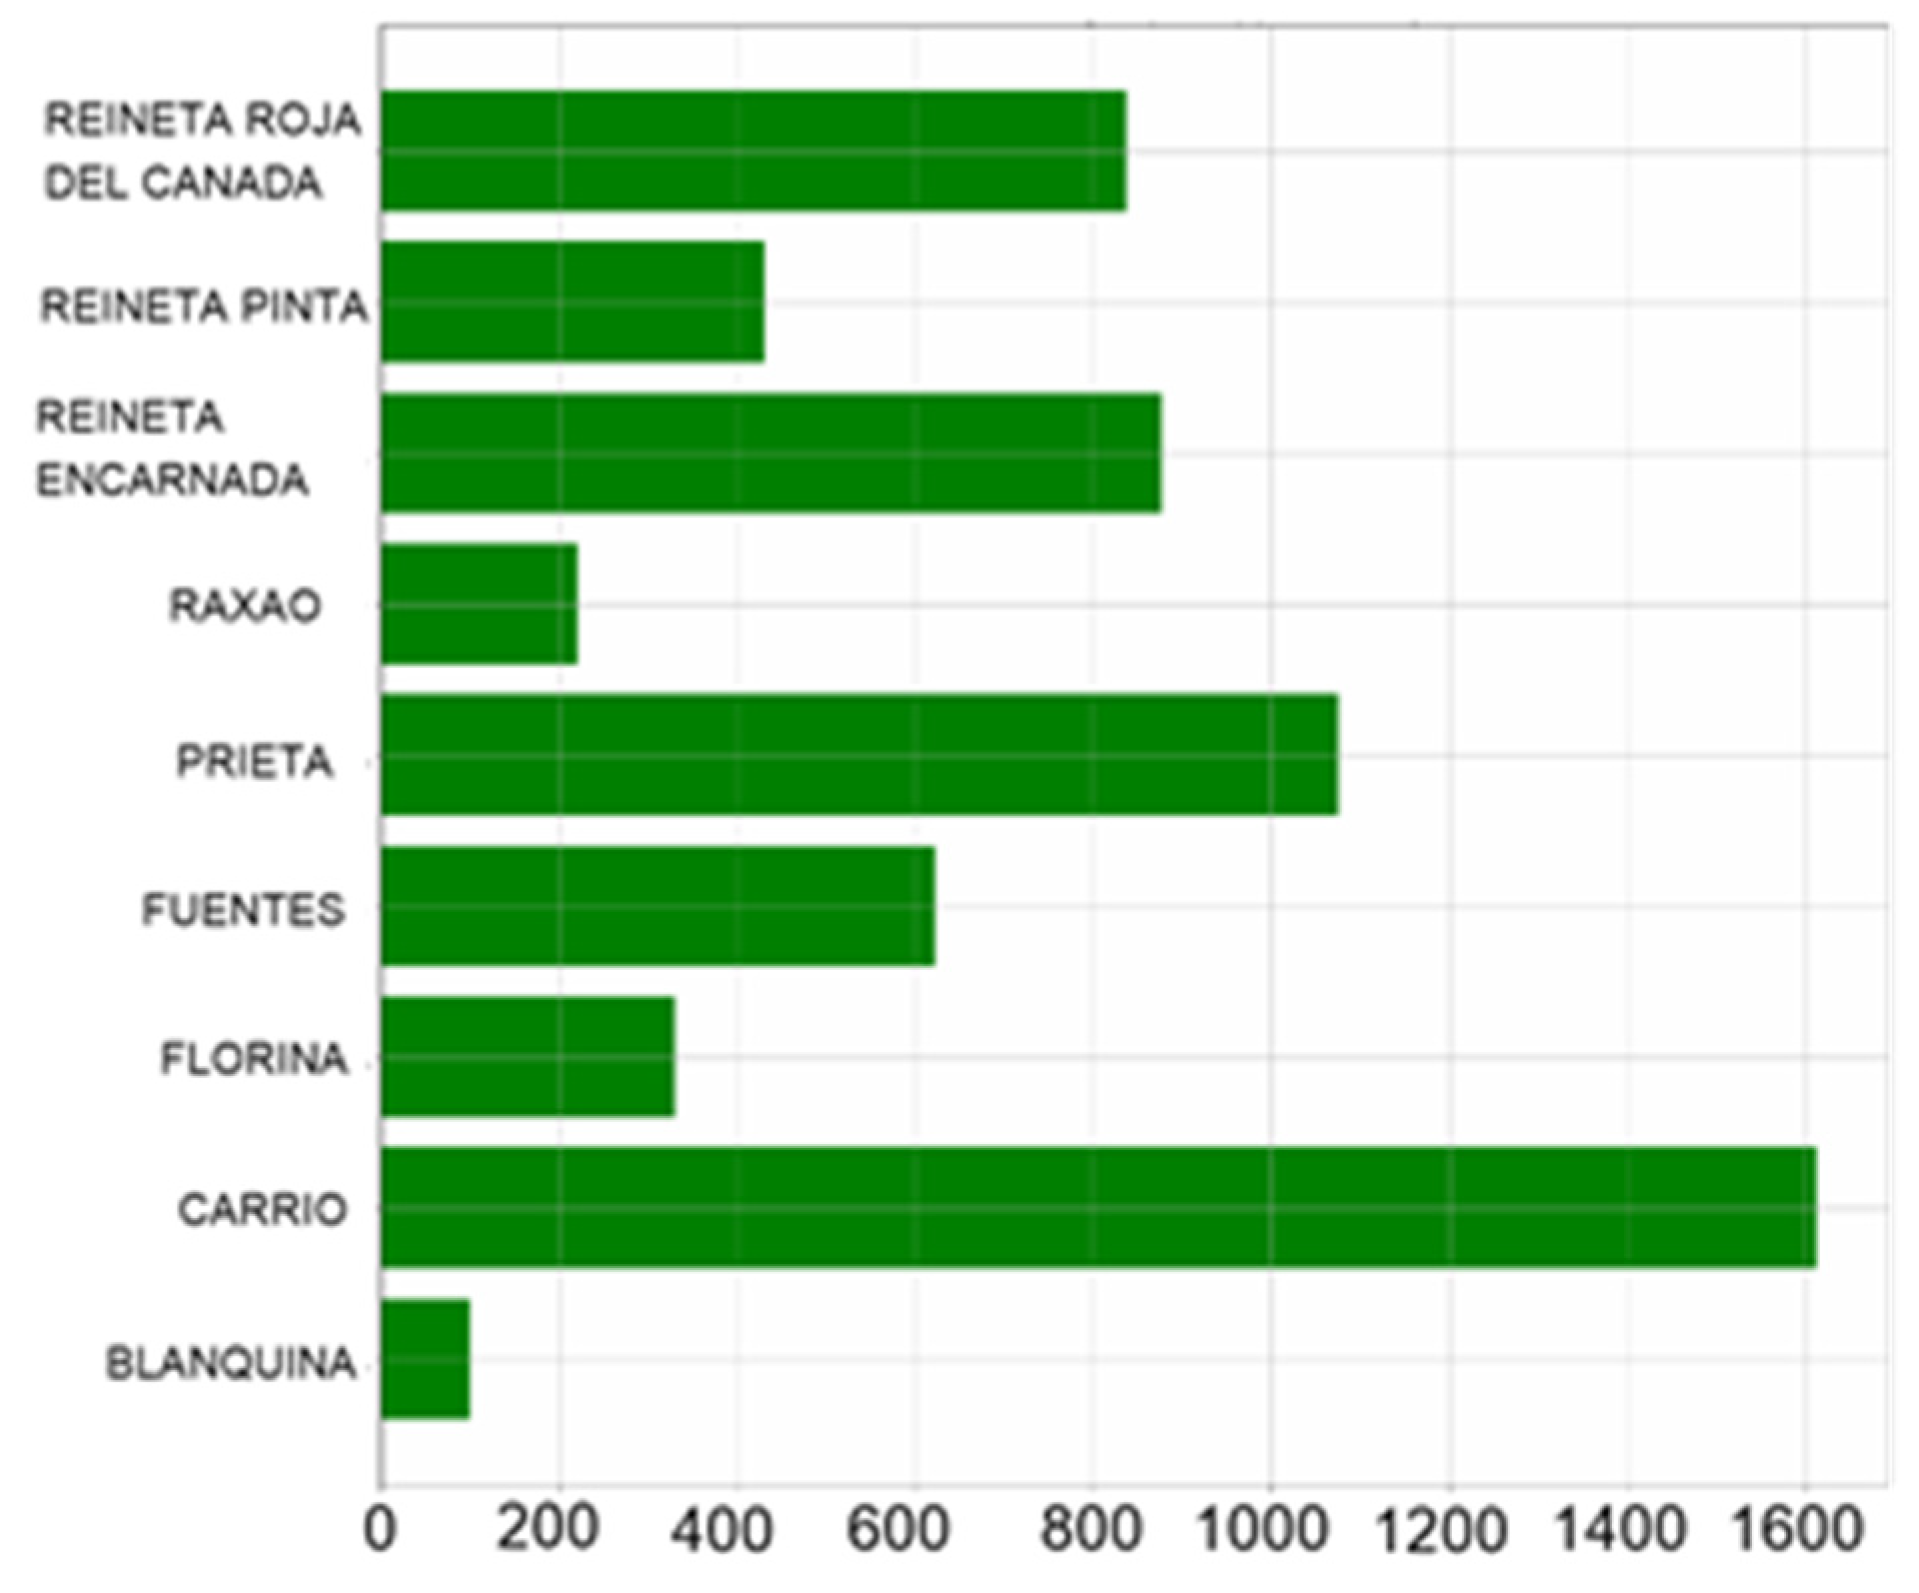
2.2. Apple Image Data

Images of harvested apples were obtained in a reasonably controlled natural light environment, and a light box was used to decontextualise the image of the apple relative to its surroundings. A series of standard samples were selected and successively photographed in a lightbox with a Nikon D90 camera with a 35 mm f/1.8 G lens. The selected samples and the photographic equipment used are shown in Figure 3.
The apples were previously classified by experts who examined the fruit on the trees and after harvesting. The same experts selected the sample fruit during the study. The positions (Pos1, Pos2, Pos3 and Pos4) from which where photographs were taken are illustrated in Figure 4.
Each of the selected specimens was processed by taking one photo from the top (peduncle area, Pos1), one from the bottom (eye area Pos2), and four to six pictures from positions 3, 4 and 5 (front, peduncle up and peduncle down respectively) depending on the symmetry and quality state of each apple specimen. For each specimen, a minimum of 14 photos were taken. The position of each photo is schematically indicated in Figure 4. When several photographs were taken from positions Pos3, Pos4 and Pos5, the apple was successively rotated around its vertical axis E1.
Of the global set of images, 611 were reserved for validation and 611 were reserved for testing; the others (4.886) were used for neural network training. The validation samples were not used in training the network but were used to obtain validation estimators of the model during the epochs to select the best architecture of the convolutional neural network and hyperparameter tuning. The test samples were completely independent of both training and choice of architecture, and other model parameters were kept constant (as are the set of validation images) in all tests to enable a realistic comparison of results obtained with different architectures.
During training, the “data augmentation” technique was used to generate new “synthetic” samples from the available samples. In this process, only rotations of the images with a rotation interval of 20° and horizontal mirroring of the images were used to increase the number of samples. This technique is very common when the original data sets are not too large. The set of images to be classified correspond to nine Asturian apples considered “traditional” varieties: ‘BLANQUINA’ ‘CARRIO’ ‘FLORINA’ ‘FUENTES’ ‘PRIETA’ ‘RAXAO’ ‘REINETA ENCARNADA’ ‘REINETA PINTA’ ‘REINETA ROJA DEL CANADA’. The number of images available per class is shown below (Figure 5). The larger number of images in the “Carrió” class is due to a higher frequency of this class in the trees in the study orchard. However, the ratio of the number of samples of this class relative to the others did not reach extreme values (higher than 10×), and the data can be considered not unbalanced.
Figure 6 includes some sample images corresponding to each variety, photographed from Pos1, Pos3 and Pos4:
The images were reduced during pre-processing to dimensions of 224 × 224 pixels, as this is considered to retain the relevant information on the morphological characteristics of the apples and is also frequently used in some of the convolutional network models such as VGG16. The original image was not reduced to a square format by direct scaling (which would distort the geometry of the apples in the image) but by previously removing a portion of the background (approximately 1/3 of the image width) to produce a square remainder which was then scaled to 224 × 224 pixels. This operation was performed automatically for all 6108 images and was facilitated by the fact that the images are always captured in landscape format and with the apples in an approximately central position. However, although some of the images of the apples may have been slightly cropped, this would not affect the results because the inherent translation invariance of the convolutional layers, will not be modified as it also represents a real scenario in the future automatic detection of fruit on trees. For comparison between different network architectures, the training, validation and test sets were chosen randomly and stored in an hdf5 format file for use in all the tests in this study.

2.3. Convolutional Neural Networks: Architecture and Training

The first training tests were run with an architecture designed by the authors, consisting of six 2D convolution layers followed by a MaxPooling layer each and finishing with three dense layers suitable for multi-class classification. This is quite a common approach, and the tests were run with Stochastic Gradient Descent (SGD) as the optimizer method. Several other tests were then performed with different learning rates and amount of epochs, as well as with a different number of convolutional layers. However, the accuracy remained very low for the validation set, at between 65% and 70% of the training set. This architecture is sequential and similar to the VGG16 model [17], with fewer convolutional layers (six convolution and pooling blocks relative to 16 in VGG16).
We decided to use more efficient CNN architectures such as those used in the ImageNet Large Scale Visual Recognition Challenge (ILSRVC), as a result of which the best performing models have been implemented and made available through the Keras [18], and TensorFlow [19] libraries, together with sets of weights and biases obtained from training with the ImageNet image database [14]. These architectures can be applied to other problems using the “Transfer Learning” approach.

2.4. Transfer Learning

The basis of Transfer Learning is to try to apply the learned characteristics of a given architectural network, already trained with a large data set corresponding to another problem, to solve a problem for which a smaller data set is available. Thus, knowledge is exploited by abstracting it from the specific data set and using it to solve similar problems, but not the same.
Transfer Learning is commonly used to mitigate overfitting; however, its capacity to generalize knowledge is better appreciated nowadays, as it enables what has been learnt in one field to be applied in other similar fields.
In Transfer Learning, feature extraction [20] consists of not changing the parameters (weights and biases) of the convolutional basis of the network (base) that retain the ability to extract features from the images and only allowing the training with the new data to modify the part of the network dedicated to classification (head). In general, it is expected that the convolutional base of the network retained will have learned to extract feature maps from generic elements of the images with which it was first trained (ImageNet image database in our case) and that this knowledge will be of interest for the particular data set to which the network will be applied (in our case apple variety classification). The classifier part (head) from the original pre-trained network is not used because it only contains information about the probability of the presence of a specific class of the first set of images and does not retain spatial information about the objects on the images, as these are dense (and not convolutional) layers.
Fine-tuning uses new data to train the classifier (head) and some of the final layers of the convolutional base of the network that was frozen until this point. This improves the more abstract extraction of entities on the images from the deepest layers of the convolutional part of the network. If the new data set (apple images) is very different from the data set used for the initial training step (ImageNet), it may be necessary to allow modification of increasingly shallower parameters of the convolutional base, even to the point of allowing complete modification of the whole convolutional base. This is preferable to working with a network whose initial values are derived from training with another database rather than being chosen as random parameters. One important aspect is that fine-tuning is expected to produce better results when it is run in two steps [21]: initially, only classification head parameters are trained; some layers in the base are then unfrozen, and optimization of the classification part (head) and unfrozen layers from the base continues. This approach can be referred to as a two-step process. In our trials, the execution time was similar to the one-step approach, where all the parameters can be trained through all the epochs from the beginning. The accuracy indicator values are similar for both procedures (one-step and two-step), but the one-step approach is easier to implement and runs unattended with different architectures. We, therefore, used the one-step approach to compare different model architectures and then applied the two-step approach with the selected (best-performing) architecture Figure 7. We compared the execution time and accuracies of the different approaches (Table 1). All tests were conducted using a PC with NVIDIA Geforce RTX 2060 12Gb GPU and Tensorflow-GPU (2.8.0).
In the tests, we first used the one-step approach for 100 epochs to compare different architectures, then used both one-step and two-step approaches with the selected architectures to evaluate different hyperparameter configurations to improve the results further.
Different architectures are available in the Tensorflow-Keras library. We tested the following CNN models: VGG16, EfficientNetV2M [22], MobileNetV2 [23], InceptionResNetV2 [24], InceptionV3 [25,26] and an in-house sequential CNN model. These architectures were mainly selected because they have performed well in ImageNet Large Scale Visual Recognition Challenge (ILSVRC) competitions [27] and because of their limited size in the final trained model, which is more appropriate for the limited hardware capabilities in terms of dedicated memory in the GPU.
ImageNet weights were used as initial values for all the models but without including the weights of the classification part of the neural network (head). The ImageNet data set is well known and has more than 15 million labelled images corresponding to some 20,000 categories, although some of the architectures in Keras have been trained with subsets of this database, as is the case with VGG16—for which the training data set taken from ImageNet was 1.2 million images and some 50,000 for validation and some 150,000 for testing for 1000 categories. In any case, these figures are much higher than those available in our experiment.
In all cases, the network model was adapted to our data set, especially the classification part, which only needed to identify nine distinct classes. This Transfer Learning procedure (Feature extraction) yielded modest accuracy with the validation set (75–80%). Some of the final layers of the convolution part of the network (fine-tuning) were then unfrozen to improve the results. This makes sense as the previous convolutional layers may be too specific to be applied to the apple variety classification problem. Nonetheless, the weights and biases learned with the data from the more general databases represent good starting points and avoid having to start the task with random values in the learning process and accelerate convergence. In our tests, the best-performing architecture was InceptionV3 and the second best was MobilNetV2.

3. Results

In the field of data mining, metrics accuracy, precision, and recall (Olson and Delen, 2008) are often used to evaluate the results obtained, along with F1 as a combined indicator of precision and recall. The above metrics can be defined as follows, where Tp and Tn represent True positive and True negative and Fp and Fn, False positive and False negative:
Accuracy = Tp + Tn Tp + Fp + Tn + Fn Precision = Tp Tp + Fp Recall = Tp Tp + Fn   F 1 = 2 · Precision · Recall Precision + Recall
Accuracy can be thought of as the ratio of correctly classified samples to the whole set of samples. Precision is the ratio of correctly classified samples to all classified samples in all classes; it measures what our model predicted correctly to what our model predicted as an average for all classes. Recall (sensitivity) is the ratio of what our model predicted correctly to the actual samples [28]. Finally, F1 is the harmonic mean of precision and recall. Harmonic mean penalizes very low values (of precision or recall) more than average or geometric mean and thus is a better-combined measurement of success. These metrics were used to quantify the results of our tests. In addition, we also examined the confusion matrix to try to detect pairs of classes that can be mixed and the validation and test evolution graphics through epochs to obtain an idea of the convergence rate and other problems, such as overfitting.

3.1. Experiment A: Determining the Best Architectures for Transfer Learning

Some tests were first carried out with several architectures, as already mentioned. In all tests, the same validation, test and training sets read from a previously created “.hdf5” format file were used. The precision and accuracy obtained in the tests are summarised in the following Table 2:
All trials were performed under 100 epochs with the same RMSprop optimizer (although other trials were conducted for some architectures with SGD semi-gradient descent, yielding generally poorer results) and different learning rates. Different batch sizes were also used due to GPU memory limitations. The best validation accuracy numbers often do not correspond to the last epoch. The best value and the epoch obtained are shown in the second column in Table 3. The validation accuracy for the last epoch is shown in the last column of the same table. Large differences between these values indicate oscillations in the convergence problem and may suggest that the results do not correspond to a true minimum of the cost function.
Although the validation accuracy was similar with InceptionResnetV2 and InceptionV3, the latter yielded slightly higher accuracy for the test set and was therefore chosen for further testing. The following figures show some results for the rest of architectures (Figure 8, Figure 9, Figure 10 and Figure 11). Intense overfitting occurred with the VGG16 and our in-house CNN architectures. EfficientNetV2M consistently yielded better results in validation set accuracy (blue curve) than for the training set (red curve), which is not very usual, and the final metric values were not high enough, with the convergence rate being very low. Although there is still room to improve the metrics for this architecture, the training times would be much longer. All these results were achieved by fully training the architectures (head and base) because after the first tests we observed that the feature extraction transfer learning procedure (training only the head of CNN’s) did not yield good results with the data set, probably because ImageNet database mainly contains images of animals and other everyday objects, which are quite different from the apple variety images. The in-house CNN architecture with six blocks of convolutional layers and MaxPooling did not yield good values for metrics in validation or test sets (validation accuracy of around 40%). This architecture had only 228,569 parameters and did not seem to be able to model the data and class label relationship for the problem under consideration. This finding does not appear consistent with those reported by [4], who obtained better results with a simpler CNN design than with InceptionV3, although with a relatively simple model, because these researchers were only trying to classify three groups related to fruit quality.

3.2. Experiment B: Refining Our Models
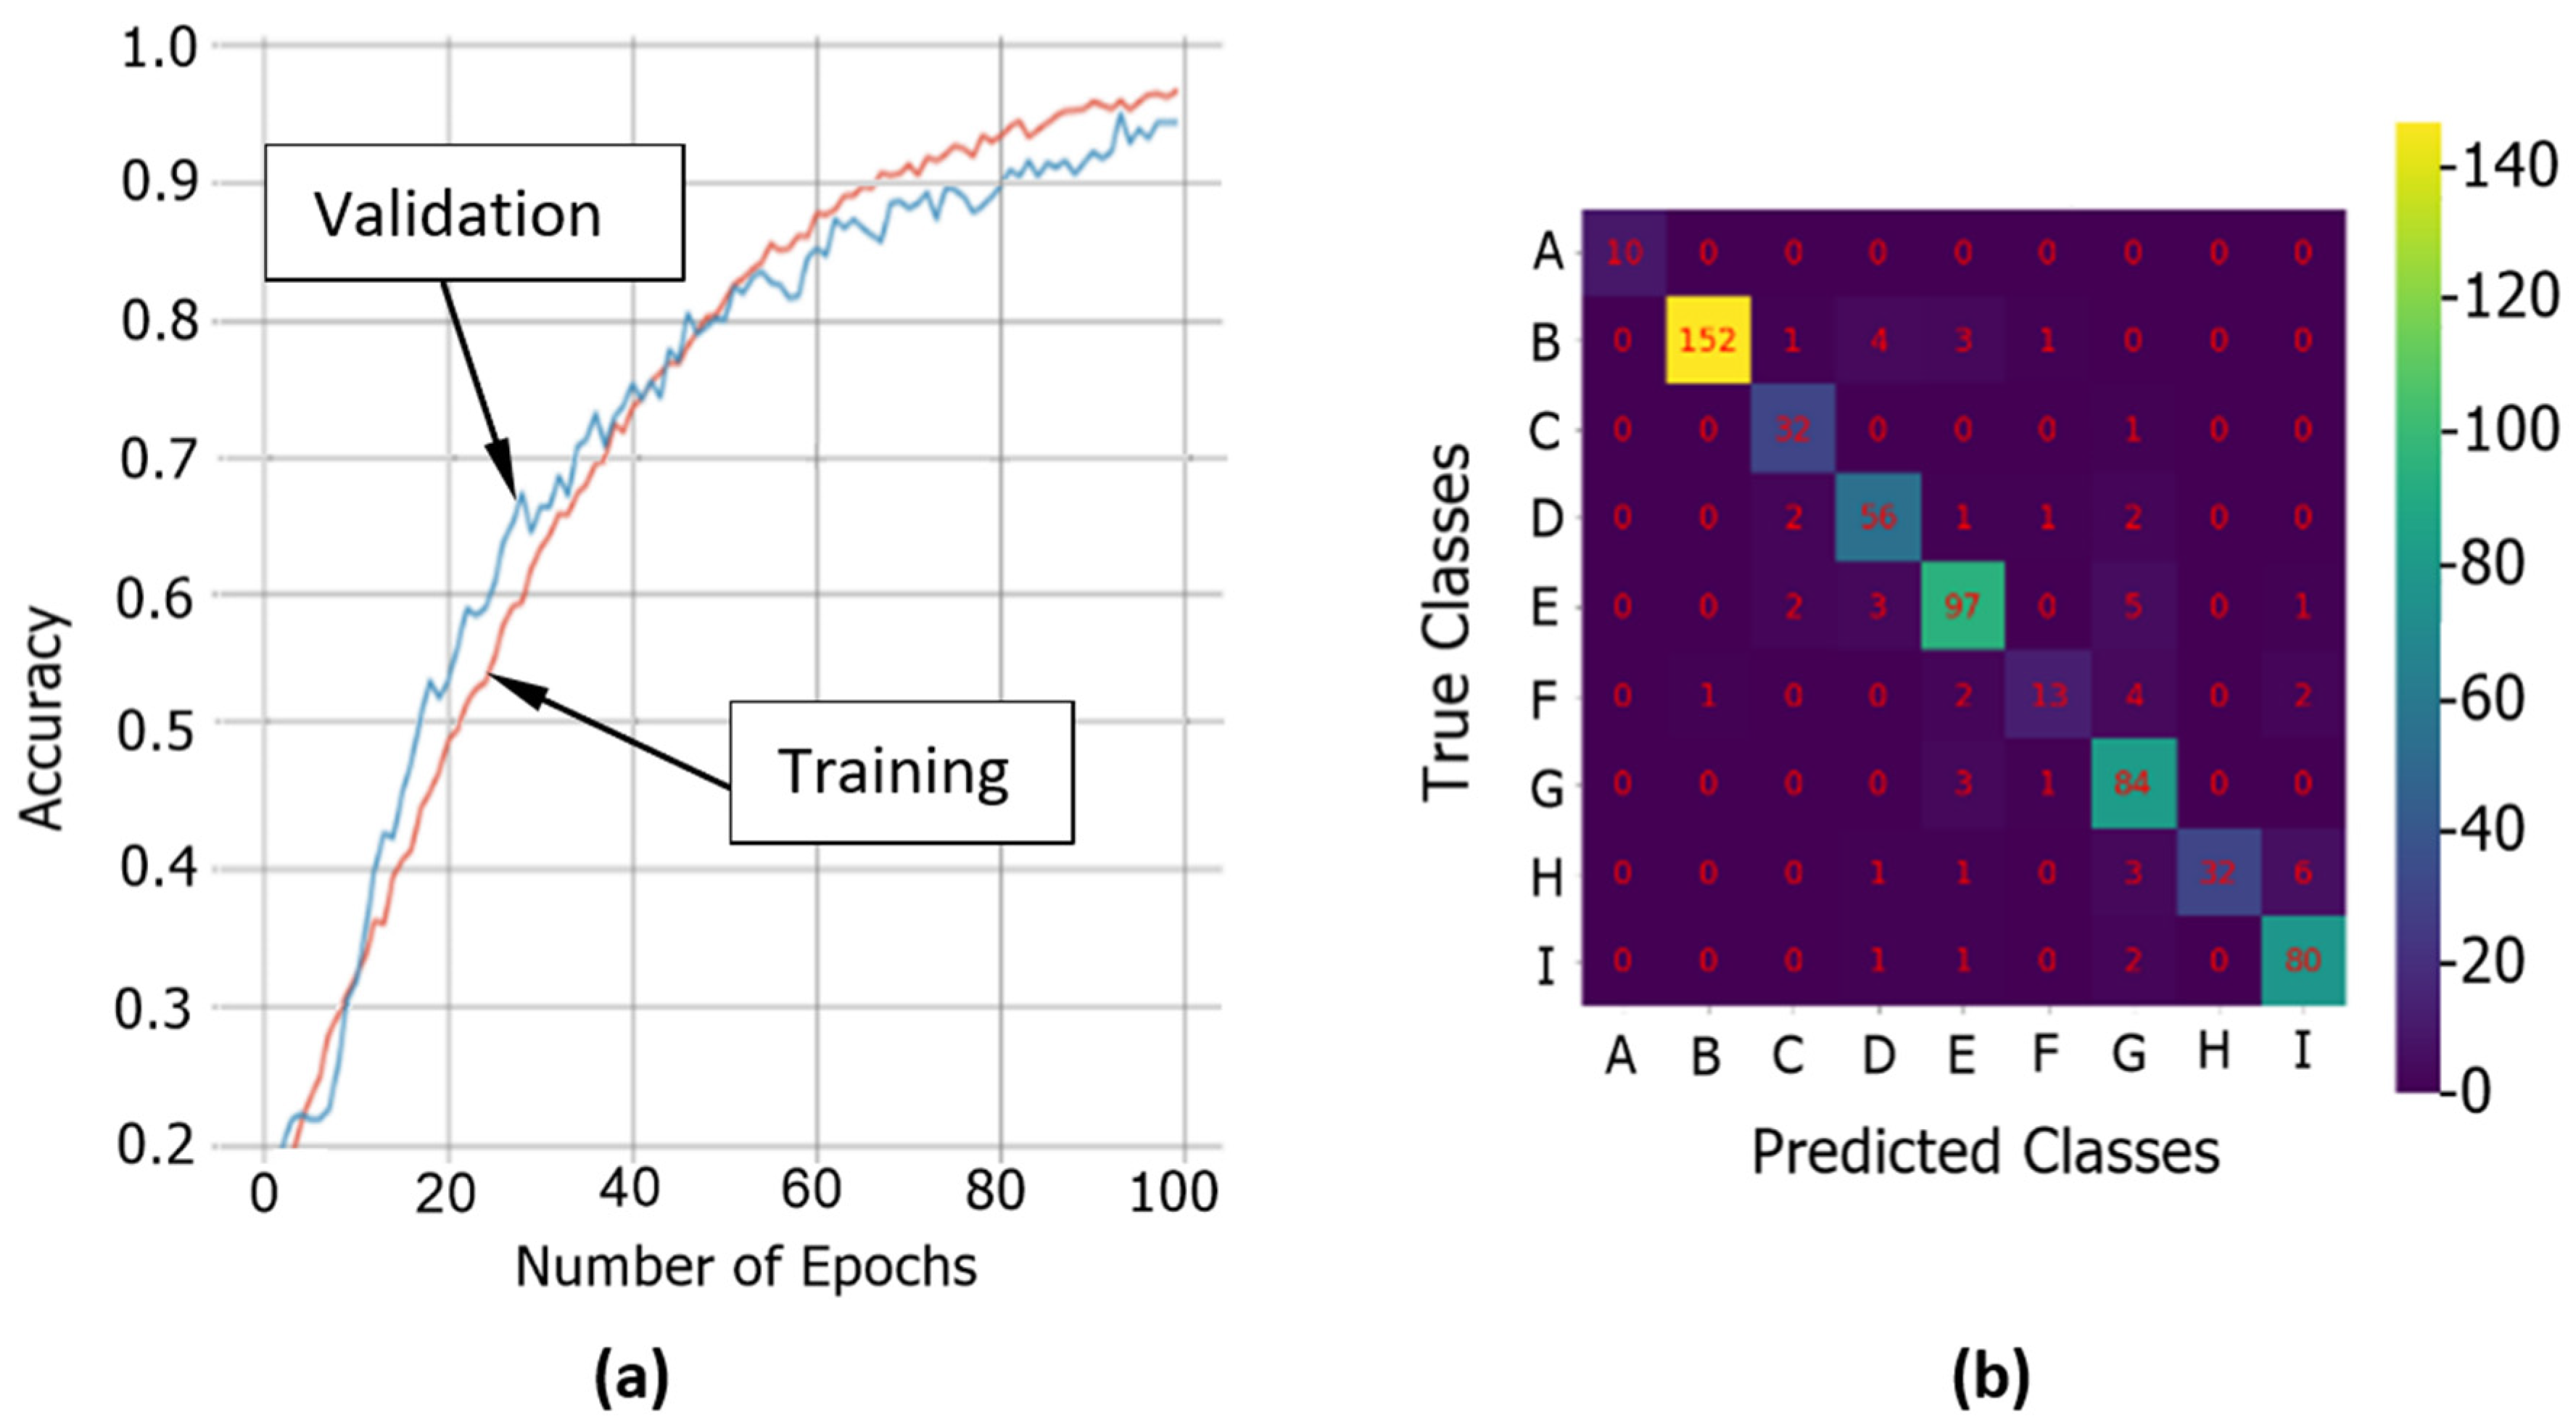
The InceptionV3 and MobileNetV2 architectures were the most suitable for further testing because of good accuracy metric values, model sizes, convergence rates and limited overfitting. Therefore, we applied the fine-tuning procedure to these two architectures to improve the results obtained.
After having run the first step allowing training of the classification layers only (head) for 100 epochs, in the second step of 100 more epochs, we allowed the training of not only the head but also the parameters of some other shallow layers belonging to the base, which are used to detect more abstract features. Different training depths of training layers inside the convolutional part of the network were tested. The best metric results for the one-step approach were obtained when all the network parameters were allowed to train in the second run. However, in all cases, the resulting metrics for this two-step approach were lower than the solution enabling the training of all the convolutional networks from the beginning in a single step. Therefore, for the architectures selected, InceptionV3 and MobileNetV2, only the results for the one-step approach with ImageNet initial weights and 200 epochs are included in the following tables and figures.

3.2.1. InceptionV3

For the InceptionV3 architecture, the processes for converging and improving the accuracy for training and validation sets over the 200 epochs are included in the following figure, along with the confusion matrix for the test set. The gap between the training (red) and validation (blue) curves (Figure 12a) indicates the magnitude of overfitting (training line over validation line) or underfitting problems between the model and the data, which were not significant in this case.
The metrics obtained in each subset, into which the input data were divided, are shown in Table 4 below:
Only very slight overfitting occurred, as observed by the accuracy values for training and validation data sets. The test accuracy value (98.04%) appears to be high enough for robust classification of the nine apple varieties. The classification system did not lead to confusion between classes, with only a small degree of error affecting the “Reineta” varieties (“Reineta pinta” and “Reineta Roja del Canadá” (“Canadian red”) in the test and validation set).
As a final quality estimator of the accuracy of the InceptionV3 trained model, the class accuracies are shown in the following Table 5:

3.2.2. MobileNetV2

The MobileNetV2 architecture also showed promising results in the previous experiment. The accuracy values and confusion matrix for the test set are shown in Figure 13.
The metrics obtained in each subset, into which the input data was divided, are included in the Table 6 below:
The metric values are a few points below those of the InceptionV3 architecture. The number of parameters in this model was only 2,397,065, which is much fewer than the 22,039,849 trainable parameters in the InceptionV3 model. Although this explains the better results of the latter, this large model also needs more time and calculation effort to make predictions. Therefore, the MobileNetV2 model may be useful for classification on mobile devices.
We have found few comparable studies on classifying fruit varieties with Transfer Learning techniques. One of them [7], dedicated to mango varieties, uses two CNN architectures, although, in one of the cases (ResNet50), it is used in a hybrid way, in combination with other Machine Learning techniques (Naive Bayes, Linear SVM, PolySVM and Logistic Regression). They report 70% and 100% accuracy for the hybrid classification trial of eight mango varieties. They also reported other classification results (from different authors) for the same mango fruit image dataset, with precisions between 88.57% and 92.42% using Transfer Learning with Inception v3, Xception, DenseNet and MobileNet architectures (The data from other groups is likely to have been accessed privately by the authors of the first study, as it is currently unpublished). Finally, the same authors [7] report a 100% accuracy for MobileNet Transfer Learning and MobileNet (Fine-tuning). In our case, we have obtained precision results slightly higher than the private study and logically lower than the absolute precision claimed by [7]. We recall that this study had a different fruit target and a smaller image base, with only 200 colour images belonging to eight mango varieties.
Other studies work with different fruit types in the image database, for example, [29] (72 different types of fruit). Their accuracy is less than one point better than ours in their best tests using VGG16 architecture. Inceptionv3 were the only other model tested with slightly lower accuracy than our result.

4. Conclusions

Convolutional network-based classification techniques are important to simplify and automate the apple variety classification process, creating a reliable graphical database for identifying cider apple varieties. Classification is very important for owners of traditional apple orchards and for cider producers using the “Sidra de Asturias” PDO to enable the reliable control of the characteristics of the final product and thus facilitate future growth of the export market for cider apples.
We have proved that a sufficiently reliable cider apple variety classification is possible using convolutional deep learning methods trained only with images of uncut apples.
The best design and performance metrics for the convolutional network architecture were obtained with the InceptionV3 architecture (validation accuracy 98.20%; test accuracy 98.04%), implemented in the Keras library using the Tensorflow backend. The second-best architecture was MobileNetV2, (validation accuracy 96.72%; test accuracy 93.13%). The weights and biases derived from the training with ImageNet were used as initial values but allowed all the layers of the convolutional base and the classification head to be trained in a single step, with the data under consideration. This is similar to the classical fine-tuning approach but only takes advantage of network architecture design and initial weights values. Convergence of the process did not lead to significant overfitting, and no class identification problems were observed in the confusion matrix.
Although MovileNetV2 produced slightly poorer results, the model is much smaller (about 22 million parameters for InceptionV3 and 2.4 million for MobileNetV2) and could be useful for implementing classification apps on mobile devices.
Future work will focus on creating new data sets, including more apple varieties for PDO systems, improving the classification of these varieties and publicly promoting the classification system.

Author Contributions

Conceptualization, S.G.C. and A.M.D.; methodology, S.G.C. and A.B.G.; software, S.G.C.; validation, J.A.O.P. and A.M.D.; investigation, A.B.G. and S.G.C.; writing—original draft preparation, A.M.D. and S.G.C.; writing—review and editing, J.A.O.P. and A.M.D.; visualization, A.M.D.; supervision, J.A.O.P. and A.B.G.; project administration, A.M.D.; funding acquisition, A.M.D. and J.A.O.P. All authors have read and agreed to the published version of the manuscript.

Funding

This study was funded by Project FUO-469-19 (Fundación de la Universidad de Oviedo) and co-financed by ENRG GESTIÓN EFICIENTE.

Data Availability Statement

The image Database in hdf5 format, used for all the tests in this article, can be downloaded from: https://figshare.com/ndownloader/files/36304077 (accessed on 25 April 2022).

Acknowledgments

The authors also gratefully acknowledge the assistance of José Madiedo (Viveros Madiedo, Villaviciosa, Asturias) and the management and workers of Pumarada Llagar el Quesu (Siero, Asturias).

Conflicts of Interest

The authors declare no conflict of interest.

References

  1. Dapena-Fuente, E.; Blázquez Nogueiro, M.D. Descripción De Las Variedades De Manzana De La D.O.P. Sidra De Asturias; Serida: Villaviciosa, Asturias, Spain, 2009; pp. 11–56. [Google Scholar]
  2. Bhargava, A.; Bansal, A. Fruits and Vegetables Quality Evaluation Using Computer Vision: A Review. J. King Saud Univ.Comput. Inf. Sci. 2021, 33, 243–257. [Google Scholar] [CrossRef]
  3. Hossain, M.S.; Al-Hammadi, M.; Muhammad, G. Automatic Fruit Classification Using Deep Learning for Industrial Applications. IEEE Trans. Ind. Informatics 2019, 15, 1027–1034. [Google Scholar] [CrossRef]
  4. Li, Y.; Feng, X.; Liu, Y.; Han, X. Apple Quality Identification and Classification by Image Processing Based on Convolutional Neural Networks. Sci. Rep. 2021, 11, 16618. [Google Scholar] [CrossRef] [PubMed]
  5. Zuñiga, E.N.; Gordillo, S.; Martínez, F.H. Approaches to Deep Learning-Based Apple Classification Scheme Selection. Int. J. Eng. Res. Technol. 2021, 14, 510–515. [Google Scholar]
  6. Shi, X.; Chai, X.; Yang, C.; Xia, X.; Sun, T. Vision-Based Apple Quality Grading with Multi-View Spatial Network. Comput. Electron. Agric. 2022, 195, 106793. [Google Scholar] [CrossRef]
  7. Alhawas, N.; Tüfekci, Z. The Effectiveness of Transfer Learning and Fine-Tuning Approach for Automated Mango Variety Classification. Eur. J. Sci. Technol. 2022, 34, 344–353. [Google Scholar] [CrossRef]
  8. Ghazi, M.; Yanikoglu, B.; Aptoula, E. Plant Identification Using Deep Neural Networks via Optimization of Transfer Learning Parameters. Neurocomputing 2017, 235, 228–235. [Google Scholar] [CrossRef]
  9. Joseph, J.L.; Kumar, V.A.; Mathew, S.P. Fruit Classification Using Deep Learning BT—Innovations in Electrical and Electronic Engineering; Mekhilef, S., Favorskaya, M., Pandey, R.K., Shaw, R.N., Eds.; Springer: Singapore, 2021; pp. 807–817. [Google Scholar]
  10. Apolo-Apolo, O.E.; Martínez-Guanter, J.; Egea, G.; Raja, P.; Pérez-Ruiz, M. Deep Learning Techniques for Estimation of the Yield and Size of Citrus Fruits Using a UAV. Eur. J. Agron. 2020, 115, 126030. [Google Scholar] [CrossRef]
  11. Yu, J.; Sharpe, S.M.; Schumann, A.W.; Boyd, N.S. Deep Learning for Image-Based Weed Detection in Turfgrass. Eur. J. Agron. 2019, 104, 78–84. [Google Scholar] [CrossRef]
  12. Dias, P.A.; Tabb, A.; Medeiros, H. Apple Flower Detection Using Deep Convolutional Networks. Comput. Ind. 2018, 99, 17–28. [Google Scholar] [CrossRef] [Green Version]
  13. Xia, X.; Chai, X.; Zhang, N.; Sun, T. Visual Classification of Apple Bud-Types via Attention-Guided Data Enrichment Network. Comput. Electron. Agric. 2021, 191, 106504. [Google Scholar] [CrossRef]
  14. ImageNet. Available online: https://www.image-net.org/about.php (accessed on 25 April 2022).
  15. Watts, S.; Migicovsky, Z.; Myles, S. Cider and Dessert Apples: What Is the Difference? Plants People Planet 2022, 4, 593–598. [Google Scholar]
  16. Miles, C.; Peck, G.; Beltsville, M.B.U.; Geneva, T.C.U.; Miles, C.; State, W.; Nwrec, V.; Vernon, M.; Merwin, I.; Diamond, B.; et al. Importing European Cider Cultivars into the US. In Proceedings of the CiderCon 2016, Portland, OR, USA, 2–6 February 2016. [Google Scholar]
  17. Simonyan, K.; Zisserman, A. Very Deep Convolutional Networks for Large-Scale Image Recognition. arXiv 2014. [CrossRef]
  18. Chollet, F. Keras. Available online: https://github.com/keras-team/keras (accessed on 21 December 2021).
  19. Breunig, M.; Al-Doori, M.; Butwilowski, E.; Kuper, P.V.; Benner, J.; Haefele, K.-H. Proceedings of the 9th 3DGeoInfo Conference 2014, Dubai, United Arab Emirates, 11–13 November 2014; The Conference Chairs of 3DGeoInfo: Karlsruhe, Germany, 2014. [Google Scholar]
  20. Chollet, F. Keras Documentation. 2015. Available online: https://keras.io/api (accessed on 11 April 2022).
  21. Chollet, F. Deep Learning with Python; Manning Publications: Shelter Island, NY, USA, 2021; ISBN 9781617296864. [Google Scholar]
  22. Tan, M.; Le, Q. EfficientNetV2: Smaller Models and Faster Training. arXiv 2021. [Google Scholar] [CrossRef]
  23. Sandler, M.; Howard, A.; Zhu, M.; Zhmoginov, A.; Chen, L. MobileNetV2: Inverted Residuals and Linear Bottlenecks. arXiv 2018. [Google Scholar] [CrossRef]
  24. Szegedy, C.; Ioffe, S.; Vanhoucke, V.; Alemi, A. Inception-v4, Inception-ResNet and the Impact of Residual Connections on Learning. In Proceedings of the Thirty-First AAAI Conference on Artificial Intelligence, Phoenix, AZ, USA, 12–17 February 2016. [Google Scholar]
  25. Szegedy, C.; Liu, W.; Jia, Y.; Sermanet, P.; Reed, S.; Anguelov, D.; Erhan, D.; Vanhoucke, V.; Rabinovich, A. Going Deeper with Convolutions. In Proceedings of the 2015 IEEE Conference on Computer Vision and Pattern Recognition (CVPR), Boston, MA, USA, 7–12 June 2015; pp. 1–9. [Google Scholar] [CrossRef] [Green Version]
  26. Szegedy, C.; Vanhoucke, V.; Ioffe, S.; Shlens, J.; Wojna, Z. Rethinking the Inception Architecture for Computer Vision. In Proceedings of the 2016 IEEE Conference on Computer Vision and Pattern Recognition (CVPR), Las Vegas, NV, USA, 27–30 June 2016; pp. 2818–2826. [Google Scholar] [CrossRef]
  27. ILSRVC. ImageNet Large Scale Visual Recognition Challenge. Available online: https://www.image-net.org/challenges/LSVRC/index.php (accessed on 25 April 2022).
  28. Bhadouria, V.S. Explaining Accuracy, Precision, Recall, and F1 Score. Available online: https://medium.com/swlh/explaining-accuracy-precision-recall-and-f1-score-f29d370caaa8 (accessed on 12 July 2022).
  29. Siddiqi, R. Effectiveness of Transfer Learning and Fine Tuning in Automated Fruit Image Classification. In Proceedings of the 2019 3rd International Conference on Deep Learning Technologies, Xiamen, China, 5–7 July 2019; pp. 91–100. [Google Scholar] [CrossRef]
Figure 1. Study area. (a) Aerial view of the study site; (b) Traditional apple orchard.
Agronomy 12 02856 g001
Figure 2. This figure shows the trees from which the samples were taken and their state of development in the different years: (ac) Trees and fruits of apple variety “Blanquina”. (df) Trees and fruits of apple variety “Florina”.
Agronomy 12 02856 g002
Figure 3. Apple samples and photographic system: (a) Selected apple specimens; (b) Nikon D90 camera and lightbox.
Agronomy 12 02856 g003
Figure 4. Positions from which the apple samples were photographed.
Agronomy 12 02856 g004
Figure 5. Number of images of each apple variety.
Agronomy 12 02856 g005
Figure 6. Sample images of apple varieties photographed from different positions (Pos1, Pos3 and Pos4).
Agronomy 12 02856 g006
Figure 7. Transfer Learning concept with our recommended one-step variant in red text.
Agronomy 12 02856 g007
Figure 8. Graphics for VGG16 architecture. (a) Training and validation accuracy (b) Confusion matrix for Test set. Apple variety legend: (A) Blanquina, (B) Carrió, (C) Florina, (D) Fuentes, (E) Prieta, (F) Raxao, (G) Reineta Encarnada, (H) Reineta Pinta, (I) Reineta Roja del Canadá.
Agronomy 12 02856 g008
Figure 9. Graphics for EfficientNetV2M architecture. (a) Training and validation accuracy (b) Confusion matrix for Test set. Apple variety legend: (A) Blanquina, (B) Carrió, (C) Florina, (D) Fuentes, (E) Prieta, (F) Raxao, (G) Reineta Encarnada, (H) Reineta Pinta, (I) Reineta Roja del Canadá.
Agronomy 12 02856 g009
Figure 10. Graphics for MobileNetV2 architecture. (a) Training and validation accuracy (b) Confusion matrix for Test set. Apple variety legend: (A) Blanquina, (B) Carrió, (C) Florina, (D) Fuentes, (E) Prieta, (F) Raxao, (G) Reineta Encarnada, (H) Reineta Pinta, (I) Reineta Roja del Canadá.
Agronomy 12 02856 g010
Figure 11. Graphics for InceptionV3 architecture. (a) Training and validation accuracy (b) Confusion matrix for Test set. Apple variety legend: (A) Blanquina, (B) Carrió, (C) Florina, (D) Fuentes, (E) Prieta, (F) Raxao, (G) Reineta Encarnada, (H) Reineta Pinta, (I) Reineta Roja del Canadá.
Agronomy 12 02856 g011
Figure 12. (a) Accuracy function for Training and Validation datasets for InceptionV3 model during the second pass, 200 epochs. (b) Confusion matrix for the test set. Apple variety legend: (A) Blanquina, (B) Carrió, (C) Florina, (D) Fuentes, (E) Prieta, (F) Raxao, (G) Reineta Encarnada, (H) Reineta Pinta, (I) Reineta Roja del Canadá.
Agronomy 12 02856 g012
Figure 13. (a) Accuracy function for Training and Validation datasets for MobileNetV2 model during the second pass, 200 epochs. (b) Confusion matrix for the test set. Apple variety legend: (A) Blanquina, (B) Carrió, (C) Florina, (D) Fuentes, (E) Prieta, (F) Raxao, (G) Reineta Encarnada, (H) Reineta Pinta, (I) Reineta Roja del Canadá.
Agronomy 12 02856 g013
Table 1. Differences in accuracy and execution time with one-step and two-step approaches for fine-tuning. InceptionV3 architecture, 200 epochs and 8 trainable base layers for fine-tuning in the two-step approach.
Execution TypeValidation
Accuracy
Test AccuracyTraining AccuracyExecution
Time (Hours)
Number of Trainable Parameters
One step97.87%
(98.69% epoch 162)
97.55%99.71%2:43 h22,039,849
Two steps98.20%
(98.20% epoch 185)
97.22%99.43%2:50 h22,039,849
Table 2. Test and Validation accuracies for different architectures using one-step and Imagenet weights.
NameValidation AccuracyBatch SizeFinal Test Accuracy (100th Epoch)
MobileNetV294.920 (epoch 94)2491.00%
InceptionV398.693 (epoch 93)2492.96%
VGG1684.943 (epoch 99)2453.68%
EfficientNetV2M80.54(epoch 99)2470.54%
InceptionResnetV297.218 (epoch 85)1294.76%
Our-CNN
(6 blocks:
Conv + Maxpool layer)
73.977(epoch 78)1237.64%
Table 3. Test accuracy and F1 metrics, number of trainable parameters and training time for each architecture.
CNN ArchitectureTest AccuracyF1 ScoreNumber of Pars:Training Time:
VGG1669.89%0.68814,789,5771:39 h
EfficientNetV2M70.54%0.67553,031,5494:02 h
MobileNetV291.00%0.8902,431,5611:23 h
InceptionV392.96%0.92922,039,8491:27 h
Table 4. InceptionV3 classification Metrics, all layers trainable for 200 epochs.
Data SetAccuracyPrecisionRecallF1
Training99.71%
Validation97.05% (98.20% epoch 181)97.52%96.52%0.970
Test98.04%98.41%97.76%0.980
Table 5. Class metrics for the InceptionV3 trained model.
Class NamePrecisionRecallF1Support 1
BLANQUINA1.001.001.0010
CARRIO0.990.990.99161
FLORINA0.860.970.9133
FUENTES0.980.940.9662
PRIETA0.990.970.98108
RAXAO1.001.001.0022
REINETA ENCARNADA0.961.000.9888
REINETA PINTA0.970.910.9443
REINETA ROJA DEL CANADA0.990.980.9884
accuracy0.990.980.98611
macro avg.0.970.970.97611
Support-weighted avg.0.980.980.98611
1 Support is the number of samples of each class in the test set.
Table 6. MobileNetV2 classification Metrics, all layers trainable for 200 epochs.
Data SetAccuracyPrecisionRecallF1
Training99.80%
Validation93.29% (96.72% epoch 188)95.93%91.66%0.933
Test93.13%96.12%91.26%0.931
Publisher’s Note: MDPI stays neutral with regard to jurisdictional claims in published maps and institutional affiliations.

