Article

Seasonal Characteristics of Agricultural Product Circulation Network: A Case Study in Beijing, China

1
State Key Laboratory of Resources and Environmental Information System, Institute of Geographic Sciences and Natural Resources Research, CAS, Beijing 100101, China
2
University of Chinese Academy of Sciences, Beijing 100049, China
3
The Academy of Digital China, Fuzhou University, Fuzhou 350002, China
4
Jiangsu Center for Collaborative Innovation in Geographical Information Resource Development and Application, Nanjing 210023, China
*
Author to whom correspondence should be addressed.
Agronomy 2022, 12(11), 2827; https://doi.org/10.3390/agronomy12112827
Submission received: 17 October 2022 / Revised: 8 November 2022 / Accepted: 10 November 2022 / Published: 12 November 2022

Abstract

:
Agricultural product circulation is an appropriate way to optimize the distribution of agricultural resources and maintain food safety. The seasonality of agriculture leads to seasonal variations in agricultural product circulation. Previous studies constructed origin–destination networks based on annual statistics to investigate the static structure of agricultural product circulation networks from a single view, failing to capture the seasonal and multi-dimensional characteristics in agricultural product circulation. This study presents a multi-view analytical framework used to investigate the seasonal characteristics of an agricultural product circulation network. First, agricultural product circulation networks in different seasons were constructed with mass freight trajectory data through trajectory mining technology. Then, the seasonal characteristics of agricultural product circulation were, respectively, analyzed from a macro-view (networks), meso-view (edges) and micro-view (nodes). A case study was conducted in Beijing, China. It is argued that: (1) The presented method for extracting agricultural trip chains based on massive freight trajectories is feasible for the construction of agricultural product circulation networks. (2) The agricultural product circulation networks in four seasons exhibit an obvious hierarchical and radial structure. South China has a higher network density in winter and spring, whereas northeast and northwest China are the opposite. (3) A total of 80% of the linkage strength is concentrated, on average, in 35.3% of city-pairs in four seasons, where the agglomeration effect and hub status of the linking cities is more prominent in summer and autumn. (4) A total of 316 cities form Beijing agricultural product circulation networks, 48.1% of which are mainly served by Beijing agricultural product circulation in winter and spring, which is 2.7 times more than cities served in summer and autumn. These findings extend the scientific understanding of the agricultural product supply chain from a dynamic and multi-dimensional view, which provides essential information for optimizing sustainable agri-food systems and ensuring food security.

1. Introduction

Agricultural product circulation refers to an economic activity in which the commodity part of agricultural products is transferred from the agricultural production field to the consumption field through trading [1]. Agricultural product circulation is universally used to address regional or national imbalances in the supply and demand for agricultural products [2,3]. Thus, agricultural product circulation has become an appropriate way to optimize the distribution of agricultural resources and maintain food safety [4,5]. As the bridge between numerous producers and consumers, the process of agricultural product circulation has formed an agricultural product circulation network, which is dynamic and highly interrelated [6,7]. Assessing the essential features of the structure, function and dynamics of an agricultural product circulation network is crucial from the global, regional and local levels. At the global level, it is an indispensable step in understanding agricultural production supply chains [8]. At the regional level, it could be the important engine of strengthening the stability of regional ecological capacity, which ultimately promotes regional integration and the formation of a community of a shared future [9,10]. At the local level, it could help decision makers to adjust local roles in agricultural trade and develop feasible pathways for sustainable agricultural development [11].
An agricultural product circulation network consists of three elements: a certain geographical unit (city, region, country, etc.), transport routes and agricultural trade flows. Research on agricultural product circulation networks has flourished in recent years, including: (1) structural characteristics [12,13] and evolutionary patterns [14,15] of agricultural product circulation networks; (2) driving factors of agricultural product circulation [16,17,18]; (3) the spatial distribution of natural resources [19,20,21], economic effects [22] and environmental stress [23,24,25] affected by the agricultural product circulation. However, the above studies were carried out from a single perspective. An increasing agreement among scholars has emerged towards the need for a comprehensive and holistic perspective for investigating agricultural product circulation in order to master the law of the cross-regional trade of agricultural products [26].
There are two kinds of methods used to construct agricultural product circulation networks: (1) simulating the virtual networks through the optimization models and machine learning models based on statistical yearbook data such as agricultural product output, self-sufficiency rate and trade cost [27,28,29,30,31,32]; (2) constructing networks based on trade data between countries/regions [13,14,15,33,34,35]. However, due to the time delay of the statistics, usually published annually, it is unlikely for these two methods to capture the dynamic changes in agricultural product circulation, especially the seasonal changes. In fact, the seasonality of agricultural production is obvious [36,37], which asks us to pay attention to the seasonal changes in agricultural product circulation. Studying the seasonal variations in an agricultural product circulation network enables an assessment of spatiotemporal risks in food supply chains, critical infrastructure and environmental footprints [31].
With the background mentioned above, a scientific understanding of agricultural product circulation networks from diverse perspectives and spatiotemporal scales is imperative for a sustainable agri-food system. The current research on agricultural product circulation networks yielded many results, but it still needs to be further expanded on regarding seasonal characteristics. This study aims to explore comprehensive and holistic analytical methods to investigate the seasonal characteristics of agricultural product circulation networks. Road freight transportation is the main method of agricultural product circulation, and accounts for more than 70% of all freight modes in China [38]. Under the policies of safe production, more and more operating trucks have been equipped with global navigation satellite systems (GNSS). Massive trajectory data are then generated from the GNSS, containing information on location, time, speed, etc., reflecting the freight movement status and goods flows, which makes it possible to construct agricultural product circulation networks in different seasons [39,40]. In this study, the trip chain of agricultural product circulation was extracted through mass freight trajectory data mining. Then, the agricultural product circulation networks were constructed with a case in Beijing, China. Seasonal variations in agricultural product circulation networks in Beijing were analyzed from three views—networks, edges (city-pairs) and nodes (cities)—to reveal the structural characteristics and spatial patterns of agricultural product circulation in different seasons. It is argued that such a method provides a comprehensive and diverse perspective for the understanding of agricultural supply chains.

2. Materials and Methods

2.1. Study Area and Data Acquisition

Beijing is a national logistics hub in China. There are several large agricultural wholesale markets in Beijing for loading and unloading of agricultural trucks. As agricultural product distribution centers, these agricultural wholesale markets serve the daily consumption demand of agricultural and sideline products in Beijing and surrounding areas. For example, Beijing Xinfadi agricultural wholesale products market is one of the largest agricultural wholesale markets in China, supplying more than 80% of Beijing’s agricultural products until 2021 [41].
Freight trajectory data were obtained through an open data interface provided by the China’s Road Freight Vehicle Public Supervision and Service Platform (https://www.gghypt.net/ (accessed on 1 March 2022)). The study extracted the freight trajectories passing through Beijing on every day in January, April, July and October 2018, representing winter, spring, summer and autumn, respectively. These trajectories have a GNSS positioning frequency of 2–30 s and contain information such as truck ID, timestamp, latitude, longitude and speed, to name a few. More than 9.4 million records are available every 5 min, covering more than 8.1 million trucks.

2.2. Data Processing

The raw trajectory data lack information on good types and activity purposes, which require certain semantic processing for the extraction of freight trip chains related to agricultural product circulation. Data processing consists of four steps: (1) identification of valid stop points; (2) semantic tagging of trip chains; (3) extraction of trip chains related to agricultural product circulation; (4) construction of intercity origin–destination (OD) sequences.

2.2.1. Identification of Valid Stop Points

Stopping in certain places is the crucial prerequisite for performing any activities for trucks [42]. In this study, the places where trucks stop for a definite time period (e.g., for loading, unloading, resting) were considered as valid stop points, and the places where trucks stop briefly while moving (e.g., waiting caused by traffic jams, traffic lights) were considered as invalid stop points. Since trucks may load and unload at different locations in the same parking lots, the study combined consecutive stops at similar locations to form a valid stop. A valid stop point contains specific semantic information, representing the end of the previous trip and the beginning of the next trip. Referring to the previous research [43,44], the study screened the stop points based on speed and time threshold. The criterion was “speed less than 1 km/h, stop time more than 20 min”. Then, the study combined the consecutive stops at similar locations through DBSCAN clustering method. The combined stop point was taken as the valid point (Figure 1a).

2.2.2. Semantic Tagging of Trip Chain

This step aims to infer the purpose of the truck activities. The trip chain was constructed by connecting the valid stop points in time sequence. The semantic tagging of trip chains refers to identifying the activity information of drivers on valid stop points based on the geographical elements [45,46]. The AutoNavi Map Open Platform (https://lbs.amap.com/ (accessed on 1 March 2022)) provides the information of point of interest (POI) and area of interest (AOI) nationwide, such as name, type, latitude and longitude. Based on the POI/AOI data interface, the study searched for the nearest POIs/AOIs related to freight with the valid stop points as the centers and matched the unique POI/AOI for the valid stop points. Then, the study inferred the purposes of truck activities according to the POI/AOI types. The relationship between POI/AOI types and truck activities is shown in Table 1. For example, the semantic fields matched by the valid stop point shown in Figure 1b are: “Beijing Dayang Road Agricultural Products Market; shopping service; work”.

2.2.3. Extraction of Trip Chains Related to Agricultural Product Circulation

The agricultural product circulation follows the process of “production place—primary wholesale market—secondary wholesale market—retail market” [47]. Wholesale markets are the main places for agricultural trade. According to the traffic restriction policy in Beijing, non-local trucks can only enter the agricultural wholesale markets during 23:00–6:00 every day. Based on this rule, the study extracted the trip chains related to agricultural product circulation using two steps: (1) judge whether a truck has generated valid stop points in Beijing during 23:00–6:00; (2) check whether the semantic information matched by the valid stop points contains the fields “agricultural product” and “wholesale market”. As shown in Figure 1b, a truck generated a valid stop point at Beijing Dayang Road Agricultural Products Market, so the study considered that the trip chain of the truck is related to Beijing agricultural product circulation.

2.2.4. Construction of Intercity Origin–Destination (O-D) Sequences

The agricultural product circulation network constructed in this study takes the city as the spatial scale. With the geocoding interface of AutoNavi Map Open Platform, the study obtained the provinces and cities where the valid stop points are located. Thereafter, the study combined the valid stop points as municipalities/prefecture-level cities or prefecture-level administrative regions (hereinafter collectively referred to as cities) to form intercity origin–destination (O-D) sequences. As shown in Figure 1a, the truck generated valid stops in Jinzhong, Shijiazhuang and Dezhou, respectively, so the O-D sequence is “Jinzhong ( O 1 ) -Shijiazhuang ( D 1 / O 2 ) -Dezhou ( D 2 ) ”. The process of transporting agricultural products from the origin to destination is the freight linkage between the two cities.

2.2.5. Network Construction

We constructed an undirected weighted network G = ( V , E , W ) for every season based on the O-D sequence of all agricultural trucks with cities as nodes. V = { v i :   i = 1 , 2 , , n } is the node set, where n is the number of nodes, representing the number of cities in the network. E = { e i j :   i , j = 1 , 2 , , n } is the city-pair set, where e i j represents whether there is a freight linkage between city i and city j . If so, e i j = 1 ; otherwise, e i j = 0 . W = { w i j , i , j = 1 , 2 , , n } is the linkage strength set, where w i j is the weight of edge i j , representing the linkage strength (i.e., number of trips) between city i and city j .

2.3. Analysis Methods

Beijing agricultural product circulation networks of four seasons were constructed based on the related trip chains. The seasonal characteristics of agricultural product circulation networks were studied from three views. From the macro-view, the seasonal variations in the whole agricultural product circulation system were analyzed through the structure characteristics and spatial form of the network. From the meso-view, the seasonal variations in city linkages were analyzed through the accumulation probability of linkage strength and the primary linkage. From micro-view, the seasonal variations in cities were analyzed through the city importance and the city contributions to different seasons. The analysis framework is shown in Figure 2.
Evaluation indicators were applied to analyze the structural characteristics of agricultural product circulation network from multi-dimensions. Among them, the study used weighted degree centrality and coefficient of variation in the micro-view (nodes), linkage strength and coefficient of variation in meso-view (edges) and network hierarchy metrics and clustering coefficient in macro-view (networks). The definition of linkage strength is mentioned in Section 2.2.5, and other indicators are defined as follows:

2.3.1. Weighted Degree Centrality

Weighted degree centrality [48] was used to evaluate the importance of cities in the agricultural product circulation network as follows:
W D C i = D i × ( S i D i ) 1 α
where W D C i is the weighted degree centrality of node i . D i is the degree of node i , representing the influence of node i in the network. S i is the strength of node i , representing the activity of node i in the network. α is the tuning parameter, representing the difference in the effects of node degree and strength for node i in the network. In this study, α = 0.5 was set. Higher W D C i value means greater importance of node i in a network. D i and S i were calculated as follows:
D i = j N ( i ) e i j
S i = j N ( i ) w i j
where N ( i ) is the neighbor node set of node i .

2.3.2. Network Hierarchy Metrics

The hierarchical structure of the network reflects the homogeneity of the agricultural product circulation system, which was evaluated based on the rank-scale rule [49]. The nodes (cities) were ranked according to the weighted degree centrality, and then the rank-scale rule was applied. The formula is as follows:
W D C i = W D C 1 × r i q
Taking the natural logarithm of both sides of Equation (4), the one-dimensional linear regression equation can be obtained, as shown in Equation (5):
l n W D C i = l n W D C 1 q l n r i
where r i is the rank of city i . q is Zipf index, representing the hierarchical structure of the network. The higher the q value, the more obvious the hierarchical structure, and the more significant the heterogeneity of the network. Under this circumstance, cities with high weighted degree centrality are regarded as the core cities, which play the leading roles in the network. Furthermore, previous studies have proven that the hierarchical structure of the network leads to a “core–periphery“ structure in the spatial organization of city linkages [50,51]. The study calculated the core/periphery fit using UCINET 6.753 software to explore the core–periphery structural characteristics of the agricultural product circulation networks in Beijing.

2.3.3. Clustering Coefficient

The node clustering coefficient reflects aggregation degree of the networks, which is calculated by the ratio of the actual number of edges and possible ones between a node and all adjacent nodes [52]. The node clustering coefficient and the average clustering coefficient are calculated as follows:
C i = 2 E i D i ( D i 1 )
C = 1 n i V C i
where C i is the clustering coefficient of node i , C is the average clustering coefficient of the network and E i is the number of edges between node i and its neighbors. D i ( D i 1 ) / 2 is the maximum possible number of edges between node i and its neighbors. Higher C means higher degree of network aggregation.

2.3.4. Coefficient of Variation

Coefficient of variation is the evaluation indicator of the dispersion degree of a data set. In this study, coefficient of variation was calculated to evaluate the stability of cities and city-pairs in different seasons. The formulas are as follows:
C V i = σ i μ i
C V i j = σ i j μ i j
where C V i is the coefficient of variation in node i and C V i j is the coefficient of variation in city-pair i j . μ i is the average W D C i in four seasons. μ i j is the average linkage strength between node i and node j in four seasons. σ i and σ i j are the standard deviations. It is generally accepted that data tend to be discrete when the coefficient of variation is greater than 0.15. This study argued that the higher the coefficient of variation, the more obvious the seasonal variations in cities (city-pairs). Furthermore, the average coefficient of variation in all cities (city-pairs) indicates the seasonal variation degree of nodes (edges) in the network.

3. Results

3.1. Macro-View: Network

The agricultural product circulation networks in Beijing in four seasons are shown in Figure 3. The freight scale in winter only accounts for 19.0% of the year due to the widespread snowfall and foggy weather. The statistical characteristics of networks in other seasons are generally consistent, except in winter. The networks in four seasons involves 316 cities totally, with an average clustering coefficient of 0.36 (Table 2). The highest value of the weighted degree centrality is approximately 40.26 times that of the average value, indicating that the roles of different cities in the networks vary greatly. The goodness-of-fit of the rank-scale rule in four seasons is higher than 0.80, indicating an obvious hierarchical structure of agricultural product circulation in Beijing. Specifically, the hierarchical structure in summer and autumn is more obvious than that in winter and spring. The hierarchical structure can be demonstrated by the core/periphery fit, which is over 0.92 in four seasons and 3% higher in summer and autumn than in winter and spring.
On the spatial form of the networks, the agricultural product circulation networks in Beijing in four seasons show star structures, with Beijing as the center and the city linkage being radially distributed. The most closely connected provinces are mainly located around Beijing, such as Hebei, Liaoning and Shandong. The network density in the east regions is much higher than that in the west ones. Furthermore, agricultural product circulation networks of Beijing show obvious seasonal variations: south China has a higher network density in winter and spring, whereas, in northeast and northwest China, it is higher in summer and autumn.

3.2. Meso-View: Edges

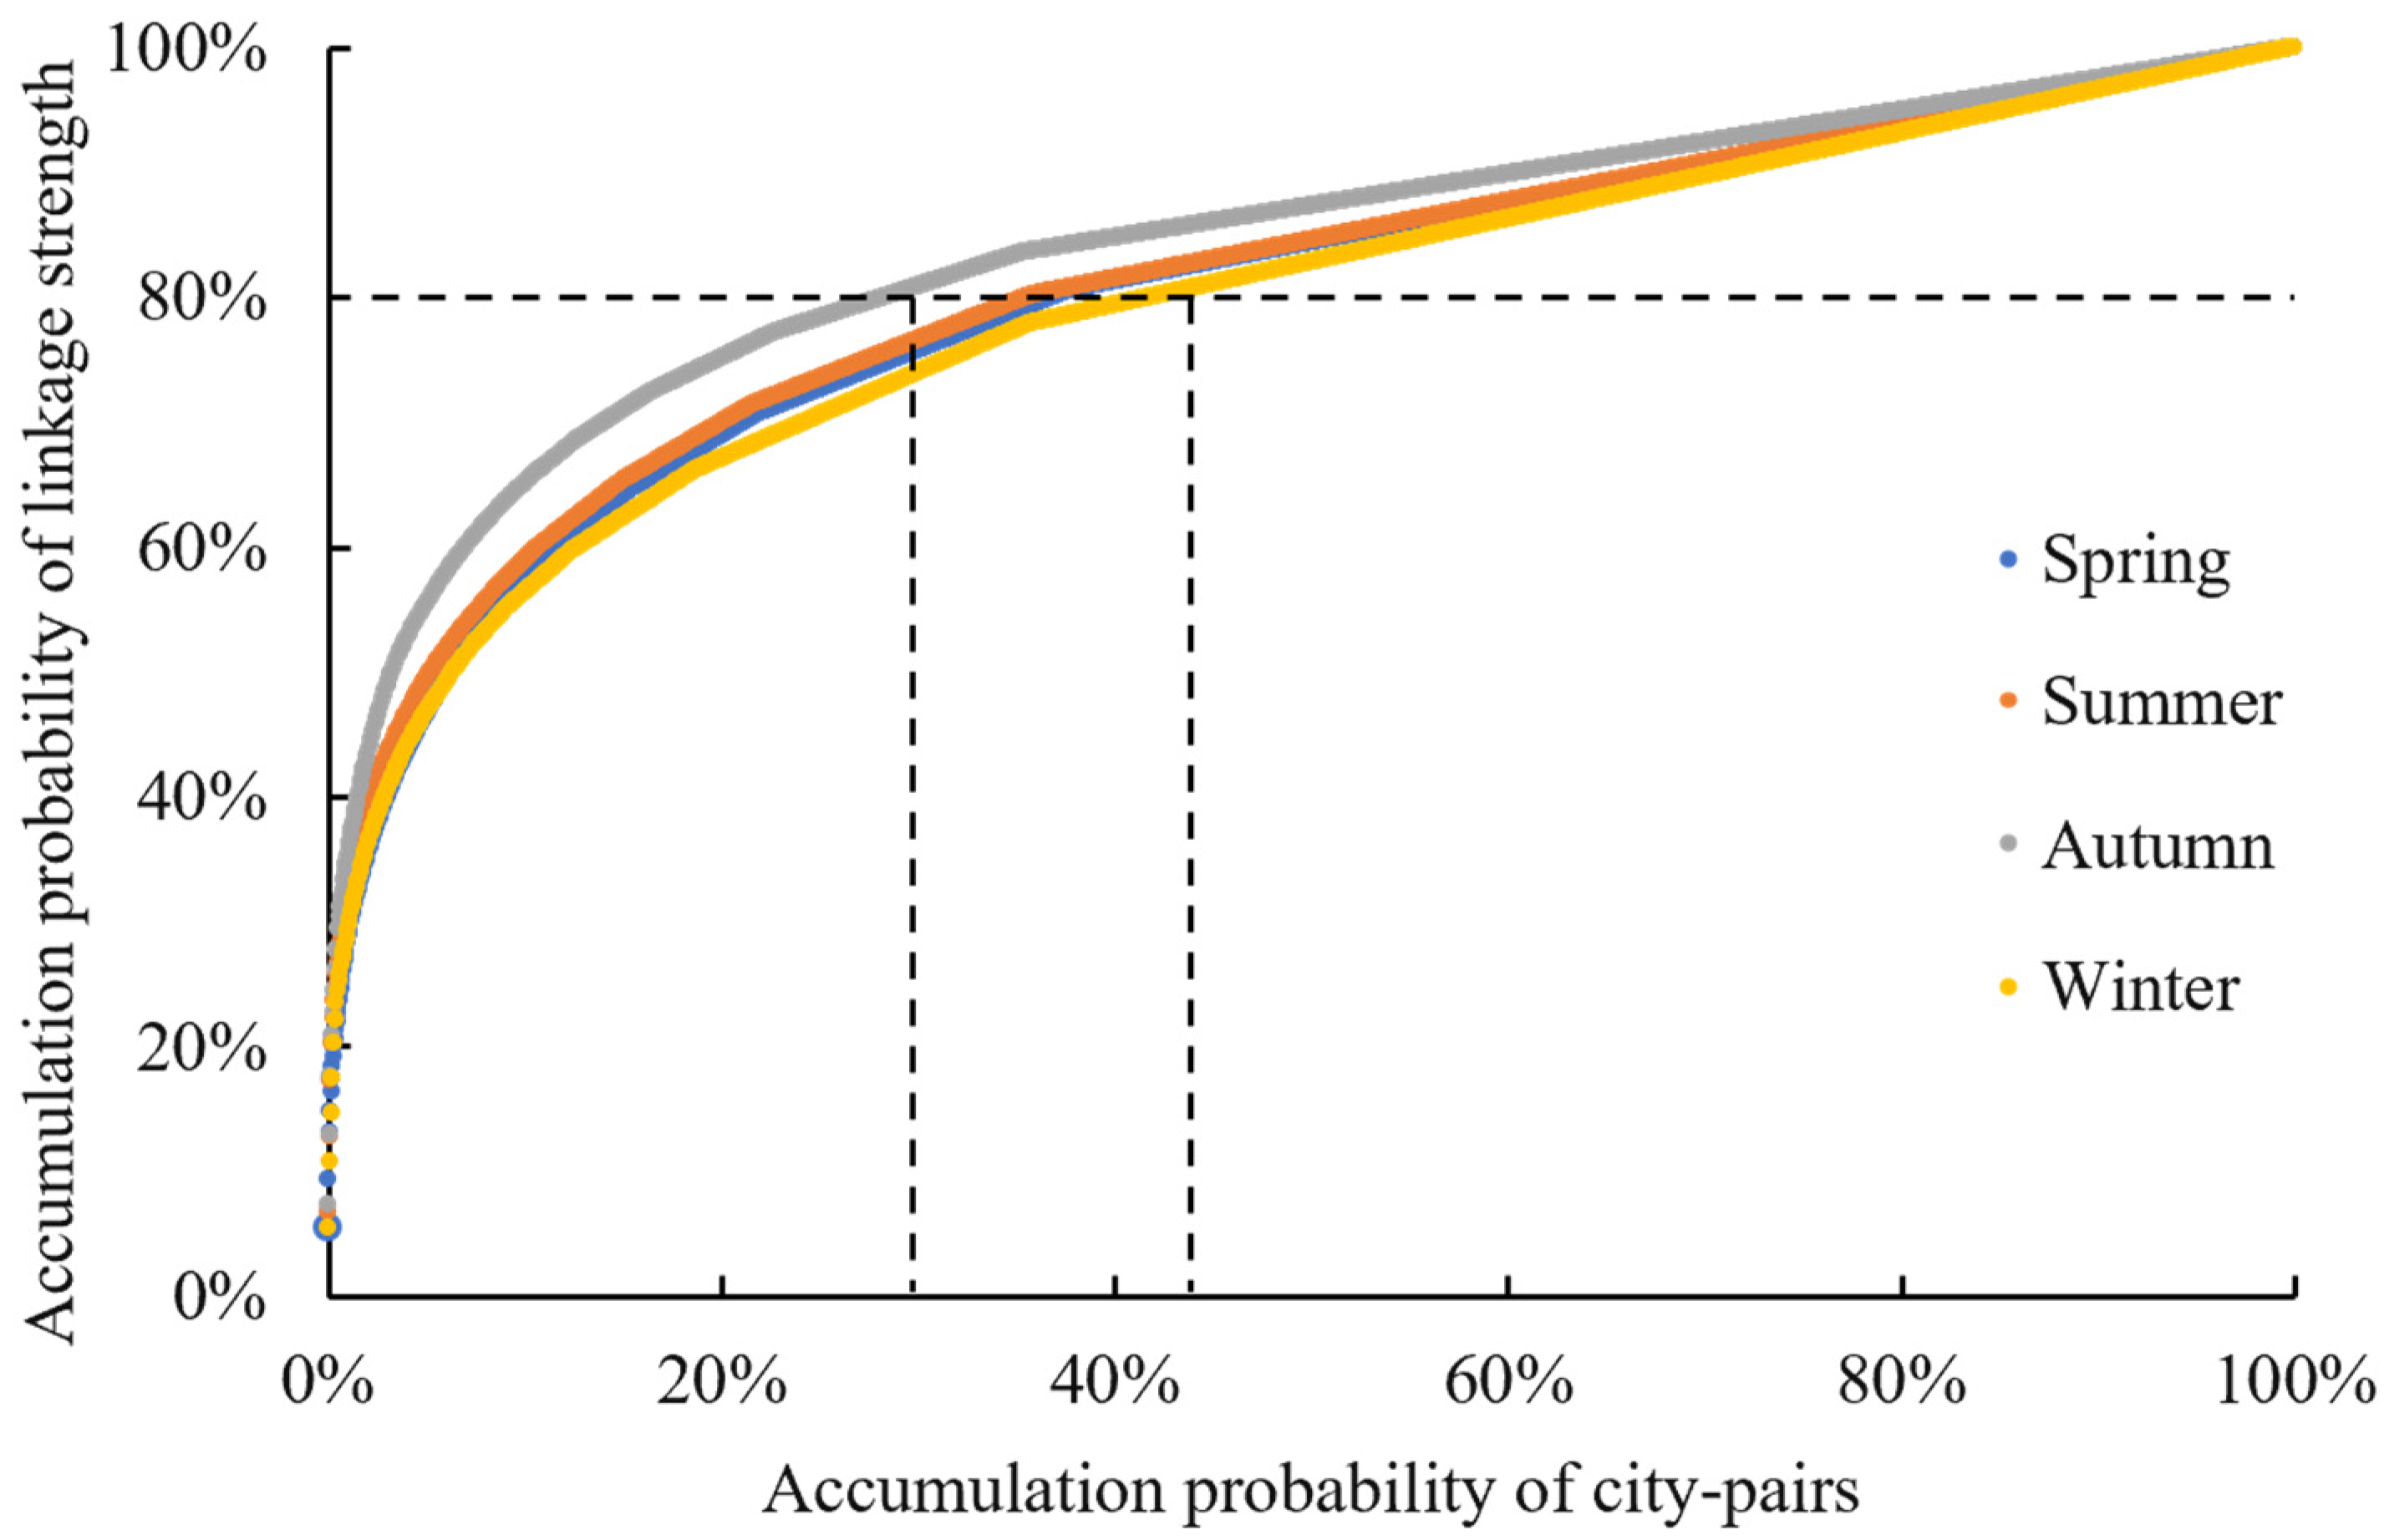
The linkage strength tends to cluster among a few city-pairs (Figure 4). A total of 80% of the linkage strength was concentrated in 36.9% (spring), 33.6% (summer), 28.4% (autumn) and 42.0% (winter) of city-pairs, which shows that the agglomeration is more prominent in summer and autumn. The top 20 city-pairs are all related to the Beijing–Tianjin–Hebei (BTH) urban agglomeration. The linkage strength of Beijing–Tianjin and Beijing–Langfang is much higher than that of other city-pairs by more than 45.3%. The seasonal variation degree of edges is 0.35, with obvious seasonal differences. In southern Hebei and Shandong, the linkage strength in winter and spring is higher than that in summer and autumn, which is opposite in northern Hebei, Inner Mongolia and northeast China.
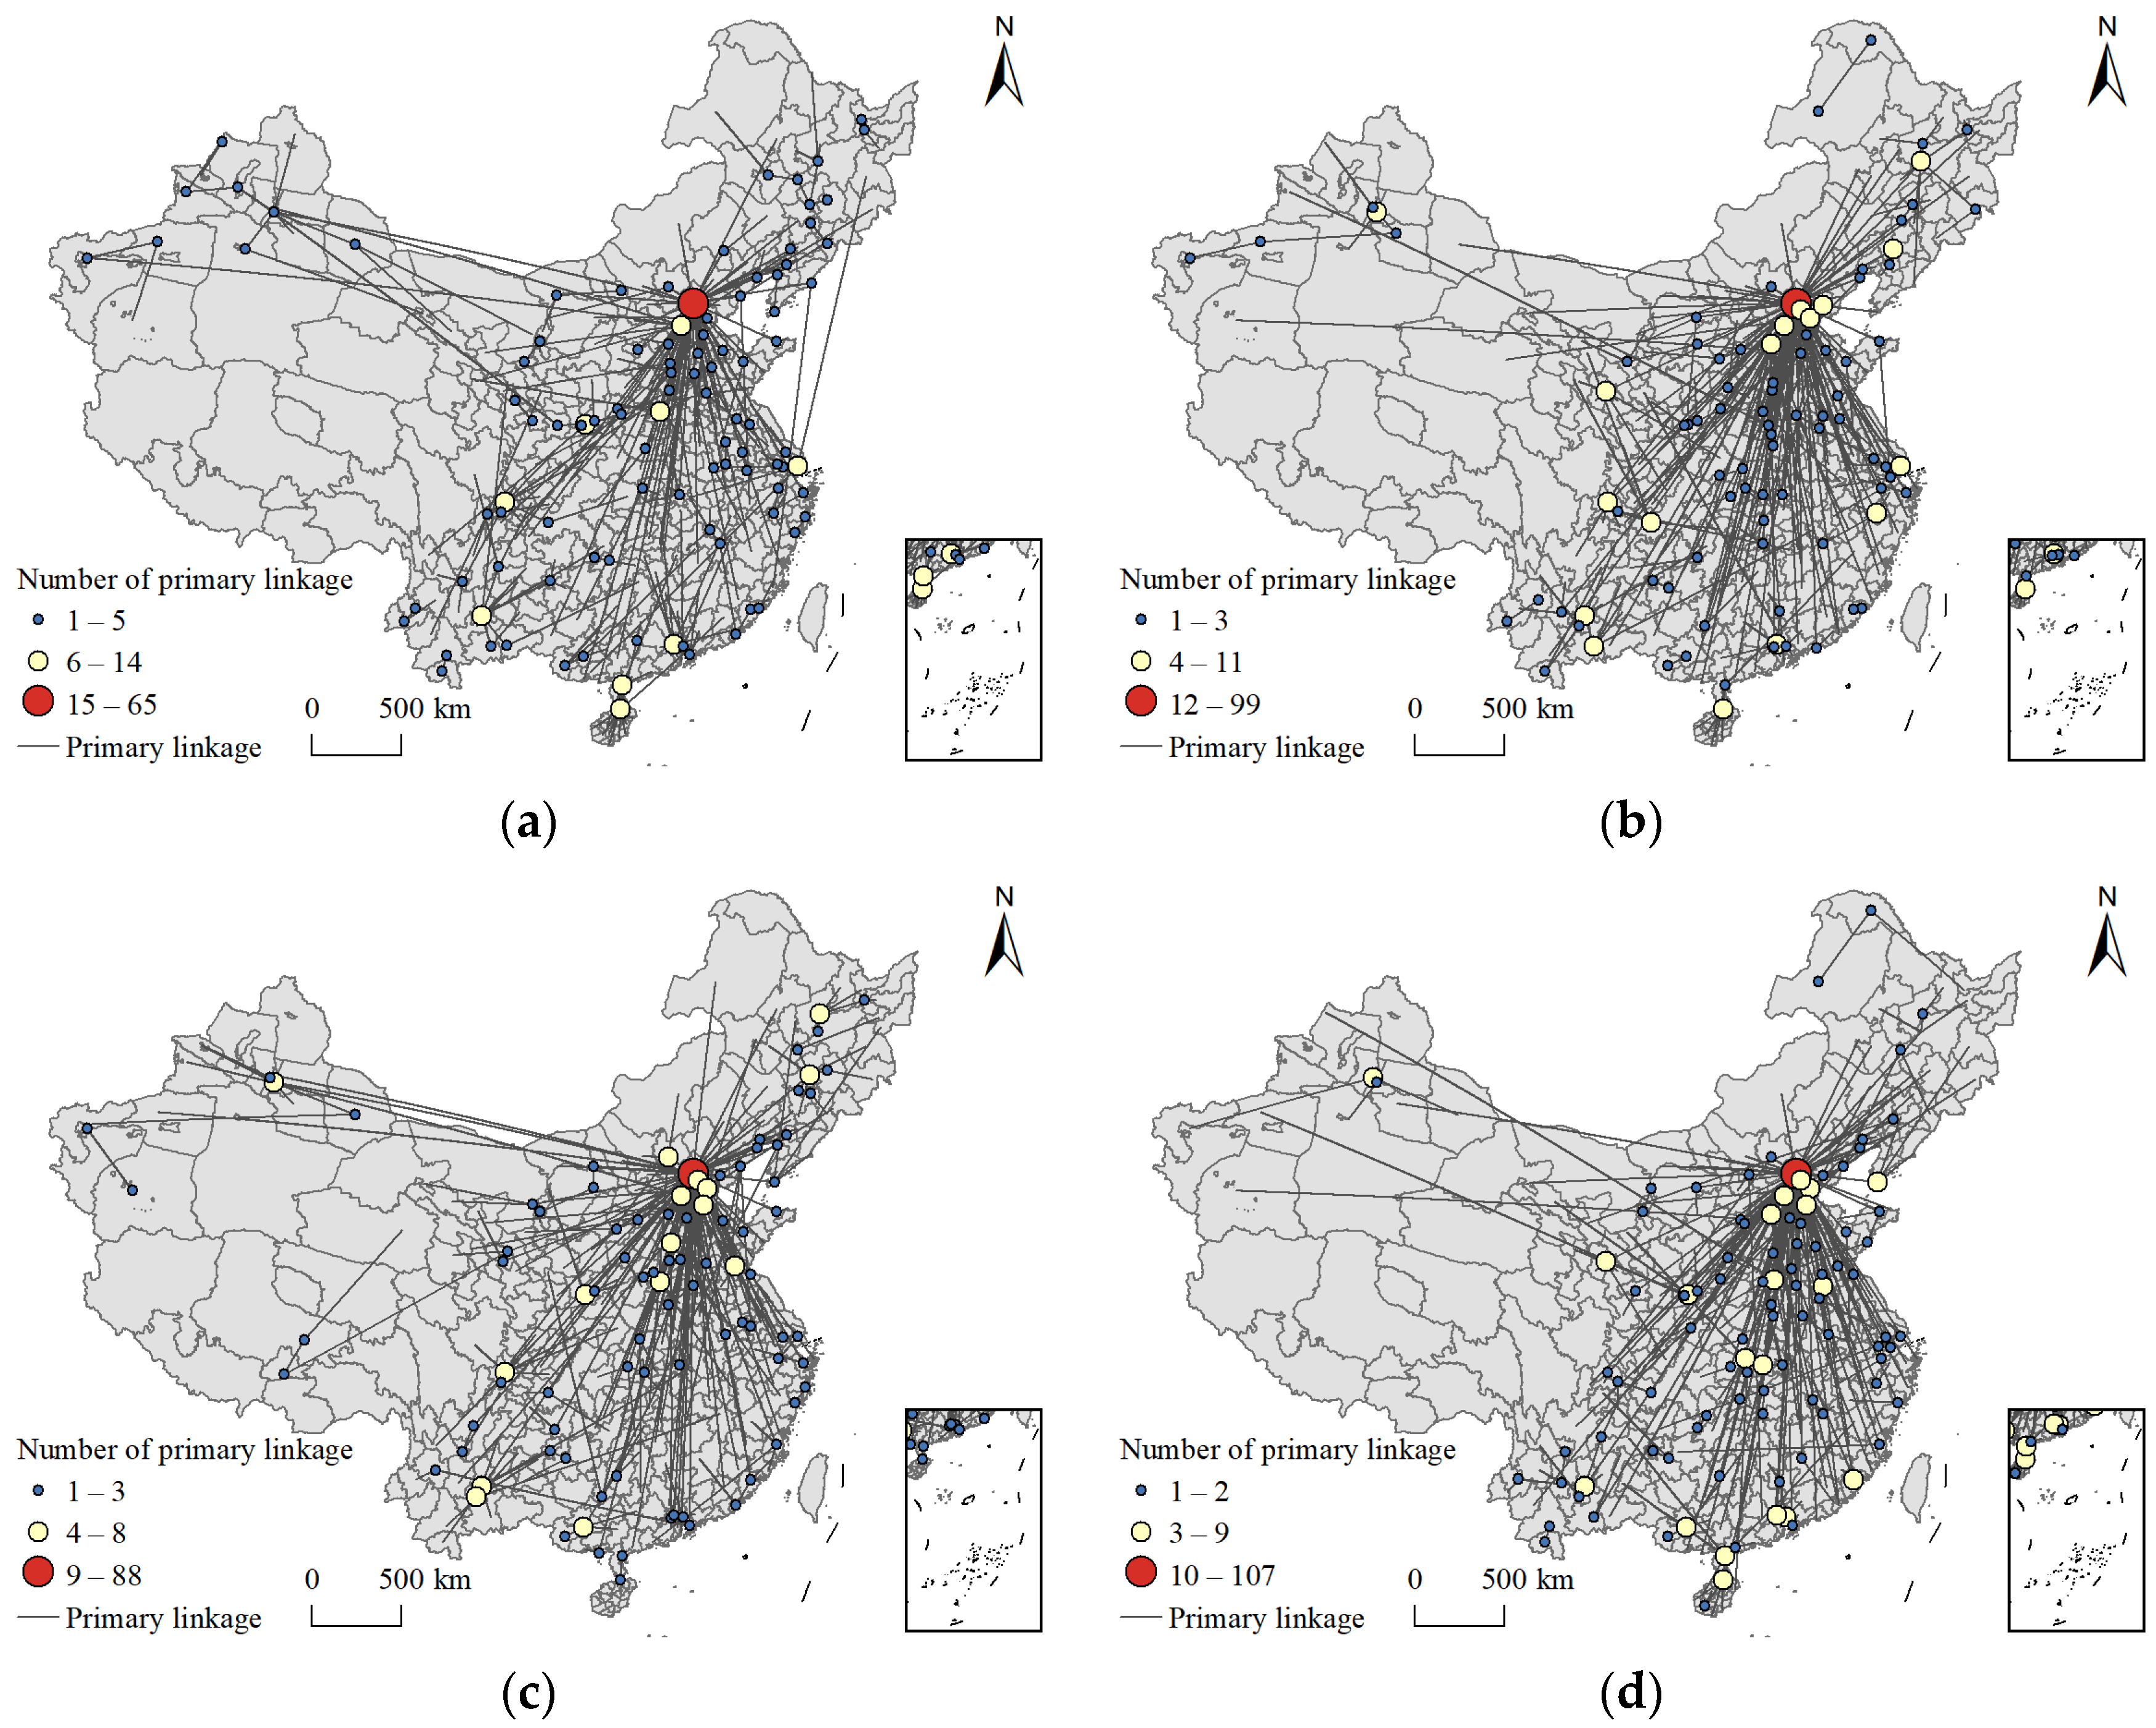
The primary linkages between cities form the backbone networks [53]. The number of primary linking cities in winter and spring exceeds that of summer and autumn by 10, and the average number of linked cities is lower than that in summer and autumn (Table 3). This evidence proves that the hub status of the linking cities is more prominent in summer and autumn. From the spatial pattern (Figure 5), the primary linking cities are widely distributed in the south of Beijing, which are economically developed cities such as Guangzhou and Chengdu. In addition, the primary linking cities are more centered around Beijing in the north in summer and autumn, such as Changchun, Harbin and Urumqi.

3.3. Micro-View: Nodes

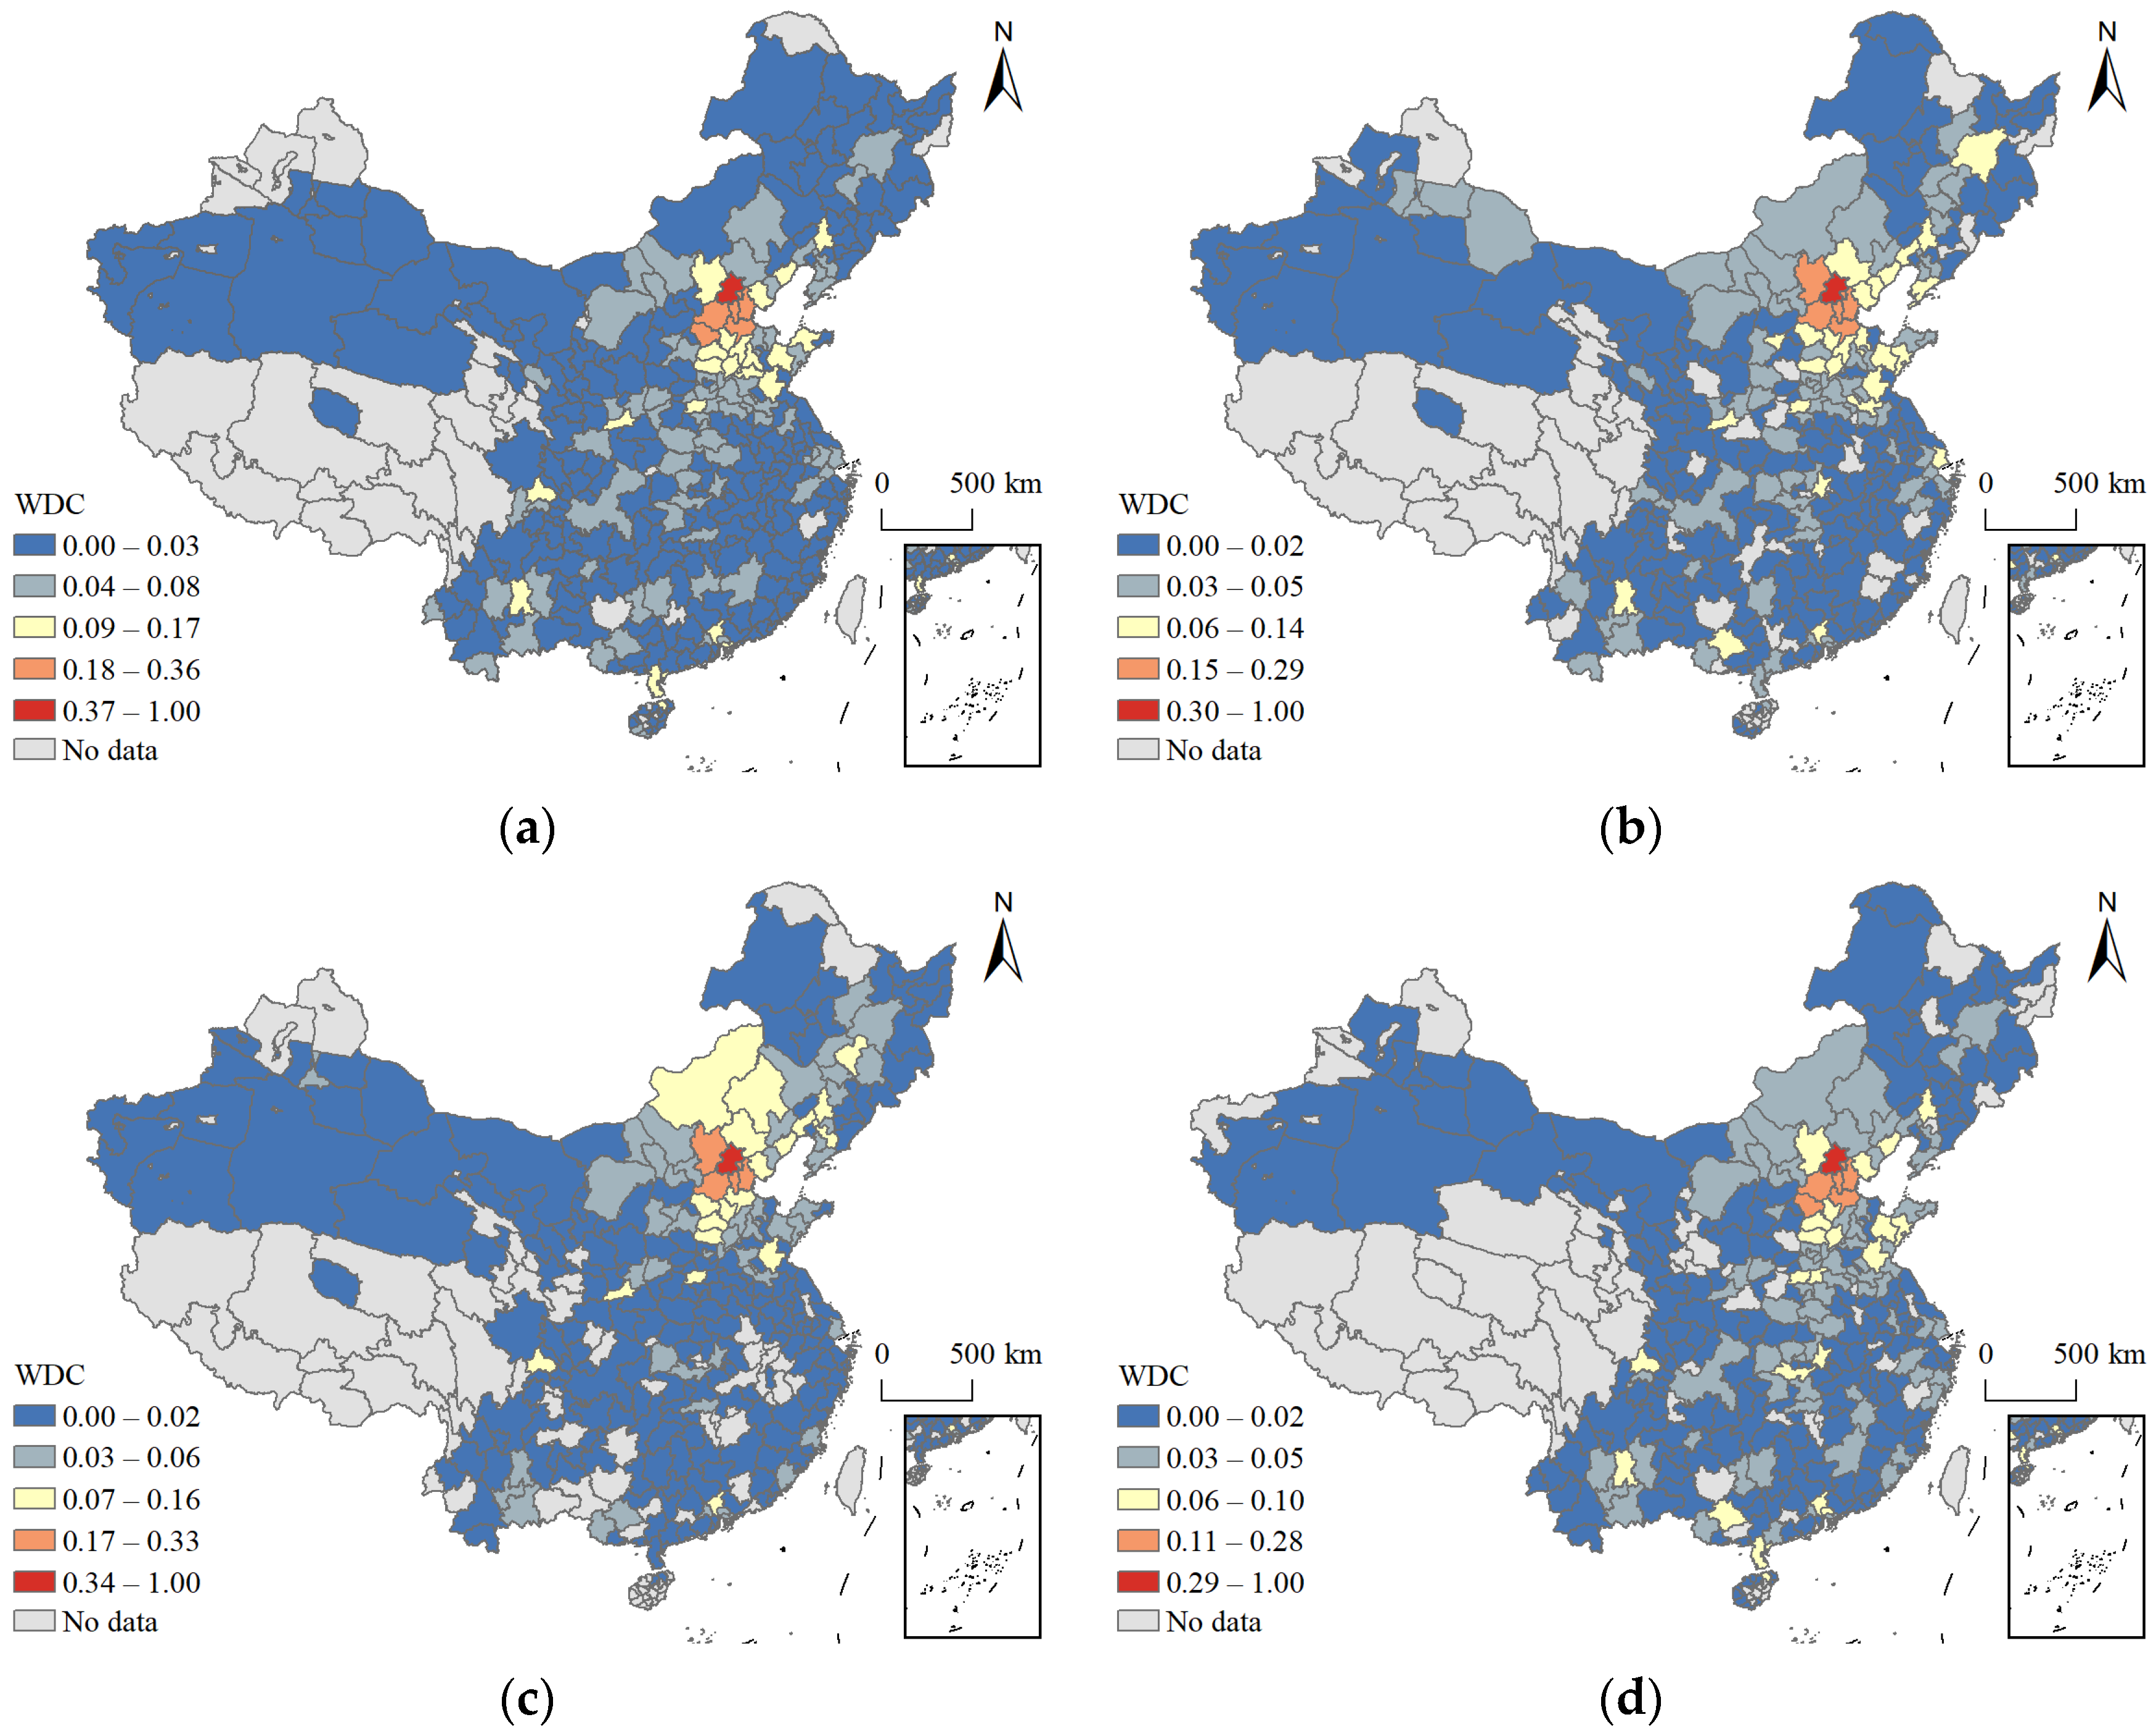
We divided the city importance into five levels according to the natural breaks (Jenks) (Figure 6). The first level consists of only Beijing. Cities in the second level account for 1.7% of the network in each season on average, located in the BTH region, represented by Langfang, Tianjin and Baoding. Cities in the third level account for 7.3% of the network in each season on average, including cities around Beijing and the economically developed cities in central and southern China. There are distinct seasonal variations in the spatial distribution of cities in the third level. In summer and autumn, cities are mainly located in northeast China, represented by Jinzhou, Anshan and Changchun. Specifically, the distribution of cities extends to the northeast to Harbin in summer, and north to Xilin Gol League and Chifeng in autumn. In winter and spring, the third level consists of economically developed cities from central, southern and southwestern China, such as Xi’an and Wuhan. Cities in the fourth level account for 23.3% of the network in each season on average, where the spatial distribution is almost identical in four seasons. These cities are affected by the radiation of the cities in the second and the third levels and distributed near the cities in the second and the third levels.
In terms of the spatial pattern, the city importance of the Beijing agricultural product circulation network in four seasons presents a significant spatial agglomeration effect. The global Moran’s I index is positive, and the Z-score is greater than 2.58 (Table 4), passing the significance test at a 1% level. Furthermore, Moran’s I index is slightly lower in winter and spring than in summer and autumn.
The seasonal variation degree of nodes is 0.27. The study divided cities into three categories according to the coefficient of variation (CV) as shown in Figure 7a. Cities with a CV lower than 0.15 are not affected by seasons, and are 108 in total, contributing 59.2% of the flow to Beijing agricultural product circulation, which can be divided into two types: (1) Cities whose importance belongs to the second or the third level play key roles in ensuring Beijing year-round supply of agricultural products. Such cities are regarded as core cities (Figure 7b), totaling 17, and are mainly neighbors of Beijing (13 in total) or developed cities far away from Beijing (4 in total), such as Guangzhou, Xi’an and Wuhan. Core cities without seasonal changes contribute 58.7% of the flow to Beijing agricultural product circulation. (2) Cities whose importance belongs to the fourth or the fifth level have less influence on Beijing agricultural product circulation, such as the Aksu region in Xinjiang. In addition, 56 cities with a high CV in summer and autumn are mainly from Heilongjiang, Inner Mongolia, Xinjiang and other northern provinces, accounting for 17.8% of the total, contributing 13.4% of the flow to Beijing agricultural product circulation. There are 3 core cities (Chengde, Zhangjiakou and Jinzhou) in summer and autumn, located in the north of Hebei. A total of 152 cities with a high CV in spring and winter are widely distributed in the south of Beijing, accounting for 48.1% of the total and contributing 27.4% of the flow to Beijing agricultural product circulation. There are 10 core cities in winter and spring, which are from the south of Hebei, Shandong and southwest China, such as Dezhou and Chengdu. Overall, a total of 30 core cities (9.4% of all cities) contributes 59.7% of the flow to Beijing agricultural product circulation.
Based on the above results, it can be found that the seasonal characteristics of agricultural product circulation network represents different patterns and laws from different views.

4. Discussion

4.1. Methodological Contribution

Complex network theory is an efficient and intuitive method used to analyze the structure of the trade network and their evolutionary process. It can reflect the trade relationship between nodes and reveal the mechanism of a complex system [14,54]. In fact, a wealth of works have been dedicated to studying the agricultural product circulation network [15,16,31,55]. However, the data available for network construction are mainly from the statistical yearbook. Limited by the spatiotemporal accuracy of static statistics, the network was constructed with the year as the time unit and the specific administrative unit (country, province, cities, etc.) as the space unit, ignoring the seasonal differences in agricultural product circulation. Different from the previous research, this study applied the trajectory mining technology to extract the trip chains related to agricultural product circulation based on massive freight trajectory data, providing a better analytical tool for agricultural product circulation network research. First, the trajectory data contain detailed information of the truck movement, which creates suitable conditions for constructing an agricultural product circulation network in different seasons. Second, the agricultural product circulation network built with the trajectory data can clearly and directly reflect the agricultural product circulation process. As the agricultural product circulation process becomes more complicated in the modern agri-food system, the corresponding network involves more participants, interconnecting wholesalers, retailers and distributors to producers and consumers [22]. Combined with the geographical and semantic data, this study can identify the locations and product types, which is useful for exploring in-depth information about diverse participants. For example, the relationship between the places of production and the consumption of agricultural products can be explored by visualizing the spatial distribution of agricultural wholesale markets, agricultural bases, industrial parks and other places related to agricultural product circulation.

4.2. Results and Significance

This study analyzed the agricultural product circulation network in Beijing from three views—networks, edges and nodes—in four seasons in order to understand the structure and seasonal changes in agricultural product circulation networks. The results show that the agricultural product circulation network in Beijing presents an obvious hierarchical structure, with the core/periphery fit higher than 0.92. There are 30 core cities in total, mainly located in the BTH region and the surrounding areas of BTH, such as Shandong, Liaoning and Inner Mongolia. The top 20 city-pairs in terms of linkage strength are all related to the BTH region, which indicates that the supply of agricultural products in Beijing follows the principle of proximity. This evidence reveals that distance is a key factor affecting agricultural product circulation, which is consistent with the results of the studies of regional [11] and transnational [16] agricultural product circulation. In addition, a few economically developed cities in central and southern China are core cities, such as Guangzhou, Wuhan and Xi’an, which indicates the influence of socioeconomic factors on the agricultural product circulation networks. Although such developed cities lack sufficient arable land, they have a strong function of resource aggregation and radiation due to the complete transportation infrastructure and rapid development of the logistics industry. Consistent findings were discussed in the study of rice supply patterns in China [17]. Core cities play critical roles in agricultural product circulation networks, ensuring the circulation efficiency of agricultural products. However, judging from the CV of cities, 47.1% of the core cities show seasonal variations. Zhangjiakou and Chengde in the north of Hebei are more effective in summer and autumn, whereas Shijiazhuang and Handan in the south of Hebei, and Chengdu and Kunming in southwest China are more effective in winter and spring. Such cities with seasonal variations are the key factor for network stability, which should be concerned. The above findings suggest that decision makers may improve the network stability and efficiency in two ways: (1) Strengthening agricultural product circulation between Beijing and its surrounding areas to increase the trade scale with relatively low environmental and economic costs [54]. For example, Beijing should attach importance to trade communication with Hebei, Shandong, Liaoning and other surrounding provinces for agricultural products with a high consumption that can be grown substitutionally in neighboring cities, such as vegetables. However, in other distant areas, special agricultural products, such as winter bamboo shoots and navel oranges, should be targeted. (2) Building logistics hub cities with seasonal characteristics and providing more trade information and logistics resources to these cities during special months. Thus, core cities with seasonal characteristics can play a stable hub role to ensure the stability of agricultural product circulation, such as Zhangjiakou and Chengde in summer and autumn, and Kunming and Chengdu in winter and spring.
Previous studies on agricultural product circulation networks were mainly carried out from a single perspective [17,55]. However, a network with three elements (network/link/node) requires us to develop a comprehensive and multi-view analytical framework. The seasonal characteristics of agricultural product circulation networks in Beijing show different spatiotemporal patterns in different views: from the macro-view (networks), the network density in the south is higher in winter and spring than in summer and autumn, whereas the opposite is true in the northeast and northwest. From the meso-view (edges), 80% of the linkage strength is concentrated in 35.3% of city-pairs. The primary linking cities are developed cities scattered in the south of Beijing in winter and spring, which are mainly located around Beijing in the north in summer and autumn. From the micro-view (nodes), 152 cities mainly serve Beijing agricultural product circulation in winter and spring, accounting for 48.1% of the total. These cities are widely located in the south of Beijing, contributing 27.4% of the flow to Beijing agricultural product circulation. In comparison, only 56 cities mainly serve Beijing agricultural product circulation in summer and autumn, which are from the north provinces, such as Heilongjiang and Inner Mongolia. The contribution of these cities is just half of that in winter and spring. The seasonal changes in agricultural product circulation are caused by the seasonal characteristics of agricultural production [36]. Temperature, precipitation and farming conditions make the production place and growth cycle of agricultural products diverse [56,57]. In winter and spring, the warm climate of southern China can supplement Beijing with temperature-loving products, such as watermelon and tomatoes, and the mild climate of the Yangtze River basin can supplement Beijing with cool-loving products, such as cabbage and celery. In summer and autumn, the high latitudes in the north with a bracing climate can grow a variety of basic products, such as peppers and onions, as well as specialty products, such as grapes and melons. The study also found that the seasonal variation degree of linkages (0.35) is 1.29 times higher than that of node (0.27). This evidence suggests that researchers and decision makers should be concerned about city connections rather than city functions. Furthermore, Beijing needs more long-distance supplementation of agricultural products in winter and spring because the cold climate in the northern regions in winter and spring is not suitable for growing agricultural products. However, the freight scale in winter is only 19.0% of that in the whole year, which indicates that severe weather brings adverse impact on agricultural product circulation. Decision makers should pay attention to the improvement of infrastructure such as cold chain logistics and roads in order to improve the ability of the agricultural product circulation system to cope with severe weather.

4.3. Limitations and Future Directions

This study still has some limitations. We neglected the direction of the interaction when building networks. In fact, agricultural product circulation is bidirectional in massive trajectory data. Thus, it is more reasonable to build agricultural product circulation networks considering the direction of interaction. Future research will take into account the time series information of the trajectory to construct a directed agricultural product circulation network. In addition, the research framework proposed in this study is applicable to the study of agricultural product trade in other megacities and regions. Future research will focus on the spatiotemporal characteristics of agricultural product circulation networks in megacities nationwide or in different regions to guide the construction of the backbone logistics network of agricultural products in China.

5. Conclusions

This study proposed a method to extract the trip chain related to agricultural product circulation networks with massive freight trajectory data mining and semantic tagging technologies and construct the networks in Beijing for different seasons with real truck freight trajectory data in 2018. Then, the seasonal variations in Beijing agricultural product circulation networks were analyzed from network, edge and node-oriented views. Some conclusions are drawn as follows:
(1)
The method proposed in this study to extract the trip chain of agricultural product circulation based on trajectory data can dynamically adjust the spatiotemporal refinement according to the analysis demand, which provides a favorable analytical tool for the study of an agricultural product circulation system.
(2)
From the macro-view, the agricultural product circulation networks in Beijing exhibit an obvious hierarchical and radial structure. The core/periphery fit of the networks is over 0.92. The network density in south China is higher in winter and spring than in summer and autumn, whereas the northeast and northwest regions are the opposite.
(3)
From the meso-view, 80% of the linkage strength is concentrated on 35.3% of city-pairs, where the agglomeration effect and hub status of the linking cities is more prominent in summer and autumn.
(4)
From the micro-view, a total of 316 cities form Beijing agricultural product circulation networks, 9.4% of which are core cities, located around Beijing, contributing 59.7% of the flow to Beijing agricultural product circulation. A total of 48.1% of cities are mainly served by Beijing agricultural product circulation in winter and spring, which is 2.7 times more than cities served in summer and autumn. These cities contribute 27.4% of the flow to Beijing agricultural product circulation, which is twice as much as cities served in summer and autumn.
This evidence suggests that the distance and socioeconomic conditions determine the status of cities in the agricultural product circulation networks. Core cities are the key to maintaining network stability. Thus, strengthening the linkages with neighboring cities and building logistics hub cities with seasonal characteristics are important issues to ensure the stability of agricultural product circulation networks. Researchers and decision makers should pay more attention to city linkages rather than city functions due to the stronger seasonal variations in city linkages. In addition, Beijing needs more long-distance supplementation of agricultural products in winter and spring, but the freight scale of agricultural product circulation in winter only accounts for 19.0% of the year. Decision makers should focus on the ability of the agricultural product circulation system to cope with severe weather.
The study reflects the spatiotemporal pattern and structure characteristics of the Beijing agricultural product circulation network from a comprehensive perspective, providing a reference for the potential optimization of agricultural product circulation networks.

Author Contributions

Conceptualization, Y.Z. and S.C.; methodology, Y.Z. and S.C.; formal analysis, Y.Z.; data curation, F.L.; writing—original draft preparation, Y.Z.; writing—review and editing, S.C. and F.L.; visualization, Y.Z.; supervision, F.L.; project administration, F.L.; funding acquisition, S.C. and F.L. All authors have read and agreed to the published version of the manuscript.

Funding

This research was funded by the National Natural Science Foundation of China (42101423), and China Postdoctoral Science Foundation (2020M680655; 2021T140656).

Data Availability Statement

Data are contained within the article.

Acknowledgments

The authors would like to thank the anonymous reviewers for their valuable inputs, as well as the academic editor for the constructive feedback.

Conflicts of Interest

The authors declare no conflict of interest.

References

  1. Liu, X.; Zeng, F. Poverty Reduction in China: Does the Agricultural Products Circulation Infrastructure Matter in Rural and Urban Areas? Agriculture 2022, 12, 1208. [Google Scholar] [CrossRef]
  2. Constantin, M.; Sacală, M.-D.; Dinu, M.; Piștalu, M.; Pătărlăgeanu, S.R.; Munteanu, I.-D. Vegetable Trade Flows and Chain Competitiveness Linkage Analysis Based on Spatial Panel Econometric Modelling and Porter’s Diamond Model. Agronomy 2022, 12, 411. [Google Scholar] [CrossRef]
  3. MacDonald, G.K. Eating on an interconnected planet. Environ. Res. Lett. 2013, 8, 021002. [Google Scholar] [CrossRef]
  4. Zhao, C.; Liu, B.; Piao, S.; Wang, X.; Lobell, D.B.; Huang, Y.; Huang, M.; Yao, Y.; Bassu, S.; Ciais, P. Temperature increase reduces global yields of major crops in four independent estimates. Proc. Natl. Acad. Sci. USA 2017, 114, 9326–9331. [Google Scholar] [CrossRef] [Green Version]
  5. Majerova, J.; Sroka, W.; Krizanova, A.; Gajanova, L.; Lazaroiu, G.; Nadanyiova, M. Sustainable brand management of alimentary goods. Sustainability 2020, 12, 556. [Google Scholar] [CrossRef] [Green Version]
  6. MacDonald, G.K.; Brauman, K.A.; Sun, S.; Carlson, K.M.; Cassidy, E.S.; Gerber, J.S.; West, P.C. Rethinking agricultural trade relationships in an era of globalization. BioScience 2015, 65, 275–289. [Google Scholar] [CrossRef]
  7. Lowder, S.K.; Skoet, J.; Raney, T. The number, size, and distribution of farms, smallholder farms, and family farms worldwide. World Dev. 2016, 87, 16–29. [Google Scholar] [CrossRef] [Green Version]
  8. Schweitzer, F.; Fagiolo, G.; Sornette, D.; Vega-Redondo, F.; Vespignani, A.; White, D.R. Economic networks: The new challenges. Science 2009, 325, 422–425. [Google Scholar] [CrossRef]
  9. Dalin, C.; Konar, M.; Hanasaki, N.; Rinaldo, A.; Rodriguez-Iturbe, I. Evolution of the global virtual water trade network. Proc. Natl. Acad. Sci. USA 2012, 109, 5989–5994. [Google Scholar] [CrossRef] [Green Version]
  10. Zsigmond, T.; Zsigmondová, A.; Machová, R. What makes the rural area resilient? In Proceedings of the 21st International Joint Conference Central and Eastern Europe in the Changing Business Environment, Prague, Czech Republic, 20–21 May 2021; pp. 313–322. [Google Scholar]
  11. Fernandez-Mena, H.; Gaudou, B.; Pellerin, S.; MacDonald, G.K.; Nesme, T. Flows in Agro-food Networks (FAN): An agent-based model to simulate local agricultural material flows. Agric. Syst. 2020, 180, 102718. [Google Scholar] [CrossRef]
  12. Konar, M.; Lin, X.; Ruddell, B.; Sivapalan, M. Scaling properties of food flow networks. PLoS ONE 2018, 13, e0199498. [Google Scholar] [CrossRef] [PubMed]
  13. Sun, Q.; Hou, M.; Shi, S.; Cui, L.; Xi, Z. The Influence of Country Risks on the International Agricultural Trade Patterns Based on Network Analysis and Panel Data Method. Agriculture 2022, 12, 361. [Google Scholar] [CrossRef]
  14. Qiang, W.; Niu, S.; Wang, X.; Zhang, C.; Liu, A.; Cheng, S. Evolution of the global agricultural trade network and policy implications for China. Sustainability 2019, 12, 192. [Google Scholar] [CrossRef] [Green Version]
  15. Zhou, L.; Tong, G. Structural Evolution and Sustainability of Agricultural Trade between China and Countries along the “Belt and Road”. Sustainability 2022, 14, 9512. [Google Scholar] [CrossRef]
  16. Ya, Z.; Pei, K. Factors Influencing Agricultural Products Trade between China and Africa. Sustainability 2022, 14, 5589. [Google Scholar] [CrossRef]
  17. Yang, J.; Wang, J.; Xu, C.; Liu, Y.; Yin, Q.; Wang, X.; Wang, L.; Wu, Y.; Xiao, G. Rice supply flows and their determinants in China. Resour. Conserv. Recycl. 2021, 174, 105812. [Google Scholar] [CrossRef]
  18. Abula, K.; Abula, B.; Hu, Q.; Chen, X.; Wang, D. Research on the High-Quality Development Path of the Cross-Border Agricultural Product Supply Chain between China and Central Asia. Agronomy 2022, 12, 2558. [Google Scholar] [CrossRef]
  19. Tuninetti, M.; Ridolfi, L.; Laio, F. Charting out the future agricultural trade and its impact on water resources. Sci. Total Environ. 2020, 714, 136626. [Google Scholar] [CrossRef]
  20. Ali, T.; Huang, J.; Wang, J.; Xie, W. Global footprints of water and land resources through China’s food trade. Glob. Food Secur. 2017, 12, 139–145. [Google Scholar] [CrossRef]
  21. Meyfroidt, P.; Lambin, E.F.; Erb, K.-H.; Hertel, T.W. Globalization of land use: Distant drivers of land change and geographic displacement of land use. Curr. Opin. Env. Sust. 2013, 5, 438–444. [Google Scholar] [CrossRef]
  22. Lee, D.; Yang, S.-G.; Kim, K.; Kim, B.J. Product flow and price change in an agricultural distribution network. Physica A 2018, 490, 70–76. [Google Scholar] [CrossRef]
  23. Hamilton, H.A.; Ivanova, D.; Stadler, K.; Merciai, S.; Schmidt, J.; Van Zelm, R.; Moran, D.; Wood, R. Trade and the role of non-food commodities for global eutrophication. Nat. Sustain. 2018, 1, 314–321. [Google Scholar] [CrossRef]
  24. Tuninetti, M.; Tamea, S.; Dalin, C. Water debt indicator reveals where agricultural water use exceeds sustainable levels. Water Resour. Res. 2019, 55, 2464–2477. [Google Scholar] [CrossRef] [Green Version]
  25. Schmitz, C.; Biewald, A.; Lotze-Campen, H.; Popp, A.; Dietrich, J.P.; Bodirsky, B.; Krause, M.; Weindl, I. Trading more food: Implications for land use, greenhouse gas emissions, and the food system. Glob. Environ. Chang. 2012, 22, 189–209. [Google Scholar] [CrossRef]
  26. Liu, J.; Mooney, H.; Hull, V.; Davis, S.J.; Gaskell, J.; Hertel, T.; Lubchenco, J.; Seto, K.C.; Gleick, P.; Kremen, C. Systems integration for global sustainability. Science 2015, 347, 1258832. [Google Scholar] [CrossRef] [PubMed] [Green Version]
  27. Dalin, C.; Qiu, H.; Hanasaki, N.; Mauzerall, D.L.; Rodriguez-Iturbe, I. Balancing water resource conservation and food security in China. Proc. Natl. Acad. Sci. USA 2015, 112, 4588–4593. [Google Scholar] [CrossRef] [Green Version]
  28. Sartori, M.; Schiavo, S. Connected we stand: A network perspective on trade and global food security. Food Policy 2015, 57, 114–127. [Google Scholar] [CrossRef] [Green Version]
  29. Carr, J.A.; D’Odorico, P.; Laio, F.; Ridolfi, L. Recent history and geography of virtual water trade. PLoS ONE 2013, 8, e55825. [Google Scholar] [CrossRef]
  30. Lin, X.; Ruess, P.J.; Marston, L.; Konar, M. Food flows between counties in the United States. Environ. Res. Lett. 2019, 14, 084011. [Google Scholar] [CrossRef]
  31. Karakoc, D.B.; Wang, J.; Konar, M. Food flows between counties in the United States from 2007 to 2017. Environ. Res. Lett. 2022, 17, 034035. [Google Scholar] [CrossRef]
  32. Smith, T.M.; Goodkind, A.L.; Kim, T.; Pelton, R.E.; Suh, K.; Schmitt, J. Subnational mobility and consumption-based environmental accounting of US corn in animal protein and ethanol supply chains. Proc. Natl. Acad. Sci. USA 2017, 114, E7891–E7899. [Google Scholar] [CrossRef] [PubMed] [Green Version]
  33. Fair, K.R.; Bauch, C.T.; Anand, M. Dynamics of the global wheat trade network and resilience to shocks. Sci. Rep. 2017, 7, 7177. [Google Scholar] [CrossRef] [PubMed] [Green Version]
  34. Ercsey-Ravasz, M.; Toroczkai, Z.; Lakner, Z.; Baranyi, J. Complexity of the international agro-food trade network and its impact on food safety. PLoS ONE 2012, 7, e37810. [Google Scholar] [CrossRef]
  35. Sun, J.; Mooney, H.; Wu, W.; Tang, H.; Tong, Y.; Xu, Z.; Huang, B.; Cheng, Y.; Yang, X.; Wei, D. Importing food damages domestic environment: Evidence from global soybean trade. Proc. Natl. Acad. Sci. USA 2018, 115, 5415–5419. [Google Scholar] [CrossRef] [Green Version]
  36. Sibhatu, K.T.; Qaim, M. Rural food security, subsistence agriculture, and seasonality. PLoS ONE 2017, 12, e0186406. [Google Scholar] [CrossRef] [Green Version]
  37. Lobell, D.B.; Schlenker, W.; Costa-Roberts, J. Climate trends and global crop production since 1980. Science 2011, 333, 616–620. [Google Scholar] [CrossRef] [Green Version]
  38. Wen, L.; Song, Q. Simulation study on carbon emission of China’s freight system under the target of carbon peaking. Sci. Total Environ. 2022, 812, 152600. [Google Scholar] [CrossRef]
  39. Cheng, S.; Zhang, B.; Peng, P.; Yang, Z.; Lu, F. Spatiotemporal evolution pattern detection for heavy-duty diesel truck emissions using trajectory mining: A case study of Tianjin, China. J. Clean. Prod. 2020, 244, 118654. [Google Scholar] [CrossRef]
  40. Cheng, S.; Lu, F.; Peng, P. A high-resolution emissions inventory and its spatiotemporal pattern variations for heavy-duty diesel trucks in Beijing, China. J. Clean. Prod. 2020, 250, 119445. [Google Scholar] [CrossRef]
  41. Han, Y.; Yang, L.; Jia, K.; Li, J.; Feng, S.; Chen, W.; Zhao, W.; Pereira, P. Spatial distribution characteristics of the COVID-19 pandemic in Beijing and its relationship with environmental factors. Sci. Total Environ. 2021, 761, 144257. [Google Scholar] [CrossRef] [PubMed]
  42. Siripirote, T.; Sumalee, A.; Ho, H. Statistical estimation of freight activity analytics from Global Positioning System data of trucks. Transport. Res. E-Log. 2020, 140, 101986. [Google Scholar] [CrossRef]
  43. Yang, Y.; Jia, B.; Yan, X.-Y.; Li, J.; Yang, Z.; Gao, Z. Identifying intercity freight trip ends of heavy trucks from GPS data. Transport. Res. E-Log. 2022, 157, 102590. [Google Scholar] [CrossRef]
  44. Zhu, Z.; Ren, H.; Ruan, S.; Han, B.; Bao, J.; Li, R.; Li, Y.; Zheng, Y. Icfinder: A ubiquitous approach to detecting illegal hazardous chemical facilities with truck trajectories. In Proceedings of the 29th International Conference on Advances in Geographic Information Systems, Beijing, China, 2–5 November 2021; pp. 37–40. [Google Scholar]
  45. Gingerich, K.; Maoh, H.; Anderson, W. Classifying the purpose of stopped truck events: An application of entropy to GPS data. Transport. Res. C-Emer. 2016, 64, 17–27. [Google Scholar] [CrossRef]
  46. Sarti, L.; Bravi, L.; Sambo, F.; Taccari, L.; Simoncini, M.; Salti, S.; Lori, A. Stop purpose classification from GPS data of commercial vehicle fleets. In Proceedings of the 2017 IEEE International Conference on Data Mining Workshops (ICDMW), New Orleans, LA, USA, 18–21 November 2017; pp. 280–287. [Google Scholar]
  47. Jia, X.; Huang, J.; Xu, Z. Marketing of farmer professional cooperatives in the wave of transformed agrofood market in China. China Econ. Rev. 2012, 23, 665–674. [Google Scholar] [CrossRef]
  48. Jiao, J.; Wang, J.; Jin, F. Impacts of high-speed rail lines on the city network in China. J. Transp. Geogr. 2017, 60, 257–266. [Google Scholar] [CrossRef]
  49. Zipf, G.K. Human Behavior and the Principle of Least Effort: An Introduction to Human Ecology; Ravenio Books: Norris, MT, USA, 2016. [Google Scholar]
  50. Chen, W.; Liu, W.; Ke, W.; Wang, N. Understanding spatial structures and organizational patterns of city networks in China: A highway passenger flow perspective. J. Geogr. Sci. 2018, 28, 477–494. [Google Scholar] [CrossRef] [Green Version]
  51. Yang, L.; Wang, J.; Yang, Y. Spatial evolution and growth mechanism of urban networks in western China: A multi-scale perspective. J. Geogr. Sci. 2022, 32, 517–536. [Google Scholar] [CrossRef]
  52. Newman, M.E. The structure and function of complex networks. SIAM Rev. 2003, 45, 167–256. [Google Scholar] [CrossRef] [Green Version]
  53. Li, T.; Wang, J.; Huang, J.; Gao, X. Exploring temporal heterogeneity in an intercity travel network: A comparative study between weekdays and holidays in China. J. Geogr. Sci. 2020, 30, 1943–1962. [Google Scholar] [CrossRef]
  54. Qiang, W.; Niu, S.; Liu, A.; Kastner, T.; Bie, Q.; Wang, X.; Cheng, S. Trends in global virtual land trade in relation to agricultural products. Land Use Policy 2020, 92, 104439. [Google Scholar] [CrossRef]
  55. Campi, M.; Duenas, M.; Fagiolo, G. How do countries specialize in agricultural production? A complex network analysis of the global agricultural product space. Environ. Res. Lett. 2020, 15, 124006. [Google Scholar] [CrossRef]
  56. Wang, L.; Anna, H.; Zhang, L.; Xiao, Y.; Wang, Y.; Xiao, Y.; Liu, J.; Ouyang, Z. Spatial and temporal changes of arable land driven by urbanization and ecological restoration in China. Chin. Geogr. Sci. 2019, 29, 809–819. [Google Scholar] [CrossRef] [Green Version]
  57. Zhang, X.; Liu, Y.; Liu, Y.; Cui, Q.; Yang, L.; Hu, X.; Guo, J.; Zhang, J.; Yang, S. Impacts of climate change on self-sufficiency of rice in China: A CGE-model-based evidence with alternative regional feedback mechanisms. J. Clean. Prod. 2019, 230, 150–161. [Google Scholar] [CrossRef]
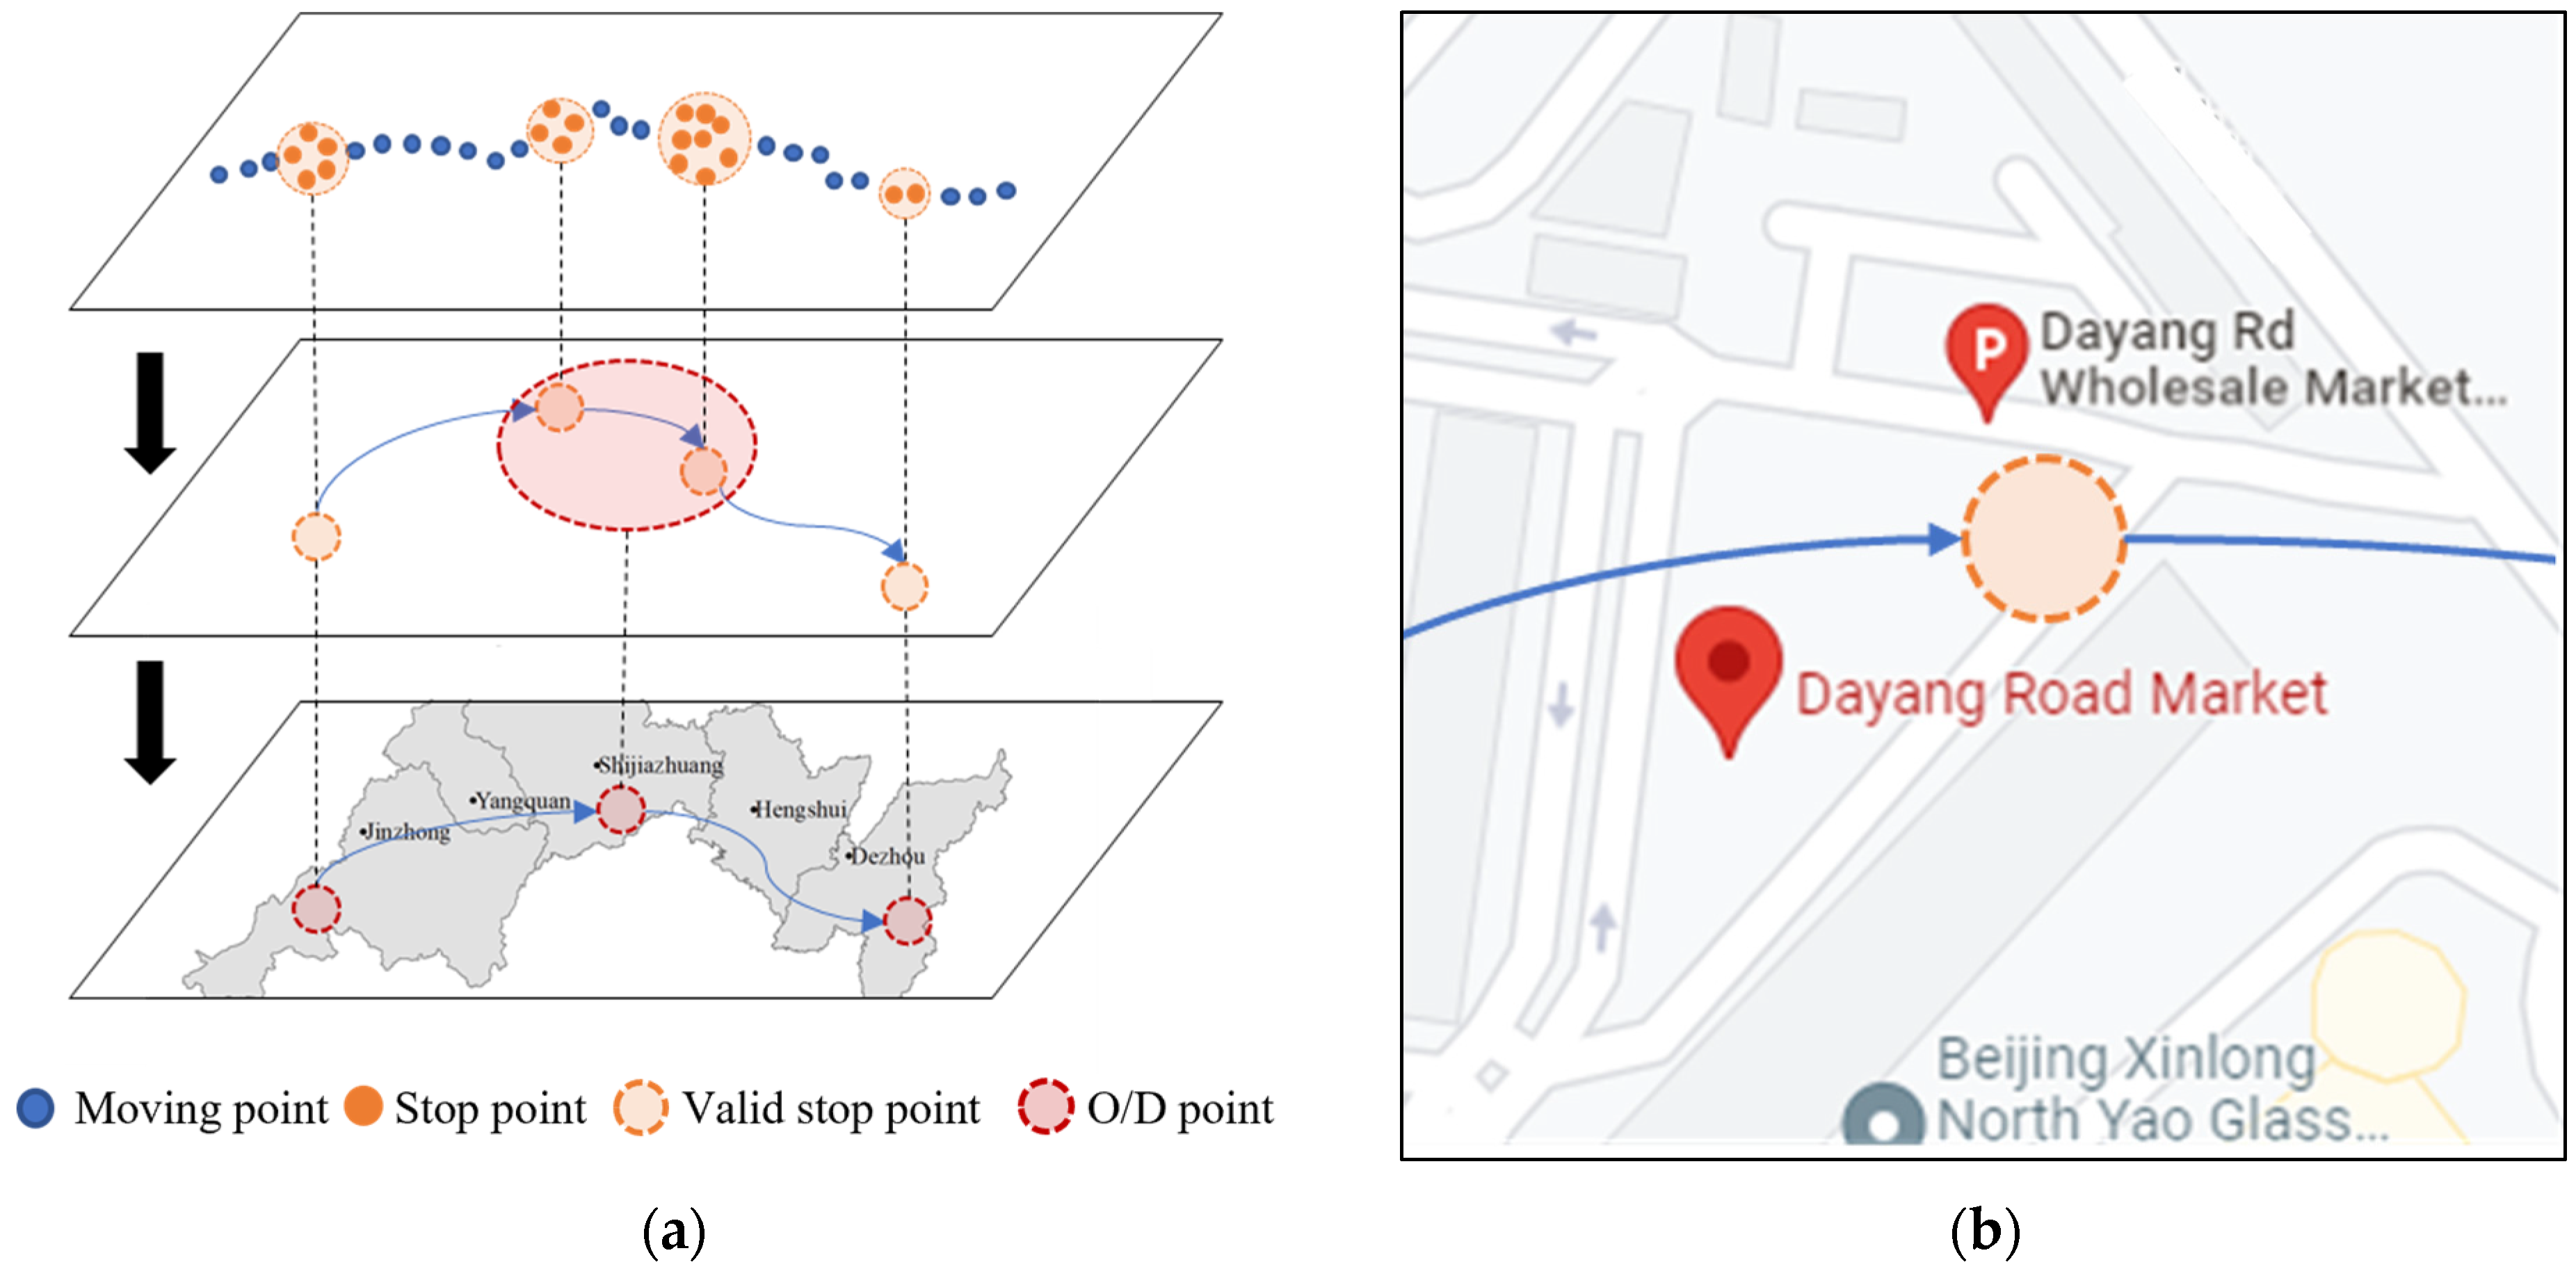
Figure 1. Illustration of data processing: (a) origin–destination sequence construction; (b) valid stop point and the surrounding POI/AOI.
Agronomy 12 02827 g001
Figure 2. Analysis framework of agricultural product circulation networks.
Agronomy 12 02827 g002
Figure 3. Spatial pattern of agricultural product circulation networks in Beijing in four seasons: (a) spring; (b) summer; (c) autumn; (d) winter.
Agronomy 12 02827 g003
Figure 4. Comparison of the accumulation probability of the linkage strength between city-pairs.
Agronomy 12 02827 g004
Figure 5. Spatial pattern of the primary linkages in four seasons: (a) spring; (b) summer; (c) autumn; (d) winter.
Agronomy 12 02827 g005
Figure 6. Spatial distribution of city importance in four seasons s: (a) spring; (b) summer; (c) autumn; (d) winter.
Agronomy 12 02827 g006
Figure 7. Spatial distribution of city coefficient of variation: (a) nationwide; (b) core cities.
Agronomy 12 02827 g007
Table 1. Relationship between POI/AOI types and the purpose of freight activities.
POI/AOI NamePOI/AOI TypeActivity Purpose
Shouguang Agricultural Products Logistics ParkIndustrial ParkWork
Wensheng HomeResidential AreaRest
Beijing Dayang Road Agricultural Products MarketComprehensive MarketWork
Table 2. Statistical characteristics of agricultural product circulation networks in Beijing.
SeasonNumber of CitiesFreight Scale 1 Average   W D C   2 Maximum   W D C Average   C V   3 q   4 Goodness-of-Fit (R2)Core/Periphery Fit C   5
Spring305694520.50825.231.201.110.830.920.38
Summer295558721.83845.291.251.120.860.950.36
Autumn284654123.97904.851.241.210.890.960.36
Winter290446018.75742.531.251.110.870.930.34
1 The sum of linkage strength between cities in the network; 2 Weighted degree centrality; 3 Coefficient of variation; 4 Zipf index; 5 Clustering coefficient.
Table 3. Statistical characteristics of the primary linking cities.
SeasonNumber of Primary Liking CitiesAverage Number of Linked Cities
Spring1033.05
Summer933.20
Autumn943.09
Winter1032.80
Table 4. Global Moran’s I of spatial distribution of city importance.
SeasonGlobal Moran’s I IndexZ-Scorep-Value
Spring0.2120.05<0.001
Summer0.2318.34<0.001
Autumn0.2618.90<0.001
Winter0.1916.32<0.001
Publisher’s Note: MDPI stays neutral with regard to jurisdictional claims in published maps and institutional affiliations.