Article

Comprehensive Genomic Characterization of the NAC Transcription Factors and Their Response to Drought Stress in Dendrobium catenatum

1
Key Laboratory for Quality Regulation of Tropical Horticultural Crops of Hainan Province, School of Horticulture, Hainan University, Haikou 570228, China
2
Haikou Experimental Station, Institute of Tropical Fruit Tree Research, Chinese Academy of Tropical Agricultural Sceinces (CATAS), Haikou 571101, China
3
Hainan Academy of Forestry (Hainan Academy of Mangrove), Haikou 571100, China
*
Author to whom correspondence should be addressed.
These authors contributed equally to this work.
Agronomy 2022, 12(11), 2753; https://doi.org/10.3390/agronomy12112753
Submission received: 12 October 2022 / Revised: 2 November 2022 / Accepted: 4 November 2022 / Published: 5 November 2022
(This article belongs to the Section Horticultural and Floricultural Crops)

Abstract

:
As a large transcription factor family, NAC family proteins (NAM, ATAF1,2, and CUC2) play critical roles in plant growth, development, and response to stresses. Herein, the NAC gene family of Dendrobium catenatum was identified and analyzed by bioinformatics methods. Their expression patterns in different tissues and under drought stress were analyzed using RNA-seq data and the quantitative real-time reverse transcription-polymerase chain reaction (RT-qPCR) method. A total of 90 NAC genes were identified, encoding amino acids with numbers ranging from 88 to 1065, with protein molecular weight ranging from 10.34 to 119.24 kD, and isoelectric point ranging from 4.5 to 9.99. Phylogenetic analysis showed that the DcNAC proteins could be divided into 17 subgroups, and each subgroup had conserved motif composition and gene structure. Twenty types of cis-elements were identified in the DcNAC promoters. RNA-seq analysis showed that the expression of DcNAC genes had tissue specificity and displayed different expression patterns under drought stress. Co-expression network analysis of the DcNAC genes revealed nine hub genes, and their expression levels were then validated by RT-qPCR. The results showed that DcNAC6, DcNAC18, DcNAC29, DcNAC44, and DcNAC51 (mainly in roots) as well as DcNAC16 and DcNAC64 (mainly in leaves) were considered as the candidate genes for drought tolerance in D. catenatum. Taken together, this study identified candidate NAC genes with potential functions in response to drought stress, which is valuable for development of drought resistance in D. catenatum.

1. Introduction

Abiotic stresses, including drought, temperature, salt, heavy metals, and nutrition, can affect plant growth and crop yield and quality [1]. Plants have developed a set of physiological and biochemical mechanisms to adapt to, resist, or eliminate the effects of stresses over a long period of time [2,3,4]. Among them, gene expression regulation is the most common way to respond to plant stress [5,6]. After sensing stress, plant cells transmit signals to the transcription factor (TF), which responds to stress through some signaling pathways. TFs bind to specific DNA sequences in the upstream promoter region of target genes, named cis-acting elements, through their DNA-binding domain (DBD), thus regulating the expression of target genes in different tissues or cells, or under different environmental conditions, and reducing plant damage [5,6,7]. TFs play critical roles in plant growth, development, and stress response; therefore, study of TFs has drawn increasingly more interest [8]. In recent decades, researchers have successively cloned substantial TFs from different plants to investigate their functions and elucidate the stress resistance mechanism of plants [8].
According to the specificity of DNA-binding regions, TFs can be divided into many different families, such as WRKY, MYB, NAC, bZIP, HB, and AP2/ERF [9,10]. NAC is a family of TFs unique to plants originally identified from three consensus sequences: NAM (no apical meristem) from Petunia hybrida, and ATAF1/2 and CUC2 (cup-shaped cotyledon) from Arabidopsis thaliana [11]. NAC transcription factor contains a highly conserved N-terminal domain and a diverse C-terminal domain. The N-terminal domain, also named as the NAC domain, generally contains approximately 150 amino acids [11,12,13]. The NAC domain is the binding domain of NAC TFs, which can be divided into five subdomains (A to E). Subdomains A, C, and D are highly conserved, and the subdomain A may be involved in the formation of functional dimers. Subdomains C and D contain nuclear localization signals, which might be related to DNA binding. A few NAC proteins have a negative regulatory domain (NRD) in subdomain D, which can inhibit transcriptional activity [14,15,16]. Subdomains B and E are varied and might have different functions [17]. Subdomain E may cooperate with subdomain D to interact with DNA [17,18,19].
NAC genes have been identified from a variety of plants, such as A. thaliana [17], soybean [20], pepper [21], longan [22], and sunflower [23]. Previous studies showed that NAC factors play critical roles in response to various abiotic stresses [24], physiological and developmental processes [25], and hormone signaling [17]. It has been revealed that Arabidopsis AtNAC019, AtNAC055, and AtNAC072 genes are induced by ABA, as well as drought and heat stress [26], and these genes can upregulate the expression of their target genes and then improve the drought tolerance of transgenic plants [27]. In contrast, the Arabidopsis nac016 mutant displayed drought resistance because AtNAC016 could inhibit the expression of the drought-related gene AREB [28]. Plants overexpressing rice (Oryza sativa) OsNAC2 displayed higher drought tolerance than that of wild-type plants, and further studies found the direct interaction of OsNAC2 with the OsNCED3 gene promoter [29]. Hu et al. [30] found the expression of OsSNAC1, a NAC transcription factor gene in rice, was induced by drought, low temperature, high salt, and abscisic acid. Silencing of CaNAC035 decreased pepper resistance to cold stress, and the silencing plants displayed increasing electrolyte leakage and malondialdehyde content when compared with wild-type pepper [31]. AtNAC103 could mitigate the endoplasmic reticulum (ER) stress in A. thaliana through interacting with bZIP60 [32]. Transgenic rice with overexpression of OsNAC066 displayed enhanced tolerance to oxidative and drought stresses by activating the expression of the drought response gene OsDREB2A [33]. OsNAC2 positively regulates drought tolerance and salt tolerance of rice through the ABA-mediated pathway [29]. Heterologous expression of soybean GmNAC11 and GmNAC20 resulted in salt and cold tolerance of transgenic A. thaliana [34].
D. catenatum, a perennial herb of the Orchid family, grows in subtropical and temperate regions and is often used as a health food in many Asian countries [35,36]. It has many important properties such as anti-tumor and anti-oxidation effects, among others [37,38]. As a lithophytic orchid [39], the wild D. catenatum plant mostly grows on the surface of tree bark or rocks [40] and frequently suffers from adversity such as periodic water shortage [41,42], resulting in the gradual depletion of wild D. catenatum resources [35]. Therefore, the study of resistance to drought stress in D. catenatum is needed. Data on D. catenatum genome sequences have been published and released [39], which was a breakthrough in the molecular biological research of D. catenatum. However, little is known about the NAC gene family up until now. In this study, the NAC gene family was identified on the basis of the D. catenatum genome, and the expression patterns of NAC genes under drought stress were studied. This study provides a basis for further study of NAC gene functions and improvement of drought resistance of D. catenatum.

2. Materials and Methods

2.1. Identification of DcNAC Genes in D. catenatum

The genome information (annotation file, CDS sequence file, and protein sequence file) of D. catenatum was obtained from the GenBank database (PRJNA262478) [39]. The Hidden Markov Model profile (PF02365) of the NAM domain [43] was obtained from the Pfam database (http://pfam.xfam.org/ (accessed on 16 September 2021)) and used to identify the putative NAC protein of D. catenatum with a cut-off E-value of 0.01 [44] through a Biolinux bioinformatics system. The candidate DcNAC proteins were then submitted to Pfam, CDD (https://www.ncbi.nlm.nih.gov/cdd/ (accessed on 16 September 2021)), and SMART (http://smart.embl.de/smart/batch.pl (accessed on 16 September 2021)) databases for verification, and only the proteins containing the NAC domain were retained. After removal of the incomplete and redundant sequences, the DcNAC proteins were finally confirmed. The physical and chemical parameters including gene locations, molecular weight (MW), and isoelectric point (pI) of DcNACs were determined using ExPASy (Expasy 3.0; http://web.expasy.org/protparam/ (accessed on 30 September 2021)). The amount of transmembrane was determined using TMHMM software (TMHMM-2.0, http://www.cds.dtu.dk/services/TMHMM (accessed on 30 September 2021)). The subcellular localization was determined using PSORT software (PSORT II, https://www.genscript.com/psort.html (accessed on 30 September 2021)).

2.2. Phylogenetic Analysis of DcNAC Proteins

The putative A. thaliana and rice (O. sativa) NAC members were identified as described previously [17,23,43]. The sequences of NAC proteins from D. catenatum, A. thaliana, and O. sativa were then aligned with clustalw2.0, and the phylogenetic tree was constructed by the maximum likelihood method using MEGA-X with default parameters and a bootstrap test of 1000 times. Then, the phylogenetic tree was modified with the EvolView online tool (https://evolgenius.info/evolview-v2 (accessed on 8 October 2021)).

2.3. Analyses of Conserved Motif Distribution, Gene Structure, and Promoter Cis-Elements

The conserved motifs of NAC proteins were predicted using Multiple Em for Motif Elicitation program (http://meme-suite.org/ (accessed on 20 October 2021)) with the following settings: number of repetitions = any, maximum number of motifs = 10, and the optimum motif width = 6~50 amino acid residues [45]. The gene structure information of DcNAC genes was extracted from the D. catenatum annotation file using the TBtools software [46]. Furthermore, 2000 bp upstream sequences of the start codon (ATG) of the DcNAC genes were extracted as the promoters using TBtools and were used to search for the cis-acting elements using PlantCARE (http://bioinformatics.psb.ugent.be/webtools/plantcare/html/ (accessed on 26 October 2021)).

2.4. Analysis of Spatial Expression Profiles Using RNA-Seq Data

The spatial expression profiles of DcNAC genes were analyzed using RNA-seq data obtained from the SRA website (https://www.ncbi.nlm.nih.gov/sra (accessed on 12 April 2022)) in different tissues including leaf, root, white root, root tip, stem, lip, flower bud, sepal, pollinium, and column (SRP091756). A heatmap was constructed using TBtools. The reference genome index of D. catenatum [39] was established using kallisto tools [47], from which expression data were then quantified. Transcripts Per Million (TPM) expression values of DcNAC genes were log2-transformed.

2.5. Plant Materials and Drought Treatment

Three-month-old D. catenatum seedlings were subjected to drought treatment. The seedlings were grown on 1/2 MS medium (Sigma-Aldrich, St. Louis, MO, USA) under a 12 h/25 °C day and 12 h/22 °C night regime with a relative humidity of 70% in a growth chamber, and then irrigated with 1/2 MS medium supplemented with 20% PEG8000 (Solarbio, Beijing, China) to simulate drought treatment [48]. The roots and leaves of five seedlings were randomly selected and then collected at different time points (0, 3, 6, 9, 12, 24, and 48 h) after treatments, then frozen with liquid nitrogen immediately and stored at −80 °C for RNA extraction [48]. Three replicate biological experiments were conducted.

2.6. Analysis of Gene Expression under Drought Treatment

As described in a previous study, the D. catenatum leaf samples were collected when the volumetric water content of the matrix declined to ≈30–35%, ≈10–15%, and ≈0%, and then they were used for RNA isolation and sequencing [42]. The RNA-seq data were downloaded (SRP132541) and analyzed. A heat map was constructed using TBtools, indicative of the expression profiles of the DcNAC genes. The differential genes were clustered on the basis of the T1 and T2 values, where T1 was equal to the TPM (transcripts per kilobase million) of 10–15% volumetric water content divided by the TPM of 30–35% water content, and T2 was equal to the TPM of 0% volumetric water content divided by the TPM of 30–35% water content.
Total RNA was extracted, and the expression levels of selected NAC genes under drought treatment were measured by quantitative real-time reverse transcription-polymerase chain reaction (RT-qPCR) using an Applied Biosystems QuantStudio 3 and 5 system (ThermoFisher Scientific, Waltham, MA, USA) [31]. The relative expression levels of DcNAC genes were calculated using the 2−ΔΔCT method, and the housekeeping gene Actin was used as an internal control [31]. All data were calculated using the expression levels under different stresses divided by that under normal condition at the same time points and are presented as the means ± standard error (SE) of three replicates; moreover, the differences were analyzed using Student’s t-test [48]. Asterisks (* or **) indicate significant differences at p < 0.05 or p < 0.01 levels, respectively. Three replicate biological experiments were conducted. The primers used are listed in Table S1.

2.7. Co-Expression Network and Protein–Protein Interaction Network Analysis of DcNAC Proteins

Co-expression relationships of the DcNAC genes were analyzed using Origin (version 2022b) [49] on the basis of the TPM values from the RNA-seq data, and their co-expression networks were generated using Cytoscape (version 3.9.1) [50] on the basis of the correlation coefficients. STRING software (version 11.5, https://string-db.org/ (accessed on 28 August 2022)) was utilized to analyze the interactions between NAC proteins and other proteins [51]. A ‘single protein by sequence’ method was applied, and ‘Arabidopsis thaliana’ was selected as the organism for analysis. The BLASTP method was applied for NAC amino acid sequence search in the STRING software database, and the most similar Arabidopsis NAC proteins found were used for the establishment of the protein interaction network chart.

3. Results

3.1. Identification and Characterization of NAC Genes in D. catenatum

A search of NAC proteins in D. catenatum protein files was performed with the NAM domain model (PF02365) as a query, and 90 NAC sequences were obtained. These sequences were then verified by Pfam, SMART, and CDD databases. The 90 genes were named DcNAC1 to DcNAC90 according to their relationships with A. thaliana and O. sativa NAC proteins. The longest DcNAC gene (DcNAC39) with a molecular weight of 119.24 kDa encodes 1065 amino acids. The shortest NAC gene (DcNAC41) with a molecular weight of 10.34 kDa encodes only 88 amino acids. The theoretical isoelectric points are between 4.50 (DcNAC65) and 9.99 (DcNAC38). Among these proteins, DcNAC21, DcNAC44, DcNAC46, DcNAC58, DcNAC63, DcNAC66, and DcNAC74 have a transmembrane domain, and the rest lack transmembrane domains. The subcellular localization prediction showed that most DcNAC proteins are located in the nucleus, and a small part in the mitochondria, cytoplasm, and endoplasmic reticulum (Table 1).

3.2. Phylogenetic Analysis and Classification of DcNAC Proteins

Generally, similar functions were accomplished by the genes that had a coadaptation association and relationship [22]. Phylogenetic analysis is a good way to analyze the functions of gene families in numerous biological and functional studies. To explore the evolution of D. catenatum NAC proteins, an unrooted phylogenetic tree of D. catenatum NAC, A. thaliana NAC (AtNAC), and O. sativa NAC (OsNAC) proteins was constructed using the ML method (Figure 1). These NAC proteins were classified into two large groups: Group I and II. On the basis of the similarities in AtNAC and OsNAC structures, each group could be divided into several subgroups. Group I was divided into 13 subgroups, and group II was divided into 4 subgroups. DcNAC proteins were as diverse as AtNAC and OsNAC proteins, and unequal distribution of DcNACs was observed in all subgroups. NAM and NAP were the largest subgroups with 15 members (17%); followed by the subgroup ONAC022 with 11 members (12%); subgroup OsNAC7 with 10 members (11%); subgroup ONAC033 with 8 members (9%); subgroups NAC1, ANAC011, TIP, and OsNAC3 with 5 members (6%); subgroups NAC2 and ANAC063 with three members (3%); and subgroups TERN, ATAF, SENU5, ONAC001, and ANAC001 who all contained only 1 member (1%). Conversely, no DcNAC proteins belonged to the subgroup AtNAC3, the same as the OsNAC gene family. The distribution rule in each subgroup was similar to that in A. thaliana and rice (Figure S1).

3.3. Conserved Motif and Gene Structures of DcNAC

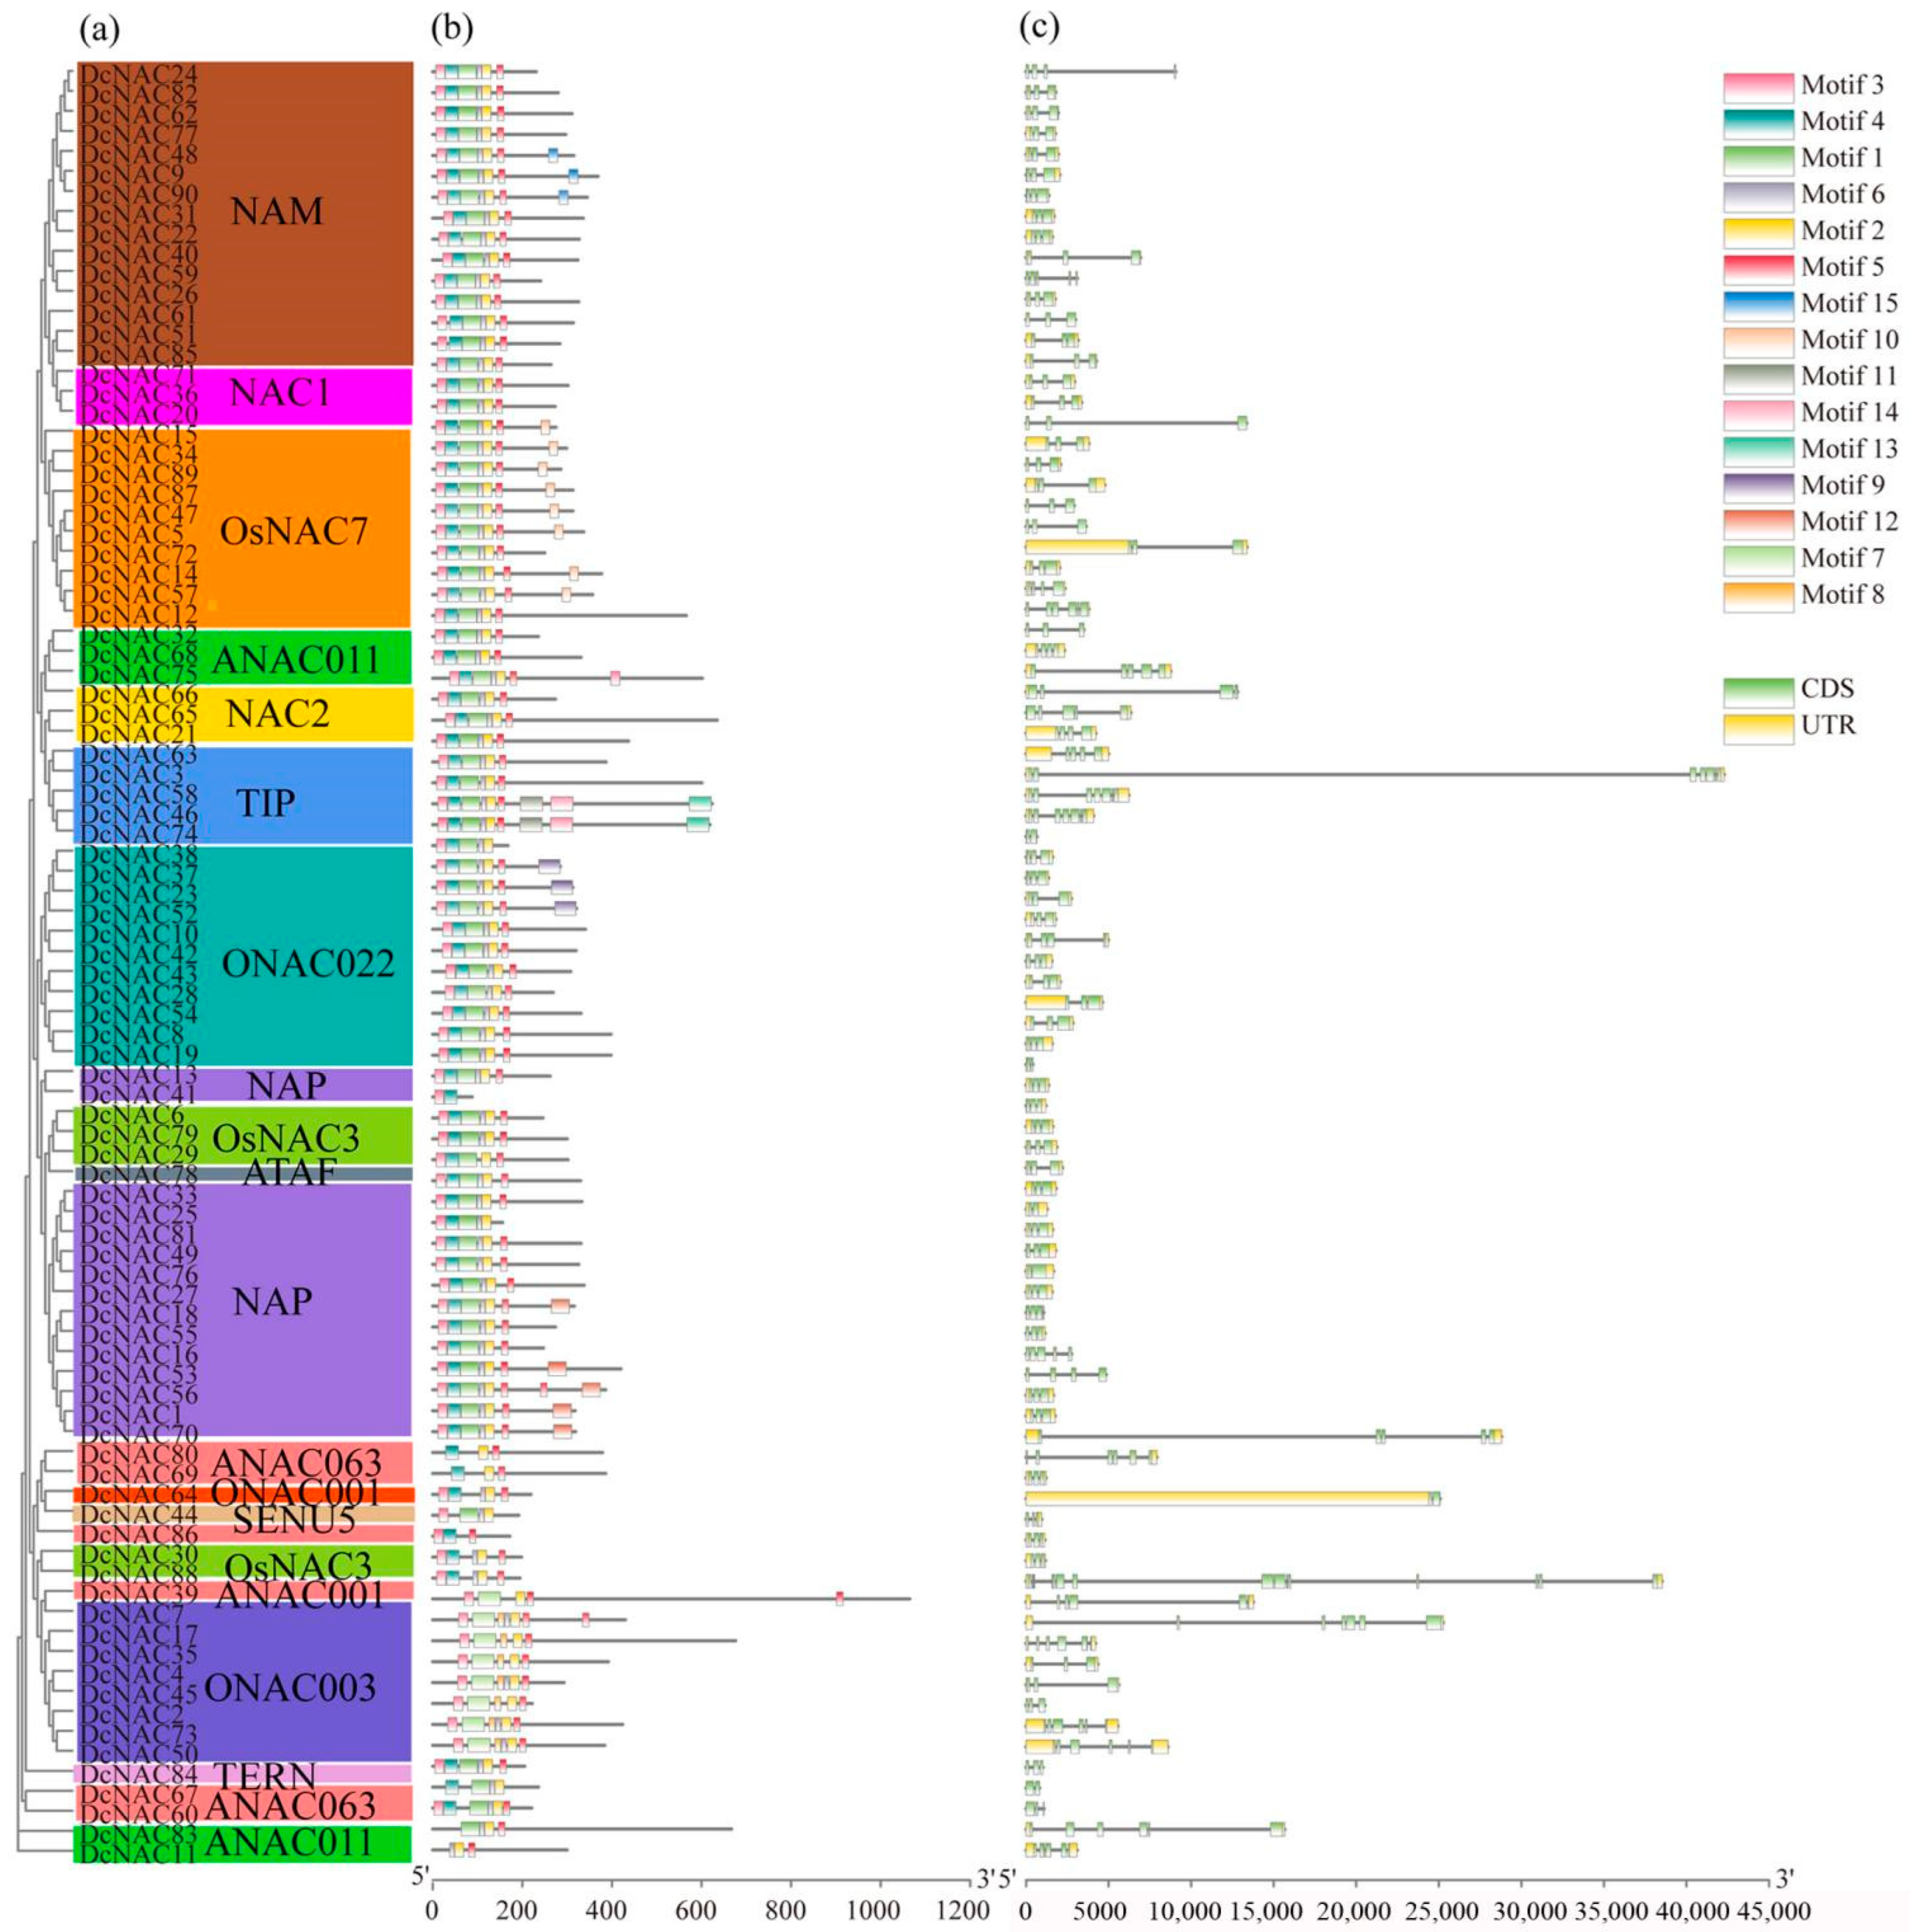
The putative motifs of the DcNAC proteins were predicted by MEME analysis, and a total of 15 different motifs were detected (Figure 2b and Figure S2), indicating the diversification of the DcNAC proteins in evolution. Results showed that the NAC members in the same subgroup or with close relationships had similar motif compositions, for instance, subgroups NAM, NAC1, OsNAC7, ANAC011, NAC2, TIP, ONAC022, OsNAC3, and ATAF all contained motif 1 to motif 6, suggesting that these NAC proteins have conservation in evolution, which might have similar functions. Interestingly, motif 10 was only found in subgroup OsNAC7, suggesting this motif might have special functions. The NAC protein contained a transcriptional activation region (TAR) in the C-terminus and a NAC domain in the N-terminus, which consisted of subdomains A to E (Figure 3a). The highly conserved NAC domain was formed from the full sequences of motifs 3, 4, 1, 2, and 5 (Figure 3b). These five motifs were detected in the majority of the DcNAC proteins (Figure 2b).
To investigate the diversity in structures of DcNAC genes, the exon–intron information of each DcNAC gene was analyzed (Figure 2c). Results showed that all the DcNAC genes contained introns, among which DcNAC64 had the largest number of introns (7 introns). Generally, the intron number and exon length displayed similar characteristics in the same subgroups. The members in subgroups NAM, NAC1, OsNAC7, ANC063, and NAC2 contained two or three introns, while the members in subgroups TIP, ONAC022, ONAC033, and ANAC011 had variable amounts of introns.

3.4. Cis-Element Analysis of the Promoter Regions of DcNAC Genes

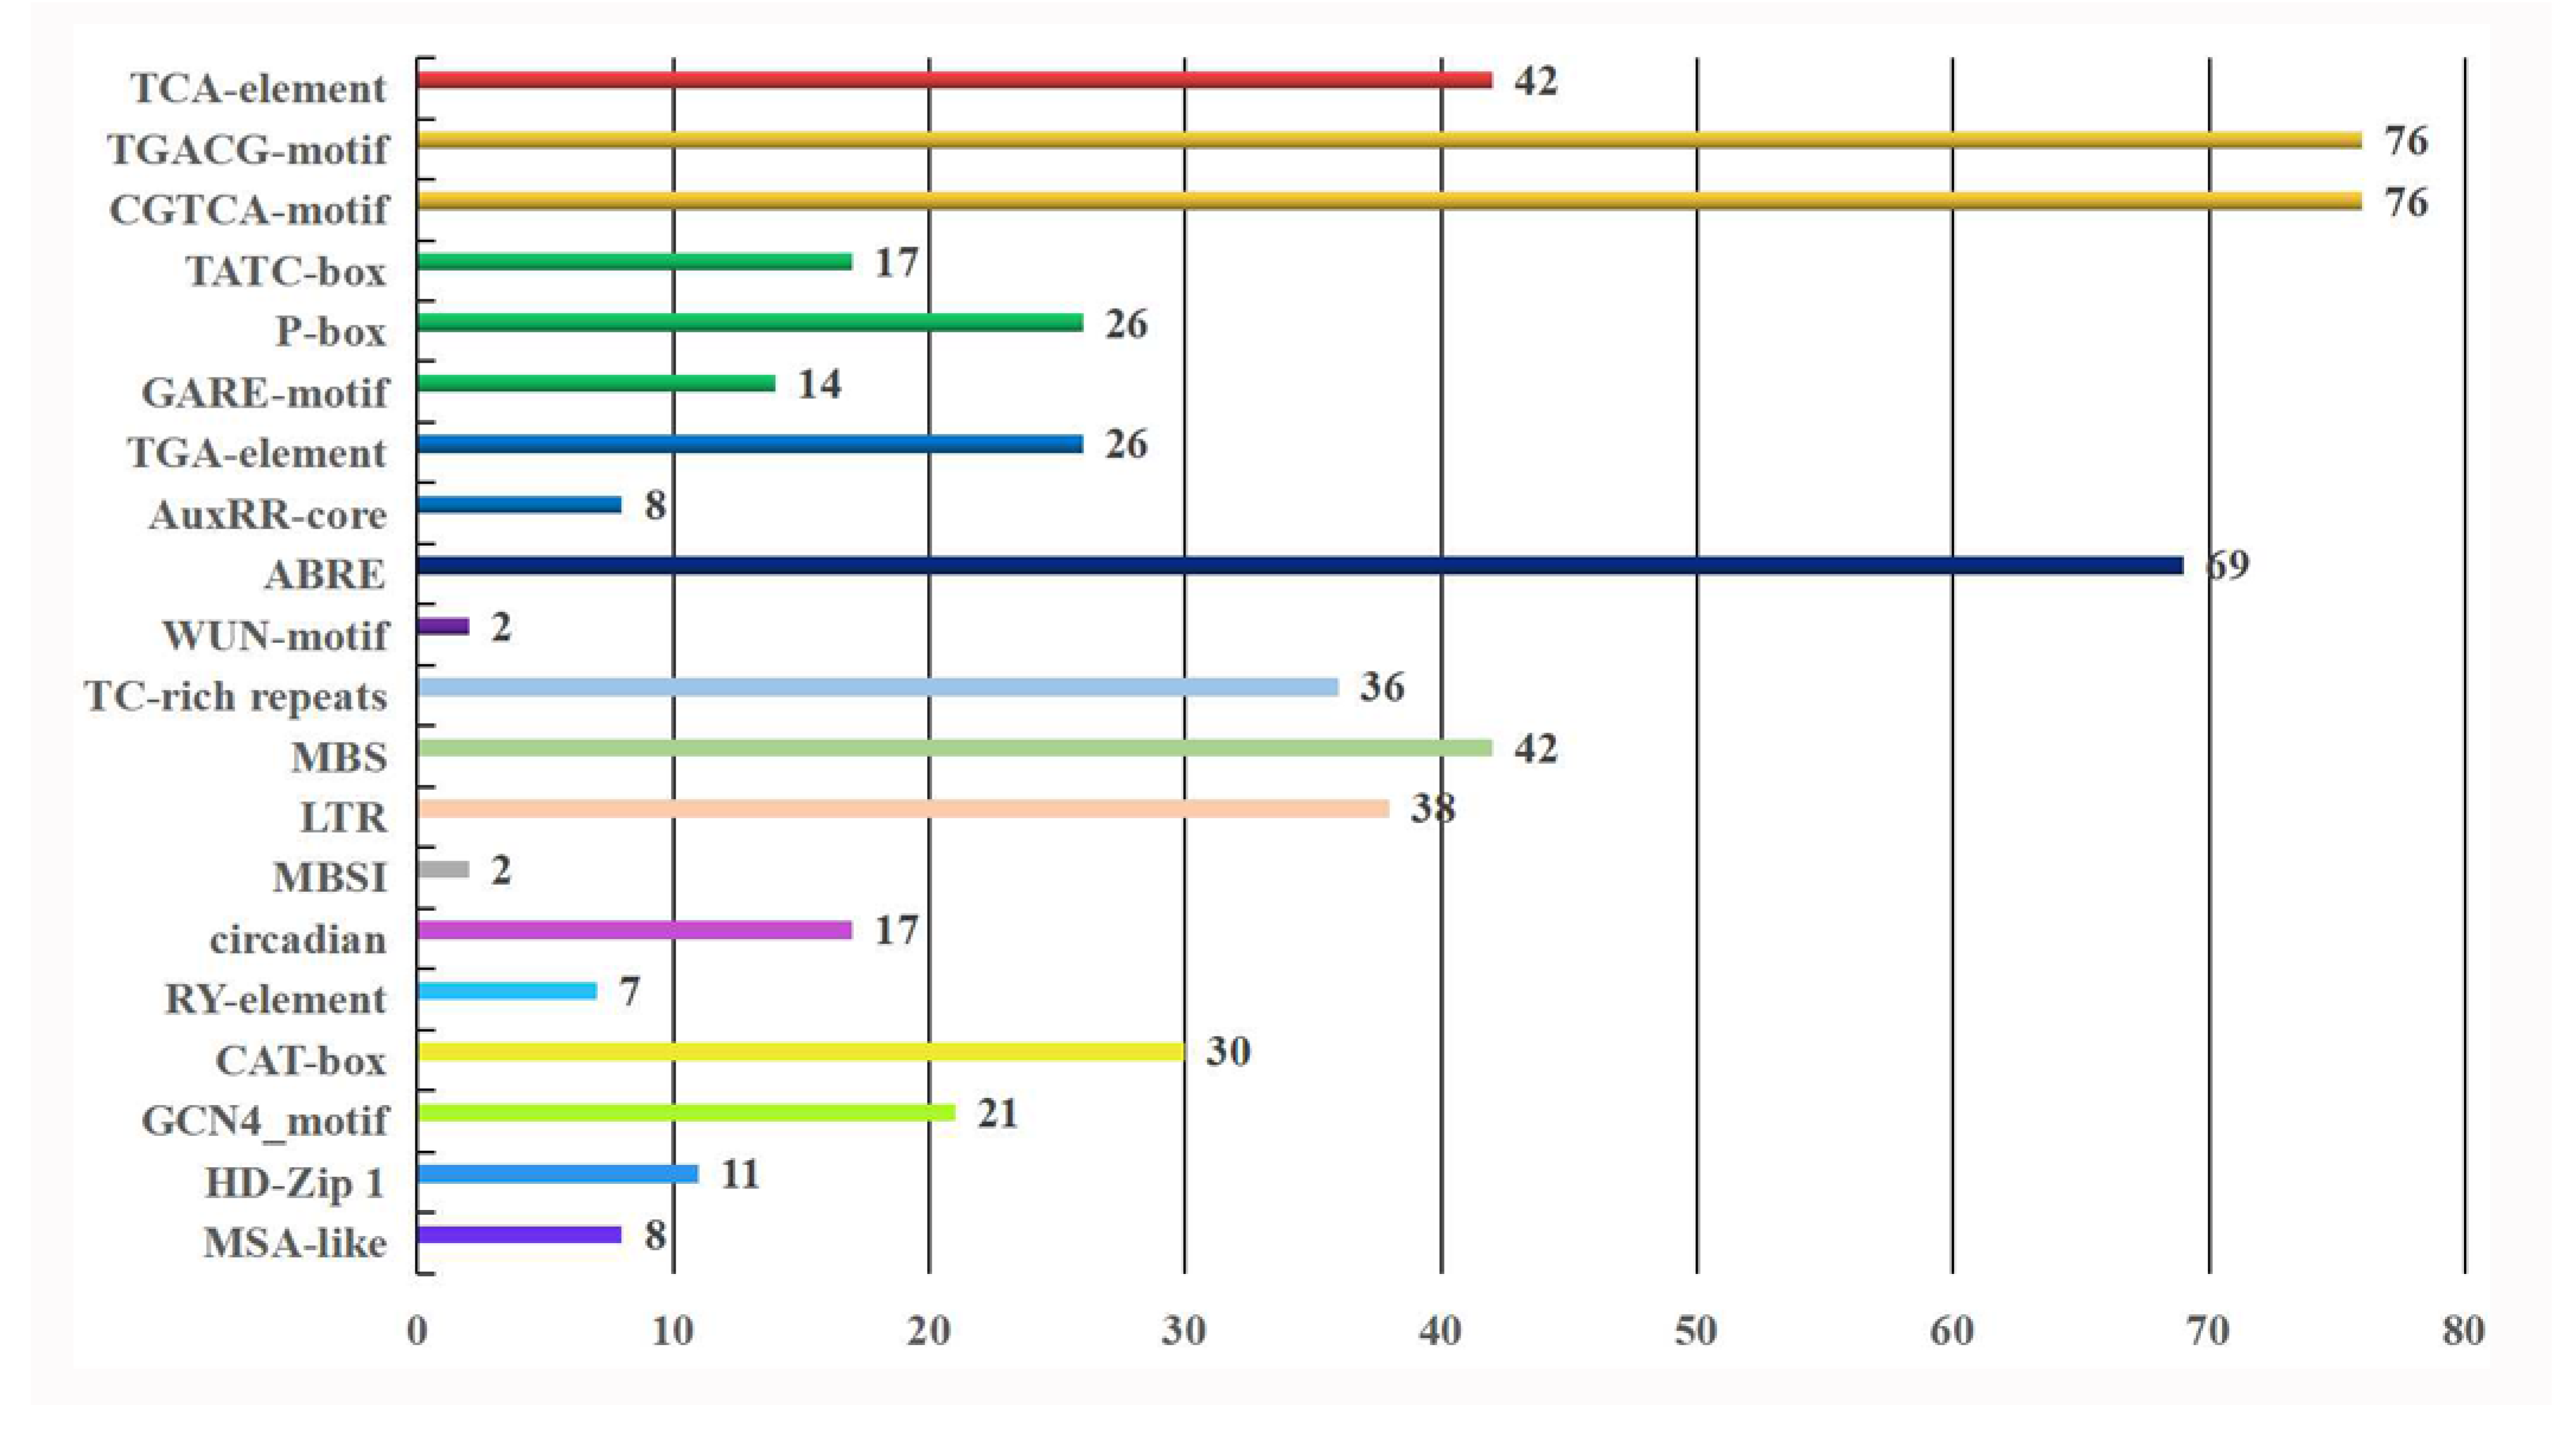
The 2000 bp upstream sequence of the start codon (ATG) of the DcNAC gene was extracted using TBtools software (v1.095) and utilized as a promoter sequence. The cis-acting elements of the NAC gene promoters were analyzed using PlantCARE (Figure 4, Table S2). The abiotic stress response elements including low temperature response elements (LTR), drought inducibility (MBS), defense and stress responsiveness (TC-rich repeats), and wound-responsive element (WUN-motif) were found in 38, 42, 36, and 2 DcNAC gene promoters, respectively. The hormone response elements including MeJA responsiveness element (CGTCA-motif/TGACG-motif), abscisic acid (ABA) response element (ABRE), salicylic acid (SA) response element (TCA-element), gibberellin-responsive element (P-box/TATC-box/gare-motif), and auxin (IAA) response element (TGA-element) were found in 76, 69, 42, 26, and 26 DcNAC gene promoters, respectively. These results suggest that the expression of most genes might be related to hormone signal transduction. In addition, many growth- and development-related cis-acting elements were detected in the promoters. The circadian control element (circadian) was detected in 17 DcNAC promoters, the meristem expression element (CAT-box) was detected in 30 DcNAC promoters, the palisade mesophyll cell differentiation related element (HD-Zip 1) was detected in 11 DcNAC promoters, the flavonoid biosynthetic gene regulation (MBSI)-related MYB-binding site was detected in 2 DcNAC promoters, the seed-specific regulation element (RY-element) was detected in 7 DcNAC promoters, the cell cycle regulation element (MSA-like) was detected in 8 DcNAC promoters, and the endosperm expression element (GCN4_motif) was detected in 21 DcNAC promoters.

3.5. Tissue-Specific Expression Profiling of DcNAC Genes Using RNA-Seq

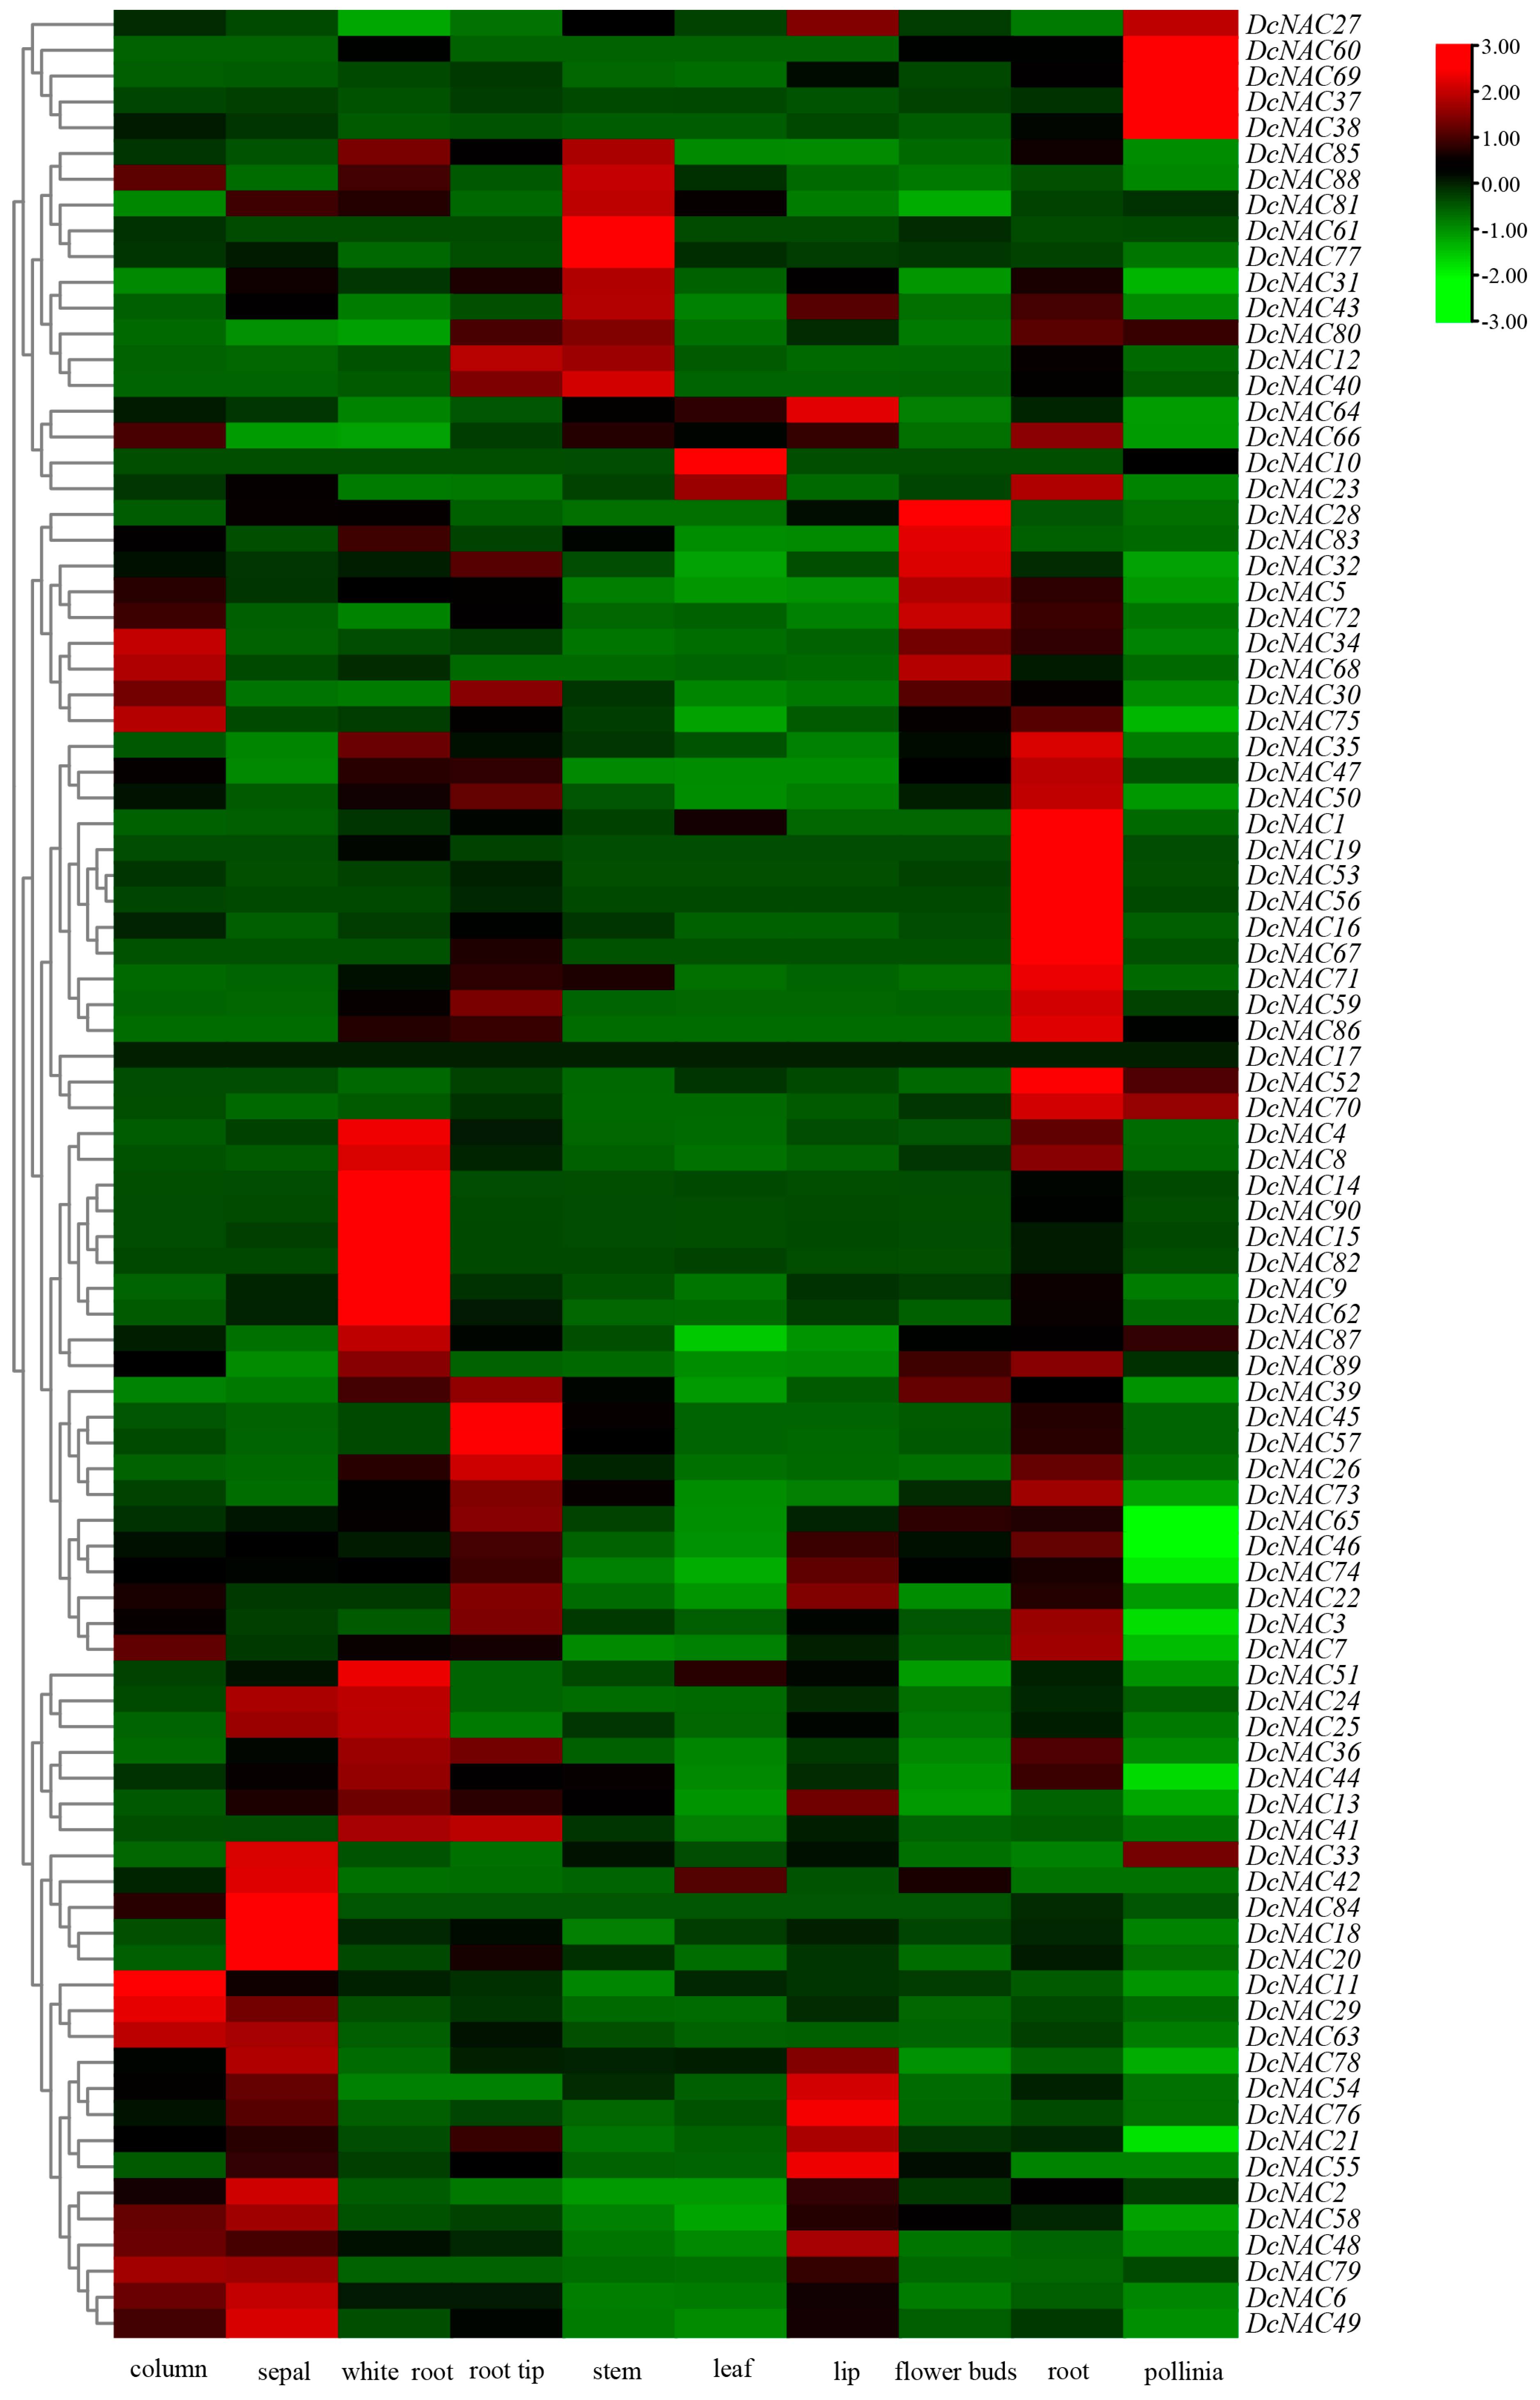
The expression profiles of the DcNAC genes in different tissues were explored by analyzing the RNA sequence transcriptome data (SRP091756) (Table S3). The expression of the 90 DcNAC genes was investigated on the basis of the transcripts per million (TPM) values from 10 tissue samples (root, white root, stem, leaf, root tip, lip, flower bud, sepal, pollinium, and column). The TPM value heat map (Figure 5) showed that the DcNAC genes exhibited varying expression patterns, indicative of the variable functions of different DcNAC genes. For example, DcNAC19, DcNAC16, DcNAC1, DcNAC53, and DcNAC56 displayed high expression levels in roots; DcNAC61 and DcNAC77 displayed high expression levels in stems; DcNAC64, DcNAC76, DcNAC21, and DcNAC48 exhibited high expression in lips; DcNAC20, DcNAC49, DcNAC79, and DcNAC6 exhibited high expression in sepals; DcNAC69, DcNAC37, and DcNAC38 exhibited high expression in pollinia; DcNAC28 and DcNAC83 exhibited high expression in flower buds; DcNAC10 and DcNAC23 exhibited high expression in leaves; and DcNAC29 and DcNAC63 exhibited high expression in columns (Figure 5, Table S3). These results indicate that the expression of DcNAC gene is tissue specific and that different genes may be involved in the regulation of the growth and development of different tissues.

3.6. Expression of DcNACs under Drought Stress Analyzed by RNA-Seq

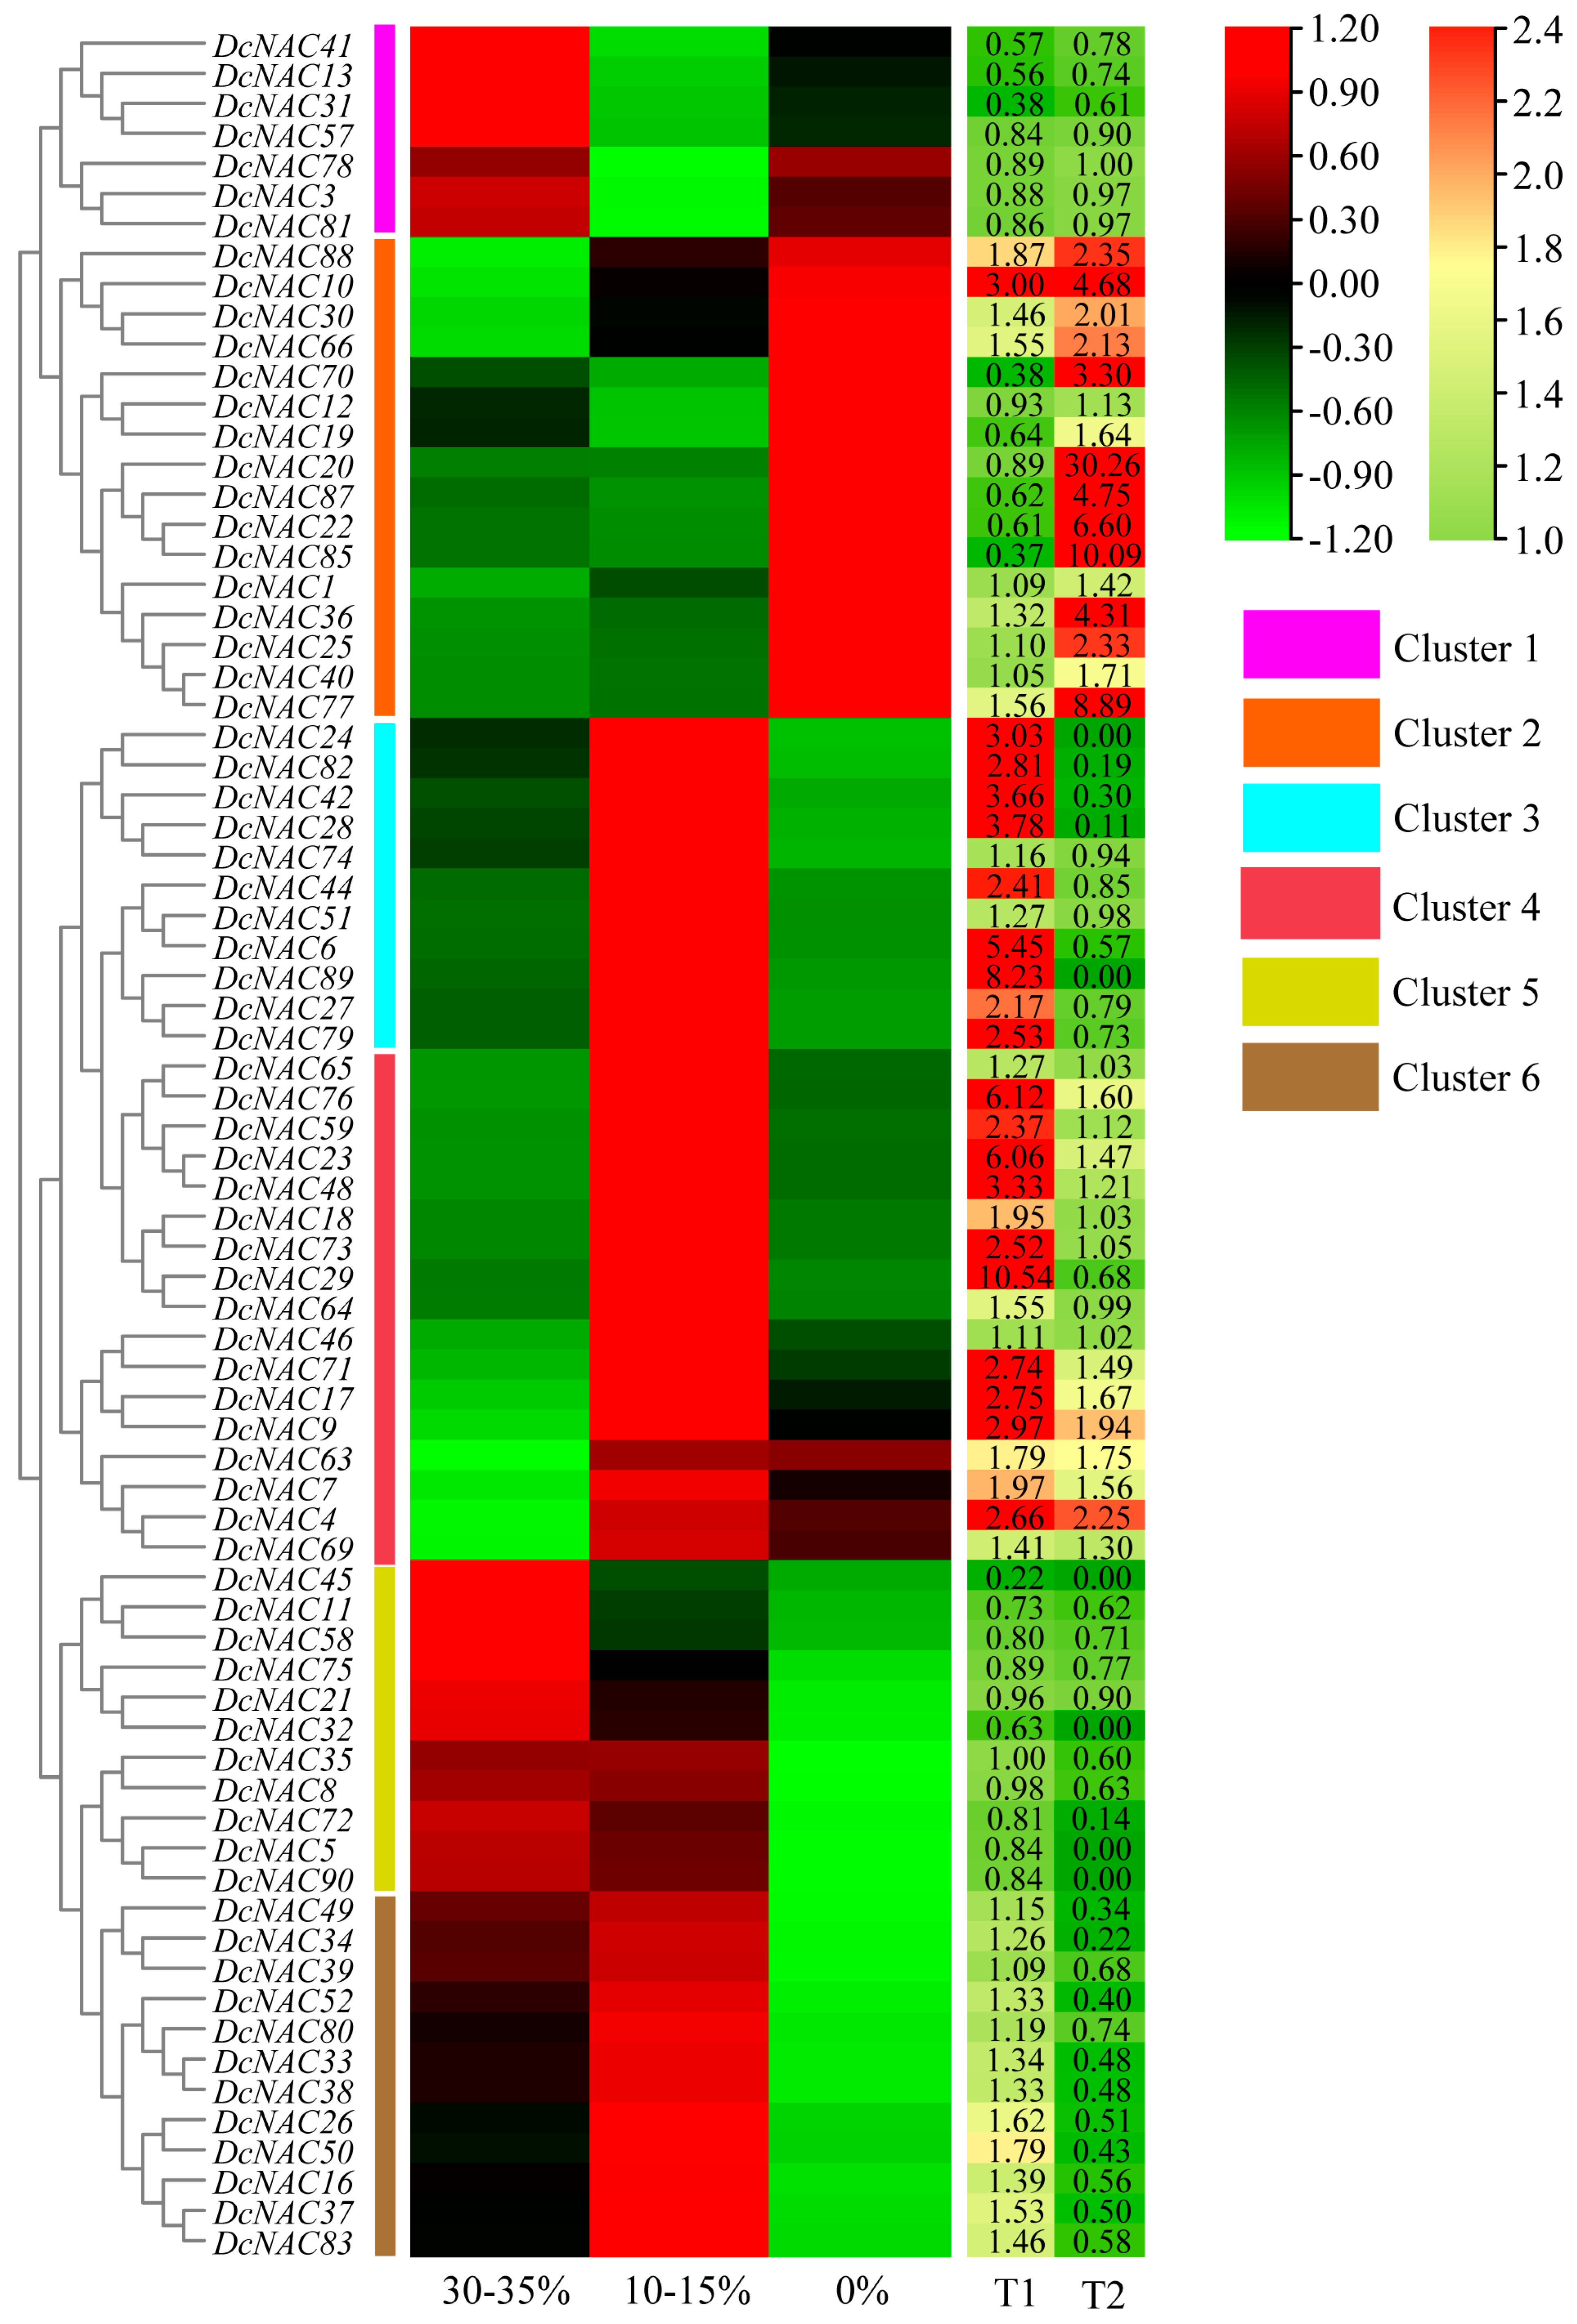
A hierarchical clustering heatmap was generated to visualize the expression patterns of the DcNAC genes through the RNA sequence transcriptome data (SRP132541) (Table S4) under drought stress. These genes were divided into six clusters on the basis of their TPM values (Figure 6). The T1 and T2 values in the six clusters displayed four types of rules. In cluster 1 and cluster 5, the total expression levels of 18 DcNACs decreased with progressive drought stress, and the T1 and T2 values were less than one. Sixteen DcNACs were placed into cluster 2, showing higher expression under 0% than 10–15% treatment. The T2 values were greater than T1 values, and T1 values in seven members were less than one. In clusters 3 and 6, the T1 values were more than one, while the T2 values were less than one, suggesting that these 22 DcNACs may play roles in response to moderate drought stress (10–15%). The T1 and T2 values were greater than one in almost all DcNACs in cluster 4, suggesting that these TFs may regulate the expression of drought-responsive genes in D. catenatum. Taken together, the 52 DcNAC genes in clusters 2, 3, 4, and 6 may positively regulate the drought tolerance of D. catenatum and were selected for further study.

3.7. Comprehensive Analysis of Drought-Related DcNAC Genes

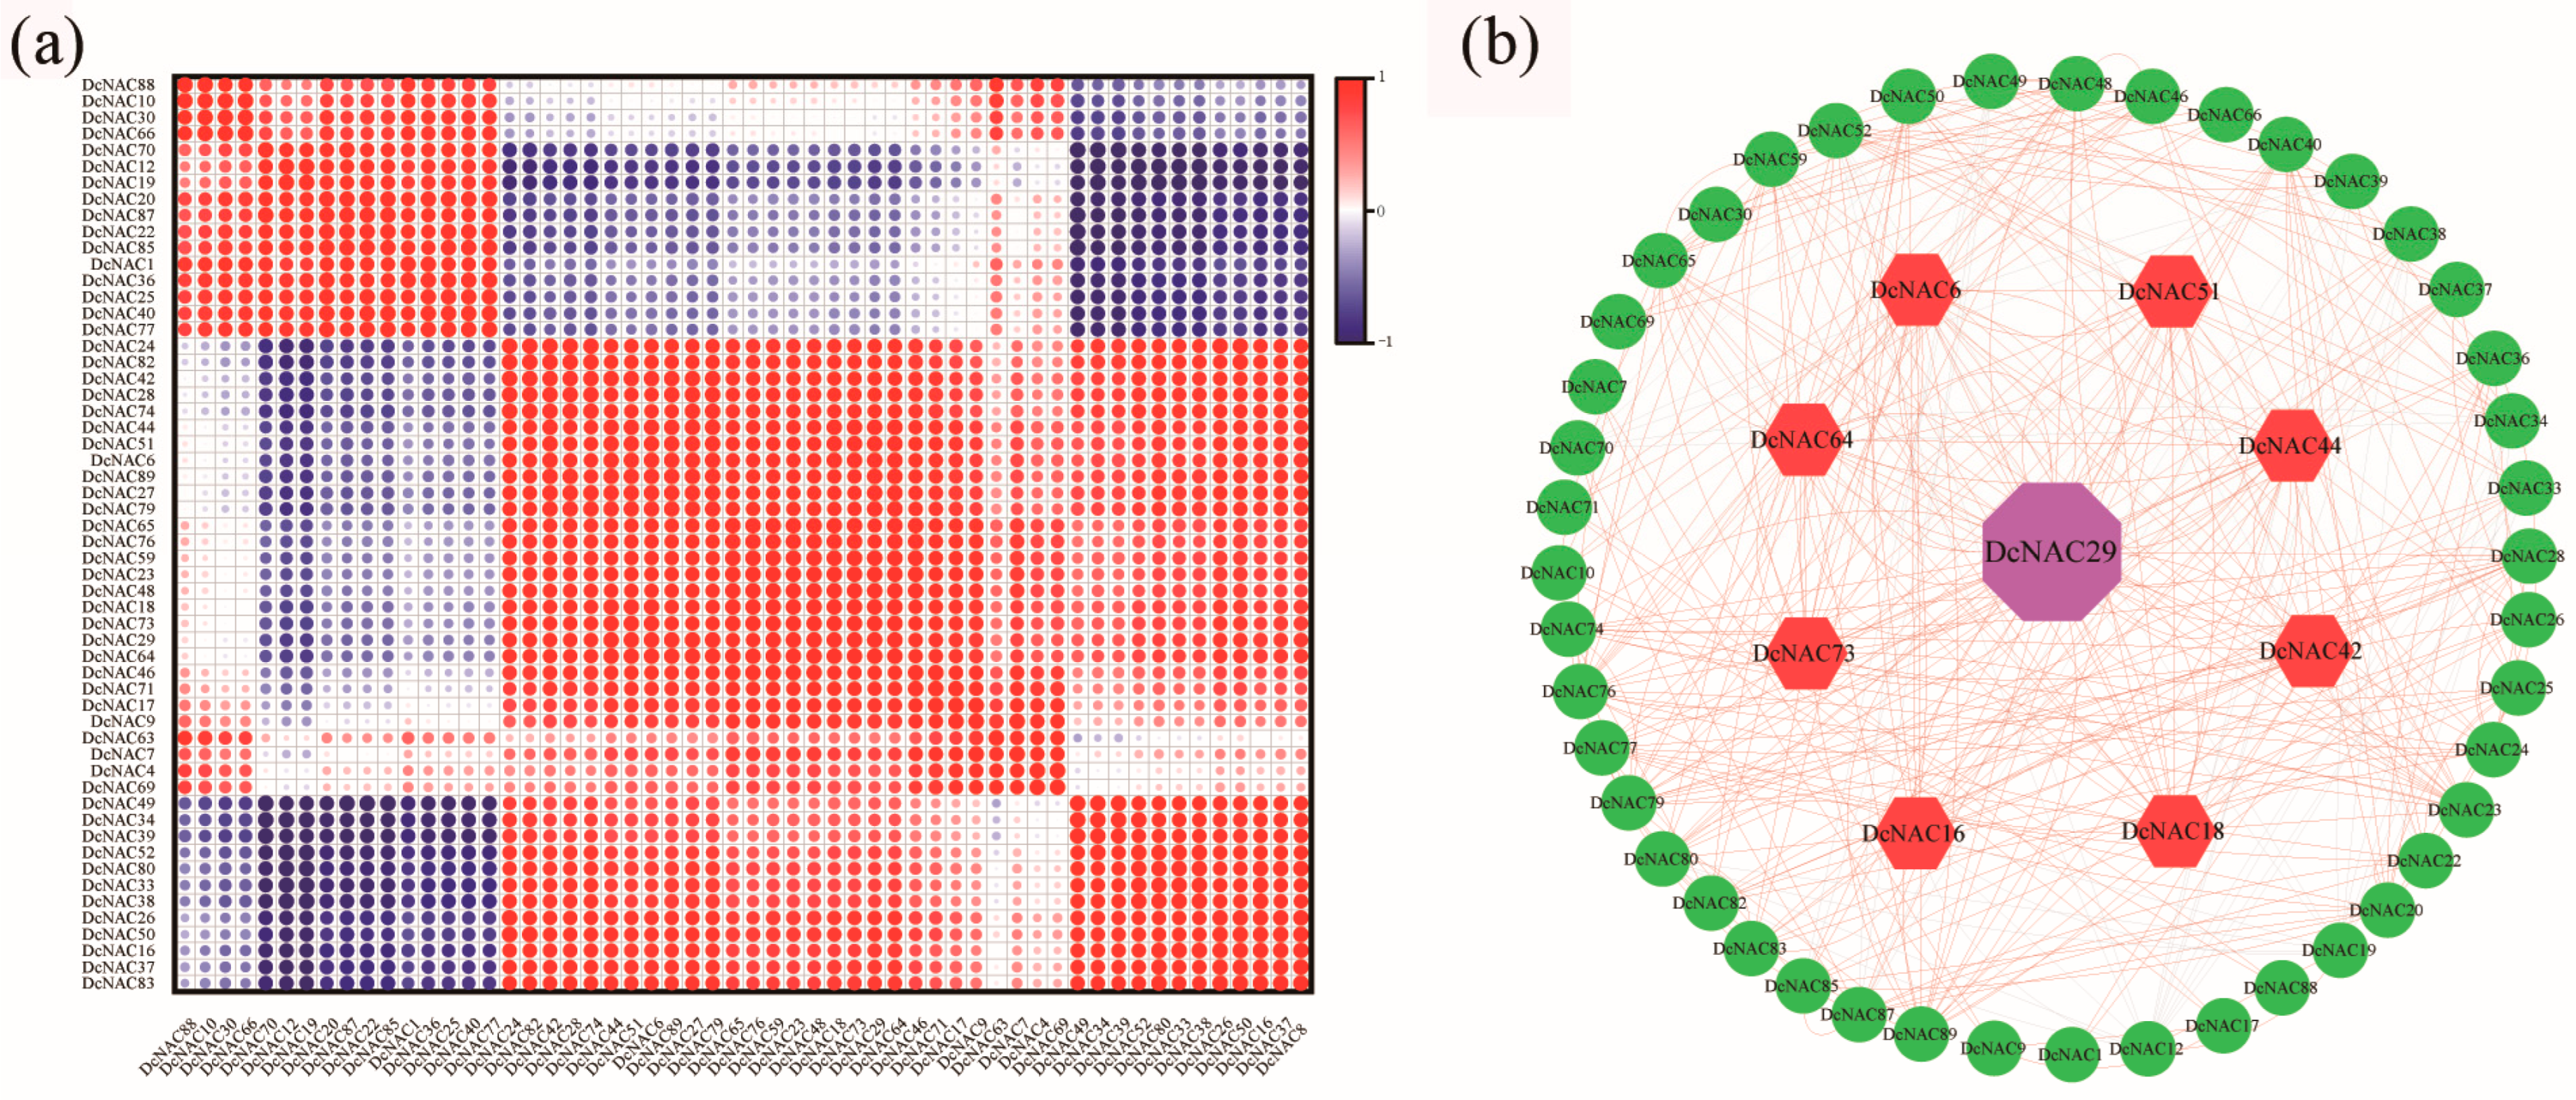
Correlation analysis was performed using Origin for the selected 52 DcNAC genes to explore their possible relationships (Figure 7a). The results showed that 310 pairs of genes displayed positive correlations, and 40 pairs of genes displayed negative correlations. A co-expression network was then constructed using Cytoscape on the basis of Pearson correlation coefficients. Nine hub genes (DcNAC6, DcNAC16, DcNAC18, DcNAC29, DcNAC42, DcNAC44, DcNAC51, DcNAC64, and DcNAC73) were identified, among which the DcNAC29 was most dominant in the network due to the high connectivity with other genes (Figure 7b).
To further examine the functions of the nine hub genes, a full network map of the nine DcNAC proteins in D. catenatum and related genes in Arabidopsis was constructed using STRING software (version 11.5) to predict their physical and functional interactions (Figure 8). We predicted a total of 48 proteins in the network. The sequence and annotation information for each protein is shown in Tables S5 and S6. As shown in Figure 8, Arabidopsis NAC102 (homolog of DcNAC6) was connected to ABF3 (abscisic-acid-responsive-elements-binding factor 3), ABF4, ATAF1 (Arabidopsis NAC-domain-containing protein), ERF-1 (ethylene-responsive-element-binding factor 1), and NAC083. NAM (homolog of DcNAC16) has associations with CIPK14 (CBL-interacting serine/threonine-protein kinase 14), ERF8, HAI1 (highly ABA-induced 1), NAC032, WRKY45, and WRKY75. NAC025 (homolog of DcNAC18) has associations with LTP12 (lipid-transfer protein 12), WRKY40, WRKY45, and WRKY75. ATAF2 (homolog of DcNAC29) was connected to DRIP1 (DREB2A-interacting protein). NAC083 (homolog of DcNAC44 and DcNAC64) was connected to BPM1 (BTB/POZ and MATH-domain-containing protein 1), BPM2, KNAT7 (KNOTTED-like homeobox of Arabidopsis thaliana 7), LBD15 (LOB-domain-containing protein 15), MYB46, NAC102, and RD26. NAC1 (homolog of DcNAC51) was connected to HSFC1 (heat stress transcription factor C-1).

3.8. Expression Profiles of the Nine Hub DcNAC Genes under Drought Stress Using RT-qPCR

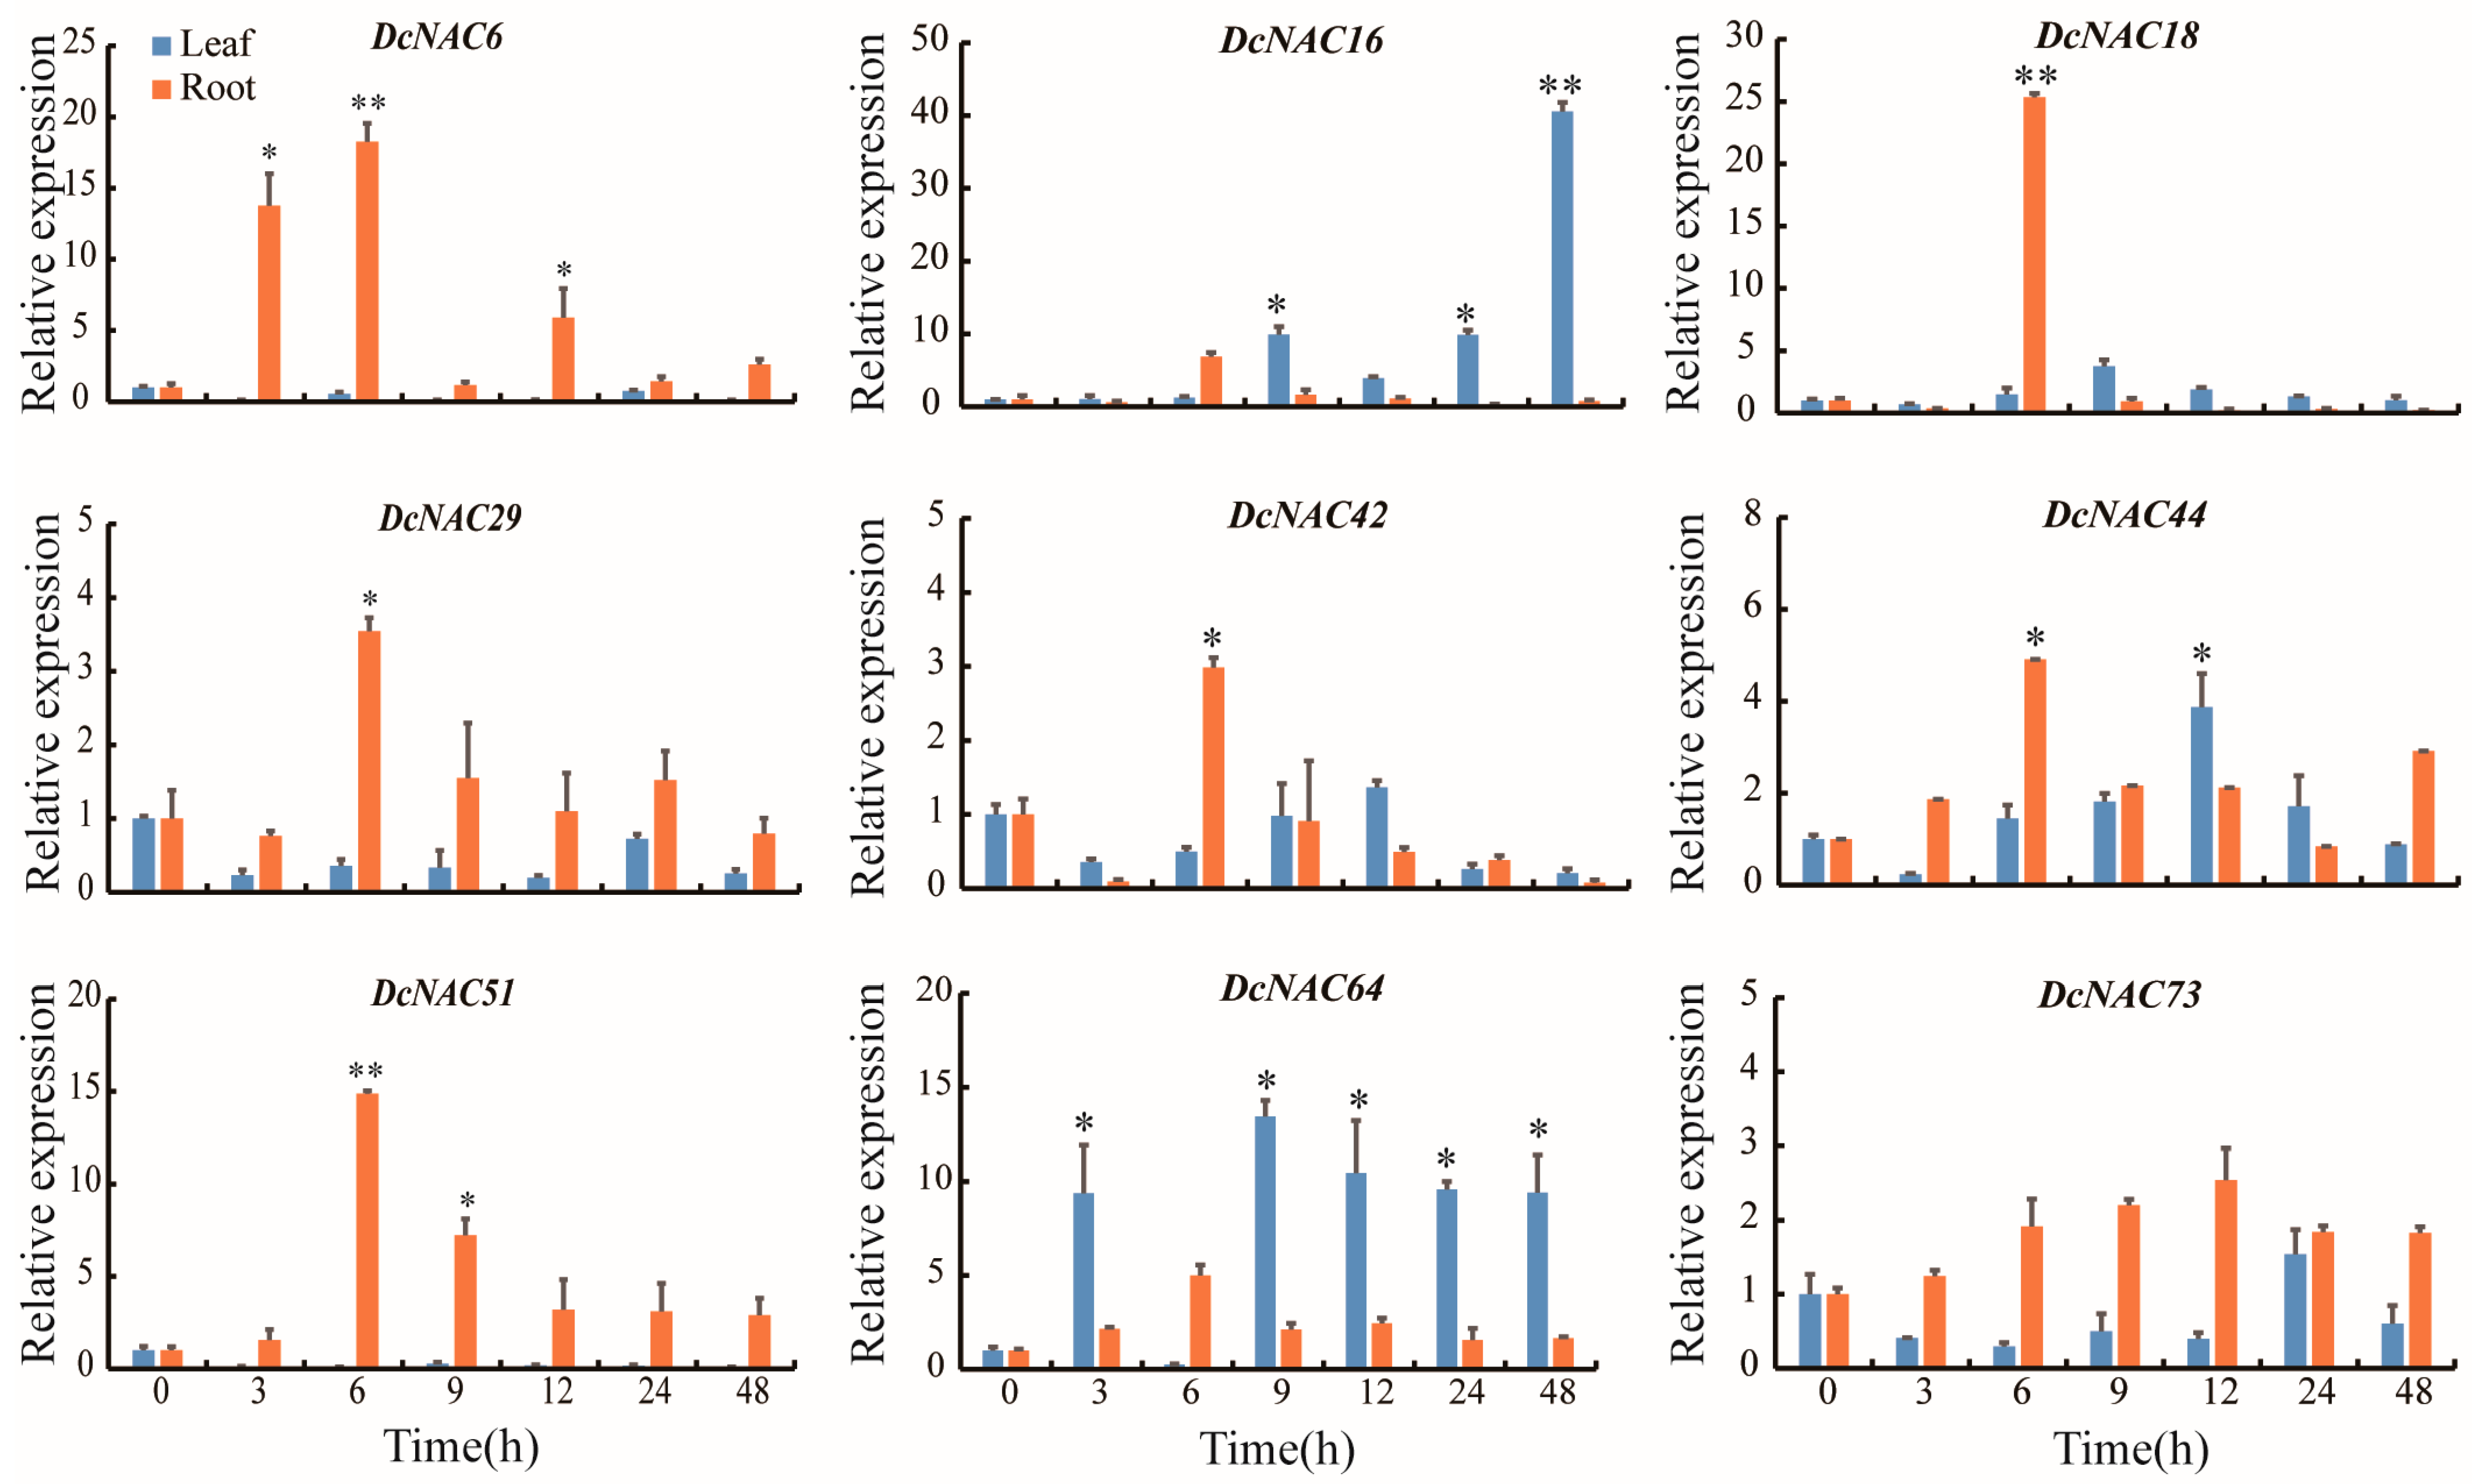
To further explore their response to drought stress, the expression levels of the nine hub DcNAC genes under 20% PEG8000 were analyzed using RT-qPCR. As shown in Figure 9, these genes were upregulated by drought stress to varying degrees. In roots, the DcNAC6, DcNAC18, DcNAC29, DcNAC44, and DcNAC51 genes were highly induced, and all reached the peak after 6 h treatment, among which DcNAC18 exhibited the highest expression level (25-fold increase). Conversely, in leaves, only DcNAC16 and DcNAC64 showed increase patterns. DcNAC16 was highly expressed in leaves, with a 40-fold increase after treatment for 48 h. The expression of DcNAC64 increased by 13-fold compared with 0 h and exhibited the highest level after treatment for 9 h.

4. Discussion

Transcription factors can be divided into different families according to their specific DNA-binding domains [52]. TFs regulate gene expression and mediate or control many biological processes in cells including cell cycle, metabolism, and physiological balance [53]. In addition, TFs, as major sources of biodiversity and changes, are involved in plant defense and stress responses [54,55,56]. In higher plants, a large number of TFs are induced under stresses and can help plants to enhance stress resistance [4,57].
Although the functions of NAC genes have been well studied in A. thaliana and some model crops [58,59,60,61], little is known about their functions in D. catenatum. The number of NAC genes varies in different plants. In this study, we identified 90 NAC genes in the D. catenatum genome, more than those (75 OsNAC genes) in rice [17], while fewer than those in A. thaliana (105 AtNAC genes) [17], Helianthus annuus (150 HaNAC genes) [23], and Panicum miliaceum (180 PmNAC genes) [62]. Remarkably, plant genes with the same functions were clustered in the same subgroups [23]. Phylogenetic analysis showed that the NAC proteins from D. catenatum, A. thaliana, and rice were divided into 17 different subgroups (Figure 1). Subgroup NAP has 15 DcNAC genes, with the highest number present in this group. These genes are orthologous with Arabidopsis AtNAC018, AtNAC025, and AtNAC56, playing a key role in leaf senescence [58]. Subgroup NAM contains 15 DcNAC genes, the same as the NAP subgroup, orthologous with AtNAC054 and AtNAC059, which are involved in organ development, programmed cell death, and secondary wall formation [63,64,65], as well as biotic and abiotic stresses [66]. Subgroup TIP has five DcNAC genes, orthologous with AtNAC060 and AtNAC091, which are involved in ABA signaling and stress response [67,68,69]. The subgroup ANAC011 has five DcNAC genes that are orthologous with Arabidopsis genes such as AtNAC071 and AtNAC096, which are responsible for tissue reunion, dehydration, and osmotic stress [70,71]. Subgroup NAC2 has three DcNAC genes that are orthologous with Arabidopsis genes such as AtNAC016 that is involved in chlorophyll breakdown [28]. The subgroup ANAC001 has only one DcNAC gene, orthologous with AtNAC003 and AtNAC069 in Arabidopsis, and these genes are responsible for DNA damage response, as well as salt and osmotic stress tolerance [72,73]. The ATAF subgroup is related to drought tolerance in rice [74] and related to salt stress response and lateral root development in Arabidopsis [75,76], having one DcNAC orthologous gene. Although phylogenetic analysis provides vital information for function understanding of candidate genes, this alone cannot clearly describe their functions. To this end, we investigated other evidence to support the reliability of subgroup classification, such as gene structure and motifs. Most of the DcNAC genes had more than two introns, and the members in the same subgroups had similar gene structures (Figure 2c). Previous studies showed that NAC genes from the same subgroups often have similar functions [77,78,79]. According to previous studies, introns are inserted or excised from the NAC coding region in a subfamily-specific manner and are retained in the genome during evolution [80]. NAC transcription factors have highly conserved N-terminal, containing NAC domains (≈150 residues), and a highly diversified C-terminal [81]. In this study, the N-terminus of DcNAC proteins except the members of subgroups ONAC003, SEUN5, and ANAC063 all contained motifs 1, 2, 3, 4, 5, and 6. In contrast, the C-terminus of DcNAC proteins in subgroup OsNAC7 contained motif 10; the C-terminus of DcNAC9, DcNAC48, and DcNAC90 in subgroup NAM contained motif 15; and the C-terminus of DcNAC1, DcNAC16, DcNAC27, DcNAC53, DcNAC56, and DcNAC70 in subgroup NAP contained motif 12.
NAC transcription factors have critical functions in plant growth, development, and resistance to stresses [82,83]. The grape VvNAC17 can enhance salt, cold, and drought tolerance of transgenic Arabidopsis [84]. Tobacco with overexpression of the Lilium pumilum LpNAC13 gene displayed decreased drought tolerance and increased salt tolerance [85]. The soybean GmNAC109 can enhance the lateral root formation of transgenic Arabiodpsis [86]. The functions of cis-elements in the promoters indicate possible responses to these genes [87]. In this study, the promoter analysis showed that there were multiple cis-elements that were correlated with various developmental and stress response factors in the upstream sequences of DcNAC genes (Figure 4). ABRE plays a critical role in leaf senescence, stomatal closure, seed dormancy, and plant response to abiotic and biotic stresses [54]. Liao et al. [88] found that GmbZIP46, GmbZIP62, and GmbZIP78 could bind to the ABRE element and respond to salt stress, and the transgenic plants exhibited stronger salt tolerance than the wild-type plants. Studies have shown that LTR elements in the strawberry FaG6PDH-CY gene promoter region can promote the expression of downstream target genes under cold stress [89]. Under salt stress, the apple MdNAC47 directly bound to the ethylene responsive element, activated its transcription, and then increased the expression of ethylene-responsive genes, thus enhancing plant salt tolerance [90]. Plant hormones such as ABA, SA, and JA can regulate stress response, root growth, and plant development [59]. Tomato SlNAC35 can regulate the expression of auxin response factors ARF1, ARF2, and ARF8 in the auxin signaling pathway through an ABA-dependent pathway to promote root growth and improve plant drought and salt tolerance [91]. Rice plants overexpressing the SNAC2 (stress-responsive NAC2) gene induced by ABA exhibited cold and salt tolerance and ABA sensitivity [92]. It is well known that ABA plays important roles in plant adaptation to environmental stresses such as drought, cold, or high salinity [93]. In addition, ABA also regulates many developmental processes, including seed germination, seed maturation and dormancy, vegetative development, and plant senescence [93,94,95]. ABA-responsive element (ABRE) binding factors play central roles by binding to the promoter of many ABA-responsive genes [96]. In this study, many hormone-related elements such as ABRE were detected in the promoter regions, suggesting that these genes may function via regulation of ABA.
D. catenatum is an economic plant and often grows on the surface of tree bark or rocks. Drought stress is a major factor influencing its growth and development. The above analyses revealed that DcNACs could function in drought response. Therefore, exploring the expression levels of the DcNAC genes under drought stress is necessary. The expression of the DcNAC gene was analyzed using RNA-seq data, and the results showed that the DcNAC genes were divided into six clusters on the basis of their expression levels under different drought treatments. Four clusters containing 52 DcNAC genes (58%) were upregulated under different drought treatments, suggesting that most DcNAC genes are involved in drought tolerance. Meanwhile, correlation analysis showed that most upregulated genes were positively correlated (Figure 7a), illustrating that these genes may act synergistically in drought tolerance. Furthermore, nine hub genes with high connection to other genes were screened through co-expression network analysis (Figure 7b). The results indicate that these nine hub genes may play a dominant role in drought tolerance. Meanwhile, Pearson correlation analysis showed that 23 DcNAC genes were highly correlated with DcNAC29, with the largest number, followed by DcNAC64, with 14 related genes. Therefore, DcNAC29 may be the core gene of drought stress regulation. RT-qPCR analysis further showed that the expression levels of DcNAC6/18/29/44/51 were increased in roots, and DcNAC16 and DcNAC64 were highly induced in leaves.
Previous studies showed that the ABA and MAPK signaling pathways play critical roles in drought tolerance [94,97]. The expression of about 30% total genes was altered when exposed to drought [98], and most of these genes are involved in ABA signaling. ABA-responsive element (ABRE)-binding factors (ABFs) function by binding to the cis-element in the promoter of many ABA-responsive genes [96]. PYL-PP2C-SnRK2 is the core component of ABA signaling [99,100,101], and PYL-PP2C can activate MAPK to respond to drought stress [102]. The network predicted that NAM (homolog of DcNAC16) interacted with HAI1, a member of the PP2C family, and AtNAC102 (homolog of DcNAC6) interacted with ABF3 and ABF4. These results indicate that NAM and AtNAC102 may regulate drought tolerance through affecting MAPK and ABA pathways. RD26, which belongs to the NAC member, can specifically bind to the CACG core sequence to activate the expression of many drought-responsive genes [27]. AtNAC083 (homolog of DcNAC44 and DcNAC64) could interact with RD26, suggesting that it might function in response to drought tolerance. The dehydration-responsive-element-binding 2 proteins (DREB2s) can interact with RD29A and function in drought response [103]. The protein–protein interaction network showed that ATAF2 (homolog of DcNAC29) could interact with DRIP1, which is a DREB2A-interacting protein. Thus, DcNAC29 may also be important for drought tolerance. Consequently, the corresponding homologous genes DcNAC6, DcNAC16, DcNAC29, DcNAC44, and DcNAC64 may be involved in ABA and MAPK signaling pathways under drought stress. Conversely, the DcNAC18 and DcNAC51 genes may function in other pathways in response to drought stress and need to be investigated in the future.

5. Conclusions

In this study, 90 NAC genes were identified in the D. catenatum genome. The DcNAC family can be divided into 17 subgroups on the basis of their relationships with Arabidopsis and rice NAC proteins. Conserved motifs and gene structures showed similar features in each subgroup. All the DcNAC genes can be divided into six clusters according to their expression levels using the drought transcriptome data. Seven DcNAC genes (DcNAC6, DcNAC16, DcNAC18, DcNAC29, DcNAC44, DcNAC51, and DcNAC64) were screened and could be used as potential candidate genes for drought tolerance in D. catenatum. In general, the genome-wide analysis of the NAC gene family was first investigated in D. catenatum, and the expression patterns of DcNAC genes under drought stress were studied. The candidate DcNAC genes will provide foundation for the molecular breeding in terms of drought tolerance of D. catenatum.

Supplementary Materials

The following supporting information can be downloaded at https://www.mdpi.com/article/10.3390/agronomy12112753/s1, Figure S1: The percentage of members in each NAC subgroup in D. catenatum (a), A. thaliana (b), and O. sativa (c). Figure S2: The amino acid sequences of each motif identified in DcNAC proteins. Table S1: Primer sequences of quantitative real-time PCR in this study. Table S2: Cis-acting element of DcNAC gene promoters. Table S3: Expression of DcNAC genes in different tissues. Table S4: Expression of DcNAC genes under drought stress (TPM). Table S5: Sequences of the network proteins. Table S6: Information of the network proteins.

Author Contributions

Conceptualization, W.Y. and Y.Z.; formal analysis, Y.L., T.Z., W.X., J.W., W.Y. and Y.Z.; funding acquisition, W.Y. and Y.Z.; investigation, Y.L., T.Z., W.X. and Y.Z.; methodology, Y.L., T.Z. and Y.Z.; supervision, Y.Z; writing—original draft preparation, Y.L., T.Z. and Y.Z.; writing—review and editing, Y.Z. All authors have read and agreed to the published version of the manuscript.

Funding

This research was funded by National Key Research and Development Program of China (nos. 2018YFD1000500 and 2018YFE0207203-2); the Hainan Provincial Natural Science Foundation of China (nos. 320QN368 and 319MS009); the Education Department of Hainan Province (no. Hnky2021-19); the Opening Project Fund of the Key Laboratory of Biology and Genetic Resources of Rubber Tree, Ministry of Agriculture and Rural Affairs (no. RRI-KLOF202003).

Data Availability Statement

Not applicable.

Conflicts of Interest

The authors declare no conflict of interest.

References

  1. Bechtold, U.; Field, B. Molecular mechanisms controlling plant growth during abiotic stress. J. Exp. Bot. 2018, 69, 2753–2758. [Google Scholar] [CrossRef] [PubMed] [Green Version]
  2. Xiong, L.; Schumaker, K.S.; Zhu, J.K. Cell signaling during cold, drought, and salt stress. Plant Cell 2002, 14, S165–S183. [Google Scholar] [CrossRef] [PubMed] [Green Version]
  3. Chaves, M.M.; Maroco, J.P.; Pereira, J.S. Understanding plant responses to drought—From genes to the whole plant. Funct. Plant Biol. 2003, 30, 239–264. [Google Scholar] [CrossRef]
  4. Yamaguchi-Shinozaki, K.; Shinozaki, K. Transcriptional regulatory networks in cellular responses and tolerance to dehydration and cold stresses. Annu. Rev. Plant Biol. 2006, 57, 781–803. [Google Scholar] [CrossRef] [PubMed] [Green Version]
  5. Singh, K.; Foley, R.C.; Oñate-Sánchez, L. Transcription factors in plant defense and stress responses. Curr. Opin. Plant Biol. 2002, 5, 430–436. [Google Scholar] [CrossRef]
  6. Chen, W.J.; Zhu, T. Networks of transcription factors with roles in environmental stress response. Trends Plant Sci. 2004, 9, 591–597. [Google Scholar] [CrossRef]
  7. Huang, G.T.; Ma, S.L.; Bai, L.P.; Zhang, L.; Ma, H.; Jia, P.; Liu, J.; Zhong, M.; Guo, Z.F. Signal transduction during cold, salt, and drought stresses in plants. Mol. Biol. Rep. 2012, 39, 969–987. [Google Scholar] [CrossRef]
  8. Jin, P.; Zhang, H.; Kong, L.; Gao, G.; Luo, J. PlantTFDB 3.0: A portal for the functional and evolutionary study of plant transcription factors. Nucleic Acids Res. 2014, 42, 1182–1189. [Google Scholar] [CrossRef] [Green Version]
  9. Baillo, E.H.; Kimotho, R.N.; Zhang, Z.; Xu, P. Transcription factors associated with abiotic and biotic stress tolerance and their potential for crops improvement. Genes 2019, 10, 771. [Google Scholar] [CrossRef] [Green Version]
  10. Mun, B.G.; Lee, S.U.; Park, E.J.; Kim, H.H.; Hussain, A.; Imran, Q.M.; Lee, I.J.; Yun, B.W. Analysis of transcription factors among differentially expressed genes induced by drought stress in Populus davidiana. 3 Biotech 2017, 3, 209. [Google Scholar] [CrossRef]
  11. Souer, E.; Houwelingen, V.A.; Kloos, D.; Mol, J.; Koes, R. The no apical meristem gene of Petunia is required for pattern formation in embryos and flowers and is expressed at meristem and primordia boundaries. Cell 1996, 85, 159–229. [Google Scholar] [CrossRef] [Green Version]
  12. Aida, M.; Ishida, T.; Fukaki, H.; Fujisawa, H.; Tasaka, M. Genes involved in organ separation in Arabidopsis: An analysis of the cup-shaped cotyledon mutant. Plant Cell 1997, 9, 841–857. [Google Scholar] [CrossRef] [PubMed] [Green Version]
  13. Olsen, A.N.; Ernst, H.A.; Leggio, L.L.; Skriver, K. NAC transcription factors: Structurally distinct, functionally diverse. Trends Plant Sci. 2005, 10, 79–87. [Google Scholar] [CrossRef] [PubMed]
  14. Ernst, H.A.; Olsen, A.N.; Larsen, S.; Leggio, L.L. Structure of the conserved domain of ANAC, a member of the NAC family of transcription factors. EMBO Rep. 2004, 5, 297–303. [Google Scholar] [CrossRef]
  15. Chen, Q.; Wang, Q.; Xiong, L.; Lou, Z. A structural view of the conserved domain of rice stress-responsive NAC1. Protein Cell 2011, 2, 55–63. [Google Scholar] [CrossRef] [Green Version]
  16. Puranik, S.; Sahu, P.P.; Srivastava, P.S.; Prasad, M. NAC proteins: Regulation and role in stress tolerance. Trends Plant Sci. 2012, 17, 369–381. [Google Scholar] [CrossRef]
  17. Ooka, H.; Satoh, K.; Doi, K.; Nagata, T.; Otomo, Y.; Murakami, K.; Matsubara, K.; Osato, N.; Kawai, J.; Carninci, P.; et al. Comprehensive analysis of NAC family genes in Oryza sativa and Arabidopsis thaliana. DNA Res. 2003, 31, 239–247. [Google Scholar] [CrossRef]
  18. Jensen, M.K.; Rung, J.H.; Gregersen, P.L.; Gjetting, T.; Fuglsang, A.T.; Hansen, M.; Joehnk, N.; Lyngkjaer, M.F.; Collinge, D.B. The HvNAC6 transcription factor: A positive regulator of penetration resistance in barley and Arabidopsis. Plant Mol. Biol. 2007, 65, 137–187. [Google Scholar] [CrossRef]
  19. Mohanta, T.K.; Yadav, D.; Khan, A.; Hashem, A.; Tabassum, B.; Khan, A.L.; Allah, E.F.; AI-Harrasi, A. Genomics, molecular and evolutionary perspective of NAC transcription factors. PLoS ONE 2020, 15, e0231425. [Google Scholar] [CrossRef] [Green Version]
  20. Pinheiro, G.L.; Marques, C.S.; Costa, M.D.B.L.; Reis, P.A.B.; Alves, M.S.; Carvalho, C.M.; Fietto, L.G.; Fontes, E.P.B. Complete inventory of soybean NAC transcription factors: Sequence conservation and expression analysis uncover their distinct roles in stress response. Gene 2009, 444, 10–23. [Google Scholar] [CrossRef] [PubMed]
  21. Diao, W.P.; Snyder, J.C.; Wang, S.; Liu, J.; Pan, B.; Guo, G.; Ge, W.; Dawood, M.H.S.A. Genome-wide analyses of the NAC transcription factor gene family in pepper (Capsicum annuum L.): Chromosome location, phylogeny, structure, expression patterns, cis-elements in the promoter, and interaction network. Int. J. Mol. Sci. 2018, 19, 1028. [Google Scholar] [CrossRef] [PubMed] [Green Version]
  22. Nigarish, M.; Chen, Y.; Chen, X.; Muhammad, A.N.; Junaid, I.; Hafiz, M.R.; Shen, X.; Lin, L.I.; Xu, X.H.; Lai, Z.X. Genome-wide identification and comprehensive analyses of NAC transcription factor gene family and expression patterns during somatic embryogenesis in Dimocarpus longan Lour. Plant Physiol. Biochem. 2020, 157, 169–184. [Google Scholar] [CrossRef]
  23. Li, W.; Zeng, Y.; Yin, F.; Wei, R.; Mao, X. Genome-wide identification and comprehensive analysis of the NAC transcription factor family in sunflower during salt and drought stress. Sci. Rep. 2021, 11, 19865. [Google Scholar] [CrossRef] [PubMed]
  24. Satheesh, V.; Jagannadham, P.T.K.; Chidambaranathan, P.; Jain, P.K.; Srinivasan, R. NAC transcription factor genes: Genome-wide identification, phylogenetic, motif and cis-regulatory element analysis in pigeonpea (Cajanus cajan (L.) Millsp.). Mol. Biol. Rep. 2014, 41, 7763–7773. [Google Scholar] [CrossRef] [PubMed]
  25. Wang, X.; Basnayake, B.M.V.S.; Zhang, H.; Li, G.; Li, W.; Virk, N.; Mengiste, T.; Song, F.M. The Arabidopsis ATAF1, a NAC transcription factor, is a negative regulator of defense responses against necrotrophic fungal and bacterial pathogens. Mol. Plant Microbe Interact. 2009, 22, 1227–1238. [Google Scholar] [CrossRef] [Green Version]
  26. Fujita, M.; Fujita, Y.; Maruyama, K.; Seki, M.; Hiratsu, K.; Ohmetakagi, M.; Tran, P.L.S.; Yamaguchi-Shinozaki, K.; Shinozaki, K. A dehydration-induced NAC protein, RD26, is involved in a novel ABA-dependent stress-signaling pathway. Plant J. 2004, 39, 863–876. [Google Scholar] [CrossRef]
  27. Tran, L.P.; Nakashima, K.; Sakuma, Y.; Simpson, S.D.; Fujita, Y.; Maruyama, K.; Fujita, M.; Seki, M.; Shinozaki, K.; Yamaguchi-Shinozaki, K. Isolation and functional analysis of Arabidopsis stress-inducible NAC transcription factors that bind to a drought-responsive cis-element in the early responsive to dehydration stress 1 promoter. Plant Cell 2004, 16, 2481–2498. [Google Scholar] [CrossRef] [Green Version]
  28. Sakuraba, Y.; Kim, Y.; Han, S.; Lee, B.; Paek, N. The Arabidopsis transcription factor NAC016 promotes drought stress responses by repressing AREB1 transcription through a trifurcate feed-forward regulatory loop involving NAP. Plant Cell 2015, 27, 1771–1787. [Google Scholar] [CrossRef] [Green Version]
  29. Jiang, D.; Zhou, L.; Chen, W.; Ye, N.; Xia, J.; Zhuang, C. Overexpression of a microRNA-targeted NAC transcription factor improves drought and salt tolerance in rice via ABA-mediated pathways. Rice 2019, 12, 76. [Google Scholar] [CrossRef]
  30. Hu, H.H.; Dai, M.Q.; Yao, J.L.; Xiao, B.; Li, X.; Zhang, Q.; Xiong, L.Z. Overexpressing a NAM, ATAF, and CUC (NAC) transcription factor enhances drought resistance and salt tolerance in rice. Proc. Natl. Acad. Sci. USA 2006, 103, 12987–12992. [Google Scholar] [CrossRef]
  31. Zhang, T.T.; Cui, Z.; Li, Y.X.; Kang, Y.Q.; Song, X.Q.; Wang, J.; Zhou, Y. Genome-Wide identification and expression analysis of MYB transcription factor superfamily in Dendrobium catenatum. Front. Genet. 2021, 26, 714696. [Google Scholar] [CrossRef] [PubMed]
  32. Sun, L.; Yang, Z.T.; Song, Z.T.; Wang, M.J.; Sun, L.; Lu, S.J.; Liu, J.X. The plant-specific transcription factor gene NAC103 is induced by bZIP60 through a new cis-regulatory element to modulate the unfolded protein response in Arabidopsis. Plant J. 2013, 76, 274–286. [Google Scholar] [CrossRef] [PubMed]
  33. Yuan, X.; Wang, H.; Cai, J.; Bi, Y.; Li, D.; Song, F. Rice NAC transcription factor ONAC066 functions as a positive regulator of drought and oxidative stress response. BMC Plant Biol. 2019, 19, 278. [Google Scholar] [CrossRef]
  34. Hao, Y.J.; Wei, W.; Song, Q.X.; Chen, H.W.; Zhang, Y.Q.; Wang, F.; Zou, H.F.; Lei, G.; Tian, A.G.; Zhang, W.K.; et al. Soybean NAC transcription factors promote abiotic stress tolerance and lateral root formation in transgenic plants. Plant J. 2011, 68, 302–313. [Google Scholar] [CrossRef] [PubMed]
  35. Ng, T.B.; Liu, J.; Wong, J.H.; Ye, X.; Wing Sze, S.C.; Tong, Y.; Zhang, K.Y. Review of research on Dendrobium, a prized folk medicine. Appl. Microbiol. Biotechnol. 2012, 93, 1795–1803. [Google Scholar] [CrossRef] [PubMed]
  36. Pan, L.H.; Li, X.F.; Wang, M.N.; Zha, X.Q.; Yang, X.F.; Liu, Z.J.; Luo, Y.B.; Luo, J.P. Comparison of hypoglycemic and antioxidative effects of polysaccharides from four different Dendrobium species. Int. J. Biol. Macromol. 2014, 64, 420–427. [Google Scholar] [CrossRef]
  37. Tang, H.; Zhao, T.; Sheng, Y.; Zheng, T.; Fu, L.; Zhang, Y. Dendrobium officinale Kimura et Migo: A review on its ethnopharmacology, phytochemistry, pharmacology, and industrialization. Evid.-Based Complement Altern. Med. 2017, 12, 7436259. [Google Scholar] [CrossRef] [Green Version]
  38. Sun, J.; Guo, Y.; Fu, X.; Wang, Y.; Liu, Y.; Huo, B.; Sheng, J.; Hu, X. Dendrobium candidum inhibits MCF-7 cells proliferation by inducing cell cycle arrest at G2/M phase and regulating key biomarkers. OncoTargets Ther. 2015, 9, 21–30. [Google Scholar] [CrossRef] [Green Version]
  39. Zhang, G.Q.; Xu, Q.; Bian, C.; Tsai, W.C.; Yeh, C.M.; Liu, K.W.; Yoshida, K.; Zhang, L.S.; Chang, S.B.; Chen, F.; et al. The Dendrobium catenatum Lindl. genome sequence provides insights into polysaccharide synthase, floral development and adaptive evolution. Sci. Rep. 2016, 6, 19029. [Google Scholar] [CrossRef] [Green Version]
  40. Atwood, J.T. The size of orchidaceae and the systematic distribution of epiphytic orchids. Selbyana 1986, 9, 171–186. [Google Scholar]
  41. Zotz, G.; Winkler, U. Aerial roots of epiphytic Orchids: The velamen radicum and its role in water and nutrient uptake. Oecologia 2013, 171, 733–741. [Google Scholar] [CrossRef]
  42. Wan, X.; Zou, L.H.; Zheng, B.Q.; Tian, Y.Q.; Wang, Y. Transcriptomic profiling for prolonged drought in Dendrobium catenatum. Sci. Data 2018, 5, 180233. [Google Scholar] [CrossRef] [PubMed] [Green Version]
  43. Yang, Z.; Nie, G.; Feng, G.; Han, J.; Huang, L.; Zhang, X. Genome-wide identification, characterization, and expression analysis of the NAC transcription factor family in orchardgrass (Dactylis glomerata L.). BMC Genom. 2021, 22, 178. [Google Scholar] [CrossRef] [PubMed]
  44. Nie, G.; Yang, X.; Yang, Z.; Zhong, M.; Zhu, Y.; Zhou, J.; Appiah, C.; Liao, Z.C.; Feng, G.Y.; Zhang, X.Q. Genome-wide investigation of the NAC transcript factor family in perennial ryegrass (Lolium perenne L.) and expression analysis under various abiotic stressor. Genomics 2020, 112, 4224–4231. [Google Scholar] [CrossRef] [PubMed]
  45. Bailey, T.L.; Boden, M.; Buske, F.A.; Frith, M.; Grant, C.E.; Clementi, L.; Ren, J.Y.; Li, W.W.; Noble, W.S. MEME SUITE: Tools for motif discovery and searching. Nucleic Acids Res. 2009, 37, W202–W208. [Google Scholar] [CrossRef] [PubMed]
  46. Chen, C.; Chen, H.; Zhang, Y.; Thomas, H.R.; Frank, M.H.; He, Y.; Xia, R. TBtools: An integrative toolkit developed for interactive analyses of big biological data. Mol. Plant 2020, 13, 1194–1202. [Google Scholar] [CrossRef] [PubMed]
  47. Bray, N.L.; Pimentel, H.; Melsted, P.; Pachter, L. Near-optimal probabilistic RNA-Seq quantification. Nat. Biotechnol. 2016, 34, 525–527. [Google Scholar] [CrossRef] [PubMed]
  48. Zhang, T.T.; Xu, Y.; Ding, Y.D.; Yu, W.G.; Wang, J.; Lai, H.G.; Zhou, Y. Identification and expression analysis of WRKY gene family in response to abiotic stress in Dendrobium catenatum. Front. Genet. 2022, 3, 800019. [Google Scholar] [CrossRef]
  49. Shannon, P.; Markiel, A.; Ozier, O.; Baliga, N.S.; Wang, J.T.; Ramage, D.; Amin, N.; Schwikowski, B.; Ideker, T. Cytoscape: A software environment for integrated models of biomolecular interaction networks. Genome 2003, 13, 2498–2504. [Google Scholar] [CrossRef]
  50. Seifert, E. OriginPro 9.1: Scientific data analysis and graphing software-software review. J. Chem. Inf. Model. 2014, 54, 1552. [Google Scholar] [CrossRef]
  51. Szklarczyk, D.; Gable, A.L.; Lyon, D.; Junge, A.; Wyder, S.; Huerta-Cepas, J.; Simonivic, M.; Doncheva, N.T.; Morris, J.H.; Bork, P.; et al. STRING v11: Protein-protein association networks with increased coverage, supporting functional discovery in genome-wide experimental datasets. Nucleic Acids Res. 2019, 47, 607–613. [Google Scholar] [CrossRef] [PubMed]
  52. Luscombe, N.M.; Austin, S.E.; Berman, H.M.; Thornton, J.M. An overview of the structures of protein-DNA complexes. Genome Biol. 2000, 1, 1–37. [Google Scholar] [CrossRef] [PubMed] [Green Version]
  53. Riechmann, J.L.; Heard, J.; Martin, G.; Reuber, L.; Jiang, C.; Keddie, J.; Adam, L.; Pineda, O.; Ratcliffe, O.J.; Samaha, R.R.; et al. Arabidopsis transcription factors: Genome-wide comparative analysis among eukaryotes. Science 2000, 5499, 2105–2115. [Google Scholar] [CrossRef] [PubMed]
  54. Carroll, S.B. Endless forms: The evolution of gene regulation and morphological diversity. Cell 2000, 101, 577–657. [Google Scholar] [CrossRef] [Green Version]
  55. Girardi, C.L.; Rombaldi, C.V.; Dal Cero, J.; Nobile, P.M.; Laurens, F.; Bouzayen, M. Genome-wide analysis of the AP2/ERF superfamily in apple and transcriptional evidence of ERF involvement in scab pathogenesis. Sci. Hortic. 2013, 151, 112–121. [Google Scholar] [CrossRef] [Green Version]
  56. Zhuang, J.; Cai, B.; Peng, R.H.; Zhu, B.; Jin, X.F.; Xue, Y.; Gao, F.; Fu, X.Y.; Tian, Y.S.; Zhao, W.; et al. Genome-wide analysis of the AP2/ERF gene family in Populus trichocarpa. Biochem. Biophys. Res. Commun. 2008, 371, 468–542. [Google Scholar] [CrossRef]
  57. Zhu, J.K. Salt and drought stress signal transduction in plants. Annu. Rev. Plant Biol. 2002, 53, 247–273. [Google Scholar] [CrossRef] [Green Version]
  58. Guo, Y.; Gan, S. AtNAP, a NAC family transcription factor, has an important role in leaf senescence. Plant J. 2006, 46, 601–613. [Google Scholar] [CrossRef]
  59. Garapati, P.; Xue, G.P.; Munné-Bosch, S.; Balazadeh, S. Transcription Factor ATAF1 in Arabidopsis promotes senescence by direct regulation of key chloroplast maintenance and senescence transcriptional cascades. Plant Physiol. 2015, 168, 1122–1161. [Google Scholar] [CrossRef] [Green Version]
  60. Pimenta, M.R.; Silva, P.A.; Mendes, G.C.; Alves, J.R.; Caetano, H.D.; Machado, J.P.; Brustolini, O.J.; Carpinetti, P.A.; Melo, B.P.; Silva, J.C.; et al. The stress-induced soybean NAC transcription factor GmNAC81 plays a positive role in developmentally programmed leaf senescence. Plant Cell Physiol. 2016, 57, 1098–1212. [Google Scholar] [CrossRef]
  61. Mao, C.; Lu, S.; Lv, B.; Zhang, B.; Shen, J.; He, J.; Luo, L.Q.; Xi, D.D.; Chen, X.; Ming, F. A rice NAC transcription factor promotes leaf senescence via ABA biosynthesis. Plant Physiol. 2017, 174, 1747–1763. [Google Scholar] [CrossRef] [PubMed]
  62. Shan, Z.; Jiang, Y.; Li, H.; Guo, J.; Dong, M.; Zhang, J.; Liu, J.Q. Genome-wide analysis of the NAC transcription factor family in broomcorn millet (Panicum miliaceum L.) and expression analysis under drought stress. BMC Genom. 2020, 21, 96. [Google Scholar] [CrossRef] [PubMed] [Green Version]
  63. Balazadeh, S.; Kwasniewski, M.; Caldana, C.; Mehrnia, M.; Zanor, M.I.; Xue, G.P.; Mueller-Roeber, B. ORS1, an H2O2-responsive NAC transcription factor, controls senescence in Arabidopsis thaliana. Mol. Plant. 2011, 4, 346–360. [Google Scholar] [CrossRef] [Green Version]
  64. Spinelli, S.V.; Martin, A.P.; Viola, I.L.; Gonzalez, D.H.; Palatnik, J.F. A mechanistic link between STM and CUC1 during Arabidopsis development. Plant Physiol. 2011, 156, 1894–1904. [Google Scholar] [CrossRef] [PubMed] [Green Version]
  65. Zhou, J.; Zhong, R.; Ye, Z.H. Arabidopsis NAC domain proteins, VND1 to VND5, are transcriptional regulators of secondary wall biosynthesis in vessels. PLoS ONE 2014, 9, e105726. [Google Scholar] [CrossRef] [PubMed]
  66. Kim, S.G.; Kim, S.Y.; Park, C.M. A membrane-associated NAC transcription factor regulates salt-responsive flowering via FLOWERING LOCUS T in Arabidopsis. Planta 2007, 226, 647–654. [Google Scholar] [CrossRef]
  67. Li, P.; Zhou, H.; Shi, X.; Yu, B.; Zhou, Y.; Chen, S.; Wang, Y.F.; Peng, Y.; Meyer, R.C.; Smeekens, S.C.; et al. The ABI4-induced Arabidopsis ANAC060 transcription factor attenuates ABA signaling and renders seedlings sugar insensitive when present in the nucleus. PLoS Genet. 2014, 10, e1004213. [Google Scholar] [CrossRef] [Green Version]
  68. Donze, T.; Qu, F.; Twigg, P.; Morris, T.J. Turnip crinkle virus coat protein inhibits the basal immune response to virus invasion in Arabidopsis by binding to the NAC transcription factor TIP. Virology 2014, 449, 207–214. [Google Scholar] [CrossRef]
  69. Jeong, R.D.; Chandra-Shekara, A.C.; Kachroo, A.; Klessig, D.F.; Kachroo, P. HRT-mediated hypersensitive response and resistance to Turnip crinkle virus in Arabidopsis does not require the function of TIP, the presumed guardee protein. Mol. Plant Microbe Interact. 2018, 21, 1316–1324. [Google Scholar] [CrossRef] [Green Version]
  70. Asahina, M.; Azuma, K.; Pitaksaringkarn, W.; Yamazaki, T.; Mitsuda, N.; OhmeTakagi, M.; Yamaguchi, S.; Kamiya, Y.; Okada, K.; Nishimura, T.; et al. Spatially selective hormonal control of RAP2.6L and ANAC071 transcription factors involved in tissue reunion in Arabidopsis. Proc. Natl. Acad. Sci. USA 2011, 108, 16128–16132. [Google Scholar] [CrossRef] [Green Version]
  71. Xu, Z.Y.; Kim, S.Y.; Kim, D.H.; Dong, T.; Park, Y.; Jin, J.B.; Joo, S.H.; Kim, S.K.; Hong, J.C.; Hwang, D.; et al. The Arabidopsis NAC transcription factor ANAC096 cooperates with bZIP-type transcription factors in dehydration and osmotic stress responses. Plant Cell 2013, 25, 4708–4724. [Google Scholar] [CrossRef] [PubMed]
  72. Yang, J.H.; Lee, K.; Du, Q.; Yang, S.; Yuan, B.; Qi, L.; Wang, H.Z. A membraneassociated NAC domain transcription factor XVP interacts with TDIF co-receptor and regulates vascular meristem activity. New Phytol. 2020, 226, 59–74. [Google Scholar] [CrossRef]
  73. Yoshiyama, K.O.; Kimura, S.; Maki, H.; Britt, A.B.; Umeda, M. The role of SOG1, a plant-specific transcriptional regulator, in the DNA damage response. Plant Signal. Behav. 2014, 9, e28889. [Google Scholar] [CrossRef] [PubMed] [Green Version]
  74. Nuruzzaman, M.; Manimekalai, R.; Sharoni, A.M.; Satoh, K.; Kondoh, H.; Ooka, H.; Kikuchi, S. Genome-wide analysis of NAC transcription factor family in rice. Gene 2010, 465, 30–44. [Google Scholar] [CrossRef] [PubMed]
  75. He, X.; Mu, R.; Cao, W.; Zhang, Z.; Zhang, J.; Chen, S. AtNAC2, a transcription factor downstream of ethylene and auxin signaling pathways, is involved in salt stress response and lateral root development. Plant J. 2005, 44, 903–916. [Google Scholar] [CrossRef] [PubMed]
  76. Lu, P.L.; Chen, N.Z.; An, R.; Su, Z.; Qi, B.S.; Ren, F.; Chen, J.; Wang, X.C. A novel drought-inducible gene, ATAF1, encodes a NAC family protein that negatively regulates the expression of stress-responsive genes in Arabidopsis. Plant Mol. Biol. 2007, 63, 289–305. [Google Scholar] [CrossRef]
  77. Fang, Y.; You, J.; Xie, K.; Xie, W.; Xiong, L. Systematic sequence analysis and identification of tissue-specific or stress-responsive genes of NAC transcription factor family in rice. Mol. Genet. Genom. 2008, 280, 547–610. [Google Scholar] [CrossRef]
  78. Hu, W.; Wei, Y.; Xia, Z.; Yan, Y.; Hou, X.; Zou, M.; Lu, C.; Wang, W.Q. Genome-Wide identification and expression analysis of the NAC transcription factor family in cassava. PLoS ONE 2015, 10, e0136993. [Google Scholar] [CrossRef]
  79. Wei, S.; Gao, L.; Zhang, Y.; Zhang, F.; Yang, X.; Huang, D. Genome wide investigation of the NAC transcription factor family in melon (Cucumis melo L.) and their expression analysis under salt stress. Plant Cell Rep. 2016, 35, 1827–1839. [Google Scholar] [CrossRef]
  80. Rogozin, I.B.; Wolf, Y.I.; Sorokin, A.V.; Mirkin, B.G.; Koonin, E.V. Remarkable interkingdom conservation of intron positions and massive, lineage-specific intron loss and gain in eukaryotic evolution. Curr. Biol. 2003, 13, 1512–1519. [Google Scholar] [CrossRef] [Green Version]
  81. Kang, M.; Kim, S.; Kim, H.J.; Shrestha, P.; Yun, J.H.; Phee, B.K.; Lee, W.; Naw, H.G.; Chang, I. The C-Domain of the NAC transcription factor ANAC019 is necessary for pH-tuned DNA binding through a histidine switch in the N-Domain. Cell Rep. 2018, 22, 1141–1150. [Google Scholar] [CrossRef] [PubMed]
  82. Nakashima, K.; Takasaki, H.; Mizoi, J.; Shinozaki, K.; Yamaguchi-Shinozaki, K. NAC transcription factors in plant abiotic stress responses. Biochim. Biophys. Acta 2020, 1819, 97–103. [Google Scholar] [CrossRef] [PubMed]
  83. Nuruzzaman, M.; Sharoni, A.M.; Satoh, K.; Moumeni, A.; Venuprasad, R.; Serraj, R.; Kumar, A.; Leung, H.; Attia, K.; Kikuchi, S. Comprehensive gene expression analysis of the NAC gene family under normal growth conditions, hormone treatment, and drought stress conditions in rice using near-isogenic lines (NILs) generated from crossing Aday Selection (drought tolerant) and IR64. Mol. Genet. Genom. 2012, 287, 389–410. [Google Scholar] [CrossRef] [Green Version]
  84. Ju, Y.L.; Yue, X.F.; Min, Z.; Wang, X.H.; Fang, Y.L.; Zhang, J.X. VvNAC17, a novel stress-responsive grapevine (Vitis vinifera L.) NAC transcription factor, increases sensitivity to abscisic acid and enhances salinity, freezing, and drought tolerance in transgenic Arabidopsis. Plant Physiol. Biochem. 2020, 146, 98–111. [Google Scholar] [CrossRef]
  85. Wang, Y.; Cao, S.; Guan, C.; Kong, X.; Wang, Y.; Cui, Y.; Liu, B.; Zhou, Y.W.; Zhang, Y.N. Overexpressing the NAC transcription factor LpNAC13 from Lilium pumilum in tobacco negatively regulates the drought response and positively regulates the salt response. Plant Physiol. Biochem. 2020, 149, 96–110. [Google Scholar] [CrossRef] [PubMed]
  86. Yang, X.; Kim, M.Y.; Ha, J.; Lee, S.H. Overexpression of the soybean NAC gene GmNAC109 increases lateral root formation and abiotic stress tolerance in transgenic Arabidopsis plants. Front. Plant Sci. 2019, 10, 1036. [Google Scholar] [CrossRef] [Green Version]
  87. Wu, R.; Duan, L.; Pruneda-Paz, J.L.; Oh, D.H.; Pound, M.; Kay, S.; Dinneny, J.R. The 6xABRE synthetic promoter enables the spatiotemporal analysis of ABA-mediated transcriptional regulation. Plant Physiol. 2018, 177, 1650–1665. [Google Scholar] [CrossRef] [PubMed] [Green Version]
  88. Liao, Y.; Zou, H.F.; Wei, W.; Hao, Y.J.; Tian, A.G.; Huang, J.; Liu, Y.F.; Zhang, J.S.; Chen, S.Y. Soybean GmbZIP44, GmbZIP62 and GmbZIP78 genes function as negative regulator of ABA signaling and confer salt and freezing tolerance in transgenic Arabidopsis. Planta 2008, 228, 225–240. [Google Scholar] [CrossRef]
  89. Zhang, Y.; Luo, M.; Cheng, L.; Lin, Y.; Chen, Q.; Sun, B.; Gu, X.J.; Wang, Y.; Li, M.Y.; Luo, Y.; et al. Identification of the cytosolic glucose-6-Phosphate dehydrogenase gene from strawberry involved in cold stress response. Int. J. Mol. Sci. 2020, 21, 7322. [Google Scholar] [CrossRef]
  90. An, J.P.; Li, R.; Qu, F.J.; You, C.X.; Wang, X.F.; Hao, Y.J. An apple NAC transcription factor negatively regulates cold tolerance via CBF-dependent pathway. J. Plant Physiol. 2018, 221, 74–80. [Google Scholar] [CrossRef]
  91. Wang, G.; Zhang, S.; Ma, X.; Wang, Y.; Kong, F.; Meng, Q. A stress-associated NAC transcription factor (SlNAC35) from tomato plays a positive role in biotic and abiotic stresses. Physiol. Plant. 2016, 158, 45–64. [Google Scholar] [CrossRef] [PubMed]
  92. Theologis, A.; Ecker, J.R.; Palm, C.J.; Federspiel, N.A.; Kaul, S.; White, O.; Alonso, J.; Altafi, H.; Araujo, H.; Bowman, C.L.; et al. Sequence and analysis of chromosome 1 of the plant Arabidopsis thaliana. Nature 2000, 408, 816–820. [Google Scholar] [CrossRef] [PubMed]
  93. Zhu, J.K. Abiotic stress signaling and responses in plants. Cell 2016, 167, 313–324. [Google Scholar] [CrossRef] [PubMed] [Green Version]
  94. Cutler, S.R.; Rodriguez, P.L.; Finkelstein, R.R.; Abrams, S.R. Abscisic acid: Emergence of a core signaling network. Annu. Rev. Plant Biol. 2010, 61, 651–679. [Google Scholar] [CrossRef] [PubMed] [Green Version]
  95. Finkelstein, R.R.; Gampala, S.S.L.; Rock, C.D. Abscisic acid signaling in seeds and seedlings. Plant Cell 2002, 14, S15–S45. [Google Scholar] [CrossRef] [PubMed] [Green Version]
  96. Fujita, Y.; Fujita, M.; Satoh, R.; Maruyama, K.; Parvez, M.M.; Seki, M.; Hiratsu, K.; Ohme-Takagi, M.; Shinozaki, K.; Yamaguchi-Shinozaki, K. AREB1 is a transcription activator of novel ABRE-dependent ABA signaling that enhances drought stress tolerance in Arabidopsis. Plant Cell 2005, 17, 3470–3488. [Google Scholar] [CrossRef] [PubMed] [Green Version]
  97. Danquah, A.; de Zelicourt, A.; Colcombet, J.; Hirt, H. The role of ABA and MAPK signaling pathways in plant abiotic stress responses. Biotechnol. Adv. 2014, 32, 40–52. [Google Scholar] [CrossRef]
  98. Maruyama, K.; Urano, K.; Yoshiwara, K.; Morishita, Y.; Sakurai, N.; Suzuki, H.; Kojima, M.; Sakakibara, H.; Shibata, D.; Saito, K.; et al. Integrated analysis of the effects of cold and dehydration on rice metabolites, phytohormones, and gene transcripts. Plant Physiol. 2014, 164, 1759–1771. [Google Scholar] [CrossRef] [Green Version]
  99. Ma, Y.; Szostkiewicz, I.; Korte, A.; Moes, D.; Yang, Y.; Christmann, A.; Grill, E. Regulators of PP2C phosphatase activity function as abscisic acid sensors. Science 2009, 324, 1064–1068. [Google Scholar] [CrossRef]
  100. Park, S.Y.; Fung, P.; Nishimura, N.; Jensen, D.R.; Fujii, H.; Zhao, Y. Abscisic acid inhibits type 2C protein phosphatases via the PYR/PYL family of START proteins. Science 2009, 324, 1068–1071. [Google Scholar] [CrossRef] [Green Version]
  101. Wong, M.M.; Bhaskara, G.B.; Wen, T.N.; Lin, W.D.; Nguyen, T.T.; Chong, G.L. Phosphoproteomics of Arabidopsis highly ABA-induced1 identifies AT-Hook-Like10 phosphorylation required for stress growth regulation. Proc. Natl. Acad. Sci. USA 2019, 116, 2354–2363. [Google Scholar] [CrossRef] [PubMed]
  102. de Zelicourt, A.; Colcombet, J.; Hirt, H. The role of MAPK modules and ABA during abiotic stress signaling. Trends Plant Sci. 2016, 21, 677–685. [Google Scholar] [CrossRef] [PubMed]
  103. Sakuraba, Y.; Han, S.H.; Lee, S.H.; Hortensteiner, S.; Paek, N.C. Arabidopsis NAC016 promotes chlorophyll breakdown by directly upregulating STAYGREEN1 transcription. Plant Cell Rep. 2016, 35, 155–166. [Google Scholar] [CrossRef] [PubMed]
Figure 1. Phylogenetic analyses of NAC proteins from D. catenatum, Arabidopsis, and rice. A phylogenetic tree of NAC proteins was constructed using MEGA-X software (version 10.0.5). The NAC domains were classified into two large groups: Groups I and II. Group I was divided into 13 subgroups (TERN, ONAC022, SENU5, NAP, AtNAC3, ATAF, OsNAC3, NAC2, ANAC011, TIP, OsNAC7, NAC1, and NAM). Group II was divided into 4 subgroups (ANAC001, ONAC003, ONAC001, and ANAC063). The 17 subgroups are indicated with different colors. The red pentacles represent A. thaliana NACs (AtNACs), the green boxes represent D. catenatum NACs (DcNACs), and the blue triangles represent O. sativa NACs (OsNACs).
Agronomy 12 02753 g001
Figure 2. Motifs, structures, and phylogenetic relationships of DcNAC family members. (a) A phylogenetic tree of 90 DcNAC proteins was constructed using the maximum likelihood method. The different subgroups are indicated with different background colors and letters. (b) Conserved motifs of DcNAC proteins. Different motifs are represented by different colored boxes. (c) Exon/intron structures of DcNAC genes with UTR(s), exon(s), and intron(s) are indicated with yellow and green boxes, and black lines, respectively. The phylogenetic tree, conserved motifs, and gene structures were predicted with TBtools.
Agronomy 12 02753 g002
Figure 3. NAC domain and TAR in D. catenatum NAC family protein. (a) The predicted domains in the N-terminus and C-terminus. The NAC domain consists of subdomains A to E. The TAR (transcriptional activation region) is the C-terminal activation domain. (b) Alignment of the NAC domain from the MEME results for the DcNACs. The motifs 3, 4, 1, 2, and 5 form the putative DcNAC NAC domain.
Agronomy 12 02753 g003
Figure 4. The number of DcNAC promoters containing various cis-acting elements. Different colors represent different cis-element types. The numbers above the columns represent the number of promoters.
Agronomy 12 02753 g004
Figure 5. Hierarchical clustering of expression profiles of DcNAC gene expression profiles across different D. catenatum tissues. Data were normalized relative to each gene’s mean expression value across all tissues and log2-transformed. TPM (transcripts per million) values were used to create heat maps showing the expression of DcNAC genes in different tissues, ranging from low expression (green) to high expression (red).
Agronomy 12 02753 g005
Figure 6. The expression patterns of DcNAC genes evaluated by RNA-seq. The left heatmap shows the expression of DcNAC genes under different volumetric water contents of base material. Data were normalized relative to each gene’s mean expression value across all treatments and log2-transformed. TPM (transcripts per million) values were used to create a heat map showing the expression of DcNAC genes. The expression level ranged from low expression (green) to high expression (red). The right heatmap showed the TPM ratios, with high ratios in red and low ratios in cyan. T1 was equal to the TPM of 10–15% divided by the TPM of 30–35%, and T2 was equal to the TPM of 0% divided by the TPM of 30–35%. The amounts of 30–35%/10–15%/0% represent the fact that the volumetric water content of the base material declined to ≈30–35%, ≈10–15%, and ≈0%, respectively.
Agronomy 12 02753 g006
Figure 7. Comprehensive analysis of drought-related DcNAC genes. (a) Correlation analysis of upregulated DcNAC genes. Red indicates a positive correlation, and blue indicates a negative correlation. The circle size indicates the absolute value of the correlation coefficient. (b) Co-expression network analysis. The red line represents a positive correlation. The size represents the degree calculated by the Cytoscape.
Agronomy 12 02753 g007
Figure 8. Interaction networks of the selected DcNACs in D. catenatum and related genes in Arabidopsis. The colored, white, empty, and filled nodes represent the first shell of interactors, the second shell of interactors, proteins with unknown 3D structure, and proteins with known or predicted 3D structure, respectively. The light blue and purple lines indicate known interactions. The green, red, and blue lines indicate predicated interactions. The cyan, black, and yellow lines represent protein homology, co-expression, and text mining, respectively.
Agronomy 12 02753 g008
Figure 9. Real-time quantitative PCR analyses of the nine hub DcNAC genes under drought stress in roots and leaves. The mean expression value was calculated from three replicates. Vertical bars indicate the standard deviation. Values of 0, 3, 6, 9, 12, 24, and 48 indicate hours after treatment. Mean values and standard deviations were calculated according to the data. The unstressed level (0 h) was used as a control. Asterisks (* or **) indicate a significant difference at p < 0.05 or p < 0.01, respectively.
Agronomy 12 02753 g009
Table 1. Physicochemical properties of D. catenatum NAC proteins.
Gene NameGene IDLocusLengthMW(KD)pINo.of TransmembraneSubcellular Localization
DcNAC1LOC110104261NW_021319405.1:944588..94625331836.005.59-Nuclear
DcNAC2LOC110105825NW_021318852.1:8900458..890160022225.038.69-Nuclear, Mitochondrial
DcNAC3LOC110105421NW_021319664.1:601710..60606538743.868.38-Nuclear
DcNAC4LOC110095412NW_021319664.1:601710..60606526930.907.25-Nuclear
DcNAC5LOC110116424NW_021319483.1:4428910..443255531336.696.49-Nuclear
DcNAC6LOC110098761NW_021319202.1:1232820..123419427431.285.42-Mitochondrial, Cytoplasmic
DcNAC7LOC110109664NW_021319373.1:1292252..130602643048.345.36-Nuclear
DcNAC8LOC110114298NW_021319478.1:223003..22763839845.266.68-Nuclear
DcNAC9LOC110106797NW_021320118.1:443972..44602336941.455.96-Nuclear
DcNAC10LOC110104614NW_021319853.1:571176..57391734139.446.68-Nuclear
DcNAC11LOC110107694NW_021319484.1:2340621..234371830033.785.61-Nuclear
DcNAC12LOC110116691NW_021319255.1:789964..79232135739.806.43-Cytoplasmic
DcNAC13LOC110107876NW_021319309.1:5212803..521439526230.185.32-Nuclear, Mitochondrial
DcNAC14LOC110108485NW_021318618.1:1341771..135042125028.568.58-Nuclear
DcNAC15LOC110105195NW_021319341.1:1740160..175352332737.216.73-Mitochondrial, Cytoplasmic
DcNAC16LOC110112974NW_021320019.1:6917562..691871824728.257.66-Mitochondrial, Cytoplasmic
DcNAC17LOC110098358NW_021318618.1:140601..16586867676.216.81-Nuclear
DcNAC18LOC110104359NW_021319405.1:898780..90036231635.496.80-Nuclear
DcNAC19LOC110114553NW_021318619.1:1786474..178931839845.006.55-Nuclear
DcNAC20LOC110107078NW_021345752.1:73081..7645227331.916.07-Cytoplasmic
DcNAC21LOC110103331NW_021318728.1:755755..76210863570.394.681Nuclear, Cytoplasmic
DcNAC22LOC110111768NW_021318693.1:2812812..281440930835.246.04-Nuclear
DcNAC23LOC110110716NW_021319682.1:11969540..1197115831335.857.80-Nuclear
DcNAC24LOC110115981NW_021319056.1:515803..52487123126.846.66-Cytoplasmic
DcNAC25LOC110110725NW_021319746.1:1017210..101903733337.757.65-Nuclear
DcNAC26LOC110107219NW_021318474.1:52459..5423332636.908.48-Nuclear
DcNAC27LOC110095790NW_021318852.1:8686697..868836533836.988.62-Nuclear
DcNAC28LOC110115485NW_021319945.1:1292983..129455526931.455.16-Cytoplasmic
DcNAC29LOC110092932NW_021319682.1:12055658..1205728930034.215.37-Nuclear
DcNAC30LOC110097953NW_021319408.1:90079..9122019822.505.80-Cytoplasmic
DcNAC31LOC110107849NW_021319309.1:5177244..517895233638.096.15-Nuclear, Cytoplasmic
DcNAC32LOC110114255NW_021318952.1:407937..41174756664.695.74-Nuclear
DcNAC33LOC110105798NW_021320118.1:62855..6506533037.906.80-Nuclear
DcNAC34LOC110104809NW_021318693.1:5734624..573843527531.706.32-Nuclear
DcNAC35LOC110102585NW_021319099.1:1124888..112910039244.265.45-Nuclear
DcNAC36LOC110094938NW_021318963.1:481017..48396230234.485.73-Cytoplasmic
DcNAC37LOC114580353NW_021318576.1:1853942..185469428532.936.18-Nuclear
DcNAC38LOC110101656NW_021350263.1:1773..243016819.479.99-Nuclear
DcNAC39LOC110102005NW_021319610.1:706265..7447891065119.245.35-Nuclear
DcNAC40LOC110106875NW_021320142.1:1232496..123944032436.468.76-Nuclear
DcNAC41LOC114578614NW_021412344.1:5..4178810.346.56-Nuclear, Mitochondrial
DcNAC42LOC110115000NW_021319004.1:3740985..374279532036.496.68-Nuclear
DcNAC43LOC110092814NW_021319127.1:4426569..443155530835.876.49-Nuclear
DcNAC44LOC110107435NW_021319315.1:7525933..755101419221.739.531Mitochondrial, Cytoplasmic
DcNAC45LOC110101851NW_021319178.1:14978035..1498365629332.758.37-Nuclear
DcNAC46LOC110100943NW_021319134.1:403956..41018762468.834.841Nuclear, Cytoplasmic
DcNAC47LOC110094901NW_021319875.1:435195..43811231336.626.21-Nuclear
DcNAC48LOC110108674NW_021318516.1:1875800..187776031535.648.60-Nuclear
DcNAC49LOC110092756NW_021319682.1:12023901..1202551833137.668.92-Nuclear
DcNAC50LOC110103097NW_021318927.1:550233..55883138443.037.04-Mitochondrial
DcNAC51LOC110104882NW_021319718.1:578668..59673231435.408.16-Nuclear, Mitochondrial
DcNAC52LOC110098556NW_021586606.1:401626..40299232136.576.06-Nuclear
DcNAC53LOC110112625NW_021318921.1:882187..88493942048.348.92-Cytoplasmic
DcNAC54LOC110107887NW_021319309.1:4726707..472878331336.046.55-Nuclear
DcNAC55LOC110107355NW_021318535.1:1389..246827430.688.20-Nuclear
DcNAC56LOC110112624NW_021318921.1:866825..87167538643.575.45-Nuclear
DcNAC57LOC110100421NW_021356156.1:29165..3120837741.976.60-Nuclear
DcNAC58LOC110116407NW_021319956.1:483041..52532660167.205.771Nuclear
DcNAC59LOC110102675NW_021318663.1:278514..28162524127.239.16-Nuclear, Cytoplasmic
DcNAC60LOC110114310NW_021319478.1:59280..6037022125.279.07-Nuclear
DcNAC61LOC110101259NW_021319682.1:5659051..566205133137.096.27-Cytoplasmic
DcNAC62LOC110108396NW_021319952.1:264477..26643431135.995.54-Nuclear
DcNAC63LOC110097330NW_021319772.1:190444..19467543750.036.151Nuclear
DcNAC64LOC110100119NW_021319284.1:705412..70662421925.009.17-Nuclear
DcNAC65LOC110099898NW_021319550.1:257520..27033853960.664.50-Nuclear
DcNAC66LOC110097190NW_021319315.1:4053808..406258460267.384.781Nuclear, Cytoplasmic
DcNAC67LOC110114311NW_021319478.1:78155..7897323626.546.25-Endoplasmic reticulum Mitochondrial
DcNAC68LOC110114265NW_021318952.1:398944..40245023627.244.94-Nuclear
DcNAC69LOC110105590NW_021319523.1:2753877..276180638643.354.73-Nuclear
DcNAC70LOC110104365NW_021319405.1:957135..95890331936.165.63-Cytoplasmic
DcNAC71LOC110095285NW_021318596.1:516144..52040526430.495.94-Nuclear
DcNAC72LOC110104495NW_021318542.1:456982..47037233739.315.45-Nuclear
DcNAC73LOC110092252NW_021319862.1:754733..76029942447.336.63-Nuclear
DcNAC74LOC110100951NW_021319134.1:429429..43352261968.614.861Nuclear, Cytoplasmic
DcNAC75LOC110110098NW_021473832.1:229827..23215933137.785.78-Nuclear
DcNAC76LOC110104101NW_021319154.1:640611..64242232637.448.80-Nuclear
DcNAC77LOC110104023NW_021319309.1:351852..35364229734.279.02-Nuclear
DcNAC78LOC110098637NW_021319551.1:1686647..168851730233.688.83-Nuclear
DcNAC79LOC110111459NW_021319876.1:468565..46977324628.256.01-Nuclear, Mitochondrial
DcNAC80LOC110099650NW_021318496.1:315052..34385737942.024.90-Nuclear
DcNAC81LOC110112020NW_021319961.1:27508..2879215618.009.76-Nuclear, Mitochondrial
DcNAC82LOC110104089NW_021319154.1:989262..99107235240.805.09-Nuclear, Cytoplasmic
DcNAC83LOC110110797NW_021441140.1:128927..14459866776.336.46-Nuclear
DcNAC84LOC110092208NW_021319083.1:5535325..553635320523.188.74-Nuclear
DcNAC85LOC110116607NW_021404996.1:183594..18675028432.236.90-Nuclear, Cytoplasmic
DcNAC86LOC114579126NW_021318625.1:16861..1781717219.315.53-Nuclear
DcNAC87LOC110107637NW_021319168.1:1236367..124114328633.757.63-Nuclear
DcNAC88LOC110111207NW_021516239.1:66394..6756519522.134.97-Cytoplasmic
DcNAC89LOC110107480NW_021319567.1:739642..74173629934.425.23-Nuclear
DcNAC90LOC110111452NW_021319876.1:524351..52573834539.426.32-Nuclear
Publisher’s Note: MDPI stays neutral with regard to jurisdictional claims in published maps and institutional affiliations.