Article

Bacillus velezensis Associated with Organomineral Fertilizer and Reduced Phosphate Doses Improves Soil Microbial—Chemical Properties and Biomass of Sugarcane

by
Hariane Luiz Santos
,
Gustavo Ferreira da Silva
,
Melina Rodrigues Alves Carnietto
,
Laura Costa Oliveira
,
Carlos Henrique de Castro Nogueira
and
Marcelo de Almeida Silva
*
Laboratory of Ecophysiology Applied to Agriculture (LECA), School of Agricultural Sciences, UNESP—Sao Paulo State University, Botucatu 18610-034, SP, Brazil
*
Author to whom correspondence should be addressed.
Agronomy 2022, 12(11), 2701; https://doi.org/10.3390/agronomy12112701
Submission received: 30 September 2022 / Revised: 23 October 2022 / Accepted: 26 October 2022 / Published: 31 October 2022
(This article belongs to the Section Soil and Plant Nutrition)

Abstract

:
Appropriately using phosphorus (P) for the fertilization of sugarcane is critical to achieving high productivity because it is one of the most limiting nutrients in agricultural cropping systems. Thus, the objective of this research was to evaluate the morphological, biochemical, and yield responses of sugarcane, and the soil microbial–chemical properties, under the use of organomineral fertilizer (OF) associated or not with Bacillus velezensis strain UFV 3918 (B) combined with mono ammonium phosphate (MAP) doses. The experimental design used was completely randomized, consisting of eight treatments [Control (3/3 MAP); OF (without MAP); OF + 1/3 MAP; OF + 2/3 MAP; OF + 3/3 MAP; B + OF + 1/3 MAP; B + OF + 2/3 MAP; B + OF + 3/3 MAP] and four replicates. B + OF + 1/3 MAP provided increases in accumulated soil basal respiration (11.9%), carbon of microbial biomass (35.9%), fluorescein diacetate (12.7%), arylsulfatase (25.5%), and acid phosphatase (10.1%) activity compared to the control, which implied in higher shoot and total biomass. These results present a potential strategy for sugarcane fertilization, using bacteria in combination with OF to improve P nutrition and growth in sugarcane with reduced economic and environmental impact.

1. Introduction

Brazil is the world’s largest producer of sugarcane, and due to the excellent yield potential, with large areas of arable and favorable edaphoclimatic conditions, Brazil has become one essential country for supplying the increased world demand for sugar and ethanol from renewable sources [1,2]. The estimated sugarcane yield in Brazil in the 2022/23 crop season is 596.1 million tons [3].
Fertilization is one of the most critical factors in achieving high productivity. It is essential to study fertilization management, mainly with phosphorus (P), one of the most limiting nutrients in agricultural cropping systems [4]. Phosphorus is indispensable for plant growth and reproduction, which does not reach the maximum productive potential without an adequate nutritional supply [5].
The importance of P consists of the fact that this nutrient participates, directly and indirectly, in processes such as cell division, photosynthesis, respiration, storage, and transfer of energy, which makes it essential for good initial formation and the development of the root system, and adequate sprouting and tillering, influencing stalk productivity, technological quality, and longevity of sugarcane field [6,7].
However, P has been the nutrient most critical in fertilization in recent years in Brazil due to its high interaction with the soil and high retention rate of its ions [8,9]. Most of the soluble phosphate fertilizers applied to the soil dissolve and remain retained in the solid phase because the minerals of Fe and Al absorb P, and both decrease the availability of P for plant growth [10,11,12,13].
In addition to meeting the demand for P during plant development, studies have shown that some microorganisms [14] and organomineral fertilizers [9] can improve the efficiency of P use in the soil–plant system [15]. Thus, in addition to the excellent P supply favoring photosynthetic activity and increasing plant biomass, studies show that inoculation with bacteria [16,17] and the use of organomineral fertilizers [9,18] favor crop growth and productivity.
Phosphate-solubilizing bacteria release metabolites that solubilize inorganic P and mineralize organic P, transforming this nutrient into an available form for plant uptake and stimulating its development [19]. Bacteria of the genus Bacillus are examples of abundant microorganisms in the rhizosphere and promising as phosphate solubilizers [20].
Soil microbial communities perform essential processes during the decomposition of organic matter and nutrient solubilization, influencing the crop’s productivity [21]. The activity of these communities in the soil can be evaluated to understand the mechanisms of action of bacteria in P solubilization. These evaluations can be undertaken using microbiological indicators, the activity of enzymes linked to biogeochemical cycles of nutrients, and the activity of enzymes of bacteria intracellular metabolism [22].
In this context, the objective of this research was to evaluate the morphological, biochemical, and yield responses of sugarcane until 180 days after planting and the cultivation of soil microbial–chemical properties, under the use of organomineral fertilizer associated or not with the Bacillus velezensis strain UFV 3918 combined with mono ammonium phosphate (MAP) doses.
We hypothesized that the association of organomineral fertilizer with Bacillus velezensis UFV 3918 would allow for reducing MAP doses without harming biomass production and promoting improvements in soil quality.

2. Materials and Methods

2.1. Cultivation Conditions, Experimental Design, Plant Material, and Treatments

The experiment was conducted for six months in a protected environment in the Department of Crop Production of the School of Agricultural Sciences—FCA/UNESP, located in Botucatu (22°51′01″ S, 48°25′55″ W, 786 m asl), Sao Paulo, Brazil. The protected environment was a wooden structure with galvanized steel arches. It had a high ceiling of 3 m and a total area of 120 m2, with anti-aphid fabric (2 mm diameter) on the sides and a transparent plastic roof (150 µm diameter).
According to the Thornthwaite methodology, the region’s climate is characterized as B2rB′3a′, which describes a humid climate with a low water deficit in April, July, and August. The climate is also mesothermal and has a water potential evapotranspiration concentration of 33% in the summer. The annual average rainfall is 1428.4 mm, and the air temperature is 20.3 °C [23]. The soil used was classified as dystrophic Red Latosol [24]. The granulometric analysis showed 68.2% of sand, 25.7% of clay, and 6.1% of silt, characterizing a medium textured soil, according to the texture class grouping triangle [24].
The RB966928 cultivar was used because it is the most planted sugarcane cultivar in Brazil, accounting for 17.7% of the cultivated area in Sao Paulo [25]. In addition, this cultivar has a high development speed, medium stem density, high tillering index, high productivity, and high resistance to diseases.
The treatments were composed of three commercial products, a solid and branny P-based fertilizer (MAP) containing 60% of P soluble in neutral ammonium citrate and 12% of nitrogen (N); a solid and branny organomineral fertilizer (OF) constituted of 4.04% of organic carbon, 0.78% of hydrogen, 0.39% of N, 175 mg dm−3 of P, 3.5 mmolc dm−3 of potassium, 50 mmolc dm−3 of calcium, 15 mmolc dm−3 of magnesium, 96.17 mg dm−3 of sulfur, 5.30 mg dm−3 of boron, 0.8 mg dm−3 of iron, 16.9 mg dm−3 of manganese, and 12.5 mg dm−3 of zinc, with a recommended dose of 500 kg ha−1 (11.27 g pot−1); and a microbiological one containing 7 g L−1 of the active ingredient Bacillus velezensis strain UFV 3918 (B), with a minimum of 1.0 × 10⁸ colony forming units (CFU) mL−1, with a recommended dose of 2 L ha−1.
The experimental design used was completely randomized, consisting of eight treatments [Control (recommended dose of MAP—3/3 MAP); OF (without MAP); OF + 1/3 MAP; OF + 2/3 MAP; OF + 3/3 MAP; B + OF + 1/3 MAP; B + OF + 2/3 MAP; B + OF + 3/3 MAP] and four replicates.
To minimize the varietal effect on the sprouting, planting was carried out using buds with an average length of 5 cm and an average diameter of 2 cm, of the same age and good sanitary aspect. Five buds were sowing per pot, and after the sprouting stabilization, the thinning took place, keeping only one bud per pot.
Each plot was composed of 50-L pots containing 45 dm3 of soil, corrected based on the chemical analysis according to Vitti et al. [26] and following the doses of phosphate fertilization with MAP required by the treatments (Table 1). For sugarcane, it is recommended to use 30 to 60 kg ha−1 N in coverage before stalk formation, with higher doses in more clayey soils [24]. Thus, the cover fertilization with urea was performed at the amount of 66.6 kg ha−1 (30 kg ha−1 N).
The planting was performed on 12 November 2020. The mineral and organomineral fertilizers were added to the soil at the planting time. For the bacteria inoculation, a solution composed of 75 mL of water at pH 7.0 and 2 mL of the commercial product containing an isolate of B. velezensis UFV 3918 (108 CFU mL−1) was applied per pot. The buds were positioned at 2 cm depth, and each bud of treatments containing bacteria received 15.4 mL of this solution. In contrast, the buds of the other treatments received 15.4 mL of water. In the end, all were covered with soil.

2.2. Morphological Variables

The sprouting assessments were performed every day from the first bud to sprouting stabilization. The final number of sprouted buds per pot was transformed into a percentage. Additionally, the sprouting speed (SS) and the sprouting speed index (SSI) were calculated according to Equations (1) and (2), respectively, proposed by Maguire [27].
The SS equation is as follows:
SS = [ ( N 1   S 1 ) + ( N 2   S 2 ) + + ( Nn   Sn ) ] ( S 1 + S 2 + + Sn )
where SS is the sprouting speed (days), S is the number of sprouts observed in each count, and N is the number of days from planting to each count.
The SSI equation is as follows:
SSI = S 1 N 1 + S 2 N 2 + S 3 N 3 + + Sn Nn
where SSI is the sprouting speed index, Sn is the number of sprouts observed in the “n” counts, and Nn is the number of days from planting to the “n” counts.
The evaluations of the number of tillers (NT), stalk height (SH), stalk diameter (SD), and leaf area (LA) were performed at 30, 60, 90, 120, 150, and 180 days after planting (DAP). The NT was determined by counting the tillers present in the usable area of each pot. SH was determined using a tape measure, and the measurement was taken from the ground to the +1 leaf sheath insertion. The SD was determined using a digital caliper (MeterMall, 150 mm and 0.1 mm reading, Marysville, OH, USA), and the measurements were performed in the middle third of the plant. Additionally, the LA was calculated according to Equation 3, proposed by Hermann and Câmara [28], using measurements of the width and length of the middle part of the +3 leaf.
The LA equation is as follows:
LA = L × W × 0.75 × ( N + 2 )
where L is the length of +3 leaf, W is the width, 0.75 is the crop correction factor, and N is the number of open leaves with at least 20% green area.

2.3. Foliar Biochemical Variables

One week before harvest, the +1 leaves were collected and stored in liquid nitrogen immediately upon collection and were then stored in a −80 °C ultra freezer (NUAIRE Inc., NU-9668GC, Plymouth, MN, USA) until analysis.
The soluble protein content was determined in 100 mg leaf tissue samples, which had been macerated in liquid nitrogen and added to a homogenization medium containing 0.1 M potassium phosphate buffer (pH 6.8), 0.1 mM ethylenediamine-tetraacetic acid (EDTA), 1 mM phenylmethylsulfonyl fluoride (PMSF), and 200 mg of polyvinylpyrrolidone (PVPP) for extraction. The tissue homogenates were centrifuged at 5000× g at 4 °C for 10 min, and then the supernatants were used as crude extracts. Then, 10 μL aliquot of crude extract was added to 5 mL of Coomassie Brilliant Blue G-250 solution. After 15 min, the readings were performed in a spectrophotometer (Shimadzu, UV-2700, Kyoto, Japan) at 595 nm. The soluble protein concentrations were calculated based on the standard curve of bovine serum albumin (BSA) at 1 mg mL−1, and the results were expressed in mg g−1 of fresh matter (FM) [29].
The soluble sugars were determined through 20 mg of freeze-dried leaf tissue samples, using 4 mL of deionized water for the extraction. The mixture was stirred for one hour, then the samples were centrifuged at 3000× g for 15 min, and the supernatant was collected. The supernatant was centrifuged at 6000× g for 10 min, and this extract was used to determine the soluble sugars using the methodology of Dubois et al. [30]. An aliquot of 0.5 mL of the solution, 0.5 mL of 5% phenol, and 2.5 mL of sulfuric acid were placed in test tubes, followed by stirring, cooling, and color fixation in trays containing ice. The readings were performed in a spectrophotometer (Shimadzu, UV-2700, Kyoto, Japan) at 490 nm. The results were expressed in mg g−1 FM−1.
The determination of the total amino acids was performed using freeze-dried leaf tissue samples, homogenized in 0.2 M sodium citrate buffer (pH 5.0), 5% ninhydrin, 0.0002 M potassium cyanide, and 60% ethanol (v/v) for the extraction of the total amino acids. The absorbance was analyzed in a spectrophotometer (Shimadzu, UV-2700, Kyoto, Japan) at 570 nm, and the results were compared with the glycine standard curve (0.1–1.0 μmol mL−1) [31]. The results were expressed in μmol g−1 FM−1.
The acid phosphatase activity was determined in 500 mg leaf tissue samples, which had been macerated in liquid nitrogen and added to a homogenization medium containing 0.1 mol L−1 sodium acetate buffer (pH 5.6) for extraction. The tissue homogenates were centrifuged at 15,000× g at 4 °C for 20 min, and then the supernatants were used as crude extracts. The reaction was initiated by incubating 500 µL of enzyme extract with 200 µL of substrate [2 mmol L−1 of disodium p-nitrophenyl phosphate (pNPP) and 150 mmol L−1 of sodium acetate buffer (pH 5.6)] for five minutes at 37 °C and interrupted by the addition of 300 µL of saturated Na2CO3 solution. After mixing by stirring, the absorbance was determined in a spectrophotometer (Shimadzu, UV-2700, Kyoto, Japan) at 400 nm [32]. The enzyme activity was expressed in nmol pNPP min−1 mg−1 protein.

2.4. Microbiological Variables

The soil samples for the microbiological variables were collected after the sugarcane harvest and stored in a −10 °C freezer until analysis.
Soil basal respiration (SBR) was measured by determining the C-CO2 released, according to Silva et al. [33], by static incubation of 50 g of soil in airtight glasses at 25 °C (BOD). The C-CO2 was analyzed at 3, 7, 14, and 21 days after installation in 10 mL of 1 mol L−1 NaOH solution, which was titrated with HCl after adding Ba(OH)2 for the precipitation of carbonates. The released C-CO2 was expressed as µg C-CO2 g−1 dry soil for 21 days and as µg C-CO2 g−1 dry soil per day.
Carbon (CMB) and nitrogen (NMB) of the microbial biomass were determined by the irradiation-extraction method [34,35]. For carbon, K2SO4 0.5 mol L−1 was used as the extracting agent. The extracts’ organic carbon (C) was estimated by oxidation with K2Cr2O7. The difference in C concentration between irradiated and non-irradiated samples of the extracts was expressed as CMB by multiplying a conversion factor (Kc) of 0.33 [35]. The results were expressed as µg C g−1 soil.
N extraction was performed with 60 mL of 0.5 mol L−1 K2SO4 (pH 6.8) in a shaker with horizontal circular motion (Quimis Inc., Q225M22, Diadema, SP, Brazil) at 150 rpm for 40 min. After decantation, aliquots of 20 mL were removed and transferred to glass tubes, followed by the addition of 3 mL of concentrated H2SO4 and 1 g of catalyst (mixture of K2SO4, CuSO4, and selenium powder in a ratio of 1:0.1:0.01). The digestion was carried out at 160 °C for 2 h, then raising the temperature to 350 °C for 1 h. The distillation was performed with 20 mL of 400 g L−1 NaOH and the distillate was collected in a 50 mL Falcon tube containing 10 mL of 20 g L−1 H3BO3. Then, 15 mL of 0.1% bromocresol green in an alcoholic medium, 6 mL of 0.1% methyl red in an alcoholic medium, and three drops of 0.1 N sodium hydroxide were added, followed by titration with 0.0025 mol L−1 H2SO4. The difference in the N concentration between the irradiated and non-irradiated samples of the extracts was expressed as NMB by multiplying a factor (KN) of 0.54 [35]. The results were expressed in µg N g−1 soil.

2.5. Soil Biochemical Variables

After the sugarcane harvest, the soil samples were collected and stored in a −10 °C freezer until analysis.
The catalytic enzyme activity (intra and extracellular) was estimated by the hydrolysis of fluorescein diacetate (FDA), as proposed by Green et al. [36]. The FDA activity was determined by adding 1 g of soil, 5 mL of potassium phosphate buffer (pH 7.6), and 0.2 mL of the substrate (fluorescein diacetate). The samples were incubated at 30 °C for 1 h. Then, fluorescein was extracted with 25 mL of chloroform–methanol solution (2:1). The product formed was sodium fluorescein, and the samples’ quantification was performed on a standard curve. The absorbance was analyzed in a spectrophotometer (ThermoFisher Scientific, BioMate™3, Waltham, MA, USA) at 490 nm, and the results were expressed in µg FDA g−1 dry soil h−1.
The dehydrogenase enzyme was determined according to the method of Mersi and Schinner [37]. In a 50 mL falcon tube containing 1 g of soil, 1.5 mL of hydroxymethyl aminomethane buffer (TRIS, 1 mol L−1, pH 7.5), and 2 mL of INT substrate (2-p-iodophenyl-3-p-nitrophenyl-5-phenyltetrazolium, 4.4 mmol L−1) were added. Then, the samples were stirred and incubated at 40 °C for 5 h. The product of the enzymatic activity (INTF, iodo-nitrophenylformazan) was extracted by adding 10 mL of ethanol-dimethylformamide solution (1:1), and the samples were kept in the dark for 20 min. A 2 mL aliquot of the supernatant was collected and centrifuged at 5000× g for 10 min. The absorbance was analyzed in a spectrophotometer (ThermoFisher Scientific, BioMate™3, Waltham, MA, USA) at 490 nm, and the results were expressed in μg INTF g−1 soil h−1.
The urease activity was determined according to the modified methodology of Kandeler and Gerber [38]. In a Falcon tube containing 1 g of soil, 4 mL of citrate buffer (pH 6.7) and 1 mL of 10% urea solution as substrate were added. The samples were incubated at 37 °C for 2 h. The product formed was the released N-NH4, determined in a spectrophotometer (ThermoFisher Scientific, BioMate™3, Waltham, MA, USA) at 600 nm by the commercial Urea 500® kit (Doles Inc., Goiania, GO, Brazil). The results were expressed as µg N-NH4 g−1 dry soil h−1.
The extracellular activity of the β-glycosidase enzyme was determined according to Eivazi and Tabatabai [39]. The β-glycosidase was measured after incubating 1 g of soil with 1 mL of the substrate PNPG (p-nitrophenyl-β-D-glucopyranoside, 4.2 mmol L−1) and 4 mL of modified universal buffer (MUB, pH 6.0) at 37 °C for 1 h. Then, 1 mL CaCl2 (1 mol L−1) and 4 mL NaOH (1 mol L−1) were added. A 2 mL aliquot of the supernatant was collected and centrifuged at 5000× g for 10 min. The reaction product (p-nitrophenyl—PNP) was determined in a spectrophotometer (ThermoFisher Scientific, BioMate™3, Waltham, MA, USA) at 410 nm. The results were expressed as µg PNP g−1 dry soil h−1.
The activity of arylsulfatase was performed in the same way as β-glycosidase by replacing the synthetic substrate with 0.05 mol L−1 p-nitrophenyl-sulfate in sodium acetate buffer (pH 5.8). The results were expressed as µg PNP g−1 dry soil h−1.
The acid phosphatase activity was evaluated by the release of PNP from the synthetic substrate p-nitrophenyl phosphate (2.4 mmol L−1), using a MUB (pH 6.0), as described by Tabatabai and Bremner [40]. In a 50 mL falcon tube, 1 g of soil, 4 mL of MUB, and 1 mL of substrate were added. The samples were incubated at 37 °C for 1 h. After, 1 mL of CaCl2 (1 mol L−1) and 4 mL of NaOH (1 mol L−1) were added, followed by hand stirring. A 2 mL aliquot of the supernatant was centrifuged at 5000× g for 10 min. The released PNP was determined in a spectrophotometer (ThermoFisher Scientific, BioMate™3, Waltham, MA, USA) at 405 nm. The results were expressed as µg PNP g−1 dry soil h−1.

2.6. Harvest and Yield Variables

At 180 DAP, the plants were harvested to analyze the yield. Initially, the plants were separated into leaves (leaf sheath + leaf), stalks, and roots, followed by the evaluation of SH and SD. To obtain biomass production, the plant parts were kept in a forced air circulation oven at 65 °C until they reached a constant mass and then weighed on a balance (Balmak, ELC−6/15/30, Santa Barbara d’Oeste, SP, Brazil). The shoot (leaves + stalks) (SB), root (RB), and total (shoot + root) (TB) biomass were determined in units of g pot−1.

2.7. Statistical Analysis

The data were subjected to analysis of variance (ANOVA) with the F test, with a subsequent comparison of means using the Tukey test (p ≤ 0.05) through the statistical software AgroEstat (AgroEstat, version 2015, Jaboticabal, SP, Brazil). The biometric data were submitted to regression adjustment throughout the evaluation periods to evaluate the behavior of the treatments using Minitab software (Minitab®, version 19, State College, PA, USA).
Additionally, all of the other variables were submitted to regression adjustment considering the doses of MAP associated with organomineral fertilizer (OF, OF + 1/3 MAP, OF + 2/3 MAP, and OF + 3/3 MAP) and organomineral fertilizer + B. velezensis (OF, B + OF + 1/3 MAP, B + OF + 2/3 MAP, and B + OF + 3/3 MAP), through the Minitab software (Minitab®, version 19, State College, PA, USA).

3. Results

3.1. Environmental Conditions during the Experiment

During the experiment, the air temperature within the protected environment ranged from 12.5 to 32.0 °C, with an average of 21.2 °C, 22.4 °C, 23.4 °C, 21.9 °C, 21.6 °C, 21.7 °C, 19.2 °C, and 18.0 °C during planting, 1st biometric evaluation (BE), 2nd BE, 3rd BE, 4th BE, 5th BE, 6th BE, and harvest, respectively (Figure 1). The relative humidity ranged from 60.4 to 88.1% throughout the cultivation cycle, with an average of 76.5%, 76.7%, 86.4%, 69.7%, 82.9%, 66.0%, 70.9%, and 75.6% during planting, 1st BE, 2nd BE, 3rd BE, 4th BE, 5th BE, 6th BE, and harvest, respectively (Figure 1).

3.2. Morphological Analysis

Generally, % sprouting was not uniform; the control and B + OF + 1/3 MAP provided the highest values (Figure 2a). The single-use of OF showed that sprouting increased as the MAP doses increased. In contrast, the sprouting decreased as the MAP doses increased with B + OF. It suggests that B + OF was more efficient under lower doses of MAP, showing P solubilization potential because the soil had high P content (Table 1). OF + maximum dose of MAP provided the highest %sprouting (0.99*), but B + OF + MAP doses had no regression adjustment (Figure 2a).
There was no difference between the treatments for SS, which demonstrates that the use of Bacillus and OF did not affect the average number of days required for sprouting (Figure 2b). Additionally, 3/3 MAP showed the highest SSI, followed by OF + 3/3 MAP, evidencing a higher average number of sprouted buds per day (Figure 2c). There was a tendency for SSI to increase with the application of OF and increasing doses of MAP (0.83*), while there was a tendency for SSI to decrease with inoculation of B + OF and increasing doses of MAP (0.70*).
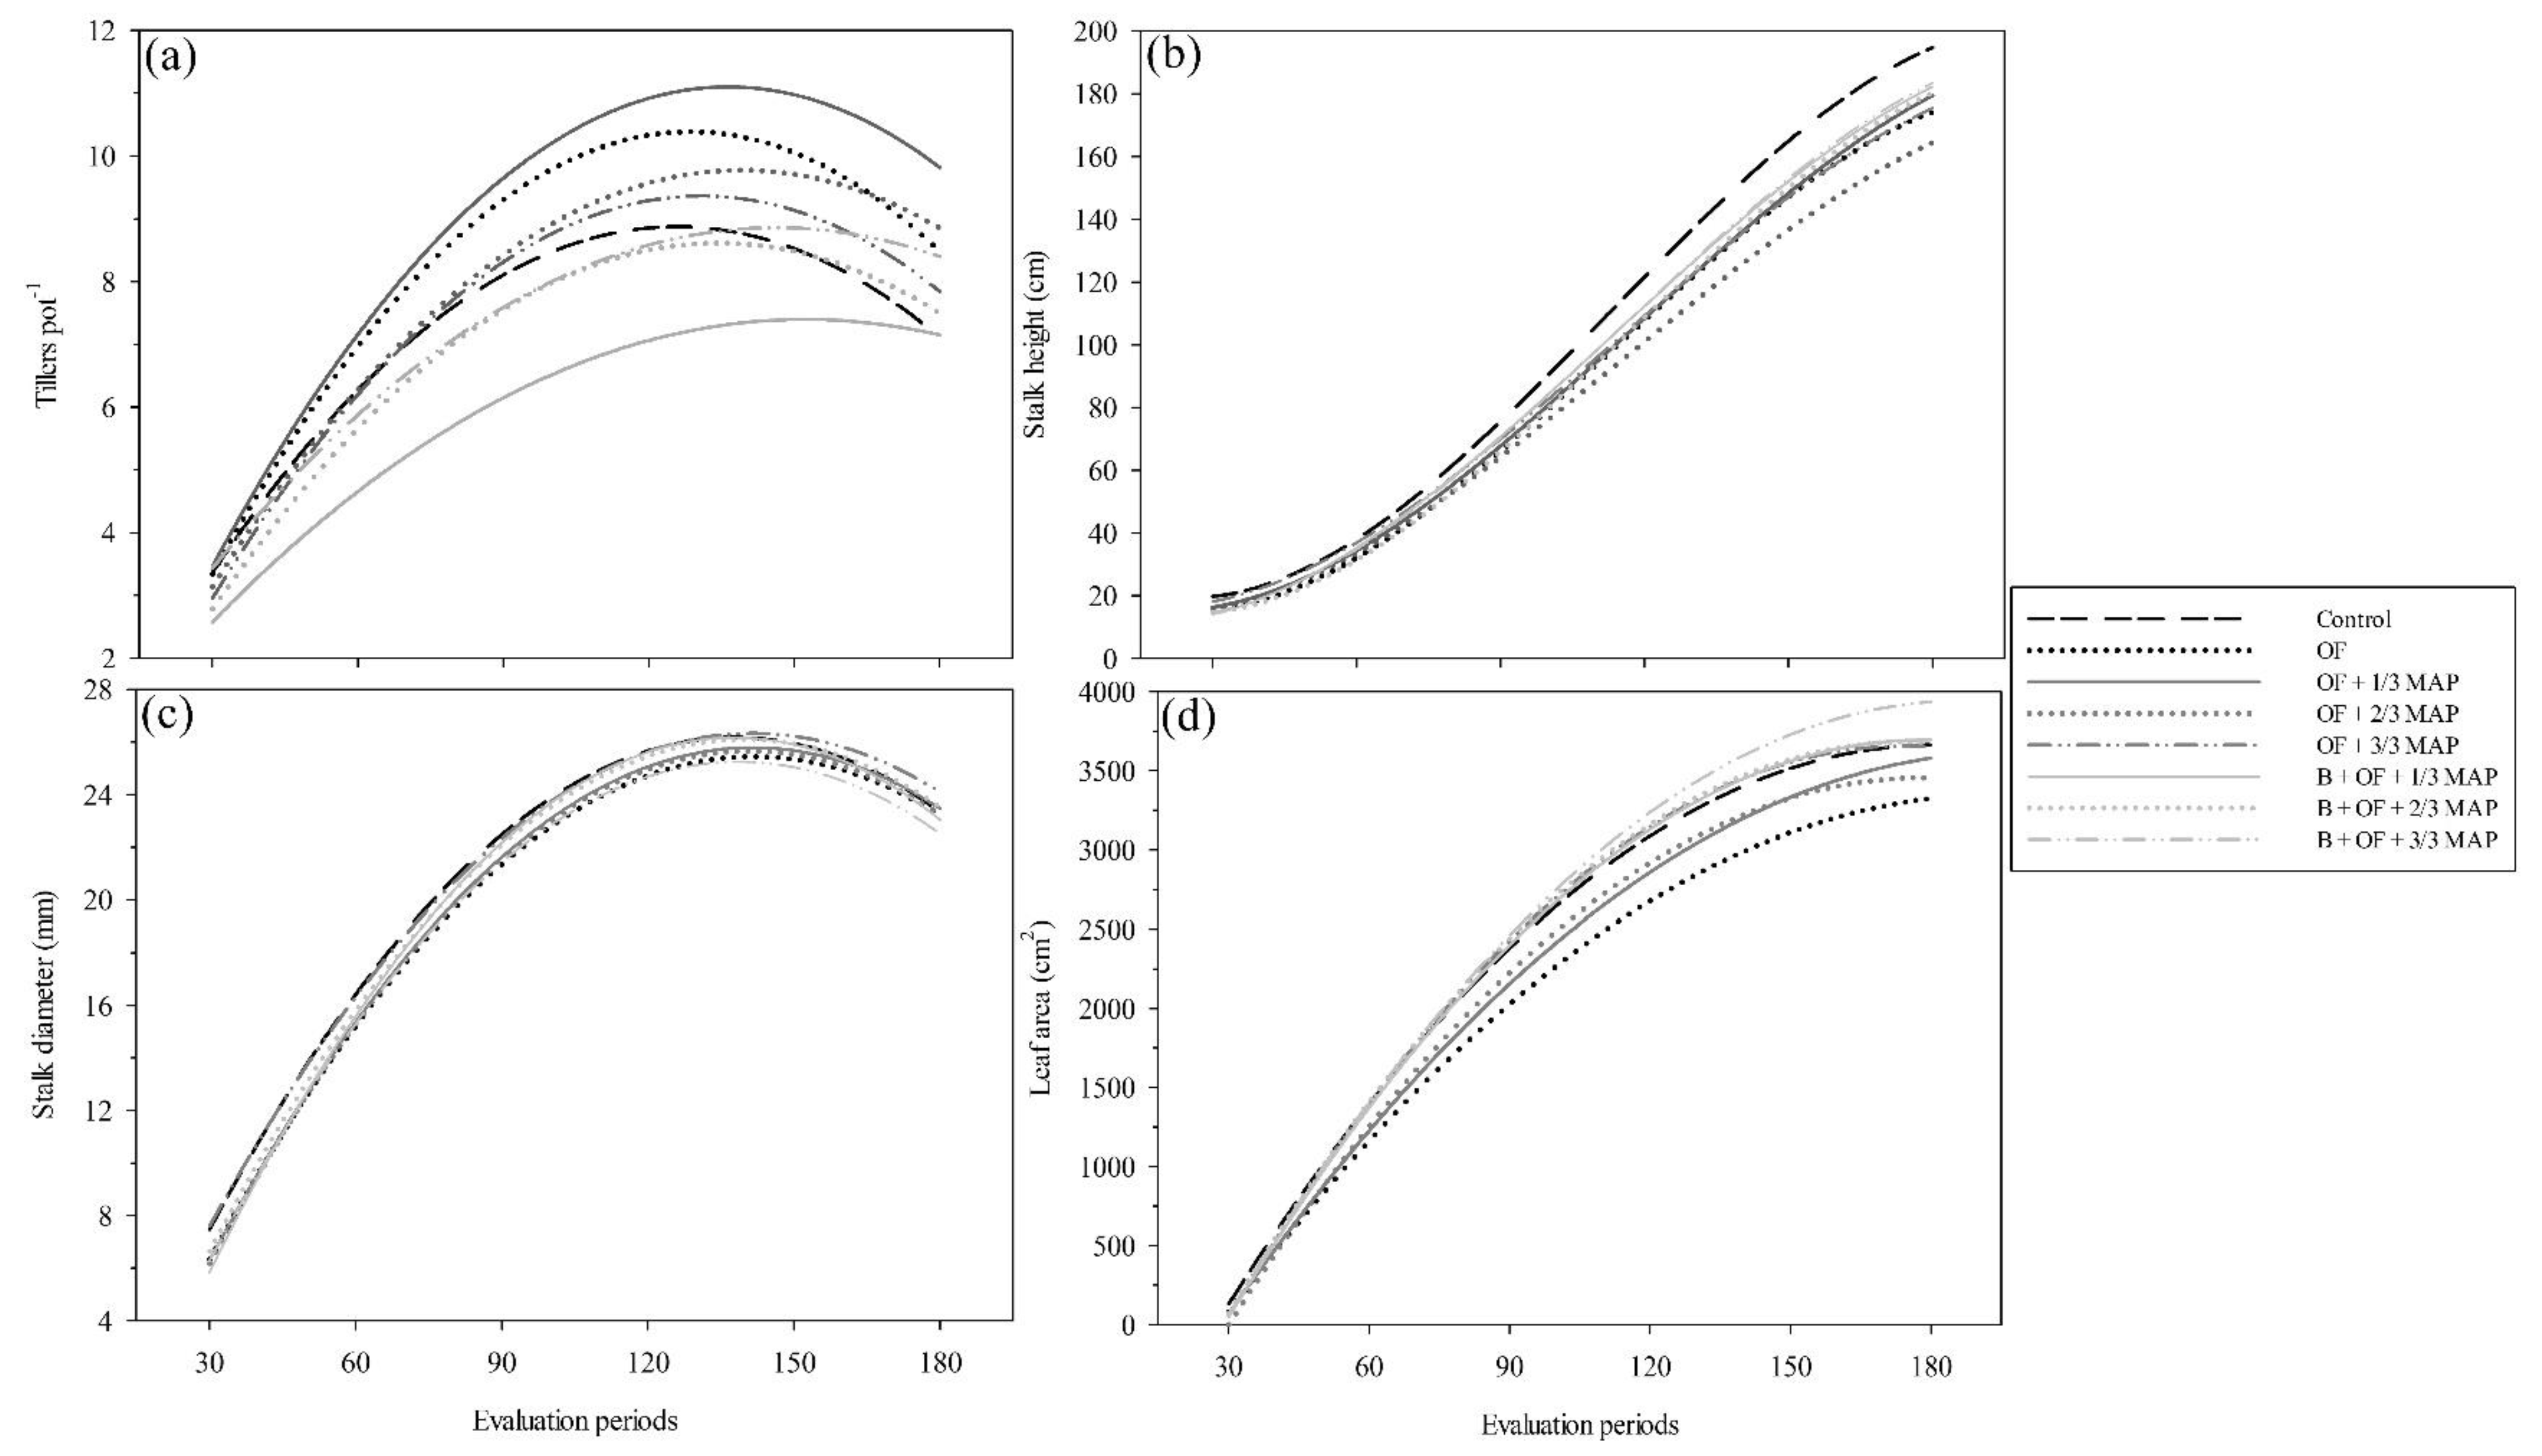
In general, there was an increase in the NT from 30 DAP to 120 DAP in the control; OF; OF + 1/3 MAP, 2/3 MAP, and 3/3 MAP; and OF + B + 2/3 MAP, followed by a sharp decrease in values. This may have occurred due to the reduction in mean temperature from the end of March (Figure 1), which negatively affects tillering, as well as by competition and spatial restriction because the stalk elongated and its diameter increased. Whereas B + OF + 1/3 MAP and 3/3 MAP showed lower NT at 30 DAP, followed by increases in NT until 120 DAP and stabilization from this point (Figure 3a).
The control showed the highest SH throughout the evaluation period. Still, the association of B + OF + doses of MAP enabled the average SH to be similar to the control at 180 DAP (Figure 3b).
The behavior of the SD curves was very similar between the treatments (Figure 3c). There was an increase in SD until 150 DAP, followed by a decrease in this variable caused by the end of the tillering phase and beginning of the grand growth phase of the crop, known by the elongation of the stalks and internode spaces and the possible reduction in its diameters.
The LA curves were also similar between the treatments, with increases in LA until 180 DAP without stabilization. Sugarcane grand growth phase of development is marked by the rapid rise in leaf development from the 6th to the 7th month [41,42], favoring the high production of photo-assimilates and the beginning of sucrose accumulation, which explains the highest LA verified at 180 DAP (Figure 3d). The association of B + OF + doses of MAP provided the largest leaf areas.
The equations referring to NT, SH, SD, and LA for each treatment are shown in Table S1.

3.3. Foliar Biochemical Variables

There was no difference between the control and the different doses of MAP associated with OF or B + OF for the protein content (Figure 4a).
The total sugar (TS) content when OF or B + OF were combined increased as the doses of MAP increased. OF + 1/3 or 2/3 MAP and B + OF + 1/3 MAP or 2/3 MAP showed TS similar to the control, while B + OF + 3/3 MAP promoted an increase of 8.6% in this content compared to the control (Figure 4b). B + OF + maximum MAP dose provided the highest TS (0.82*), but OF + MAP doses had no regression adjustment.
The highest total amino acid (TA) contents were observed in the treatments with B + OF. B + OF + 1/3 MAP or 2/3 MAP and B + OF + 3/3 MAP provided increases of 16.2% and 31.2% in TA content, respectively, compared to the control (Figure 4c). OF + MAP doses promoted increases of TA up to 66% of the MAP dose, followed by a decrease in this content with 100% of MAP (0.77*), and B + OF + MAP doses increased the TA as the MAP doses were increased (0.84*).
Regarding the foliar acid phosphatase (AP) activity, B + OF + 1/3 or 2/3 MAP showed the highest enzyme activities, with an average increase of 9.4% compared to the control (Figure 4d). Both OF + MAP doses (0.97*) and B + OF + MAP doses (0.83*) provided increases in AP activity up to 66% of the MAP dose, followed by a decrease in enzyme activity under the use of higher phosphate doses.

3.4. Microbiological Variables

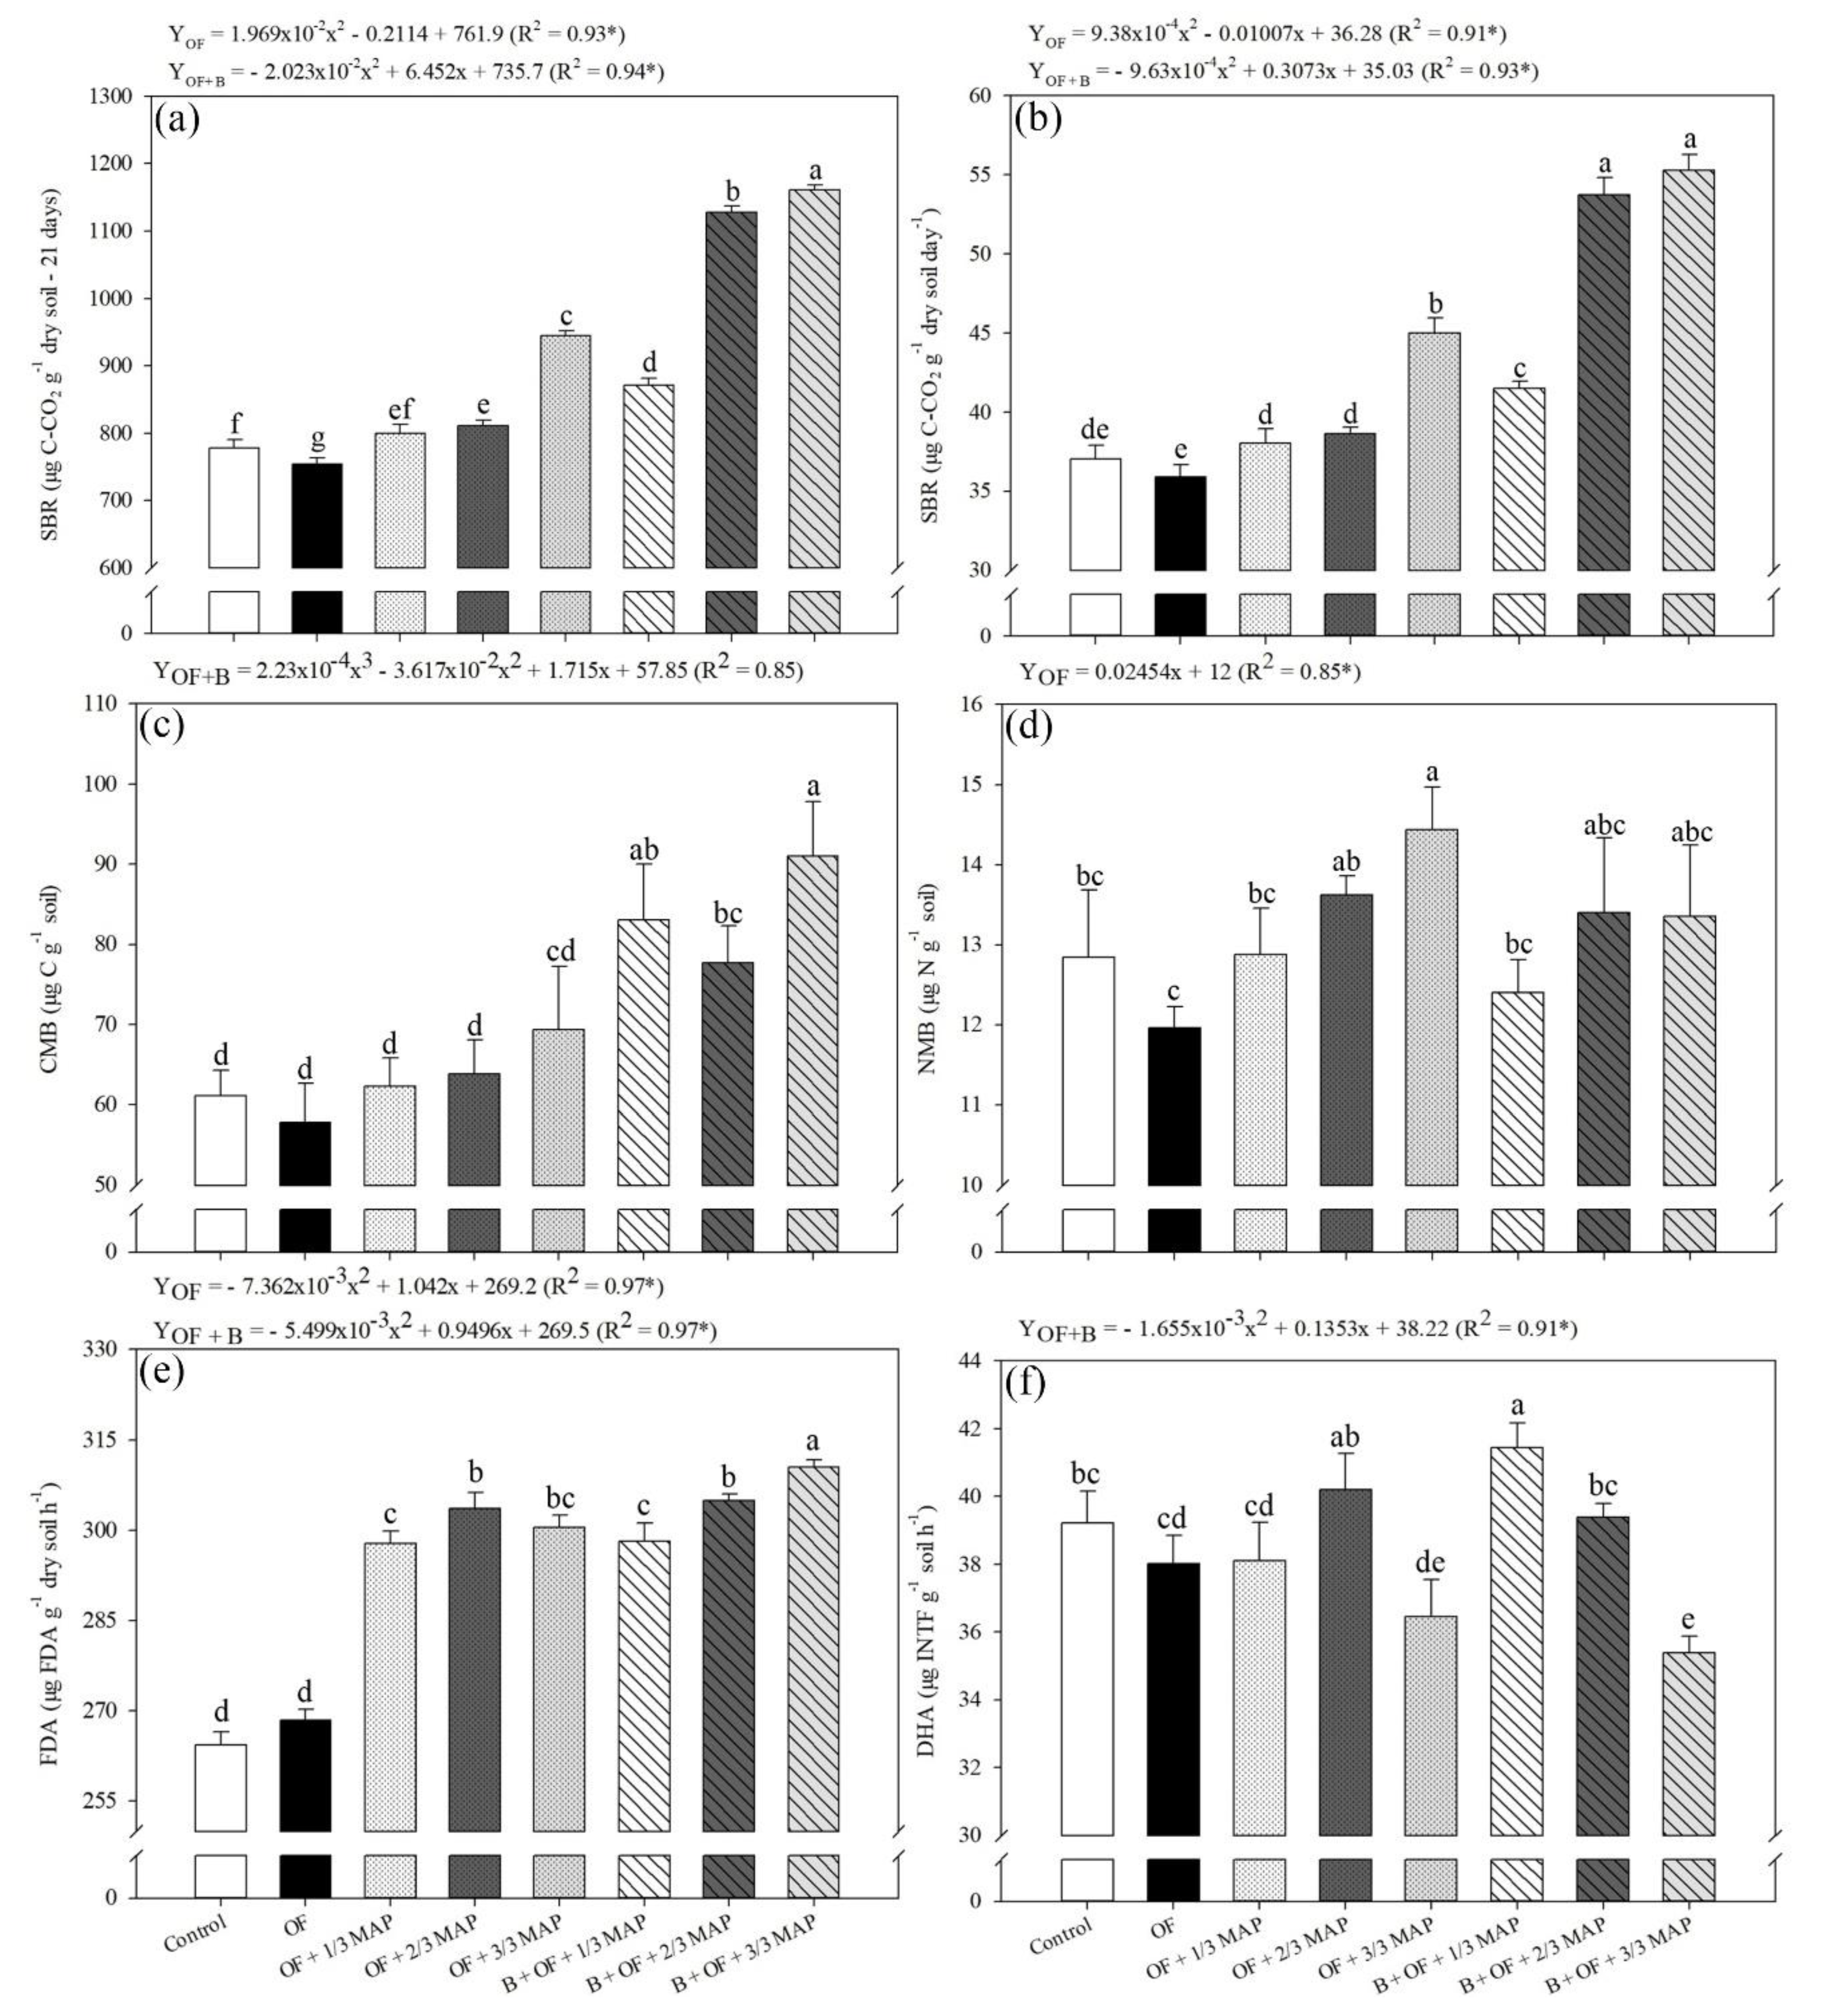
The highest accumulated SBR in 21 days was verified with B + OF + 1/3, 2/3, and 3/3 MAP, which provided increases of 11.9%, 45%, and 49.2%, respectively, compared to the control (Figure 5a). Both OF + MAP doses (0.93*) and B + OF + MAP doses (0.94*) provided increases in SBR up to 100% of the MAP dose, with higher values of SBR verified under the use of B + OF in relation to a single OF.
Considering the SBR per day, OF + 1/3 MAP and OF + 2/3 MAP were similar to each other and equivalent to the control. B + OF + 2/3 MAP and B + OF + 3/3 MAP were similar but showed an average increase of 47.1% in SBR compared to the control (Figure 5b). Both OF + MAP doses (0.91*) and B + OF + MAP doses (0.93*) increased the SBR up to 100% of the MAP dose, but B + OF promoted higher values of SBR per day compared to single OF.
Regarding CMB, OF + all the doses of MAP were similar to the control, while the association of B. velezensis and OF increased the CMB. B + OF + 1/3, 2/3, and 3/3 MAP provided increases of 35.9%, 27.1%, and 48.9%, respectively, in CMB compared to the control (Figure 5c). The optimal dose of B + OF + MAP doses for CMB was 33% of MAP (0.85*) since it provided a CMB similar to 100% of MAP, while OF + MAP doses did not adjust.
OF + 1/3 MAP and OF + 2/3 MAP were similar to the control for NMB, while OF + 3/3 MAP provided an increase of 12.4% in NMB compared to the control (0.85*). On the other hand, B + OF + 1/3, 2/3, or 3/3 MAP were equivalent to each other and similar to the control (Figure 5d).
Regarding FDA, OF and B + OF associated with 1/3 and 2/3 of MAP were equivalent to each other and provided average increases of 12.7% and 15.1%, respectively, compared to the control, while B + OF + 3/3 MAP promoted an increase of 17.5% in FDA compared to the control (Figure 5e). OF + MAP doses (0.97*) provided a rise of FDA up to 66% of the MAP dose, followed by a tendency of decrease with 100% of MAP, while there was an increase in FDA with B + OF up to 100% of the MAP dose (0.97*).
Contrary to that observed for SBR, increasing P doses associated with OF or B + OF reduced the DHA activity. B + OF + 1/3 MAP provided the highest DHA activity, representing an increase of 5.7% compared to the control (Figure 5f). The optimal dose of B + OF + MAP doses for DHA was 33% of MAP (0.91*) because it provided the highest enzymatic activity, while OF + MAP doses did not adjust.

3.5. Soil Biochemical Variables

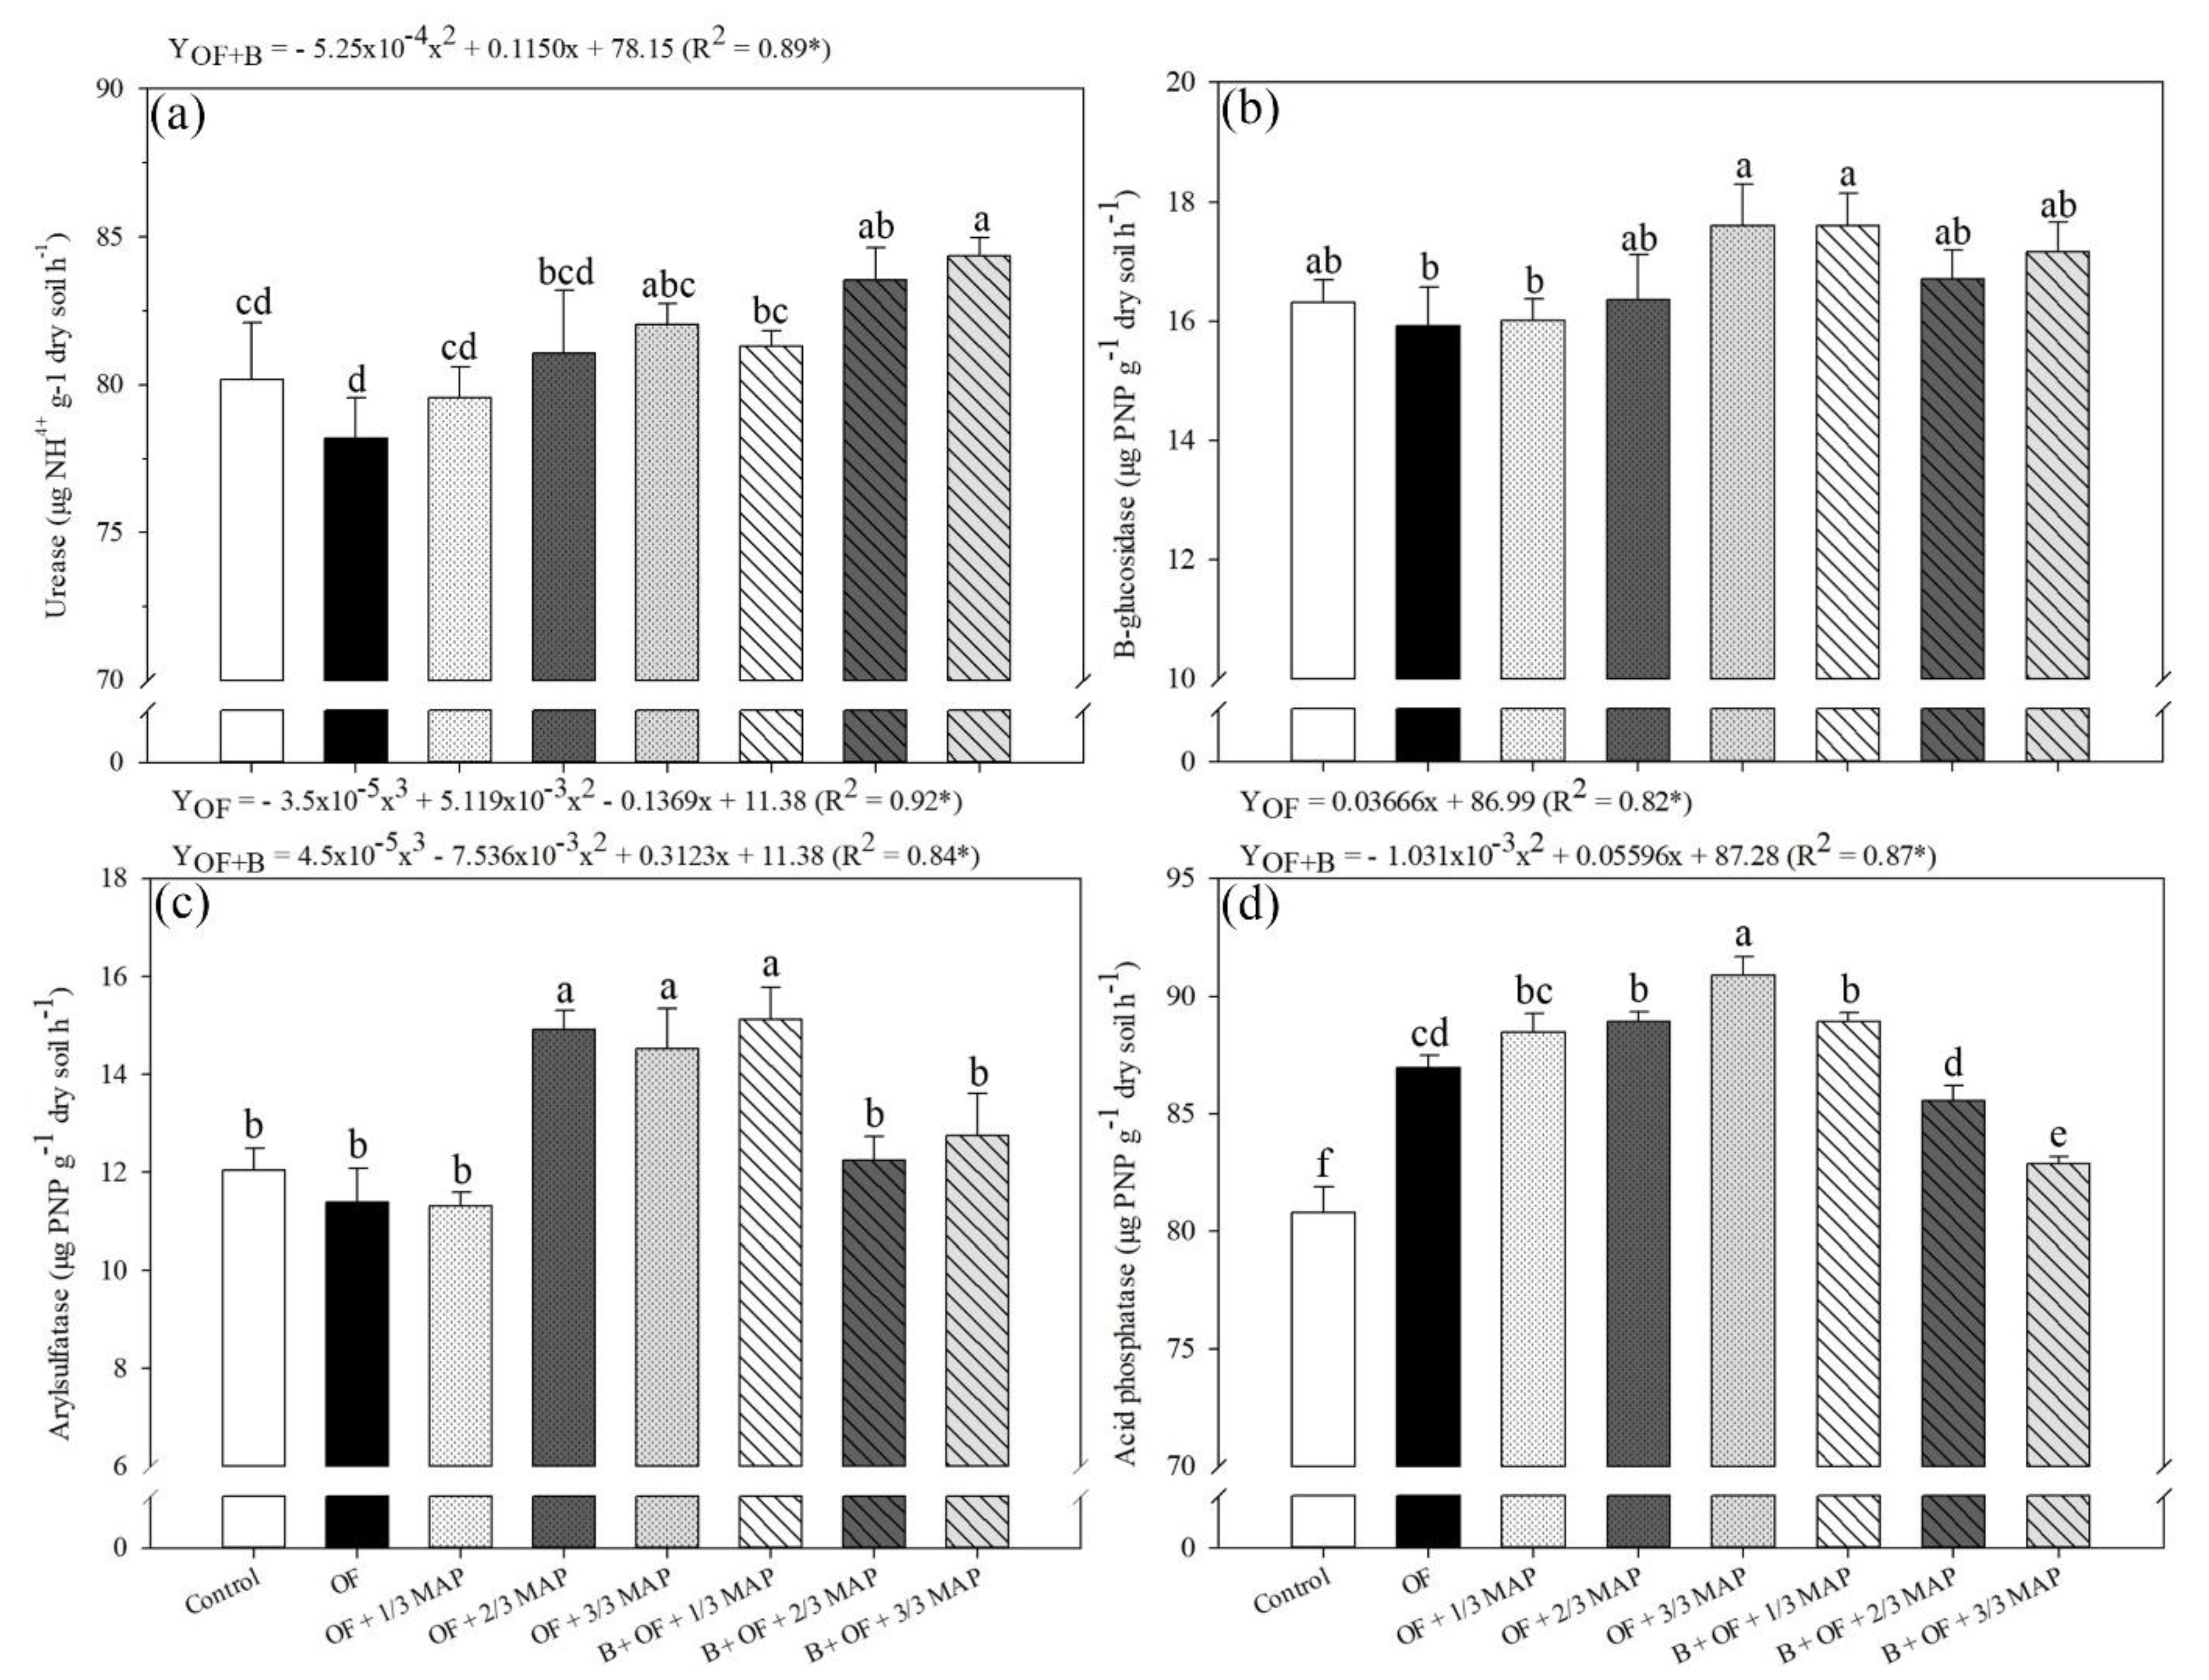
The urease activity verified with B + OF + 1/3 MAP was similar to the control. B + OF + 2/3 and 3/3 MAP provided increases of 4.2% and 5.2% in enzyme activity, respectively, compared to the control (Figure 6a). B + OF + MAP doses (0.89*) increased the urease activity as MAP doses increased, while OF + MAP doses did not adjust.
All the MAP doses associated with OF or B + OF promoted B-glucosidase activity similar to the control (Figure 6b), but there was no adjustment for B-glucosidase data with the use of OF + MAP doses or B + OF + MAP doses.
In general, OF provided increases in arylsulfatase and AP activity as MAP doses increased. At the same time, there was a tendency to decrease these enzymes’ activity as MAP doses increased under B + OF (Figure 6c,d). B + OF + 1/3 MAP provided 25.5% and 10.1% increases in arylsulfatase and AP activity, respectively, compared to the control (Figure 6c,d).
OF + MAP doses (0.92*) increase the arylsulfatase activity until 66% of the MAP dose, followed by a tendency to decrease with 100% of MAP. B + OF + MAP doses (0.84*) promoted an increase in this enzymatic activity until 33% of the MAP dose, followed by decreases with higher doses of MAP (Figure 6c). OF + MAP doses increase AP activity as the MAP dose increased (0.82*), while B + OF + MAP doses (0.87*) provided increases in AP activity up to 33% of the MAP dose, followed by decreases in the enzymatic activity under the use of higher MAP doses (Figure 6d).

3.6. Harvest and Yield Variables

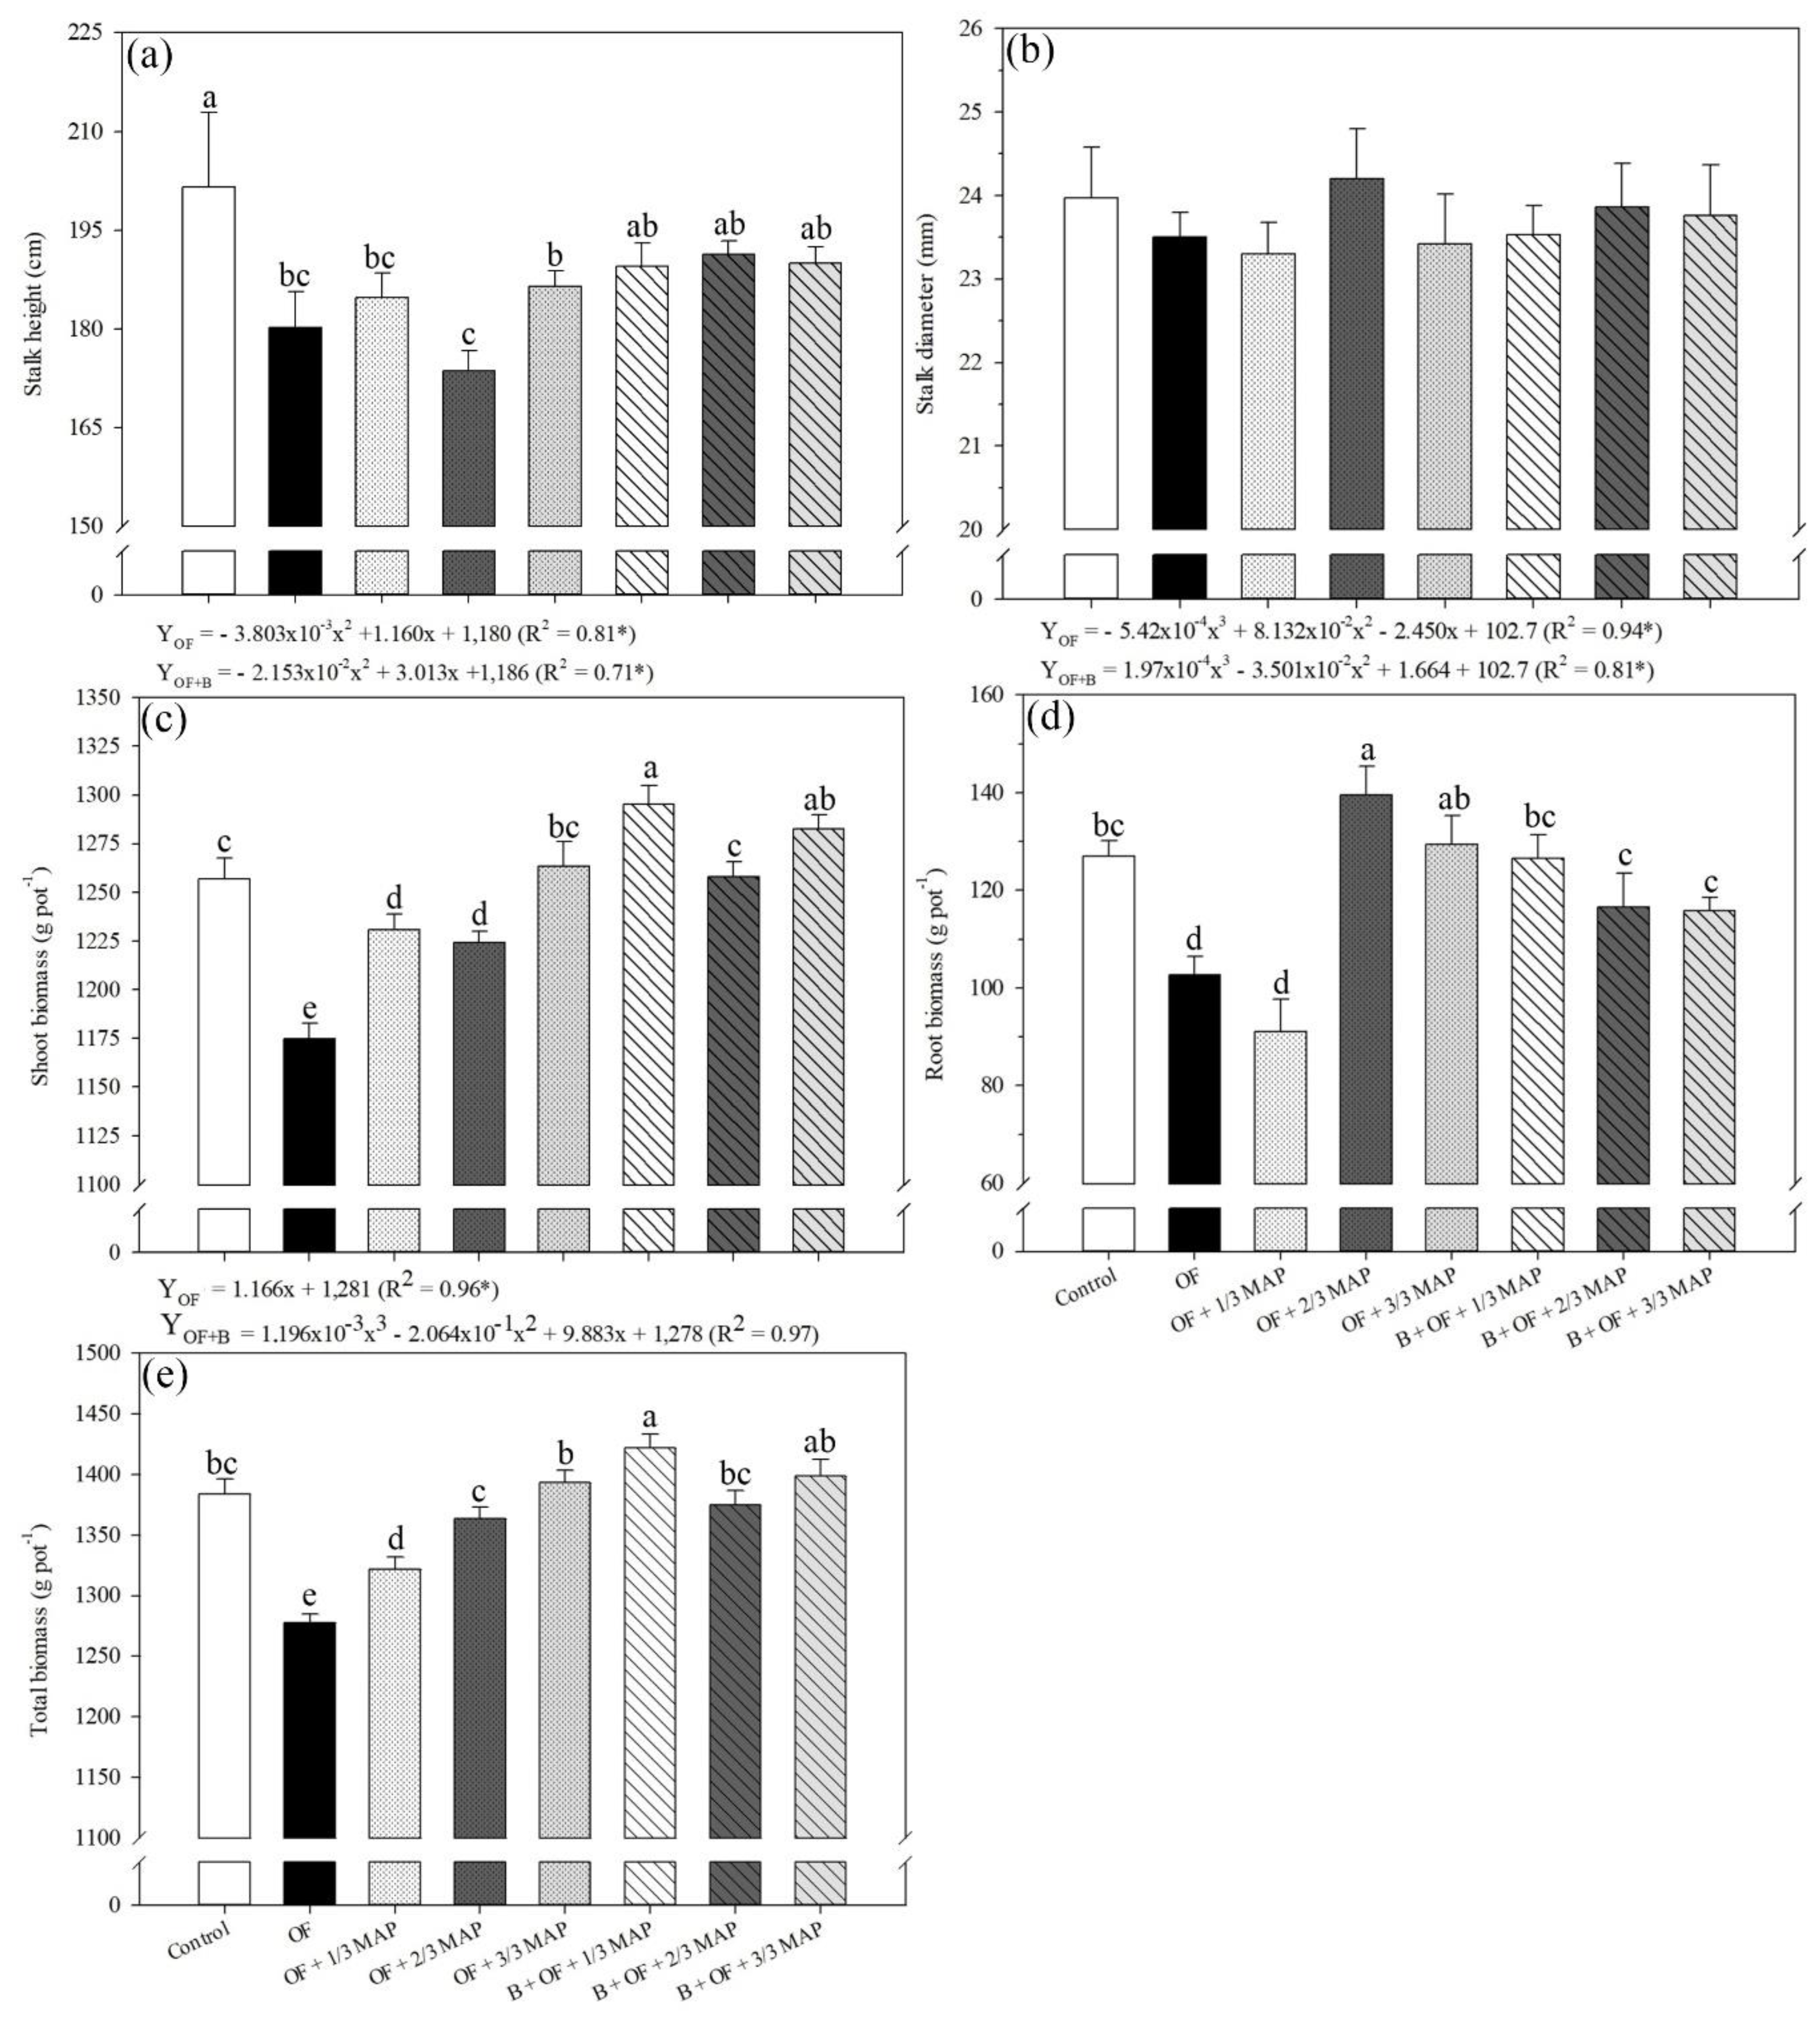
Regardless of the MAP dose used, all of the treatments associated with B + OF were similar to the control for SH (Figure 7a), and there was no difference between the treatments for SD (Figure 7b). The OF + MAP doses and B + OF + MAP doses showed no adjustment for SH and SD.
The highest SB was verified with B + OF + 1/3 MAP, representing an increase of 3.05% compared to the control (Figure 7c). OF + MAP doses (0.81*) increase SB up to 100% of MAP dose, while B + OF + MAP doses (0.71*) promoted increases of SB until 100% of MAP dose, but the optimal dose was 33% of MAP, as it showed similar result to 100% of MAP.
On the other hand, the B + OF + MAP doses were similar to the control for RB, while OF + 2/3 MAP and OF + 3/3 MAP provided an average increase of 5.9% in RB compared to the control (Figure 7d). OF + MAP doses (0.94*) increased RB up to 66% of MAP dose, followed by a tendency of decrease with 100% of MAP, while B + OF + MAP doses (0.81*) promoted increases of RB up to 33% of MAP dose, followed by decreases with higher amounts of MAP.
As verified for SB, B + OF + 1/3 MAP also promoted the highest TB, representing a slight increase of 2.73% compared to the control (Figure 7e). OF + MAP doses (0.96*) increased TB as the MAP doses increased, while B + OF + MAP doses (0.97*) provided increases in TB until 33% of MAP, followed by decreases in TB as the MAP doses increased. This decrease was caused by the low RB verified with B + OF + 2/3 and 3/3 MAP.

4. Discussion

One sustainable strategy for increasing P availability is using phosphate-solubilizing bacteria (PSB) [43]. PSB are microorganisms capable of solubilizing and mineralizing inorganic and organic P sources. Several soils and rhizosphere bacteria display these abilities and thus can promote plant growth [44,45]. The combined use of PSB and organomineral fertilizer may be a successful alternative for P fertilization and plant growth since organomineral fertilizers have been used in sugarcane in eco-friendly management to achieve greater productivity and profitability [9,18].
Our findings provide insights into the soil microbial–chemical properties and growth in the first six months of development, by which B. velezensis associated with organomineral fertilizer improves soil and foliar biochemical properties and promote plant development. The organomineral fertilizer (OF) increased %sprouting and SSI, which was previously reported in grains [46,47]. The OF used has a high content of nutrients, especially P, that is indispensable for cell division, influencing the sprouting and initial development of the crop.
Although P is involved in protein production [6], there was no difference in the protein content between the increasing P doses; in addition, the use of OF associated or not with Bacillus did not promote increases in this parameter. This nutrient is also involved in sugar metabolism, and the association of B. velezensis, OF, and lower P doses provided similar results to the control for the total sugars, showing that the reduced applied P dose did not affect this parameter. Thus, the transformation of sugars can typically occur because under the adequate concentration of cytosolic phosphate (Pi), the triose phosphate from the chloroplast is exported to the cytosol via a Pi transporter, and sucrose is synthesized; what does not happen when the cytosolic Pi concentration is low, because triose phosphate is retained within the chloroplast and starch is synthesized [42].
The non-application of P reduced the levels of total amino acids, while inoculation with B. velezensis + OF increased these levels. Osmolytes, such as sugars and amino acids, help sustain the water level and regulate cellular metabolism and functionality [48]. The current research showed that the increase in amino acid concentration was significant in inoculated plants. This augmentation indicates that B. velezensis plays a role in plant defense against environmental stresses in addition to their roles in metabolism [49,50].
Low levels of available P are reflected in plant enzymatic activity. Plants respond to P deficiency with less efficient P usage and higher acid phosphatase (AP) activity in leaves, stalks, and roots [51]. When associated with OF or OF + B, increasing MAP doses caused reductions in leaf AP activity. Phosphatases are associated with P remobilization in plants. Therefore, the increased activity of these enzymes has been linked to low cellular levels of inorganic P [51,52]. However, our results showed that bacteria inoculation increased the activity of this enzyme compared to the control, even under higher P doses, which suggests the potential of phosphate solubilization of the UFV 3918 strain.
The OF granted nutrients to the soil, contributing to the addition of organic matter and the supply of nutrients to the plants [53]. In addition, soil organic matter can provide benefits such as improving habitat for soil microfauna and consequently enhanced microbial activity due to producing soil organic carbon during the organic matter mineralization process [54,55], which explains the increased SBR, CMB, and activity of FDA.
The inoculation of B. velezensis improved soil organic carbon by improving biological and enzymatic activities, with a higher increase in the higher dose of P. Soil basal respiration is determined by the bacterial population and represents the soil life [56], and soil enzyme activity is controlled by microbial population [57]. The application of agro-industrial organic wastes with Azospirillum has already increased microbial activity [58]. Our findings agree with previous studies that suggested the enhancement of microbial activity in soil by organic amendments [59,60].
Soil enzymes are the primary mediators of soil biological processes, playing an essential role in organic matter degradation, mineralization, nutrient recycling, and transformation, contributing to maintaining soil quality and ecosystem functionality [61]. For years FDA hydrolysis has been widely used as an indicator of overall microbial activity since lipase, protease, and esterase are involved in this reaction [62,63].
CMB is considered a key indicator of soil microbial activities, and its measurement provides a direct estimate of the relation between soil microbial activities and nutrient cycling [64,65,66]. Similarly, Egamberdieva et al. [67] reported increased FDA activity in soil with applying the organic fertilizer biochar compared to the control without biochar. Furthermore, our results agree with previous studies that reported increased FDA and CMB activity under bacterial inoculation [60,68].
Phosphorus and nitrogen are nutrients that act synergistically. Urease participates in the N cycle, and the increase in its activity in the soil helps supply nutrients to plants and then promotes plant growth [69]. The highest urease activity was verified under B + OF + 2/3 and 3/3 MAP, and Duan et al. [70] had already reported an increase in this enzyme when inoculation with B. amyloliquefaciens was performed. In addition, NMB is considered an essential biological indicator for soil management, and the use of OF associated with increasing P doses probably improves organic residues and exudates in the soil, stimulating increases in this indicator [71].
Many bacterial groups can secrete a significant amount of β-glucosidase in soil [72], but the UFV 3918 strain of B. velenzis did not change this enzyme’s activity. In general, β-glucosidase activity is positively correlated with CMB [73]; therefore, the use of OF and increasing P doses provided a slight increase in β-glucosidase activity, similar to that observed for CMB. Conversely, B + OF + 1/3 MAP increased arylsulfatase activity compared to the control, and the combination of OF + 2/3 or 3/3 MAP also increased this enzyme’s activity. Some studies showed that applying organic substances positively affected arylsulfatase activity [74].
As observed with B + OF + 1/3 MAP, several studies have also reported an increase in DHA and AP activities with Bacillus inoculation [60,68]. However, there was a reduction in the activity of these two enzymes when B + OF were combined with higher doses of MAP. Mineral fertilizer, when associated with any organic compound, can be more efficient mainly by reducing P absorption in Al and Fe minerals [75]; in addition, one of the processes by which bacteria can make P available is through phosphatases, which suggests that the increase in substrate (MAP) availability led to a reduction in AP activity because there was already enough P. Interestingly, the same behavior was verified for the activity of the DHA enzyme, even though it is an exclusively intracellular enzyme, i.e., linked to viable cells and, therefore, to microbiological activity [76].
Finally, B. velezensis inoculation improved leaf area and shoot and total biomass production, in addition to providing stalk height and root biomass similar to the control, even under lower doses of phosphate. As already mentioned, an organic compound improves the mineral fertilizer efficiency through the reduction of P adsorption on oxides and hydroxides of Fe and Al [75]; in addition, the organic matter can help maintain its moisture near the placement of fertilizers for longer, which favors the diffusion of P from the soil [77], and increases the amount of P that reaches the roots, improving plant development.
Although the single use of OF + phosphate doses has provided a more significant number of tillers, the inoculation of Bacillus supplied greater stalk weight. Remarkably, the OF acted as a source of P, other macro and micronutrients, and carbon for the inoculated PSB, which may have favored the phosphate solubilization mechanisms. This is very attractive for phosphate fertilizers due to the low P use efficiency in highly weathered tropical soils, with a high capacity for P fixation [78].
Increases in leaf area facilitate sunlight absorption, favoring photosynthetic activity and, consequently, carbohydrate accumulation, which results in greater biomass, whereas increased root biomass facilitates nutrient uptake. Some studies also demonstrated that organomineral application, as well as PSB inoculation, increased sugarcane yield [18,79]. Some Bacillus strains are known to act as plant growth-promoting rhizobacteria either through the solubilization of minerals or the production of metabolites such as siderophores and phytohormones [80]. The improvements verified in the biomass may also have been due to metabolites and phytohormones produced by the PSB inoculated [81].
All of these demonstrate that the synergism between B. velenzensis and organomineral allowed the enhancement of microbiological and enzymatic activities under low doses of phosphate; thus, the consequent greater availability of nutrients probably increased soil nutrient capacity and therefore favored crop growth.

5. Conclusions

We reported how Bacillus velezensis associated with organomineral fertilizer and reduced P doses enhanced the soil microbial–chemical properties and sugarcane biomass. The inoculation of the strain UFV 3918 in the sugarcane buds allowed the equalization of plant height with the control (100% MAP) under low doses of MAP and provided an increase in leaf area, which may have enhanced the interception of solar radiation and contributed for successful biomass production. There were increases in amino acid content and leaf acid phosphatase activity, reflecting the regulation of cellular metabolism and the potential of phosphorus solubilization. In addition, we also observed that B. velezensis + organomineral fertilizer + 1/3 MAP increased soil basal respiration, carbon of the microbial biomass, FDA, DHA, arylsulfatase, and acid phosphatase activity, and all of these played nutrient recycling and then favored the plant growth, since the greater shoot and total biomass were verified in this condition, at the same time as it contributed to maintaining soil quality and ecosystem functionality. These results have important implications for the ecosystem and sustainability since P is one of the most limiting nutrients in the agricultural cropping system, especially under tropical conditions; in addition, it is a finite nutrient and irreplaceable, and sugarcane fields are dependent on high doses of P, mainly to its longevity, which evidences that this is a viable strategy to optimize the use of P in the sugarcane crop.

Supplementary Materials

The following supporting information can be downloaded at: https://www.mdpi.com/article/10.3390/agronomy12112701/s1, Table S1: Regression equations of tillers pot−1, stalk height, stalk diameter, and leaf area of sugarcane under the association of organomineral fertilizer, B. velezensis, and doses of mono ammonium phosphate (MAP) doses along the evaluation periods (30, 60, 90, 120, 150, and 180 DAP).

Author Contributions

Conceptualization: H.L.S. and M.d.A.S.; funding acquisition: M.d.A.S.; methodology: H.L.S.; investigation: H.L.S., G.F.d.S., M.R.A.C., L.C.O. and C.H.d.C.N.; formal analysis: H.L.S. and G.F.d.S.; writing—original draft: H.L.S., G.F.d.S. and M.d.A.S.; writing—review and editing: H.L.S. and M.d.A.S.; project administration: M.d.A.S.; supervision: M.d.A.S. All authors have read and agreed to the published version of the manuscript.

Funding

This research was funded by FAPESP (Fundação de Amparo à Pesquisa do Estado de São Paulo) through the master’s fellowship for Hariane Luiz Santos (Proc. 2021/02991-0) and by Fundação de Estudos e Pesquisas Agrícolas e Florestais (Proc. FEPAF 1226).

Informed Consent Statement

Not applicable.

Data Availability Statement

Not applicable.

Acknowledgments

M.d.A.S. and G.F.d.S. would like to thank the CNPq (Conselho Nacional de Desenvolvimento Científico e Tecnológico) for the “Productivity in Research” fellowship (Proc. 305952/2018-8) and “Scientific Initiation” scholarship (Proc. 121804/2021-6), respectively. Furthermore, we would like to thank CAPES (Coordenação de Aperfeiçoamento de Pessoal de Nível Superior) for the graduate fellowship for M.R.A.C., L.C.O., and C.H.C.N. (financing code 001).

Conflicts of Interest

The authors declare that the research was conducted in collaboration with Vittia Group (São Joaquim da Barra. SP, Brazil), which provided product and technical support, and is interested in the performance of the product at a biological level.

References

  1. Conab. Companhia Nacional de Abastecimento. Acompanhamento da Safra Brasileira—Cana-de-Açúcar; Primeiro levantamento, maio 2019—Safra 2019/20; Companhia Nacional de Abastecimento: Brasília, DF, Brazil, 2019.
  2. FAO—Food and Agriculture Organization. Database Faostat—Agriculture; Food and Agriculture Organization of the United Nations: Quebec, QC, Canada, 2020; Available online: http://www.fao.org/faostat/en/#rankings/countries_by_commodity (accessed on 1 September 2022).
  3. Conab. Companhia Nacional de Abastecimento. Acompanhamento da Safra Brasileira—Cana-de-Açúcar; Primeiro levantamento, abril 2022—Safra 2022/23; Companhia Nacional de Abastecimento: Brasília, DF, Brazil, 2022.
  4. Guignard, M.S.; Leitch, A.R.; Acquisti, C.; Eizaguirre, C.; Elser, J.J.; Hessen, D.O.; Jeyasingh, P.D.; Neiman, M.; Richardson, A.E.; Soltis, P.S.; et al. Impacts of Nitrogen and Phosphorus: From Genomes to Natural Ecosystems and Agriculture. Front. Ecol. Evol. 2017, 5, 70. [Google Scholar] [CrossRef] [Green Version]
  5. Marschner, H. Mineral Nutrition of Higher Plants; Elsevier: London, UK, 2012. [Google Scholar]
  6. Taiz, L.; Zeiger, E.; Moller, I.M.; Murphy, A. Fisiologia e Desenvolvimento Vegetal; Artmed: Porto Alegre, Brazil, 2017. [Google Scholar]
  7. Silva, A.M.S.; Oliveira, E.C.A.; Willadino, L.G.; Freire, F.J.; Rocha, A.T. Corrective phosphate application as a practice for reducing oxidative stress and increasing productivity in sugarcane. Cienc. Agron. 2019, 50, 188–196. [Google Scholar] [CrossRef]
  8. Caione, G.; Prado, R.D.M.; Campos, C.; Moda, L.R.; Vasconcelos, R.D.L.; Júnior, J.M.P. Response of Sugarcane in a Red Ultisol to Phosphorus Rates, Phosphorus Sources, and Filter Cake. Sci. World J. 2015, 2015, 405970. [Google Scholar] [CrossRef] [Green Version]
  9. Borges, B.M.M.N.; Abdala, D.B.; Souza, M.F.; Viglio, L.M.; Coelho, M.J.A.; Pavinato, P.S.; Franco, H.C.J. Organomineral phosphate fertilizer from sugarcane byproduct and its effects on soil phosphorus availability and sugarcane yield. Geoderma 2018, 339, 20–30. [Google Scholar] [CrossRef]
  10. Novais, R.F.; Smyth, T.J.; Nunes, F.N. Fósforo. In Fertilidade do Solo; Novais, R.F., Alvarez, V.V.H., Barros, N.F., Fontes, R.L.F., Cantarutti, R.B., Neves, J.C.L., Eds.; Sociedade Brasileira de Ciência do Solo: Viçosa, Minas Gerais, Brazil, 2007; pp. 471–550. [Google Scholar]
  11. Raij, B.V. Fertilidade do Solo e Manejo de Nutrientes; International Plant Nutrition Institute: Piracicaba, São Paulo, Brazil, 2011. [Google Scholar]
  12. Asomaning, S.K. Processes and factors affecting phosphorus sorption in soils. In Sorption in 2020s; Kyzas, G., Lazaridis, N., Eds.; IntechOpen: London, UK, 2020; pp. 1–15. [Google Scholar]
  13. Hanyabui, E.; Apori, S.O.; Frimpong, K.A.; Atiah, K.; Abindaw, T.; Ali, M.; Asiamah, J.Y.; Byalebeka, J. Phosphorus sorption in tropical soils. AIMS Agric. Food 2020, 5, 599–616. [Google Scholar] [CrossRef]
  14. Kumar, A.; Maurya, B.R.; Raghuwanshi, R.; Meena, V.S.; Islam, M.T. Co-inoculation with Enterobacter and Rhizobacteria on Yield and Nutrient Uptake by Wheat (Triticum aestivum L.) in the Alluvial Soil Under Indo-Gangetic Plain of India. J. Plant Growth Regul. 2017, 36, 608–617. [Google Scholar] [CrossRef]
  15. Meena, R.S.; Meena, V.S.; Meena, S.K.; Verma, J.P. The needs of healthy soils for a healthy world. J. Clean. Prod. 2015, 102, 560–561. [Google Scholar] [CrossRef]
  16. Rampazzo, P.E.; Marcos, F.C.C.; Cipriano, M.A.P.; Marchiori, P.E.R.; Freitas, S.S.; Machado, E.C.; Nascimento, L.C.; Brochi, M.; Ribeiro, R.V. Rhizobacteria improve sugarcane growth and photosynthesis under well-watered conditions. Ann. Appl. Biol. 2018, 172, 309–320. [Google Scholar] [CrossRef]
  17. Aye, P.P.; Pinjai, P.; Tawornpruek, S. Effect of Phosphorus Solubilizing Bacteria on Soil Available Phosphorus and Growth and Yield of Sugarcane. Walailak J. Sci. Technol. (WJST) 2021, 18, 10754. [Google Scholar] [CrossRef]
  18. Crusciol, C.A.C.; Campos, M.; Martello, J.M.; Alves, C.J.; Nascimento, C.A.C.; Pereira, J.C.R.; Cantarella, H. Organomineral Fertilizer as Source of P and K for Sugarcane. Sci. Rep. 2020, 10, 5398. [Google Scholar] [CrossRef]
  19. Shen, H.; He, X.; Liu, Y.; Chen, Y.; Tang, J.; Guo, T. A Complex Inoculant of N2-Fixing, P- and K-Solubilizing Bacteria from a Purple Soil Improves the Growth of Kiwifruit (Actinidia chinensis) plantlets. Front. Microbiol. 2016, 7, 841. [Google Scholar] [CrossRef]
  20. Saeid, A.; Prochownik, E.; Dobrowolska-Iwanek, J. Phosphorus Solubilization by Bacillus Species. Molecules 2018, 23, 2897. [Google Scholar] [CrossRef] [Green Version]
  21. Bald, D.R.; Rangel, C.P.; Vargas, A.; Girão, K.T.; Passaglia, L.M.P. Microbiota do solo: A diversidade invisível e a sua importância. Bio Diverso 2021, 1, 101–131. [Google Scholar]
  22. Sobucki, L.; Ramos, R.F.; Meireles, L.A.; Antoniolli, Z.I.; Jacques, R.J.S. Contribution of enzymes to soil quality and the evolution of research in Brazil. Rev. Bras. Cien. Solo 2021, 45, e0210109. [Google Scholar] [CrossRef]
  23. Cunha, A.R.; Martins, D. Classificação climática para os municípios de Botucatu e São Manuel, SP. Irriga 2009, 14, 1–11. [Google Scholar] [CrossRef]
  24. Santos, H.G.; Jacomine, P.K.T.; Anjos, L.; Oliveira, V.; Lumbreras, J.F.; Coelho, M.R.; Almeida, J.; Araujo Filho, J.; Oliveira, J.; Cunha, T.J.F. Sistema Brasileiro de Classificação de Solos; Embrapa: Brasília, Brazil, 2018. [Google Scholar]
  25. Braga Junior, R.L.C.; Landell, M.G.A.; Silva, D.N.; Bidóia, M.A.P.; Silva, T.N.; Silva, V.H.P.; Luz, A.M.; Anjos, I.A. Censo Varietal IAC; Região centro-sul—Safra 2019/20; Instituto Agronômico de Campinas: Campinas, São Paulo, Brazil, 2021; (Technical Bulletin, 225).
  26. Vitti, G.C.; Luz, P.H.C.; Altran, W.S. Nutrição e adubação. In Cana-de-açúcar: Do plantio à colheita; Santos, F., Bórem, A., Eds.; UFV: Viçosa/Minas Gerais, Brazil, 2013; pp. 49–79. [Google Scholar]
  27. Maguire, J.D. Speed of germination aid in selection and evaluation for seedling emergence and vigor. Crop Sci. 1962, 2, 176–177. [Google Scholar] [CrossRef]
  28. Hermann, E.R.; Câmara, G.M.S. Um método simples para estimar a área foliar de cana-de-açúcar. STAB Açúcar Álcool Subprodutos 1999, 17, 32–34. [Google Scholar]
  29. Bradford, M.M. A rapid and sensitive method for the quantitation of microgram quantities of protein utilizing the principle of protein-dye binding. Anal. Biochem. 1976, 72, 248–254. [Google Scholar] [CrossRef]
  30. Dubois, M.; Gilles, K.A.; Hamilton, J.K.; Rebers, P.A.; Smith, F. Colorimetric method for determination of sugars and related substances. Anal. Biochem. 1956, 28, 350–356. [Google Scholar] [CrossRef]
  31. Yemm, E.W.; Cocking, E.C. The determination of amino acids with ninhydrin. Analyst 1955, 80, 209–213. [Google Scholar] [CrossRef]
  32. Ozawa, K.; Osaki, M.; Matisui, H.; Honma, M.; Tadano, T. Purification and properties of acidphosphatase secreted from lupin roots under phosphorus-deficiency conditions. J. Soil Sci. Plant Nutr. 1995, 41, 461–469. [Google Scholar] [CrossRef]
  33. Silva, E.E.; Azevedo, P.H.S.; De-Polli, H. Determinação da Respiração Basal (RBS) e Quociente Metabólico do Solo (qCO2); Embrapa Agrobiologia: Seropédica, Rio de Janeiro, Brazil, 2007; (Technical Bulletin, 225). [Google Scholar]
  34. Vance, E.D.; Brookes, P.C.; Jenkinson, D.S. An extraction method for measuring soil microbial biomass-C. Soil Biol. Biochem. 1987, 19, 703–707. [Google Scholar] [CrossRef]
  35. Ferreira, A.S.; Camargo, F.A.O.; Vidor, C. Utilização de microondas na avaliação da biomassa microbiana do solo. Rev. Bras. Cien. Solo 1999, 23, 991–996. [Google Scholar] [CrossRef] [Green Version]
  36. Green, V.S.; Stott, D.E.; Diack, M. Assay for fluorescein diacetate hydrolytic activity: Optimization for soil samples. Soil Biol. Biochem. 2006, 38, 693–701. [Google Scholar] [CrossRef]
  37. Mersi, W.; Schinner, F. An improved and accurate method for determining the dehydrogenase activity of soils with iodonitrotetrazolium chloride. Biol. Fertil. Soils 1991, 11, 216–220. [Google Scholar] [CrossRef]
  38. Kandeler, E.; Gerber, H. Short-term assay of soil urease activity using colorimetric determination of ammonium. Biol. Fertil. Soils 1988, 6, 68–72. [Google Scholar] [CrossRef]
  39. Eivazi, F.; Tabatabai, M.A. Glucosidases and galactosidases in soils. Soil Biol. Biochem. 1988, 20, 601–606. [Google Scholar] [CrossRef]
  40. Tabatabai, M.A.; Bremner, J.M. Arylsulfatase activity of soils. Soil Sci. Soc. Am. Proc. 1969, 34, 225–229. [Google Scholar] [CrossRef]
  41. Jaiphong, T.K.; Tominaga, J.; Watanabe, K.; Nakabaru, M.; Takaragawa, H.; Suwa, R.; Ueno, M.; Kawamitsu, Y. Effects of duration and combination of drought and flood conditions on leaf photosynthesis, growth and sugar content in sugarcane. Plant Prod. Sci. 2016, 19, 427–437. [Google Scholar] [CrossRef]
  42. Rodrigues, J.D.; Jadoski, C.J.; Fagan, E.B.; Ono, E.O.; Soares, L.H.; Dourado Neto, D. Fisiologia da Produção de Cana-de-Açúcar; ANDREI: São Paulo, Brazil, 2018. [Google Scholar]
  43. Alori, E.T.; Glick, B.R.; Babalola, O.O. Microbial phosphorus solubilization and its potential for use in sustainable agriculture. Front. Microbiol. 2017, 8, 971. [Google Scholar] [CrossRef] [Green Version]
  44. Sagar, A.; Yadav, S.S.; Sayyed, R.Z.; Sharma, S.; Ramteke, P.W. Bacillus subtilis: A multifarious plant growth promoter, biocontrol agent, and bioalleviator of abiotic stress. In Bacilli in Agrobiotechnology; Islam, M.T., Rahman, M., Pandey, P., Eds.; Springer: Cham, Switzerland, 2022; pp. 561–580. [Google Scholar]
  45. Richardson, A.E.; Simpson, R.J. Soil microorganisms mediating phosphorus availability update on microbial phosphorus. Plant Physiol. 2011, 156, 989–996. [Google Scholar] [CrossRef] [Green Version]
  46. Aboukila, E.F.; Nassar, I.N.; Rashad, M.; Hafez, M.; Norton, J.B. Reclamation of calcareous soil and improvement of squash growth using brewers’ spent grain and compost. J. Saudi Soc. Agric. Sci. 2018, 17, 390–397. [Google Scholar] [CrossRef]
  47. Deshev, M.G.; Desheva, G.N.; Stamatov, S.K. Germination and early seedling growth characteristics of Arachis hypogaea L. under salinity (NaCl) stress. Agric. Conspec. Sci. 2020, 85, 113–121. [Google Scholar]
  48. Hossain, M.A.; Burritt, D.J.; Fujita, M. Proline and Glycine Betainemodulate Cadmium-Induced Oxidative Stress Tolerance in Plants; John Wiley & Sons: Hoboken, NJ, USA, 2015. [Google Scholar]
  49. Less, H.; Galili, G. Principal transcriptional programs regulating plant amino acid metabolism in response to abiotic stresses. Plant Physiol. 2008, 147, 316–330. [Google Scholar] [CrossRef] [Green Version]
  50. Chiappero, J.; Cappellari, L.D.R.; Alderete, L.G.S.; Palermo, T.B.; Banchio, E. Plant growth-promoting rhizobacteria improve the antioxidant status in Mentha piperita grown under drought stress leading to anenhancement of plant growth and total phenolic content. Ind. Crops Prod. 2019, 139, 111–553. [Google Scholar] [CrossRef]
  51. Nunes, F.N.; Cantarutti, R.B.; Novais, R.F.; Silva, I.R.; Tótola, M.R.; Ribeiro, B.N. Atividade de fosfatases em gramíneas forrageiras em resposta à disponibilidade de fósforo no solo e à altura de corte das plantas. Rev. Bras. Cienc. Solo 2008, 32, 1899–1909. [Google Scholar] [CrossRef] [Green Version]
  52. Bozzo, G.G.; Dunn, E.L.; Plaxton, W.C. Differential synthesis of phosphate-starvation inducible purple acid phosphatase isozymes in tomato (Lycopersicon esculentum) suspension cells and seedlings. Plant Cell Environ. 2006, 29, 303–313. [Google Scholar] [CrossRef]
  53. Ayinla, A.; Alagbe, I.A.; Olayinka, B.U.; Lawal, A.R.; Aboyeji, O.O.; Etejere, E.O. Effects of organic, inorganic, and organo-mineral fertilizer on the growth, yield and nutrient composition of Corchorus olitorious (L). Ceylon J. Sci. Biol. Sci. 2018, 47, 13–19. [Google Scholar] [CrossRef] [Green Version]
  54. Kominko, H.; Gorazda, K.; Wzorek, Z. The possibility of organo-mineral fertilizer production from sewage sludge. Waste Biomass Valorization 2017, 8, 1781–1791. [Google Scholar] [CrossRef] [Green Version]
  55. Zhen, Z.; Liu, H.; Wang, N.; Guo, L.; Meng, J.; Ding, N.; Wu, G.; Jiang, G. Effects of manure compost application on soil microbial community diversity and soil microenvironments in a temperate cropland in China. PLoS ONE 2014, 9, e108555. [Google Scholar] [CrossRef]
  56. Bond-Lamberty, B.; Bolton, H.; Fansler, S.; Heredia-Langner, A.; Liu, C.; McCue, L.A.; Smith, J.; Bailey, V. Soil respiration and bacterial structure and function after 17 years of a reciprocal soil transplant experiment. PLoS ONE 2016, 11, e0150599. [Google Scholar] [CrossRef]
  57. Siwik-Ziomek, A.; Szczepanek, M. Soil extracellular enzyme activities and uptake of N by oilseed rape depending on fertilization and seaweed bio-stimulant application. Agronomy 2019, 9, 480. [Google Scholar] [CrossRef] [Green Version]
  58. Hafez, M.; Popov, A.I.; Rashad, M. Influence of Agro-industrial wastes and Azospirillum on nutrients status and grain yield under corn plant growth in arid regions. Biosci. Res. 2019, 16, 2119–2130. [Google Scholar]
  59. Shi, S.; Tian, L.; Nasir, F.; Bahadur, A.; Batool, A.; Luo, S.; Yang, F.; Wang, Z.; Tian, C. Response of microbial communities and enzyme activities to amendments in saline-alkaline soils. Appl. Soil Ecol. 2019, 135, 16–24. [Google Scholar] [CrossRef]
  60. Sabaté, D.C.; Brandán, C.P. Bacillus amyloliquefaciens strain enhances rhizospheric microbial growth and reduces root and stem rot in a degraded agricultural system. Rhizosphere 2022, 22, 100544. [Google Scholar] [CrossRef]
  61. Ai, C.; Liang, G.; Sun, J.; He, P.; Tang, S.; Yang, S.; Zhou, W.; Wang, X. The alleviation of acid soil stress in rice by inorganic or organic ameliorants is associated with changes in soil enzyme activity and microbial community composition. Biol. Fertil. Soils 2015, 51, 465–477. [Google Scholar] [CrossRef]
  62. Achuba, F.; Peretiemo-Clarke, B. Effect of spent engine oil on soil catalase and dehydrogenase activities. Int. Agrophys. 2008, 22, 1–4. [Google Scholar]
  63. Ding, Z.; Kheir, A.M.S.; Ali, M.G.M.; Ali, O.A.M.; Abdelaal, A.I.N.; Lin, X.; Zhou, Z.; Wang, B.; Liu, B.; He, Z. The integrated effect of salinity, organic amendments, phosphorus fertilizers, and deficit irrigation on soil properties, phosphorus fractionation and wheat productivity. Sci. Rep. 2020, 10, 2736. [Google Scholar] [CrossRef] [Green Version]
  64. Schultz, P.; Urban, N.R. Effects of bacterial dynamics on organic matter decomposition and nutrient release from sediments: A modeling study. Ecol. Model. 2008, 210, 1–14. [Google Scholar] [CrossRef]
  65. Farrell, M.; Prendergast-Miller, M.; Jones, D.L.; Hill, P.W.; Condron, L.M. Soil microbial organic nitrogen uptake is regulated by carbon availability. Soil Biol. Biochem. 2014, 77, 261–267. [Google Scholar] [CrossRef] [Green Version]
  66. Fraser, F.C.; Todman, L.C.; Corstanje, R.; Deeks, L.K.; Harris, J.A.; Pawlett, M.; Whitmore, A.P.; Ritz, K. Distinct respiratory responses of soils to complex organic substrate are governed predominantly by soil architecture and its microbial community. Soil Biol. Biochem. 2016, 103, 493–501. [Google Scholar] [CrossRef]
  67. Egamberdieva, D.; Ma, H.; Shurigin, V.; Alimov, J.; Wirth, S.; Bellingrath-Kimura, S.D. Biochar additions alter the abundance of P-cycling-related bacteria in the rhizosphere soil of Portulaca oleracea L. under salt stess. Soil Syst. 2022, 6, 64. [Google Scholar] [CrossRef]
  68. Sabaté, D.C.; Petroselli, G.; Erra-Balsells, R.; Audisio, M.C.; Brandan, C.P. Beneficial effect of Bacillus sp. P12 on soil biological activities and pathogen control in common bean. Biol. Control 2020, 141, 104131. [Google Scholar] [CrossRef]
  69. Wu, K.J.; Dumat, C.; Li, H.Q.; Xia, H.P.; Li, Z.A.; Wu, J.T. Responses of soil microbial community and enzymes during plant-assisted biodegradation of di-(2-ethylhexyl) phthalate and pyrene. Int. J. Phytoremediat. 2019, 21, 683–692. [Google Scholar] [CrossRef]
  70. Duan, Y.; Zhou, Y.; Li, Z.; Chen, X.; Yin, C.; Mao, Z. Effects of Bacillus amyloliquefaciens QSB-6 on the growth of replanted apple tres and the soil microbial environment. Horticulturae 2022, 8, 83. [Google Scholar] [CrossRef]
  71. Saini, V.K.; Bhandari, S.C.; Tarafdar, J.C. Comparison of crop yield, soil microbial C.N. and P, N-fixation, nodulation and mycorrhizal infection in inoculated and non-inoculated sorghum and chickpea crops. Field Crops Res. 2004, 89, 39–47. [Google Scholar] [CrossRef]
  72. Ahmed, A.; Nasim, F.u.-H.; Batool, K.; Bibi, A. Microbial β-Glucosidase: Sources, production and applications. J. Appl. Environ. Microbiol. 2017, 5, 31–46. [Google Scholar] [CrossRef]
  73. Almeida, R.F.; Nave, E.R.; Mota, R.P. Soil quality: Enzymatic activity of soil β-glucosidase. GJARR—Glob. Sci. Res. J. 2015, 3, 146–150. [Google Scholar]
  74. Deng, S.P.; Tabatabai, M.A. Effect of tillage and residue management on enzyme activities in soils: III. Phosphatases and arylsulfatase. Biol. Fertil. Soils 1997, 24, 141–146. [Google Scholar] [CrossRef]
  75. Yan, X.; Wei, Z.; Hong, Q.; Lu, Z.; Wu, J. Phosphorus fractions and sorption characteristics in a subtropical paddy soil as influenced by fertilizer sources. Geoderma 2017, 295, 80–85. [Google Scholar] [CrossRef]
  76. Skujins, J. Dehydrogenase: An indicator of biological activities in arid soils. Bull. Ecol. Res. Commun. 1973, 17, 235–241. [Google Scholar]
  77. Montalvo, D.; Degryse, F.; Mclaughlin, M.J. Fluid fertilizers improve phosphorus diffusion but not lability in andisols and oxisols. Soil Sci. Soc. Am. J. 2014, 78, 214–224. [Google Scholar] [CrossRef]
  78. Pavinato, P.S.; Cherubin, M.R.; Soltangheisi, A.; Rocha, G.C.; Chadwick, D.R.; Jones, D.L. Revealing soil legacy phosphorus to promote sustainable agriculture in Brazil. Sci. Rep. 2020, 10, 15615. [Google Scholar] [CrossRef] [PubMed]
  79. Rosa, P.A.L.; Mortinho, E.S.; Jalal, A.; Galindo, F.S.; Buzetti, S.; Fernandes, G.C.; Barco Neto, M.; Pavinato, O.S.; Teixeira Filho, M.C.M. Inoculation with growth-promoting bacteria associated with the reduction of phosphate fertilization in sugarcane. Front. Environ. Sci. 2020, 8, 32. [Google Scholar] [CrossRef]
  80. Miljaković, D.; Marinković, J.; Balešević-Tubić, S. The significance of Bacillus spp. in disease suppression and growth promotion of field and vegetable crops. Microorganisms 2020, 8, 1037. [Google Scholar] [CrossRef]
  81. Alenezi, F.N.; Slama, H.B.; Bouket, A.C.; Cherif-Silini, H.; Silini, A.; Luptakova, L.; Nowakowska, J.A.; Oszako, T.; Belbahri, L. Bacillus velezensis: A treasure house of bioactive compoundsof medicinal, biocontrol and environmental importance. Forests 2021, 12, 1714. [Google Scholar] [CrossRef]
Figure 1. Mean, maximum, and minimum air temperature and average relative humidity inside the protected crop enclosure during the experimental period. B1: 1st biometric evaluation (BE); B2: 2nd BE; B3: 3rd BE; B4: 4th BE; B5: 5th BE, and B6: 6th BE.
Agronomy 12 02701 g001
Figure 2. %Sprouting (a), sprouting speed (b), and sprouting speed index (c) of sugarcane seedlings under the association of organomineral fertilizer (OF), B. velezensis (B), and doses of mono ammonium phosphate (MAP). Means followed by the same letter do not differ from each other by the Tukey test at 5% probability. The error bars express the standard deviation of the mean (n = 4). The regression equations and R2 above the figures include the MAP doses associated with organomineral fertilizer (OF) and with organomineral fertilizer + B. velezensis (OF + B) at the 5% significance level (*).
Agronomy 12 02701 g002
Figure 3. Regression curves along the evaluation periods (30, 60, 90, 120, 150, and 180 DAP) for tillers pot−1 (a), stalk height (b), stalk diameter (c), and leaf area (d) of sugarcane under the association of organomineral fertilizer (OF), B. velezensis (B), and doses of mono ammonium phosphate (MAP).
Agronomy 12 02701 g003
Figure 4. Protein content (a), total soluble sugars (b), total amino acids in the leaves (c), and leaf acid phosphatase (AP) activity (d) of sugarcane under the association of organomineral fertilizer (OF), B. velezensis (B), and doses of mono ammonium phosphate (MAP). Means followed by the same letter do not differ from each other by the Tukey test at 5% probability. The error bars express the standard deviation of the mean (n = 4). The regression equations and R2 above the figures include the MAP doses associated with organomineral fertilizer (OF) and with organomineral fertilizer + B. velezensis (OF + B) at the 5% significance level (*).
Agronomy 12 02701 g004
Figure 5. Soil basal respiration (SBR) accumulated in 21 days and per day (a,b); carbon (CMB) and nitrogen of the microbial biomass (NMB) (c,d); hydrolysis of fluorescein diacetate (FDA) (e); and dehydrogenase activity (f) in the soil of sugarcane cultivation under the association of organomineral fertilizer (OF), B. velezensis (B), and doses of mono ammonium phosphate (MAP). Means followed by the same letter do not differ from each other by the Tukey test at 5% probability. The error bars express the standard deviation of the mean (n = 4). The regression equations and R2 above the figures include the MAP doses associated with organomineral fertilizer (OF) and with organomineral fertilizer + B. velezensis (OF + B) at the 5% significance level (*).
Agronomy 12 02701 g005
Figure 6. Urease (a), B-glycosidase (b), arylsulfatase (c), and acid phosphatase activity (d) of the sugarcane cultivation soil under the association of organomineral fertilizer (OF), B. velezensis (B), and doses of mono ammonium phosphate (MAP). Means followed by the same letter do not differ from each other by the Tukey test at 5% probability. The error bars express the standard deviation of the mean (n = 4). The regression equations and R2 above the figures include the MAP doses associated with organomineral fertilizer (OF) and with organomineral fertilizer + B. velezensis (OF + B) at the 5% significance level (*).
Agronomy 12 02701 g006
Figure 7. Stalk height (a), stalk diameter (b), shoot biomass (c), root biomass (d), and total biomass (e) of sugarcane under the association of organomineral fertilizer (OF), B. velezensis (B), and doses of mono ammonium phosphate (MAP). Means followed by the same letter do not differ from each other by the Tukey test at 5% probability. The error bars express the standard deviation of the mean (n = 4). The regression equations and R2 above the figures include the MAP doses associated with organomineral fertilizer (OF) and with organomineral fertilizer + B. velezensis (OF + B) at the 5% significance level (*).
Agronomy 12 02701 g007
Table 1. Initial soil chemical analysis and doses of mineral fertilizers added at planting.
pHO.M.Al3+H + AlKCaMgSBCECV%PresinSCuFeMnZnB
CaCl2g dm−3mmolc dm−3mg dm−3
6.040.10.720.80.675.226.4102.2123.083.061.834.10.322.70.71.20.2
Planting fertilization
DoseNPK
MAP recommended dose36.12 kg urea ha−1 (0.813 g urea pot−1)125 kg MAP ha−1 (2.8 g MAP pot−1)250 kg KCl ha−1 (5.635 g KCl pot−1)
2/3 of the MAP recommended dose46.3 kg urea ha−1 (1.04 g urea pot−1)83.33 kg MAP ha−1 (1.878 g MAP pot−1)250 kg KCl ha−1 (5.635 g KCl pot−1)
1/3 of the MAP recommended dose56.47 kg urea ha−1 (1.272 g urea pot−1)41.7 kg MAP ha−1 (0.939 g MAP pot−1)250 kg KCl ha−1 (5.635 g KCl pot−1)
Without MAP66.6 kg urea ha−1 (1.5 g urea pot−1)250 kg KCl ha−1 (5.635 g KCl pot−1)
O.M (organic matter); SB (sum of bases); V% (base saturation); cationic exchange capacity (CEC).
Publisher’s Note: MDPI stays neutral with regard to jurisdictional claims in published maps and institutional affiliations.