Article

Sole and Combined Application of Phosphorus and Glucose and Its Influence on Greenhouse Gas Emissions and Microbial Biomass in Paddy Soils

1
National Engineering Laboratory for Improving Quality of Arable Land, Institute of Agricultural Resources and Regional Planning, Chinese Academy of Agricultural Sciences, Beijing 100081, China
2
National Observation Station of Qiyang Agri-Ecology System, Institute of Agricultural Resources and Regional Planning, Chinese Academy of Agricultural Sciences, Qiyang, Yongzhou 426182, China
3
College of Plant Science and Technology, Huazhong Agricultural University, Wuhan 430070, China
4
Department of Agriculture, Abdul Wali Khan University Mardan, Mardan 23200, Pakistan
5
Institute of Soil, Fertilizer and Agricultural Water Conservation, Xinjiang Academy of Agricultural Sciences, Urumqi 830091, China
6
College of Horticulture, Sichuan Agricultural University, Chengdu 611130, China
*
Author to whom correspondence should be addressed.
These authors contributed equally to this work.
Agronomy 2022, 12(10), 2368; https://doi.org/10.3390/agronomy12102368
Submission received: 14 September 2022 / Revised: 24 September 2022 / Accepted: 28 September 2022 / Published: 30 September 2022
(This article belongs to the Section Farming Sustainability)

Abstract

:
Soil microbial activities are consistently restricted not only by phosphorus availability but also by microbial carbon requirements. Therefore, an incubation experiment was conducted with three soils (QY1, QY2 and QY3) selected on the basis of phosphorus limitation. Results revealed that high N2O emissions, 17.44 µg kg−1, were measured in phosphorus-deficient soil with addition of glucose. In phosphorus-adequate soils, the peaks of N2O emission values in the glucose addition treatment were 20.8 µg kg−1 and 24.7 µg kg−1, which were higher than without glucose-added treatments. CH4 emissions were higher with glucose addition, at 1.9 µg kg−1 in phosphorus-deficient soil and 1.52 µg kg−1 and 2.6 µg kg−1 in two phosphorus-adequate soils. Phosphorus added to deficient and adequate soil significantly increased the cumulative CH4 and N2O emissions compared to the solely glucose added soil and the combination of glucose with phosphorus. Glucose addition significantly increased microbial biomass carbon (MBC) but decreased microbial biomass phosphorus (MBP), especially in the phosphorus-adequate soil. For MBC, the highest value obtained was 175.8 mg kg−1, which was determined under glucose addition in phosphorus-adequate soil. The soil pH increased with glucose addition but decreased with phosphorus addition in phosphorus-deficient soil. The soil organic carbon (SOC) content was significantly affected by glucose addition in the phosphorus-deficient soil. Available phosphorus (AP) was highly influenced by phosphorus addition but did not appear to be affected by glucose addition. From the current study, we concluded that sole phosphorus and glucose addition increase CH4 andN2O emissions in phosphorus-deficient and also in phosphorus-adequate paddy soils. Further study will be conducted on sole and interactive effects of glucose and phosphorous on soil with plants and without plants.

1. Introduction

From the previous many years, the major cause of global warming is greenhouse gases (GHGs) and their effects on the environment. Climate change has been a well-known and important concern since from 21st century. Currently, agribusiness contributes approximately 20% of anthropogenic greenhouse gas (GHG) emissions in the agriculture sector [1]. The key GHGs that pollute our environment are methane (CH4), carbon dioxide (CO2) and nitrous oxide (N2O), which are produced from different sectors and also from agricultural land. Soil temperature and soil moisture directly affect greenhouse gas emissions, and organic carbon consumption affects soil microbial activity [2,3]. The global warming potentials from agriculture land are 28 to 265 CO2 equivalents at a decadal to 100-year horizon [2,3]. Since 1990, the agricultural sector has increased GHG production by approximately 23.8% through aerobic and anaerobic microbial processes [1,2]. The exchange of N2O and CH4 between the soil and atmosphere depends on the soil’s different environmental conditions, substrate availability, the site and the landscape scales [3,4]. Climate is an essential and key driver of microbial activity and microbial biomass in the soils, which is strongly influenced by the level of moisture and temperature in the soils [4]. Nitrous oxide contributes to stratospheric ozone destruction in the atmosphere and therefore represents a risk to human beings and all living things [5]. The main cause of nitrous oxide emissions is soil bacterial respiration, which takes place in the soil ecosystem. The output of nitrous oxide in the bacterial and fungal population increases because of the supplementation of nitrogen into the soil, which increases the output of nitrous oxide into the atmosphere [5,6]. Many abiotic and biotic processes that generate nitrous oxide occur in the soil environment; however, nitrous oxide is typically caused by autotrophic NH4 oxidizers, which are responsible for nitrification. Heterotrophic microorganisms and fungi are responsible for the denitrification process and play a significant role in this process [7].
Under aerobic and anaerobic conditions, some of the factors that influence different microbial activities that produce nitrous oxide emissions in the soil include the nitrate (NO3) and ammonium (NH4+) concentrations [7,8]. Other factors that also influence microbial processes are the soil temperature, moisture content, soil pH and the availability of organic carbon and other essential nutrients, such as nitrogen and phosphorus [9,10]. The production of N2O in the presence of phosphorus during denitrification and nitrification processes directly influences the archaea, fungi and other microorganisms involved in these two processes [11,12]. Furthermore, several other studies have suggested that nitric oxide (NO) and nitrous oxide emissions increase after the addition of phosphorus to soil without affecting the ratio between N2O and NO because phosphorus stimulates nitrifying and denitrifying bacteria and invigorates microbial activities in the soil. This process involves nitrogen transformation and mineralization and an increase in anaerobic conditions because of stimulated heterotrophic respiration [11,12]. Therefore, we concluded that a readily available carbon source and high phosphorus availability can stimulate heterotrophic denitrifying activities and influence nitrous oxide emissions. Sometimes, due to the stimulated nitrogen immobilization of heterotrophic microorganisms caused by increased soluble carbon and phosphorus availability, N2O emissions decrease during the nitrification and/or denitrification process [13,14]. It is very important to understand the interactive effect of the available carbon and phosphorus in soil within the same cropping system at different availability levels.
However, adding phosphorus to phosphorus-limited soil could increase nitrous oxide emissions through the denitrification process, which also enhances microbial respiration and soil organic nitrogen mineralization by stimulating OM decomposition [11,13]. In addition, the addition of glucose provides carbon to the heterotrophic microbial community, including denitrifiers [13,14]. Anaerobic bacteria, fungi and archaea degrade organic matter, which produces methane in the soil [15,16], while hydrogenotrophic and acetotrophic methanogens also produce methane. Hydrogenotrophic methanogens reduce CO2 with H2 to CH4, and acetotrophic methanogens convert acetate to methane and carbon dioxide [17]. Generally, more than 67% of methane is produced by acetotrophic methanogens [18].
Methane is a source of energy for Gram-negative methanotrophic bacteria. These methanotrophic bacteria play a key role in the regulation of methane emissions and can oxidize methane by up to 90% [19]. Numerous research studies have shown that the methanogenesis process in phosphorus-deficient soil is weaker than that in phosphorus-sufficient soil [19,20]. These findings highlight the complex relationship between soil phosphorus concentrations and methane production [21]. Previous studies have shown that phosphorus addition increased, decreased [22] or had no effect [23] on CH4 fluxes. Reports have revealed a decrease in methane flux after the addition of phosphorus, which affects the CH4 flux indirectly by stimulating root water uptake [24]. Mori et al. (2013) [12] noted that phosphorus addition in Acacia mangium plantations had no effect on methane fluxes but that methane uptake substantially increased when there were no plant interactions [21,24]. To reduce global methane emissions, it is important to understand the patterns of soil methane emissions and their control methods in the agricultural sector, especially in paddy fields.
Worldwide, phosphorus deficiency is one of the main factors limiting primary productivity in terrestrial ecosystems, and the use of large amounts of phosphorus fertilizer is not an acceptable solution because of the risk of eutrophication [20]. In terrestrial ecosystems, the growth of heterotrophic microbes and their activities are influenced by the availability and quality of carbon, but the availability of some major nutrients, such as nitrogen and phosphorus, can further limit the use of carbon substrates by microbes [25,26]. The carbon/phosphorus ratios of microbes that prefer phosphorus-deficient conditions by weight are frequently lower than the carbon/phosphorus ratio of the substrate [27]. In acidic and alkaline soils, microbial phosphorus limitation can be exacerbated by high phosphorus adsorption by soil particles and the precipitation of phosphorus as insoluble hydroxy phosphates [26,27]. Several researchers conducted incubation experiments and reported that the addition of phosphorus stimulated soil microbial respiration, which suggests that phosphorus availability limits microbial activities in soils [11,25]. Moreover, some scientists have reported that phosphorus addition increases microbial biomass carbon (MBC) and that the presence of available phosphorus (AP) in the soil limits microbial activities [28]. Thus, soil microbial activities and community composition may change with changes in phosphorus availability, and these changes could be related to nitrous oxide [29,30], methane emissions [31] and exchanges between the atmosphere and terrestrial ecosystems [11,12,30].
In this research, we investigated the sole and combined effects of phosphorus and glucose on CH4 and N2O emissions and also to determine their effect on soil microbial biomass activity in phosphorus-deficient and phosphorus-adequate soils.
We hypothesized that the addition of phosphorus and carbon would increase N2O and CH4 emissions in phosphorus-deficient and phosphorus-adequate soils by stimulating denitrifying microorganisms and methanogens. We further hypothesized that the addition of glucose would also increase GHG emissions by providing carbon to the microbial community, thereby increasing the microbial biomass and its activity.

2. Materials and Methods

2.1. Soil Sampling, Site and Characteristics

Soil samples were collected from the National Observation and Research Station of Farmland Ecosystem in Qiyang, south China (26°45′42″ N, 111°52′32″ E), at an elevation of approximately 160 m above sea level. The mean annual precipitation is 1259 mm and the mean air temperature ranges from −8.4–40 °C. The soil is a typical Ultisol with low fertility that originally developed from quaternary red clay. Three fields of long-term experiments that began in 1982 were selected for sampling on the basis of available phosphorus in the field soil. The initial soil properties (total nitrogen, total phosphorus, total potassium, alkali-hydrolyzable nitrogen, Olsen-P and available potassium) are listed in Table 1. The planting system was an early rice—late rice—winter fallow rotation. Soil samples were collected at 0–20 cm depth from five different spots in each replication in the phosphorus-deficient and phosphorus-adequate fields. The collected soil samples were considered to represent three replicates and then crushed, sieved and passed through a 2 mm sieve.

2.2. Incubation and Treatment Details

Collected soils were treated with two levels of phosphorus (0 or 20 mg P kg−1 soil) with or without glucose (Glu; 400 mg C kg−1 soil) and mixed well. We applied phosphorus as monopotassium phosphate (KH2PO4) as a phosphorus source. All four treatments of each soil were replicated three times. The soil water content was adjusted to 80% water-filled pore spaces (WFPS) [14]. Two factors were involved in this study; one was the addition of glucose and another was the addition of phosphorus. Samples of treated soil (200 g) were transferred to 1 L glass jars and incubated at 25 °C for 60 days to measure the daily flux rates for N2O and CH4 emissions. The glass jars were protected with polyethene plastic coverings to prevent moisture loss but to allow gas exchange before gas sampling.

2.3. N2O and CH4 Emission Sampling Method

N2O and CH4 emissions were collected on day 0, 1, 2, 3, 4, 5, 7, 9, 11, 13, 15, 17, 21, 25, 29, 33, 37, 41, 46, 51 and 60 during the incubation period. Before sampling, the glass jars were flushed with ambient air and kept exposed in an open environment for 30 min before collecting N2O and CH4 emission samples. The samples for gas analysis were collected at 0, 1 and 2 h time intervals after closing the glass jars with rubber lids. The N2O and CH4 samples were taken from the jars and collected in a 30 mL syringe. The N2O and CH4 emission samples were analyzed directly after collection using an Agilent greenhouse gas chromatograph (7890 GC, Agilent Technologies 7890 B, Santa Clara, CA, USA) to measure the concentrations of N2O and CH4 with N2 as the carrier gas. An electron capture detector was used to measure N2O emissions at 300 °C. Carbon dioxide was converted to CH4 through a methanizer, and its concentration was measured using a flame ionization detector at 250 °C. The concentrations of standard gas for N2O were 0.42 and 4.2, and for CH4 were 0.393 and 5.060 ppm. The flux rates of both gases were determined as the slope of the linear regression obtained from the measured gas concentration data over a time period. The fluxes were calculated using the equation as described by Liu et al. (2014):
F = ρ × V / W × Δ c Δ t × 273 / T + 273
where F is gas emission rate (μg kg−1 h−1), p is gas density at standard conditions, V is the volume of the glass jars, W is the weight of soil, Δc is the gas production, Δt is the sealed time for gas production and T is the temperature at which the experiment was conducted (25 °C).
Cumulative CH4 and N2O fluxes (μg kg−1) were calculated using the daily emissions over the 52-day period as described by Shahban et al. (2015a).
C u m m u l a t i v e   g a s   f l u x = i = 1 n R i × 24 × D i
where Ri is the gas emission (μg kg−1 h−1) of sampling dates, Di is the number of days in the sampling interval and n is the number of sampling times.

2.4. Chemical Analysis

After a 60-day incubation period, fresh soil samples (5 g) were extracted with 0.05 M K2SO4, shaken for 1 h, filtered through Whatman #42 filters and then analyzed for exchangeable NH4+ and NO3 on a flow-injection analyzer (Lachat Instruments, Loveland, CO, USA). The pH of the incubated soil samples in a soil:deionized water ratio of 1:2.5 was measured by using a pH meter. AP and soil organic carbon (SOC) were measured by using sodium bicarbonate (NaHCO3; 0.5 M)-extraction Mo-Sb spectrophotometry, and the potassium dichromate (K2Cr2O7) method [32].
For determination of MBP and MBC, we used the fumigation method [33,34]. In detail, incubated soil samples were exposed to chloroform for 1–2 days for the determination of both MBC and MBP. For MBC, fumigated and nonfumigated soil samples were extracted with 0.05 M K2SO4, shaken for 1 h, filtered and analyzed by using a TOC-VCPN (Multi N/C3100, Analytik Jena, AG, Germany) instrument. MBC was determined as the difference in the concentrations in the nonfumigated and fumigated soils divided by the extraction efficiency, which is 0.45 according to Beck et al. (1997) [35]. For soil MBP, fumigated and nonfumigated soil samples were extracted at a ratio of 1:20, shaken for 1 h and extracted immediately after being combined with 1 mL KH2PO4 (250 µGp mL−1). The soil MBP was calculated using an extraction efficiency of 0.40 [34].

2.5. Statistical Analysis

Statistical analyses were performed by using SPSS software version 21 (IBM SPSS Statistics; Chicago, IL, USA), and graphs were designed using SigmaPlot. Two-way analysis of variance (ANOVA) was used to analyze the replicated data, and Duncan tests were performed to identify the significant differences among the treatments and soil types. N2O, CH4 and soil microbial biomass activity were evaluated by two-way analysis of variance (ANOVA), which describes the two factors, the additions of phosphorus and glucose. Structural equation models were used to identify the direct and indirect effects between the treatments, soil properties and GHG emissions using the Amos package with SPSS 16.0 software (SPSS, Chicago, IL, USA).

3. Results

3.1. Effect of Phosphorus and Glucose Addition on N2O and CH4 Emissions

Glucose addition significantly increased the N2O fluxes rate from day 2 to day 11 during the incubation period and then reduced it until the end of the incubation period in the phosphorus-deficient (QY1) and -adequate soils (QY2 and QY3). Glucose addition increased the nitrous oxide (N2O) emission at day 11, which was 17.44 µg kg−1 in phosphorus-deficient soil (QY1) and 20.8 µg kg−1 and 24.7 µg kg−1 at day 9 in phosphorus-adequate soils (QY2 and QY3, respectively) compared to without glucose or its interactive effect with phosphorus. Nitrous oxide emissions gradually decreased until day 40 in the incubation study.
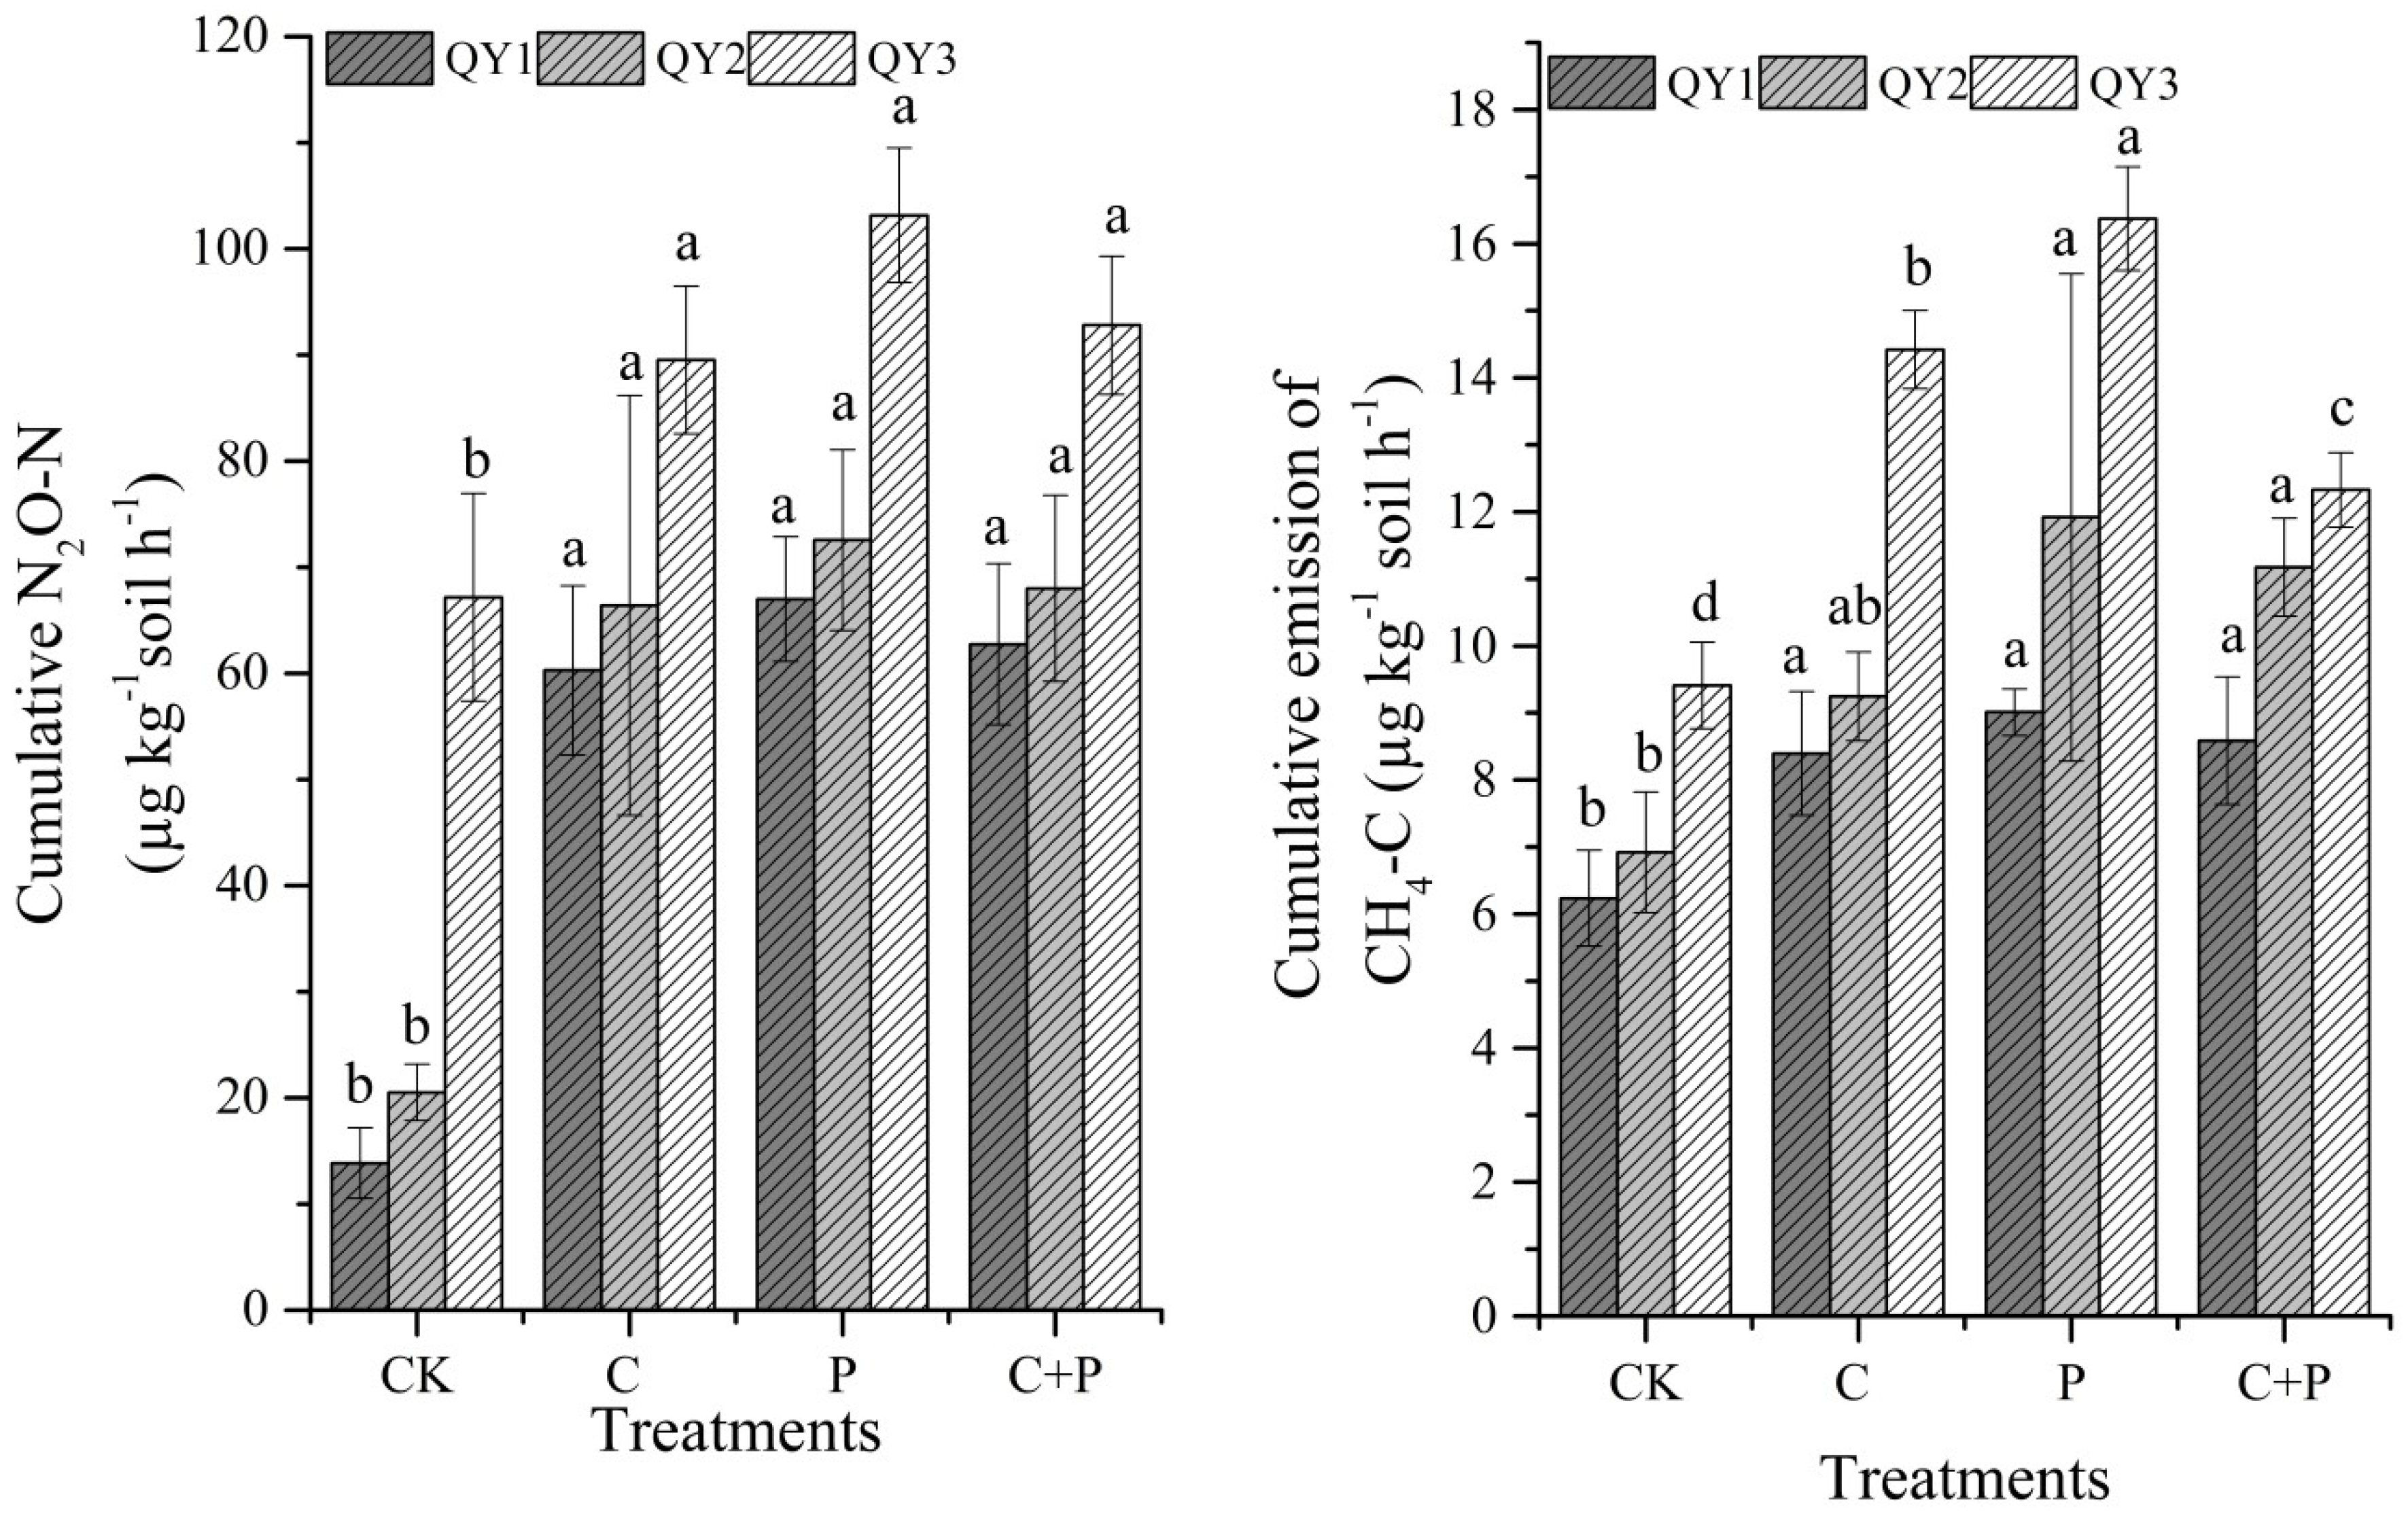
The immediate variations in the nitrous oxide fluxes rate were faster with the addition of glucose than in the other treatments (Figure 1). The highest fluxes in the combination of phosphorus and glucose (C + P) in the phosphorus-deficient soil (QY1) was 15.5 µg kg−1, while those in the phosphorus-adequate soils (QY2 and QY3) were 18.2 µg kg−1 and 22.6 µg kg−1, respectively. Similar to nitrous oxide fluxes, methane emissions on days 0, 1, 2, 5 and 13 were significantly higher with the addition of glucose than other treatments. The methane emissions were higher at the start of the incubation period and declined rapidly with time in treatments and soils. Adding glucose to phosphorus-deficient soil (QY1) resulted in a peak methane flux of 1.9 µg kg−1, while in the phosphorus-adequate soils (QY2 and QY3), the peak flux values were 1.52 and 2.6 µg kg−1, respectively, and they rapidly declined after 20 days of incubation. After 40 days, there were no significant differences among the treatments and soils. Considering the availability of phosphorus in one phosphorus-adequate soil, (QY3) had the highest methane emissions among the three soils (Figure 2). In the combination of phosphorus and glucose (C + P), the cumulative methane emissions and daily fluxes were higher in the phosphorus-adequate soil (QY3) than the other soils. The methane emissions and their cumulative values were significantly higher in the individual glucose and phosphorus-addition treatments than in the combined treatments (Figure 3).

3.2. Effects of Phosphorus and Glucose Addition on Soil Chemical Properties

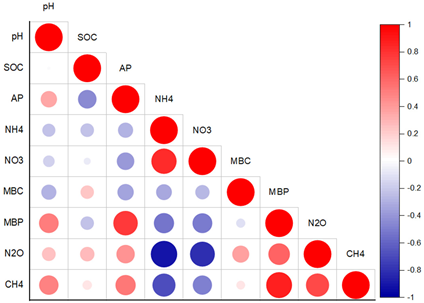
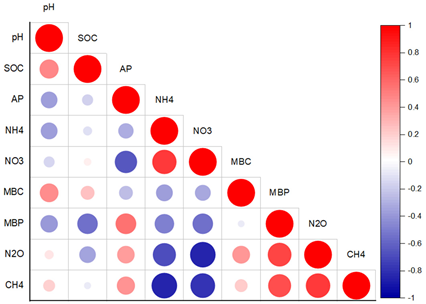
Both phosphorus and glucose addition had a significant effect on soil pH in phosphorus-deficient soil (QY1) (Table 2). In phosphorus-adequate soil (QY2), there were nonsignificant differences in pH among all the treatments. The pH decreased when phosphorus was added to phosphorus-adequate (QY3) soil. The interactive effect of glucose and phosphorus was nonsignificant in all soils (Table 2). SOC was significantly higher in the phosphorus-deficient soil (QY1) with the addition of glucose, while in the phosphorus-adequate soils (QY2 and QY3), the effects of sole glucose and phosphorus addition and their interactive effect were showed nonsignificant results. Soil AP increased significantly with phosphorus addition in phosphorous-deficient soil (QY1) and one phosphorus-adequate soil (QY2) (Table 2). High AP levels were measured in the phosphorus-deficient soil (QY1) under phosphorus addition, the value of which was 12.79 mg P kg−1, while the AP values of the phosphorus adequate soils (QY2, QY3) were 43.83 and 56.68 mg Pkg−1, respectively, under phosphorus addition. Glucose addition had a nonsignificant effect on phosphorus-deficient and phosphorus-adequate soils. Soil available phosphorus was significantly increased by phosphorus addition in the phosphorus-deficient soil but not in the phosphorus-adequate soils (Table 2 and Table 3). Furthermore, the addition of phosphorus to the phosphorus-deficient soil (QY1) may have influenced the exchangeable NH4+. Phosphorus addition without glucose addition also increased the NH4+ concentration in the phosphorus-deficient soil (QY1). In the phosphorus-adequate soils (QY2 and QY3), phosphorus and glucose addition significantly decreased the exchangeable NH4+ concentration. In the phosphorus-deficient soil (QY1), the addition of phosphorus and glucose and their interaction had nonsignificant effects on the NO3 concentration. In the phosphorus-adequate soils (QY2 and QY3), phosphorus addition and the interaction of glucose and phosphorus had significant effects on the NO3 concentration. The exchangeable NH4+ and NO3 were lower with glucose addition than without glucose addition in all soils (Table 2).

3.3. Alterations in Soil Microbial Biomass after Phosphorus and Glucose Addition

Glucose addition significantly increased the MBC in the phosphorus-deficient (QY1) and -adequate soils (QY2 and QY3) (Figure 4 and Figure 6, Table 2 and Table 3). In phosphorus-deficient soil (QY1), sole phosphorus and its interactive (P + C) effects significantly decreased MBC compared to the control and glucose-addition treatments. Phosphorus addition and its interaction with glucose (P + C) had nonsignificant effects on MBC in the phosphorus-adequate soils (QY2 and QY3) (Table 2 and Table 3). Phosphorus addition decreased MBC in the phosphorus-deficient (QY1) and -adequate soils. However, phosphorus addition significantly increased MBP in the phosphorus-deficient soil (QY1) and the phosphorus-adequate soils (QY2 and QY3) (Table 2 and Table 3, Figure 4 and Figure 6). Glucose addition had a nonsignificant effect on MBP in phosphorus-limited soil (QY1) and one phosphorus-adequate soil (QY2), while in the other phosphorus-adequate soil (QY3), glucose addition significantly decreased the MBP. The interactive effect of phosphorus and glucose (P + C) significantly decreased MBP in the phosphorus-adequate soils (QY2 and QY3). For MBC, the highest value was recorded in a phosphorus-adequate soil (QY3), at 175.8 mg kg−1, in the glucose-addition treatment (Table 2 and Table 3).

3.4. Relative Contribution of Different Soil Properties and Soil Microbial Biomass to CH4 and N2O Emissions

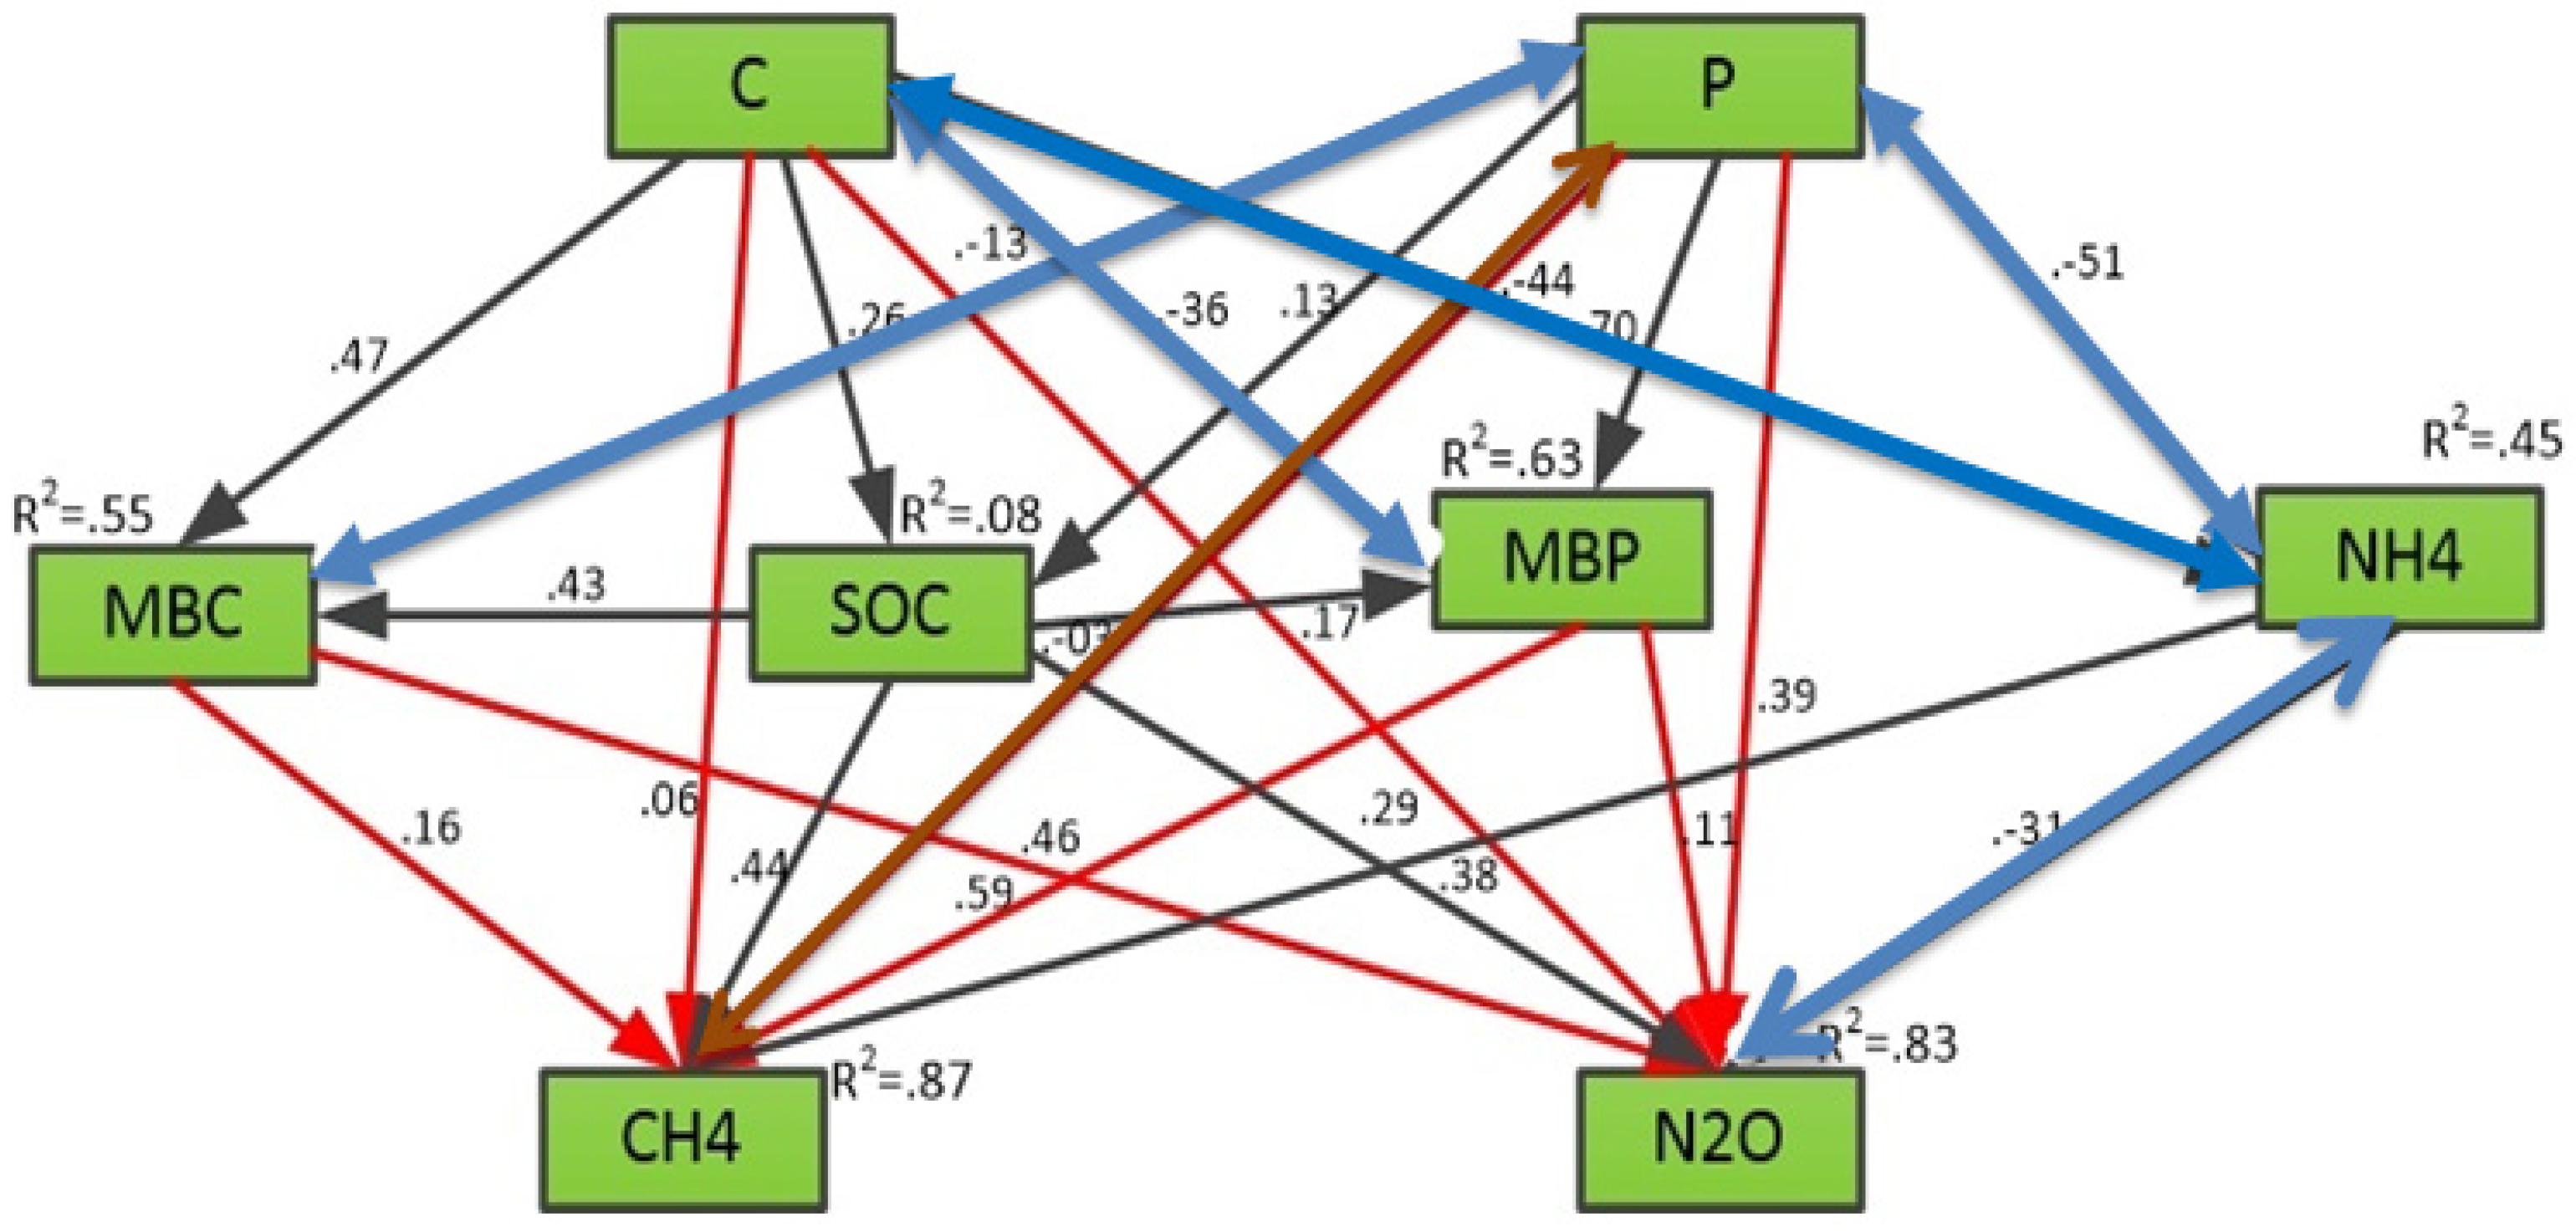
SOC had a nonsignificant relationship (p > 0.05) with glucose and phosphorus addition and a significant relationship with the net emissions of methane and nitrous oxide. However, a significant (p > 0.05) positive relationship was observed among GHG emissions, MBC and MBP. GHG (CH4 and N2O) emissions significantly increased with the addition of glucose and phosphorus. Furthermore, we used a structural equation model (SEM) to calculate the direct and indirect effects of glucose and phosphorus on SOC, NH4, MBP and MBA with GHG emissions of CH4 and N2O. It also shows the direct and indirect positive and negative relationships among the treatment and measured parameters (Figure 5).

4. Discussion

On the basis of this study, it is suggested that the nitrous oxide emission rate can be increased by high phosphorus availability because high phosphorus availability stimulates various nitrogen cycle processes, including nitrogen mineralization, which provides substrates for nitrifiers and denitrifiers [11,13] and developing anaerobic conditions suitable for denitrification by increasing heterotrophic respiration [12,14]. The alleviation of phosphorus limitation on nitrifying and/or denitrifying bacteria by increasing phosphorus availability may lead to increased N2O emissions [11,12,14,36]. From our results, it is clear that the addition of phosphorus to phosphorus-deficient (Q1) and phosphorus-adequate soils (QY2 and QY3) increases the daily fluxes, as well as the cumulative N2O emissions (Figure 1, Figure 2 and Figure 3 and Figure 6). Glucose addition resulted in a significant increase in the cumulative emissions of both gases (CH4 and N2O) (Figure 3 and Figure 6) in phosphorus-deficient soil (QY1) and phosphorus-adequate soils (QY2 and QY3), suggesting that the labile organic carbon in these soils limits denitrifying microbes but also affects the heterotrophic microbial community. However, the N2O/N2 ratio often decreases under high carbon availability. The nitrous oxide emission rates significantly increased at days 0, 1 and 3 and up to day 17, and the cumulative nitrous oxide emission strongly increased the occurrence of microbial denitrification. Glucose addition directly influenced the denitrification process by supplying donor electrons to denitrifiers and indirectly by depressing O2 absorption with heterotrophic microbial respiration stimulation [31,37].
Glucose addition also had a sequential effect on N2O and CH4 emissions, especially in the phosphorus-adequate soils (Figure 1, Figure 2 and Figure 6). In the initial days of the experiment, nitrous oxide emissions were markedly high with the addition of glucose and then decreased (at days 20–40) in phosphorus-deficient and phosphorus-adequate soils (Figure 1 and Figure 3), which could suggest that denitrifiers were no longer restricted by carbon but somewhat restricted by NO3 in the soil. In the presence of readily available carbon substrates, a rapid initial NO3 respiration of denitrifiers may have subsequently reduced the NO3 with the ready availability of carbon substrates. The rapid initial NO3 respiration by denitrifiers may decrease the NO3 concentration in soils with added glucose [11,29,30] and, hence, decrease denitrification at the later stage of the experiment.
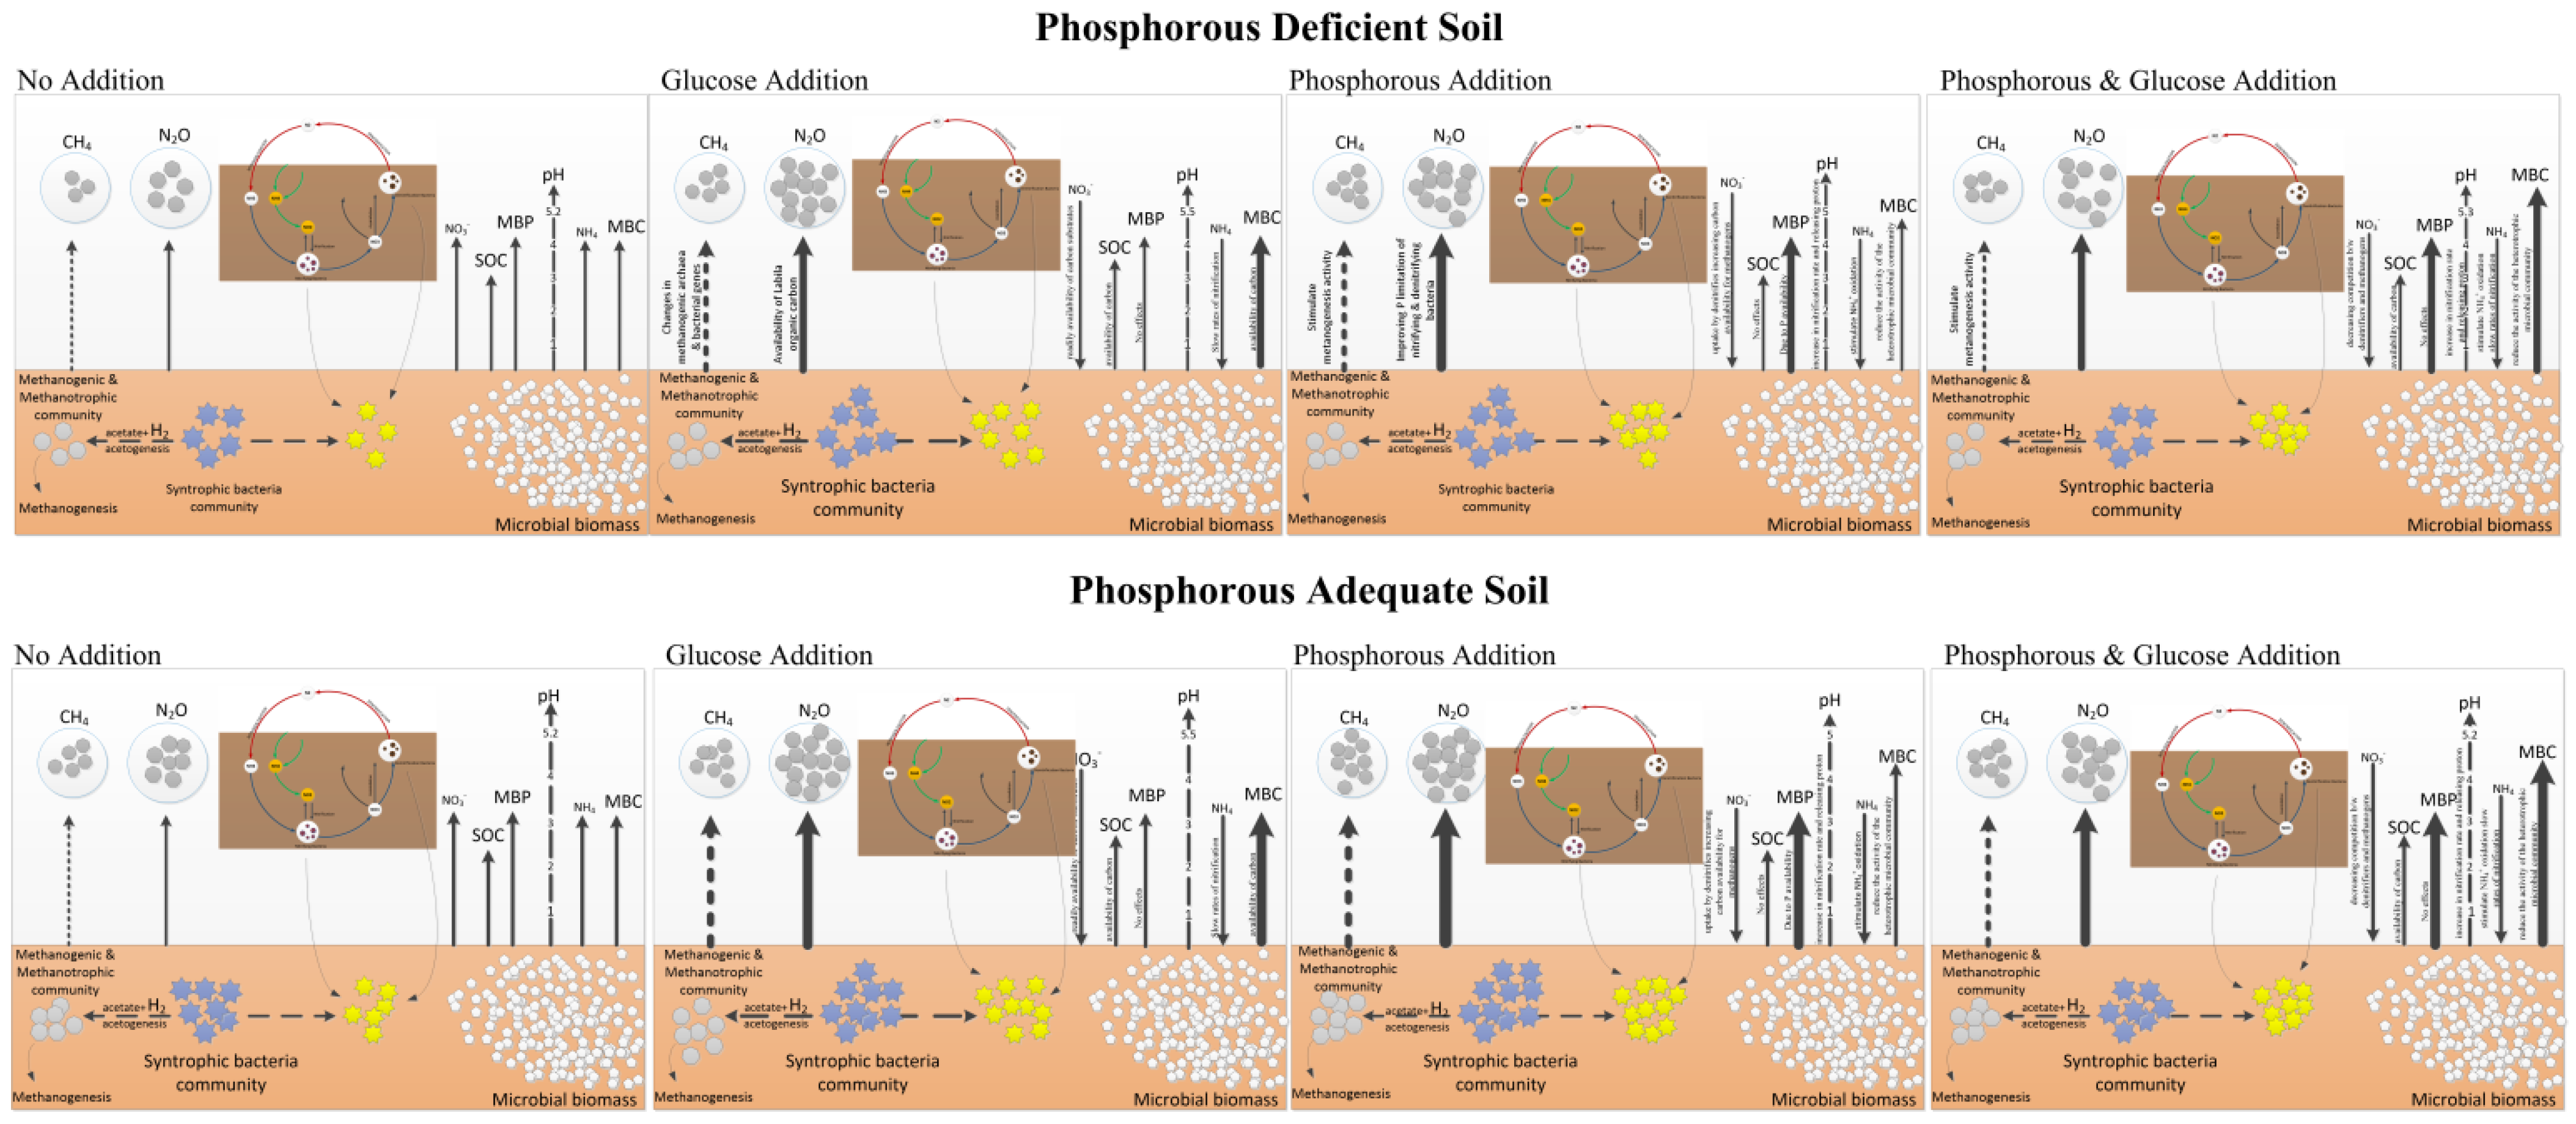
In our conceptual figure and results, phosphorus addition did not have any important consequences for the cumulative nitrous oxide emissions (Figure 3 and Figure 6). Previous studies have proposed that, in some cases, nitrous oxide emissions were lower or higher with the addition of phosphorus [12,29,31]. Mori et al. suggested that relieving phosphorus limitation can stimulate microbial immobilization and, hence, decrease the availability of substrates for the nitrification and denitrification process, which results in decreasing N2O emissions [12,13,14,29]. In the present study, CH4 emissions increased with the addition of glucose in phosphorus-deficient and phosphorus-adequate soils (Figure 2). Soil quality and carbon content may play an important role in these processes. In our research, the addition of phosphorus to different soils under phosphorus limitation significantly increased CH4 fluxes to some extent, compared to those in the control.
The changes in CH4 fluxes in this study can be closely linked to the results of Le Mer and Roger (2001) [38], who recommend that the changes in methanogenic archaea and bacterial genes are the evidence that increase CH4 fluxes [39,40]. In brief, two processes usually control CH4 emissions: the first is the production of methane involving the process in which methanogenic archaea consume substrates for methane production [41] and the second is the consumption of methane involving in the process of oxidation of methane to CO2 by methanotrophic bacteria, which is not significant under laboratory conditions [42]. The results of the current study show that in soils with different phosphorus availability limitations, the CH4 production was directly influenced by phosphorus addition and not influenced by the available carbon addition. However, the addition of phosphorus slowed NO3 uptake by denitrifiers and thus increasing carbon availability for methanogens by decreasing the competition between methanogens for carbon [40,41]. Therefore, during the delayed NO3 uptake, the expected CH4 production was increased. We assumed that in the QF soil site located in the south of China in Hunan province, the soil methanogens were adapted to the flooded conditions that were responsible for the high CH4 emissions. However, previous studies found that phosphorus addition caused a short-term increase in CH4 emissions from peat soils and paddy soils, which is in line with this study’s results [43].
A significant reduction in soil pH with the addition of phosphorus was observed in our results (Table 2 and Table 3), and this reduction might have affected the microbial biomass and the microbial community [44,45]. It is still unclear why the soil pH decreased upon phosphorus addition since the added phosphorus was in a solution with the same pH as that of the soil. One of the possible explanations could be that upon phosphorus addition, an increase in the nitrification rate occurred. Hue and Adams (1984) observed slow rates of nitrification in soil solutions with low phosphorus concentrations [39,46]. At the end of incubation with the addition of phosphorus, the NH4+ concentration of the soil decreased (Table 2 and Table 3); however, the decrease was significant only without carbon addition. The reduced soil pH with phosphorus addition may reduce the activity of the heterotrophic microbial community and inhibit the growth of denitrifiers [42,47], which could possibly offset the N2O emissions stimulated by denitrification. With declining pH, the ratio of N2O to N2 frequently increases [48,49]; however, a net reduction occurs in the production of N2O in response to reduced soil pH after P addition owing to an overall decrease in the denitrification rate [47,50]. The strongest impact on the environment, due to the GHG emissions to the atmosphere, thus contributing to the greenhouse effect, is due to nitrogen fertilization, both mineral and natural. On average, in the technologies under study, 61% of the total GHG emissions came from fertilization [51]. To understand the effect of phosphorus addition on N2O emissions, further studies of the microbial community composition need to be conducted. In addition, we can study energy efficiency on different soils with different cropping systems.

5. Conclusions

We summarized the main results of this study, which showed that the addition of phosphorus and glucose initially increased N2O and CH4 emissions in all studied soils. Later, the values of the N2O and CH4 emissions decreased over time until the end of the incubation period. The temporal fluctuations in the emissions of both GHGs were due to changes in the limiting factors for denitrification, such as soil moisture and soluble organic carbon content over time. Furthermore, high labile carbon availability in the presence of sufficient NO3 can initially increase nitrous oxide emissions, while rapid denitrification and NO3 immobilization can subsequently reduce the soil NO3 concentration and N2O production. This study also suggests that phosphorus addition is an effective measure to increase MBP and can induce changes in soil properties. Further research on the effects of the nitrification rate on NO and N2O emissions from paddy soils and their production under different phosphorus levels and water regimes is worthwhile for assessing the environmental and climatic impacts of N transformation in paddy soils, and further testing will be required to determine whether these effects occur in other land types.

Author Contributions

A.S. and J.H.: conceptualization, data curation, formal analysis, methodology, writing—original draft, writing—review and editing. H.Z.: conceptualization, resources, writing—review and editing. M.N.K.: data curation, methodology. J.D. and S.A.: data curation, investigation, methodology. N.A.D. and L.Z.: formal analysis, resources. T.H.: data curation, resources. D.L. and S.L.: investigation, resources. Y.X.: formal analysis, methodology. L.L. and J.G.: conceptualization, formal analysis. Z.H.: investigation. S.F.: writing—review and editing. All authors have read and agreed to the published version of the manuscript.

Funding

This research was financially supported by the National Key Research and Development Program of China (2016YFD0300901 and 2017YFD0800101) and the Fundamental Research Funds for Central Non-profit Scientific Institution (GY2022-13-5, G2022-02-2, G2022-02-3 and G2022-02-10).

Data Availability Statement

Data are contained within the article.

Acknowledgments

We are grateful to all the managers of long-term experiments at the National Observation Station of Qiyang Agri-ecology System, Hunan province, China.

Conflicts of Interest

The authors declare no conflict of interest in this manuscript.

References

  1. Cook, E. (Ed.) Agriculture, Forestry and Fishery Statistics—2015 Edition; Publications Office of the European Union: Luxembourg, 2016. [Google Scholar]
  2. Myhre, G.; Shindell, D.; Bréon, F.M.; Collins, W.; Fuglestvedt, J.; Huang, J.; Koch, D.; Lamarque, J.F.; Lee, D.; Mendoza, B.; et al. Anthropogenic and natural radiative forcing. In Climate Change 2013. The Physical Science Basis; Stocker, T.F., Qin, D., Plattner, G.-K., Tignor, M., Allen, S.K., Boschung, J., Nauels, A., Xia, Y., Bex, V., Midgley, P.M., Eds.; Cambridge University Press: Cambridge, UK, 2013; p. 714. [Google Scholar]
  3. Yang, B.; Xiong, Z.; Wang, J.; Xu, X.; Huang, Q.; Shen, Q. Mitigating net global warming potential and greenhouse gas intensities by substituting chemical nitrogen fertilizers with organic fertilization strategies in rice—Wheat annual rotation systems in China: A 3-year field experiment. Ecol. Eng. 2015, 81, 289–297. [Google Scholar] [CrossRef]
  4. Butterbach-Bahl, K.; Diaz-Pines, E.; Dannenmann, M. Soil traces gas emissions and climate change. In Global Environmental Change; Freedman, B., Ed.; Springer: Berlin/Heidelberg, Germany, 2014; pp. 325–334. [Google Scholar]
  5. Ravishankara, A.R.; Daniel, J.S.; Portmann, R.W. Nitrous oxide (N2O): The dominant ozone-depleting substance emitted in the 21st century. Science 2009, 326, 123–125. [Google Scholar] [CrossRef] [PubMed]
  6. Food and Agricultural Organization of the United Nations. OECD-FAO Agricultural Outlook 2011–2030; Food and Agricultural Organization of the United Nations: Rome, Italy, 2010. [Google Scholar]
  7. Bridgham, S.D.; Cadillo-Quiroz, H.; Keller, J.K.; Zhuang, Q. Methane emissions from wetlands: Biogeochemical, microbial, and modelling perspectives from local to global scales. Glob. Change Biol. 2013, 19, 13–25. [Google Scholar] [CrossRef]
  8. Liu, R.; Hayden, H.L.; Suter, H.; Hu, H.; Lam, S.K.; He, J.-Z.; Mele, P.M.; Chen, D. The effect of temperature and moisture on the source of N2O and contributions from ammonia oxidizers in an agricultural soil. Biol. Fertil. Soils 2017, 53, 141–152. [Google Scholar] [CrossRef]
  9. Dalal, R.C.; Wang, W.; Robertson, G.; Parton, W.J. Nitrous oxide emission from Australian agricultural lands and mitigation options: A review. Soil Res. 2003, 41, 165–195. [Google Scholar] [CrossRef]
  10. Conrad, R. Microbial ecology of methanogens and methanotrophs. Adv. Agron. 2007, 96, 1–63. [Google Scholar]
  11. Mori, T.; Ohta, S.; Ishizuka, S.; Konda, R.; Wicaksono, A.; Heriyanto, J.; Hardjono, A. Effects of phosphorus addition on N2O and NO emissions from soils of an Acacia mangium plantation. Soil Sci. Plant Nutr. 2010, 56, 782–788. [Google Scholar] [CrossRef]
  12. Mori, T.; Ohta, S.; Ishizuka, S.; Konda, R.; Wicaksono, A.; Heriyanto, J.; Hardjono, A. Effects of phosphorus addition with and without ammonium, nitrate, or glucose on N2O and NO emissions from soil sampled under Acacia mangium plantation and incubated at 100% of the water-filled pore space. Biol. Fertil. Soils 2013, 49, 13–21. [Google Scholar] [CrossRef]
  13. Mehnaz, K.R.; Keitel, C.; Dijkstra, F.A. Effects of carbon and phosphorus addition on microbial respiration, N2O emission, and gross nitrogen mineralization in a phosphorus-limited grassland soil. Biol. Fertil. Soils 2018, 54, 481–493. [Google Scholar] [CrossRef]
  14. Mehnaz, K.R.; Dijkstra, F.A. Denitrification and associated N2O emissions are limited by phosphorus availability in a grassland soil. Geoderma 2016, 284, 34–41. [Google Scholar] [CrossRef]
  15. Yvon-Durocher, G.; Allen, A.P.; Bastviken, D.; Conrad, R.; Gudasz, C.; St-Pierre, A.; Thanh-Duc, N.; del Giorgio, P. Methane fluxes show consistent temperature dependence across microbial to ecosystem scales. Nature 2014, 507, 488–491. [Google Scholar] [CrossRef] [PubMed] [Green Version]
  16. Bodelier, P.E. Bypassing the methane cycle. Nature 2015, 523, 534–535. [Google Scholar] [CrossRef] [PubMed]
  17. Conrad, R.; Chan, O.C.; Claus, P.; Casper, P. Characterization of methanogenic archaea and stable isotope fractionation duringmethane production in the profundal sediment of an oligotrophic lake (Lake Stechlin, Germany). Limnol. Oceanogr. 2007, 52, 13–93. [Google Scholar] [CrossRef]
  18. Krüger, M.; Frenzel, P.; Kemnitz, D.; Conrad, R.; Krüger, M. Activity, structure and dynamics of the methanogenic archaeal community in a flooded Italian rice field. FEMS Microbiol. Ecol. 2005, 51, 323–331. [Google Scholar] [CrossRef]
  19. Ma, K.; Conrad, R.; Lu, Y. Responses of methanogen mcrA genes and their transcripts to an alternate dry/wet cycle of paddy field soil. Appl. Environ. Microbiol. 2012, 78, 445–454. [Google Scholar] [CrossRef]
  20. Garland, G.; Bünemann, E.K.; Oberson, A.; Frossard, E.; Snapp, S.; Chikowo, R.; Six, J. Phosphorus cycling within soil aggregate fractions of a highly weathered tropical soil: A conceptual model. Soil Biol. Biochem. 2018, 116, 91–98. [Google Scholar] [CrossRef]
  21. Medvedeff, C.A.; Inglett, K.S.; Inglett, P.W. Evaluation of direct and indirect phosphorus limitation of methanogenic pathways in a calcareous subtropical wetland soil. Soil Biol. Biochem. 2014, 69, 343–345. [Google Scholar] [CrossRef]
  22. Conrad, R.; Klose, M.; Claus, P. Phosphate inhibits acetotrophic methanogenesis on rice roots. Appl. Environ. Microbiol. 2000, 66, 828–831. [Google Scholar] [CrossRef]
  23. Lund, M.; Christensen, T.R.; Mastepanov, M.; Lindroth, A.; Str€om, L. Effects of N and P fertilization on the greenhouse gas exchange in two northern peat lands with contrasting N deposition rates. Biogeosciences 2009, 6, 2135–2144. [Google Scholar] [CrossRef]
  24. Zhang, T.; Zhu, W.; Mo, J.; Liu, L.; Dong, S. Increased phosphorus availability mitigates the inhibition of nitrogen deposition on CH4 uptake in an old-growth tropical forest, southern China. Biogeosciences 2011, 8, 2805–2813. [Google Scholar] [CrossRef]
  25. Cleveland, C.C.; Townsend, A.R.; Schmidt, S.K. Phosphorus limitation of microbial processes in moist tropical forests: Evidence from short-term laboratory incubations and field studies. Ecosystems 2002, 5, 680–691. [Google Scholar] [CrossRef]
  26. Ilstedt, U.; Singh, S. Nitrogen and phosphorus limitations of microbial respiration in a tropical phosphorus-fixing acrisol (ultisol) compared with organic compost. Soil Biol. Biochem. 2005, 37, 1407–1410. [Google Scholar] [CrossRef]
  27. Cleveland, C.C.; Liptzin, D. C:N:P stoichiometry in soil: Is there a Bred field ratio for the microbial biomass? Biogeochemistry 2007, 85, 235–252. [Google Scholar] [CrossRef]
  28. Turner, B.L.; Wright, S.J. The response of microbial biomass and hydrolytic enzymes to a decade of nitrogen, phosphorus, and potassium addition in a lowland tropical rain forest. Biogeochem 2014, 117, 115–130. [Google Scholar] [CrossRef]
  29. Mori, T.; Ohta, S.; Ishizuka, S.; Konda, R.; Wicaksono, A.; Heriyanto, J. Phosphorus application reduces N2O emissions from tropical leguminous plantation soil when phosphorus uptake is occurring. Biol. Fertil. Soils 2014, 50, 45–51. [Google Scholar] [CrossRef]
  30. Mori, T.; Yokoyama, D.; Kitayama, K. Contrasting effects of exogenous phosphorus application on N2O emissions from two tropical forest soils with contrasting phosphorus availability. SpringerPlus 2016, 5, 12–37. [Google Scholar] [CrossRef]
  31. Mori, T.; Wachrinrat, C.; Staporn, D.; Meunpong, P.; Suebsai, W.; Matsubara, K.; Boonsri, K.; Lumban, W.; Kuawong, M.; Phukdee, T.; et al. Effects of phosphorus addition on nitrogen cycle and fluxes of N2O and CH4 in tropical tree plantation soils in Thailand. Agric. Nat. Resour. 2017, 51, 91–95. [Google Scholar] [CrossRef]
  32. Olsen, S.R. Estimation of Available Phosphorus in Soils by Extraction with Sodium Bicarbonate; US Government Printing Office: Washington, DC, USA, 1954. [Google Scholar]
  33. Brookes, P.; Landman, A.; Pruden, G.; Jenkinson, D. Chloroform fumigation and the release of soil nitrogen: A rapid direct extraction method to measure microbial biomass nitrogen in soil. Soil Biol. Biochem. 1985, 17, 837–842. [Google Scholar] [CrossRef]
  34. Brookes, P.C.; Powlson, D.S.; Jenkinson, D.S. Measurement of microbial biomass phosphorus in soil. Soil Biol. Biochem. 1982, 14, 319–329. [Google Scholar] [CrossRef]
  35. Beck, T.; Joergensen, R.; Kandeler, E.; Makeschin, F.; Nuss, E.; Oberholzer, H.; Scheu, S. An inter-laboratory comparison of ten different ways of measuring soil microbial biomass C. Soil Biol. Biochem. 1997, 29, 1023–1032. [Google Scholar] [CrossRef]
  36. Davidson, E.A. The contribution of manure and fertilizer nitrogen to atmospheric nitrous oxide since 1860. Nat. Geosci. 2009, 2, 659–662. [Google Scholar] [CrossRef]
  37. Morley, N.; Baggs, E.M. Carbon and oxygen controls on N2O and N2 production during nitrate reduction. Soil Biol. Biochem. 2010, 42, 1864–1871. [Google Scholar] [CrossRef]
  38. Le Mer, J.; Roger, P. Production, oxidation, emission and consumption of methane by soils: A review. Eur. J. Soil Biol. 2001, 37, 25–50. [Google Scholar] [CrossRef]
  39. Kim, G.W.; Gwon, H.S.; Jeong, S.T.; Hwang, H.Y.; Kim, P.J. Different responses of nitrogen fertilization on methane emission in rice plant included and excluded soils during cropping season. Agric. Ecosyst. Environ. 2016, 230, 162–168. [Google Scholar] [CrossRef]
  40. Signor, D.; Cerri, C.E.P. Nitrous oxide emissions in agricultural soils: A review. Pesqui. Agropecuária Trop. 2013, 43, 322–338. [Google Scholar] [CrossRef]
  41. Zhang, Y.; Wang, Y.Y.; Su, S.L.; Li, C.S. Quantifying methane emissions from rice paddies in Northeast China by integrating remote sensing mapping with a biogeochemical model. Biogeosciences 2011, 8, 1225–1235. [Google Scholar] [CrossRef]
  42. Kim, S.Y.; Veraart, A.J.; Meima-Franke, M.; Bodelier, P.L.E. Combined effects of carbon, nitrogen and phosphorus on CH4 production and denitrification in wetland sediments. Geoderma 2015, 259–260, 354–361. [Google Scholar] [CrossRef]
  43. Han, X.G.; Sun, X.; Wang, C.; Wu, M.X.; Dong, D.; Zhong, T.; Thies, J.E.; Wu, W.X. Mitigating methane emission from paddy soil with rice-straw biochar amendment under projected climate change. Sci. Rep. 2016, 6, 24731. [Google Scholar] [CrossRef]
  44. Bååth, E.; Anderson, T.-H. Comparison of soil fungal/bacterial ratios in a pH gradient using physiological and PLFA-based techniques. Soil Biol. Biochem. 2003, 35, 955–963. [Google Scholar] [CrossRef]
  45. Krüger, M.; Frenzel, P.; Conrad, R. Microbial processes influencing methane emission from rice fields. Glob. Chang. Biol. 2001, 7, 49–63. [Google Scholar] [CrossRef]
  46. Hue, N.V.; Adams, F. Effect of phosphorus level on nitrification rates in three low-phosphorus ultisols. Soil Sci. 1984, 137, 324–331. [Google Scholar] [CrossRef]
  47. Wang, Q.; Liu, Y.-R.; Zhang, C.-J.; Zhang, L.-M.; Han, L.-L.; Shen, J.-P.; He, J.-Z. Responses of soil nitrous oxide production and abundances and composition of associated microbial communities to nitrogen and water amendment. Biol. Fertil. Soils 2017, 53, 601–611. [Google Scholar] [CrossRef]
  48. Wrage, N.; Velthof, G.L.; van Beusichem, M.L.; Oenema, O. Role of nitrifier denitrification in the production of nitrous oxide. Soil Biol. Biochem. 2001, 33, 1723–1732. [Google Scholar] [CrossRef]
  49. Song, C.; Yang, G.; Liu, D.; Mao, R. Phosphorus availability as a primary constraint on methane emission from a freshwater wetland. Atmos. Environ. 2012, 59, 202–206. [Google Scholar] [CrossRef]
  50. Krause, S.M.B.; Le Roux, X.; Niklaus, P.A.; Van Bodegom, P.M.; Lennon, J.T.; Bertilsson, S.; Grossart, H.-P.; Philippot, L.; Bodelier, P.L.E. Trait-based approaches for understanding microbial biodiversity and ecosystem functioning. Front. Microbiol. 2014, 5, 251. [Google Scholar] [CrossRef]
  51. Konieczna, A.; Roman, K.; Borek, K.; Grzegorzewska, E. GHG and NH3 emissions vs. energy efficiency of maize production technology: Evidence from Polish farms; A further study. Energies 2021, 14, 5574. [Google Scholar] [CrossRef]
Figure 1. N2O emission rates from phosphorus-deficient (QY1) and phosphorous-adequate soils (QY2, QY3) with and without glucose (Glu) addition during the incubation period. Gas emission rates are in log scale. CK: control; C, glucose addition; P, phosphorus addition; C + P, glucose and phosphorus addition. Error bars represent standard error (n = 3). Note: phosphorus-deficient soil is represented by QY1 and phosphorus-adequate soils are denoted by QY2 and QY3.
Agronomy 12 02368 g001
Figure 2. CH4 emission fluxes rate from phosphorus-deficient (QY1) and phosphorus-adequate soils (QY2, QY3) with and without glucose (Glu) and/or phosphorus (P) addition per day during incubation period. CK: control; C, glucose addition; P, phosphorus addition; C + P, glucose and phosphorus addition. Error bars represent standard error (n = 3). Note: phosphorus-deficient soil is represented by QY1 and phosphorous-adequate soils are denoted by QY2 and QY3.
Agronomy 12 02368 g002
Figure 3. Mean cumulative N2O and CH4 emissions from phosphorus-deficient (QY1) and -adequate soils (QY2, QY3) with and without glucose (Glu) and/or phosphorus (P) addition during 60 days of incubation. CK: control; C, glucose addition; P, phosphorus addition; C + P, glucose and phosphorus addition. Different letters indicate significant differences between treatments of each soil type. Error bars represent standard error (n = 3). Note: phosphorus-deficient soil is represented by QY1 and phosphorous-adequate soils are denoted by QY2 and QY3.
Agronomy 12 02368 g003
Figure 4. Soil microbial biomass carbon and phosphorus (MBC, MBP) concentrations in phosphorus-deficient (QY1) and phosphorus-adequate soils (QY2, QY3) with glucose and phosphorus addition during incubation period. CK: control; C, glucose addition; P, phosphorus addition; C + P, glucose and phosphorus addition. Different letters indicate significant differences between treatments of each soil type. Note: Phosphorus-deficient soil is represented by QY1 and soils with adequate phosphorus are denoted by QY2 and QY3.
Agronomy 12 02368 g004
Figure 5. Structural equation model (SEM) showing direct and direct positive (red arrows), direct negative (brown double arrow), indirect and indirect positive (black arrows) and indirect negative (blue double arrows) effects of different soil parameters and greenhouse gases (GHG) under with and without glucose and phosphorus addition during incubation period.
Agronomy 12 02368 g005
Figure 6. Conceptual diagram of practical and hypothetical effects of applied treatment in current study.
Agronomy 12 02368 g006
Table 1. Fertility status of different soil fields used in this experiment.
FieldspHSOC (gkg−1)AP
(mgPkg−1)
TP
(g·kg−1)
TN
(g·kg−1)
AN
(mgNkg−1)
P-deficient soil (QY1)5.54 ± 0.1318.1 ± 0.919.03 ± 0.671.47 ± 0.051.9 ± 0.09189.6 ± 14.7
P-adequate soil (QY2)5.59 ± 0.0620.8 ± 1.239.3 ± 1.11.98 ± 0.162.1 ± 0.05243.1 ± 57.2
P-adequate soil (QY3)5.66 ± 0.0328.9 ± 0.5856.8 ± 7.92.17 ± 0.132.8 ± 0.03275.8 ± 43.2
Note: Mean ± standard error (SE, n = 3) of soil pH, soil organic carbon (SOC), soil available phosphorous (AP), total phosphorous (TP), total nitrogen (TN) and available nitrogen (AN).
Table 2. Mean ± standard error (SE, n = 3) of soil pH, soil organic carbon (SOC), soil available phosphorous (AP), exchangeable ammonium (NH4+), nitrate (NO3), microbial biomass carbon (MBC) and microbial biomass phosphorous (MBP) in phosphorous-deficient (QY1) and -adequate soils’ (QY2 and QY3) responses to glucose and phosphorus addition during incubation period. Different letters indicate significant differences. ns means non-significant.
Phosphorus-Deficient Soil (QY1)
TreatmentspHSOCAPNH4NO3MBCMBP
Glu addition p addition gkg−1mgPkg−1mgNkg−1mgNkg−1mgCkg−1mgPkg−1
WithoutWithout5.25 ± 0.08 b16.4 ± 1.18 ab9.6 ± 1.1 bc1.20 ± 0.5 a8.09 ± 0.88 a144.6 ± 3.9 bc14.2 ± 1.3 b
WithWithout5.51 ± 0.15 a18.2 ± 1.36 a7.9 ± 1.3 c0.38 ± 0.04 b7.16 ± 0.97 ab168.5 ± 5.04 a13.1 ± 0.78 b
WithoutWith5.06 ± 0.06 c16.1 ± 0.96 b12.7 ± 2.8 a0.34 ± 0.04 b4.75 ± 0.96 c139.6 ± 5.7 c20.7 ± 3.0 a
WithWith5.33 ± 0.59 b17.6 ± 0.99 ab10.1 ± 3.3 b0.49 ± 0.09 b6.05 ± 0.46 bc150.4 ± 3.2 b16.1 ± 1.7 ab
ANOVA p values
Glu0.0230.050.089nsns0.0003ns
P0.016ns0.066nsns0.0020.013
P × Cnsnsns0.020.0310.032ns
Phosphorus-Adequate Soil (QY2)
TreatmentspHSOCAPNH4NO3MBCMBP
Glu additionp addition gkg−1mgPkg−1mgNkg−1mgNkg−1mgCkg−1mgPkg−1
WithoutWithout5.2 ± 0.2 a20.6 ± 2.3 a41.6 ± 5.3 bc1.76 ± 0.22 a9.48 ± 1.5 a141.1 ± 13.7 b14.0 ± 0.6 b
WithWithout5.56 ± 0.2 a24.4 ± 4.0 a40.4 ± 7.2 c0.419 ± 0.13 b7.18 ± 0.64 b160.8 ± 7.4 a14.4 ± 1.1 b
WithoutWith5.12 ± 0.40 a19.7 ± 1.3 a43.8 ± 9.7 a0.298 ± 0.08 b5.97 ± 1.2 b143.3 ± 3.6 b24.7 ± 3.4 a
WithWith5.30 ± 0.1 a22.4 ± 2.4 a43.0 ± 5.5 ab0.455 ± 0.12 b6.76 ± 0.25 b152.8 ± 5.7 ab17.8 ± 1.7 b
ANOVA p values
Glunsnsnsnsns0.0125ns
Pnsns0.007nsnsns0.049
P × Cnsnsns0.0050.035nsns
Phosphorus-Adequate Soil (QY3)
TreatmentspHSOCAPNH4NO3MBCMBP
Glu additionp addition gkg−1mgPkg−1mgNkg−1mgNkg−1mgCkg−1mgPkg−1
WithoutWithout5.08 ± 0.06 b25.6 ± 1.3 a52.1 ± 11.4 ab1.70 ± 0.52 a10.4 ± 1.8 a169.1 ± 3.5 c18.42 ± 1.1 b
WithWithout5.52 ± 0.25 a28.4 ± 1.5 a51.0 ± 15.8 b0.47 ± 0.06 b7.85 ± 0.33 b182.8 ± 3.4 a16.8 ± 0.97 b
WithoutWith5.06 ± 0.20 ab24.1 ± 2.3 a56.6 ± 8.4 a0.40 ± 0.02 b6.74 ± 0.45 b162.3 ± 7.6 bc30.3 ± 3.4 a
WithWith5.21 ± 0.09 b27.1 ± 2.2 a53.3 ± 5.3 ab0.613 ± 0.25 b8.46 ± 1.2 b171.7 ± 6.2 ab21.04 ± 1.1 b
ANOVA p values
Glunsnsnsnsnsnsns
Pnsnsnsnsnsns0.05
P × Cnsnsns0.0020.010ns0.005
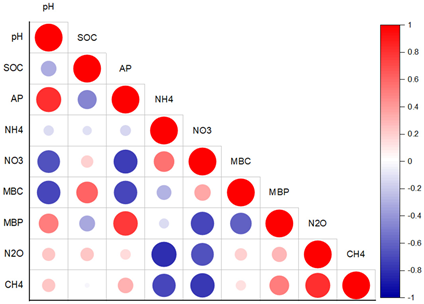
Table 3. Pearson correlation among different variables.
Phosphorus-deficient soil (QY1)
Agronomy 12 02368 i001
Phosphorous-adequate soil (QY2)
Agronomy 12 02368 i002
Phosphorus-adequate soil (QY3)
Agronomy 12 02368 i003
Node sizes show correlation strength.
Publisher’s Note: MDPI stays neutral with regard to jurisdictional claims in published maps and institutional affiliations.