Article

Different Drought Tolerance Strategy of Wheat Varieties in Spike Architecture

1
Department of Crop Sciences, Breeding and Plant Medicine, Faculty of AgriSciences, Mendel University in Brno, 613 00 Brno, Czech Republic
2
Department of Agrosystems and Bioclimatology, Faculty of AgriSciences, Mendel University in Brno, 613 00 Brno, Czech Republic
3
Department of Genetics and Breeding, Cereal Research Institute Kroměříž, 767 01 Kroměříž, Czech Republic
4
Plant Stress Biology and Biotechnology, Crop Research Institute, 161 06 Prague, Czech Republic
*
Author to whom correspondence should be addressed.
Agronomy 2022, 12(10), 2328; https://doi.org/10.3390/agronomy12102328
Submission received: 31 August 2022 / Revised: 23 September 2022 / Accepted: 25 September 2022 / Published: 27 September 2022

Abstract

:
Spike characteristics include spike length, total spikelet number per spike, number of fertile flowers, spike density, spike fertility, grain number, thousand kernel weight, the number of spikes per square meter, harvest index and the grain yield during the flowering and ripening stage. The six winter and one facultative variety differed in earliness, derived in part from the allele of the Ppd-D1 gene and phenological observation. The two sites significantly differed in the soil moisture, which varied during continual microclimate monitoring. The spike architecture of winter wheat was affected by drought. The plant samples from the site FIELD 2 (more drought stressed) showed a higher reduction in spike characteristics such as a lower spike length, total spikelet number, number of fertile flowers and spike fertility, leading to a lower yield than the site FIELD 1. Both early and late varieties possess compensatory abilities to create the grain yield during drought stress; however, the timing and duration of exposure to drought determine the application and success of the compensatory ability. In our experiment, the late varieties (photoperiod sensitive) performed better in yield than the early varieties during both growing seasons. That is at odds with the generally recommended “drought escape strategy” (early varieties) and suggests a possible direction for variety selection and breeding in arid areas in Central Europe.

Graphical Abstract

1. Introduction

Agricultural drought can be explained as soil moisture reduction to the extent that the crop yield is negatively affected [1]. Water stress caused by drought is considered the primary limiting factor of crop yields worldwide, and due to climate change, an increased risk of drought can be expected in many regions [2]. The direct and negative effect of drought is a crop yield reduction due to changes in the morphology, physiology, biochemistry and growth of stressed plants [3,4]. The impact of water stress on the plant and its yield components is mediated by the timing of drought and its frequency and intensity. The timing of drought determines the phenological stage at which the plant experiences decreased soil moisture [5].
It is expected that anthropogenic warming may increase soil moisture drought in future. This can lead to new challenges for farmers [6]. Drought events are projected to become more frequent and severe in the Mediterranean, Western Europe and Northern Scandinavia under RCP4.5 (the Representative Concentration Pathways, 4.5 watts per metre squared [7]). In spring and summer, the drought frequency is projected to increase, mainly in Southern Europe [8]. Under more severe emission scenarios such as RCP8.5, the European continent will be affected by more frequent and severe droughts. An example of a drought event can be seen in Figure 1; on June 22 (2020), a severe period of drought in Europe also affected the plants in our experiment (Czechia).
All yield components are negatively affected by drought. They interact with each other, and their performance also depends on the interactions among genotype, environment, and agronomy [10]. Drought affects wheat at all growth stages, but it is more severe during the anthesis and grain-filling stage (terminal drought), leading to significant yield losses [11]. Drought causes a reduction in relative water content, leading to stomata closure and reduction in stomatal conductance. Therefore, the osmotic adjustment may improve tolerance to drought. Drought also affects photosynthesis by changing the inner structure of chloroplast, mitochondria, and chlorophyll content [12]. The reduction in the net photosynthesis is caused by oxidative stress acting on chloroplasts and stomatal closure, which leads to poor grain development and grain set [11]. Drought occurring in the reproductive stage may lead to the sterility of spikelets. Drought occurring during the pollen development stage leads to the abortion of pollen and reduction in grain number. Drought during the anthesis stage causes mainly a reduction in grain size [13]; meanwhile, post-anthesis drought does not affect the grain number per spike [14]. With the increased intensity of drought, the grain yield and harvest index decrease significantly [15].
The spike’s length is crucial for determining the number of grains per spike, and a more prolonged spike may form more grains or bigger grains. The length of the spike is genotype-dependent, but as regular observation shows, is highly affected by year (environment) [16,17,18]. The number of spikes per plant is closely linked to the tillering ability. Winter wheat forms a higher number of tillers during the tillering stage, of which the majority is aborded or sterile until the harvest time. The number of aborted or infertile tillers depends on environmental conditions and the time of tiller formation. Drought and nutrient deficiency are two of the main factors affecting tiller formation [19,20,21]. The number of grains per spike and the weight of grains are also affected by the environment, including drought [22,23].
Plant breeders who breed drought-tolerant wheat genotypes focus on the root system’s morphology [24], the anatomy of leaves and plant height [25]. Traits such as the depth of the root system and density can increase the root surface, contributing to drought tolerance [26]. The shape, size, senescence and waxiness of leaves can also tribute to drought tolerance [27]. The cell elongation is disrupted by drought, affecting wheat’s growth and height. The reduction in height can be in the range of 35–23% at the stem elongation stage and at about 7% at the grain filling stage [28]. There is a universal and crucial drought-tolerance breeding trend for early flowering and maturing varieties. This strategy leads to “drought escape” and may cause a higher harvest index and yield [29].
Our field experiment was conducted to explore strategies that can be used to maintain the grain yield of wheat varieties under the condition of drought and in relation to their different earliness.

2. Materials and Methods

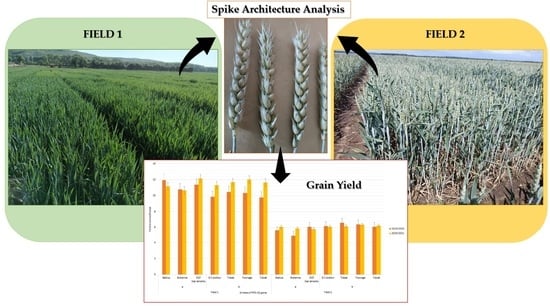
2.1. Field Sites Conditions

The experiment was performed on the following two sites: FIELD 1 (N 49°1′22.246″, E 16°37′2.896″) and FIELD 2 (N 49°0′45.941″, E 16°33′47.083″), Žabčice, Czech Republic, during two growing seasons 2019/2020 and 2020/2021. The average annual temperature for the sites is 10.3 °C, and the average annual precipitation is 491 mm. The Czech Republic belongs to Dfb climatic type [30]. This climatic type is typical for warm summer with the highest precipitation and cold winter with snow [31].
The experimental sites differed mainly in soil texture and groundwater level. FIELD 2 contains a higher percentage of sand particles, and the groundwater level is lower than in FIELD 1. Details about soil texture and some forms of agronomic management can be seen in the Supplementary Materials. The plants were also chemically controlled for pests and diseases. In FIELD 1, the preceding crop for the growing periods of 2019/2020 and 2020/2021 was winter wheat (Triticum aestivum). In FIELD 2, the preceding crop for the growing period of 2019/2020 was poppy (Papaver somniferum) and for 2020/2021 it was tansy phacelia (Phacelia tanacetifolia). The micro-climate characteristics, such as soil moisture, were measured using soil sensors VIRRIB (AMET Velké Bílovice) at both sites, and the data can be found in the Supplementary Materials. The net plot size was 10.3 m2, and randomized complete blocks were replicated three times on FIELD 1 and four times on FIELD2.

2.2. Plant Material

Six winter and one facultative wheat variety (Table 1) were selected for this experiment based on their earliness and photoperiod sensitivity, given mainly by the presence of the allele of the Ppd-D1 gene. The Ppd-D1 gene is the crucial gene controlling the photoperiod response in hexaploid wheat [32]. The varieties insensitive to the photoperiod carry the Ppd-D1a allele (a), and the sensitive varieties carrying the ppd-D1b allele (b). The plant samplings were completed in two terms during each year (Table 1), during the phenological stages of flowering and ripening determined by the Zadoks scale [33]. The terms of the samplings can be seen in Table 2. In the first term, the spike length, the number of all spikelets and fertile spikelets per spike, and the number of fertile flowers per spike were analyzed. In the second term, the spike length, the number of spikelets per spike, and the number of grains per spike were analyzed. According to analyses of spikes, other characteristics, such as spikelet density and spikelet fertility, were counted [34]. After the harvest, the grain yield per net plot and thousand kernel weight (TKW) were measured. Spikelet density = spikelet number per spike/spike length.
Spike fertility = (fertile spikelet number per spike/total spikelet number per spike) × 100

2.3. Statistical Data Analysis

The Shapiro–Wilk test (p < 0.05) was performed to check the normality of obtained data. The dependence between the characteristics such as spike length, total spikelet number and other traits, which can be seen in Table 3, was tested with Spearman’s rank correlation (p < 0.05). The differences among sites, varieties, Ppd-D1 alleles and growing season in characteristics were tested with the Kruskal–Wallis test (nonparametric ANOVA) with Dwass–Steel–Critchlow–Fligner pairwise comparison as POST-HOC testing, where p < 0.05 was chosen as the statistical significance level. The statistical analyses were conducted with Excel Microsoft using the XLSTAT add-on (Addinsoft, New York, NY, USA) and jamovi software (Sydney, Australia).

3. Results

During the growing season of 2019/2020, in FIELD 1, the water limit for the wilting point was not reached at the observed depths of the soil; however, the soil moisture in FIELD 2 reached wilting point at 20 cm and 30 cm from the second week of April until the last week of June which was from the time of stem elongation to ripening in early varieties and from the tillering stage to ripening in late varieties. Furthermore, the soil moisture at 30 cm was close to the wilting point from the second week of June until the second week of July. The plants used the water supply from 10 cm from the soil surface. During the growing season of 2020/2021, in FIELD 1, reduced water availability occurred from June to July; however, in FIELD 2, reduced water availability was observed during the all-growing season, which affected all phenological stages. Furthermore, the soil moisture at 30 cm was close to the wilting point from the second week of June until the second week of July. A statistical analysis also showed statistically significant differences between the samples from the site for most of the chosen traits (p < 0.05). The samples statistically did not differ between the two sites in terms of the number of fertile flowers, spike density, spike fertility and spike density (2) in 2019/2020, and in spike length, spike density and spike density (2).

3.1. Effect of the Photoperiod Sensitivity on Yield Characteristics

The descriptive data can be seen in Table 3 with red marked cells indicating the statistical significance of the obtained data (p-values) gained using a nonparametric ANOVA.

3.1.1. Growing season 2019/2020

At FIELD 1, the higher number of fertile spikelets and fertile flowers were found to be statistically significant (p = 0.022; p = 0.014) in photoperiod-sensitive varieties. The spike length and the spike density during the ripening stage were higher in photoperiod-insensitive varieties (p ≤ 0.0001; p ≤ 0.0001), together with the TKW and harvest index (p ≤ 0.0001; p ≤ 0.0001). The number of spikes per square meter and the grain yield were also higher in photoperiod-insensitive varieties (p ≤ 0.0001; p ≤ 0.0001). At FIELD 2, the spike length during the ripening stage and the number of fertile spikelets were higher in photoperiod-insensitive varieties (p = 0.000; p = 0.020); despite this, the spike density during ripening was higher in photoperiod-sensitive varieties (p ≤ 0.0001). Even though the number of spikes per square meter was higher in photoperiod-insensitive varieties (p = 0.016), in this stressed site, the yield was higher in photoperiod-sensitive varieties (p ≤ 0.0001).

3.1.2. Growing Season 2020/2021

At FIELD 1, statistically significant differences were found for traits such as total spikelet number (p = 0.024), fertile spikelets (p = 0.027), fertile flowers (p = 0.002), spike density during flowering (p = 0.012), ripening (p = 0.041), grain number (p = 0.000), number of spikes per square meter (p ≤ 0.0001), TKW (p ≤ 0.0001) and yield (p = 0.017). TKW was higher in photoperiod-insensitive varieties. All other traits reached higher numbers in photoperiod-sensitive varieties. At the more stressed site of FIELD 2, the more dense spikes were found in photoperiod-sensitive varieties (p = 0.009), alongside a higher number of fertile spikelets (p = 0.040) and a higher grain number (p = 0.004). The spike fertility during the ripening and grain yield was also statistically different and higher in photoperiod-sensitive varieties (p = 0.004; p ≤ 0.0001).

3.2. Effect of Variety on Yield Characteristics at the Stressed Site

The mean values for each observed trait and marked statistical significance of ANOVA testing can be seen in the Supplementary Materials (as the table of the values is too large). The mean values of yields are shown in Figure 2.

3.2.1. Growing Season 2019/2020

The most prolonged spike during the flowering time was found in the variety Bohemia (mean 130 mm during flowering and 114 mm during ripening stage) in FIELD 1. In the more stressed site of FIELD 2, this variety decreased the spike length by about 10% during flowering and about 5% during the ripening stage compared to FIELD 1. However, it was still the most prolonged spike in all varieties in the stressed location. The highest decrease in the spike length was found in Tybalt, of about 13% during flowering and about 11% during the ripening stage. The lowest reduction was found in Balitus, of about 4% during flowering. The highest number of total spikelets during flowering was found in Tybalt (23 spikelets) in FIELD 1; however, the total spikelet number was reduced in this variety by about 14% in FIELD 2. The lowest reduction was found in Balitus in FIELD 2; however, in the variety IS Conditor, there was an increase in the number of spikelets by about 5%, and this variety also had the highest number of spikelets. The highest number of fertile spikelets during flowering in FIELD 2 was found in Tybalt, which also had the highest reduction of 11% compared to the results from FIELD 1. The lowest reduction was found in IS Conditor and Tonnage (5%). During ripening, the highest decrease was obtained in Tybalt (12%), and the lowest reduction was found in Bohemia (5%).
The highest number of fertile flowers was found in Balitus in FIELD 2 (62 fertile flowers per spike), with the highest increase (33%) in the number of fertile flowers. The lowest number of fertile flowers was discovered in RGT Sacramento (43 fertile flowers per spike), with the highest reduction in the number of fertile flowers at 26%. During the ripening stage, the highest increase in the density in FIELD 2 was found in Bohemia (3%) and Tybalt (1%), and the highest reduction was found in Balitus (7%). During the ripening stage, the highest fertility was seen in RGT Sacramento, with a 2% increase. The highest reduction was found in Tybalt and Balitus (4%).
The highest number of grains in FIELD 2 was found in Tobak (54 grains per spike), with a 7% decrease. The highest reduction was in Tybalt (17%) and Balitus (12%). The lowest reduction was found in Bohemia (3%). The heaviest grains in FIELD 2 were found in Bohemia (45 g for a thousand kernel weight) with a 0.4% reduction. The lightest grains were found in IS Conditor (40 g) with an increase of around 6%. The highest increase was seen in Tonnage (21%).
The harvest index decreased in FIELD 1 and increased in FIELD 2. The highest yield in FIELD 2 was found in Tobak (6.6 t/ha) with a 37% reduction and Tonnage (6.4 t/ha) with a 38% reduction. The highest decrease was found in Bohemia (55%) with a yield of 4.8 t/ha and Balitus (5.5 t/ha) with a 54% reduction. On the contrary, Balitus yielded the highest in FIELD 1 (11.9 t/ha). The earliest varieties yielded the lowest in FIELD 2. The highest reduction in the number of spikes per square meter was found in Tobak (528 spikes per m2) with a decrease of 40% and Tonnage (545 spikes/m2) with a reduction of 41%. The lowest reduction was found in Bohemia (31%) and IS Conditor (31%).

3.2.2. Growing Season 2020/2021

The most prolonged spike in FIELD 2 was found in Bohemia (115 mm) with no reduction during flowering. The highest reduction (11%) was found in Tybalt (83 mm), but the shortest spike was seen in RGT Sacramento (75%) in comparison with the average length of RGT Sacramento in FIELD 1. During flowering, the highest number of total spikelets was found in Bohemia (20 spikelets per spike) with a 2% reduction; in this case, it was the lowest reduction in spikelets. The highest decrease was found in Balitus (9.5%) and Tybalt (8%). In the ripening stage, the highest number of spikelets was discovered in Bohemia (19 spikelets per spike), with the highest reduction of 8%. The lowest reduction was in Tybalt (0.5%) and Balitus (1%). At the time of flowering, there was an increase in the number of fertile flowers in Bohemia, of about 6% in FIELD 2. In all other varieties, a reduction was found, with the highest decrease in Tobak (19%) and lowest in Tonnage (8%).
The highest spike density was found in Tybalt during flowering, of 3%. The lowest spike density was found in Bohemia with a 2% reduction. The highest decrease was found in Tybalt, with a 7.8% reduction. During ripening, the spike density increased in Balitus by about 9%, IS Conditor (5%) and Tybalt (2%). The spike density decreased in Bohemia (3% reduction), RGT Sacramento (1% reduction), Tobak (1% reduction) and Tonnage (4% reduction). During the ripening stage, the highest fertility was seen in Tobak, with an 89% spike in fertility and a 0.5% increase in fertility compared to the fertility of Tobak in FIELD 1.
The highest number of grains per spike was found in Tobak and Tonnage, with 45 grains per spike and reductions of 6% and 14% in FIELD 2. The highest decrease was found in RGT Sacramento, with 37 grains per spike and a 23% reduction. The lowest reductions were found in Balitus (8%), Bohemia (8%) and Tobak (6%). The heaviest grains were found in Bohemia (45 g per thousand kernel weight) with a 4% reduction. The highest decrease was found in Tonnage (10%), and the lowest reduction was in IS Conditor (1%). There was an increase in RGT Sacramento (3%) and Tobak (1%).
The highest yield was found in Tonnage (6.3 t/ha) with a 47% reduction and in Tybalt (6.2 t/ha) with a 47% reduction. The highest decrease was found in RGT Sacramento, with a 53% reduction and 5.8 t/ha yield. The lowest reduction was found in Balitus (46%) and Bohemia (45%). The highest harvest index was found in IS Conditor with a 7% reduction and Tobak with a 16% reduction. The number of spikes per square meter was highest in IS Conditor in FIELD 2, with a decrease of 13%. The highest decrease was found in Tonnage (47% reduction), and the lowest was in IS Conditor.

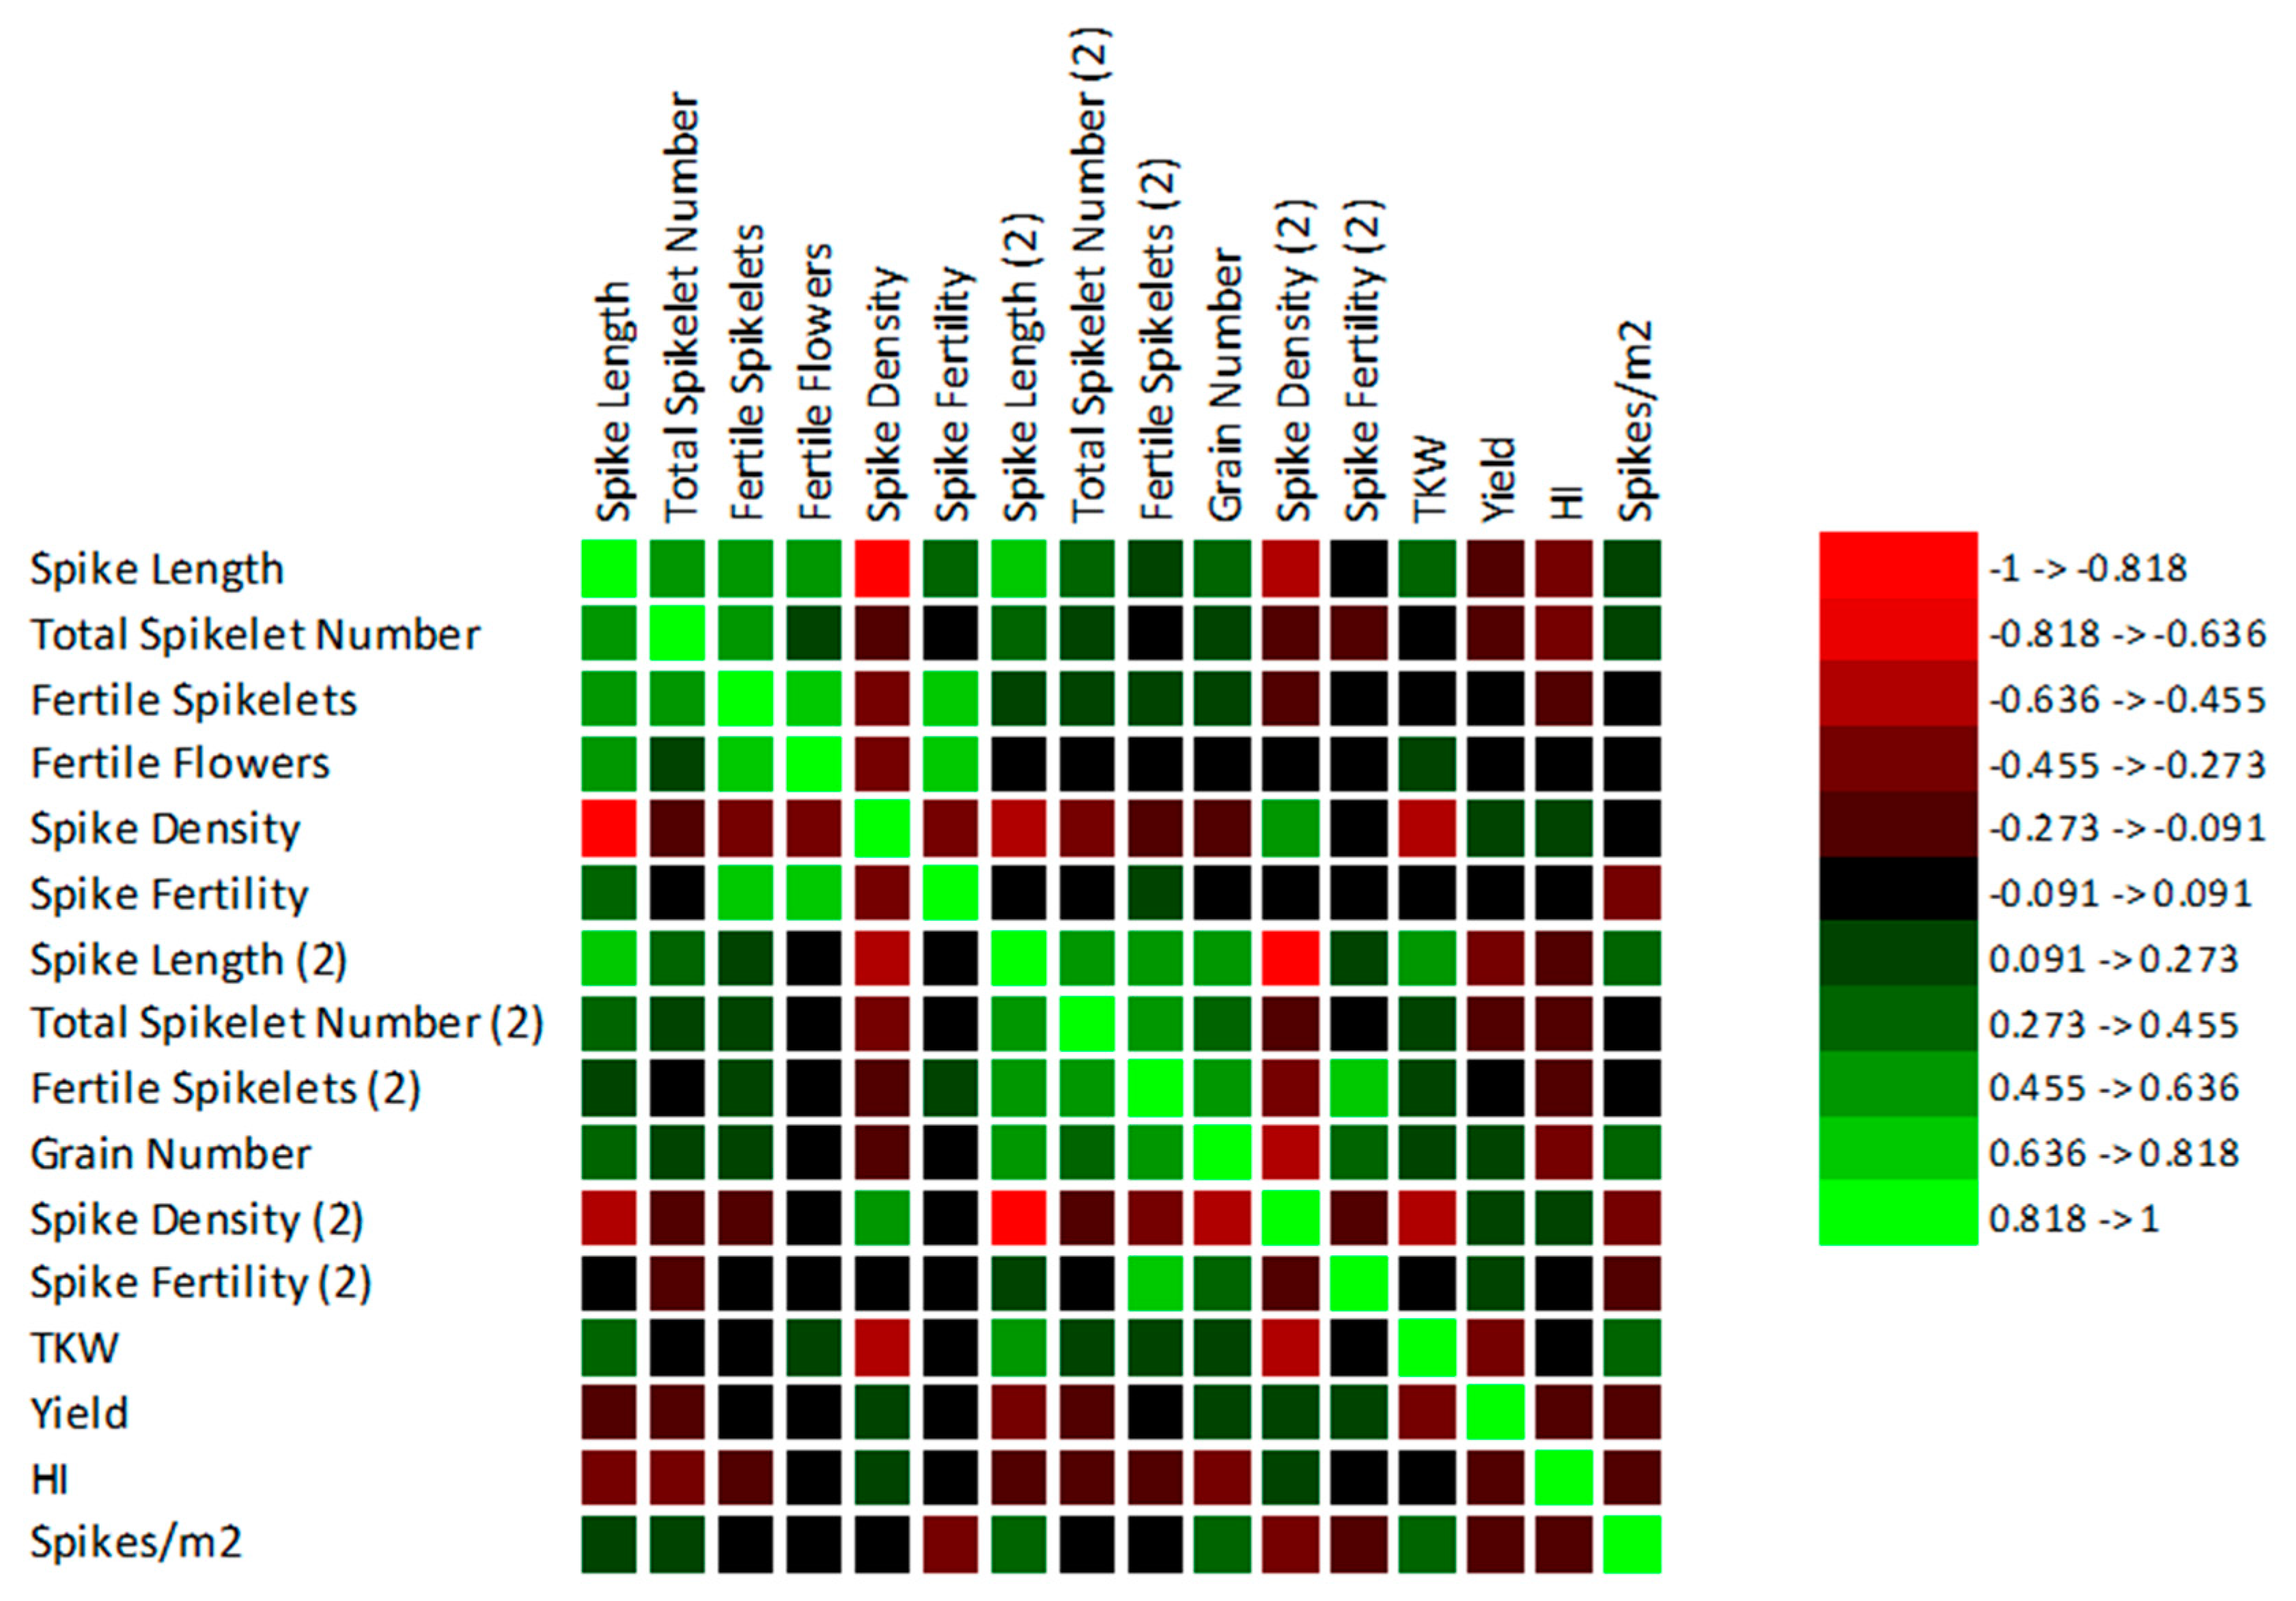
3.3. Correlations between the Observed Traits

The statistically significant correlations between the observed traits and the yield were found (the Spearman correlation matrixes can be found in Supplementary Materials). A graphical representation of the matrixes can be seen in Figure 3 and Figure 4. In FIELD 1, in the less drought-stressed site, a significant relationship between the spike length and yield during flowering (r = −0.6; p ≤ 0.0001) and during ripening (r = −0.3; p = 0.001) was found. In FIELD 2, the correlation was less pronounced between the spike length and yield during flowering (r = −0.2; p = 0.012; during ripening r = −0.3; p = 0.000); however, with longer spikes the grain yield decreased.
Two completely different strategies were found in the chosen varieties for the trait TKW. With heavier weights of grains, the yield was higher in FIELD 1 (r = 0.3; p = 0.000). Despite this finding, of a higher weight of the grains, the yield lowered in FIELD 2 (r = −0.4; p ≤ 0.0001). This is related to spike density during the ripening stage. In FIELD 1, the spikes had fewer spikelets because they were longer than in FIELD 2. The spike density played a greater role in FIELD 2, where the correlation was higher (r = 0.3; p = 0.001) than in FIELD 1 (r = 0.2; p = 0.033). Although there was a correlation between spike length during ripening and the weight of grains in FIELD 1 (r = 0.3; p = 0.001) and FIELD 2 (r = 0.5; p ≤ 0.0001), these results could be affected by the longest spikes in Bohemia. With a higher number of spikes per square meter TKW decreased in FIELD 1 (r = −0.5; p ≤ 0.0001); however, this was not found to be statistically significant in FIELD 2 due to the lower number of spikes per meter.

4. Discussion

Drought affected the selected spike traits at the experimental sites of FIELD 1 and FIELD 2 in the growing seasons of 2019/2020 and 2020/2021. In 2019/2020, the water limits for the wilting point were reached only in the more stressed site of FIELD 2 at the phenological stages from stem elongation to ripening (in early/photoperiod-insensitive varieties) and from tillering to ripening (in semi-late/photoperiod-sensitive varieties). In 2020/2021, the water limits for the wilting point were not reached at the site of FIELD 1 or FIELD 2; however, during the all-growing season, the water availability was reduced in FIELD 2 which negatively plants‘ spike architecture throughout their whole development. Furthermore, at the time of ripening, the soil moisture level was close to the wilting point. The different reaction to the given field conditions was noted in each variety and between two groups of varieties selected according to their Ppd-D1 allele which grouped them as either photoperiod insensitive or photoperiod sensitive.
During both growing seasons, the shorter spikes were observed in all varieties in the more drought-stressed site of FIELD 2. Drought negatively affects the length of wheat spikes. In several experiments, scientist reached the same results through their observations [35,36,37,38]. Drought decreases net photosynthesis [39], which can lead to alterations in chlorophyll content and can also change the levels of regulatory enzymes such as Rubisco through the downregulation of the genes important for the photosynthesis [40]. Decreased photosynthesis may affect the spike length and other agronomical traits, because lower photosynthesis together with less water—both of which are important for nutrient transport—could affect spike length. The length of the spike was typically higher at the flowering than at the ripening stage in both sites. No studies identifying the same observation were found, but we suggest that during ripening, at a certain stage, the cells lose water. Subsequently, shrinkage of the spike may occur. However, this hypothesis was neither confirmed nor invalidated.
The number of spikelets and grains per spike also play an important role in the grain yield. As the spikes were shorter in FIELD 2, the number of spikelets and grains was lower too; however, the spikes in the more stressed site were denser. Despite this, the fertility of spikes was also lower in the more stressed site. The timing of the arrival of the drought was also an important factor. In our experiment, drought occurred in 2019/2020 from the stem elongation stage in photoperiod-insensitive varieties. The arrival of drought in the stage of stem elongation reduces the elongation of the stem but also reduces cell expansion, which is connected to the changes in the metabolism of gibberellins due to drought [41]. Drought occurrence at the early stem elongation stage affects the total number of spikelets the most, which applied to our results; however, drought occurrence during the flowering stage affects the number of grains per spikelet [42] and the total number of grains per spike, which was also demonstrated in our experiment. For photoperiod-sensitive varieties, the arrival of drought in 2019/2020 occurred at the tillering stage.
If drought occurs at the time of tillering, the recovery of the plants depends on the number of spikes developed before and after drought [43]. However, as the availability of water was limited from the tillering stage until ripening in our experiment, the most important factor was the number of spikes developed before drought occurrence. When drought continues during the flowering stage in both photoperiod-insensitive and sensitive varieties, the grain formation could be affected by the diminished ability to translocate the assimilates to the grain [5]. This affected the thousand kernel weight as TKW was lower in more the stressed site of FIELD 2. From the observation, it is assumed that recovery from drought occurring at the vegetative stage is important for the grain yield [44].
The highest yield in the more stressed site of FIELD 2 was obtained from the variety Tobak in the growing season of 2019/2020 and from Tobak and Tonnage in the growing season of 2020/2021. From the results, it can be seen that the late varieties performed better than early ones in conditions of lower soil moisture. Their advantage was the rate of phenological stages which was partly caused by the Ppd-D1 allele, thereby causing photoperiod-sensitivity, Therefore, their development was slower compared with the early Balitus and Bohemia. The main compensatory mechanism of the selected late varieties seemed to be a higher number of grains per spike. All other traits such as the length of spike, total number of spikelets, spike fertility, number of grains, number of spikes per square metre and TKW were lower in comparison with other varieties. Nevertheless, the variety RGT Sacramento carrying the insensitive allele of the Ppd-D1 gene, as indicated by the reaction to the stressed location and its grain yield, was more similar to IS Conditor which carries the sensitive allele. The Ppd-D1 gene is not the only gene affecting the response to the photoperiod. The phenological rate of growth and spike architecture, and other genes such as Ppd-A1 and Ppd-B1 also play a decisive role in growth [45,46,47,48,49].
Compensation by the yield components plays a decisive role in the response to improved water conditions after drought or can help to maintain a high average yield during drought; however, wheat genotypes with both characteristics have not been found yet [50].

5. Conclusions

From the results of the statistical analyses, the negative effect of drought on spike structure (selected spike characteristics) was confirmed. The impact of the more drought stressed site of FIELD 2, which contained a higher proportion of sandy fractions and reduced soil moisture compared to the site of FIELD 1, was confirmed too. The late varieties (photoperiod-sensitive) in the drier site of FIELD 2 provided a higher grain yield than the early varieties (photoperiod-insensitive) in the given field conditions during both growing seasons. The early varieties could not apply the drought escape strategy due to the timing of drought occurrence. The lower soil moisture occurred from the second week of April until the last week of June during stem elongation and ripening (photoperiod-insensitive) and during tillering and ripening (photoperiod-sensitive) in 2019/2020 in FIELD 2. In 2020/2021, lower soil moisture was observed throughout the growing season of 2020/2021 in FIELD 2. In the conditions of a longer drought occurrence, the late varieties performed better; however, if the drought occurred only in the time of flowering or grain filling, the early varieties may have performed better.

Supplementary Materials

The following supporting information can be downloaded at: https://www.mdpi.com/article/10.3390/agronomy12102328/s1, Figure S1: Soil moisture in FIELD 1 during the growing season 2019/2020; Figure S2: Soil moisture in FIELD 2 during the growing season 2019/2020; Figure S3: Soil moisture in FIELD 1 during the growing season 2020/2021; Table S1. Fertilizer dosages and forms; Table S2. Soil texture and the percentage of soil separates; Table S3. Spearman correlation matrix for the data of FIELD 1. Values in bold are different from 0 with a significance level alpha = 0.05; Table S4. Spearman correlation matrix for the data of FIELD 2. Values in bold are different from 0 with a significance level alpha = 0.05. Table S5. Mean values of the observed traits for all varieties.

Author Contributions

Conceptualization, N.F., I.T.P. and P.M.; methodology, N.F.; software, N.F.; validation, N.F., P.S. and L.H.; formal analysis, N.F.; investigation, N.F. and M.R.; resources, N.F.; data curation, N.F., M.R., P.E.; writing—original draft preparation, N.F.; writing—review and editing, N.F., P.S., T.S. and I.J.; visualisation, N.F.; supervision, P.S., I.T.P. and T.S.; project administration, I.T.P.; funding acquisition, L.H. and I.T.P. All authors have read and agreed to the published version of the manuscript.

Funding

This research was funded by National Agency for Agricultural Research, the project QK1910269—Adaptation potential of common wheat in response to drought and extreme temperatures.

Institutional Review Board Statement

Not applicable.

Informed Consent Statement

Not applicable.

Data Availability Statement

The data presented in this study are available in this article and in Supplementary Materials.

Acknowledgments

The authors would like to thank the staff and students at the Field Experimental Station in Žabčice for their help with the spike analyses.

Conflicts of Interest

The authors declare no conflict of interest.

References

  1. Wilhite, D.; Glantz, M. Understanding the Drought Phenomena: The Role of Definitions. Water Int. 1985, 10, 111–120. [Google Scholar] [CrossRef]
  2. Kiliç, H.; Yağbasanlar, T. The Effect of Drought Stress on Grain Yield, Yield Components and some Quality Traits of Durum Wheat (Triticum turgidum ssp. durum) Cultivars. Not. Bot. Hort. Agrobot. Cluj. 2010, 38, 164–170. [Google Scholar] [CrossRef]
  3. Huang, J.; Zhuo, W.; Li, Y.; Huang, R.; Sedano, F.; Su, W.; Dong, J.; Tian, L.; Huang, Y.; Zhu, D.; et al. Comparison of three remotely sensed drought indices for assessing the impact of drought on winter wheat yield. Int. J. Digit. Earth 2018, 13, 504–526. [Google Scholar] [CrossRef]
  4. Khatiwada, A.; Neupane, I.; Sharma, B.; Bhetwal, N.; Pandey, B. Effects of Drought Stress on Yield and Yield Attributing Characters of Wheat: A Review. Agriways 2020, 8, 115–121. [Google Scholar] [CrossRef]
  5. Sarto, M.V.M.; Sarto, J.R.W.; Rampim, L.; Bassegio, D.; da Costa, P.F.; Inagaki, A.M. Wheat phenology and yield under drought: A review. Aust. J. Crop Sci. 2017, 11, 941–946. [Google Scholar] [CrossRef]
  6. Samaniego, L.; Thober, S.; Kumar, R.; Wanders, N.; Rakovec, O.; Pan, M.; Zink, M.; Sheffield, J.; Wood, E.F.; Marx, A. Anthropogenic warming exacerbates European soil moisture droughts. Nat. Clim. Chang. 2018, 8, 421–426. [Google Scholar] [CrossRef]
  7. Moss, R.; Babiker, M.; Brinkman, S.; Calvo, E.; Carter, T.; Edmonds, J.; Elgizouli, I.; Emori, S.; Erda, L.; Hibbard, K.; et al. Towards New Scenarios for Analysis of Emissions, Climate Change, Impacts, and Response Strategies; Intergovernmental Panel on Climate Change: Geneva, Switzerland, 2008; pp. 10–34. [Google Scholar]
  8. Spinoni, J.; Vogt, J.V.; Naumann, G.; Barbosa, P.; Dosio, A. Will drought events become more frequent and severe in Europe? Int. J. Climatol. 2017, 38, 1718–1736. [Google Scholar] [CrossRef]
  9. Dauphin, L. NASA Observatory Image. National Drought Mitigation Center. 2020. Available online: https://earthobservatory.nasa.gov/images/146888/signs-of-drought-in-european-groundwater (accessed on 1 August 2022).
  10. Slafer, G.A.; Savin, R.; Sadras, V.O. Coarse and fine regulation of wheat yield components in response to genotype and environment. Field Crops Res. 2014, 157, 71–83. [Google Scholar] [CrossRef]
  11. Farooq, M.; Hussain, M.; Siddique, K.H.M. Drought Stress in Wheat during Flowering and Grain-filling Periods. Crit. Rev. Plant Sci. 2014, 33, 331–349. [Google Scholar] [CrossRef]
  12. Ahmad, Z.; Waraich, E.A.; Akhtar, S.; Anjum, S.; Ahmad, T.; Mahboob, W.; Hafeez, O.B.A.; Tapera, T.; Labuschagne, M.; Rizwan, M. Physiological responses of wheat to drought stress and its mitigation approaches. Acta Physiol. Plant. 2018, 40, 80. [Google Scholar] [CrossRef]
  13. Ji, X.; Shiran, B.; Wan, J.; Lewis, D.C.; Jenkins, C.L.D.; Gondon, A.G.; Richards, R.A.; Dolferus, R. Importance of pre-anthesis anther sink strength for maintenance of grain number during reproductive stage water stress in wheat. Plant Cell Environ. 2010, 6, 926–942. [Google Scholar] [CrossRef] [PubMed]
  14. Pireivatlou, A.S.; Masjedlou, B.D.; Aliyev, R.T. Evaluation of yield potential and stress adaptive trait in wheat genotypes under post anthesis drought stress conditions. Afr. J. Agric. Res. 2010, 5, 2829–2836. [Google Scholar] [CrossRef]
  15. Khalili, M.; Naghavi, M.R.; Aboughadareh, A.P.; Rad, H.N. Effects of Drought Stress on Yield and Yield Components in Maise cultivars (Zea mays L.). Int. J. Agron. Plant Prod. 2013, 4, 809–812. [Google Scholar]
  16. Okuyama, L.A.; Federizzi, L.C.; Neto, J.F.B. Plant traits to complement selection based on yield components in wheat. Ciênca Rural 2005, 35, 1010–1018. [Google Scholar] [CrossRef]
  17. Mirbahar, A.A.; Markhand, G.S.; Mahar, A.R.; Abro, S.A.; Kanhar, N.A. Effect of water stress on yield and yield components of wheat (Triticum aestivum) varieties. Pak. J. Bot. 2009, 41, 1303–1310. [Google Scholar]
  18. Protić, R.; Protić, N.; Prodanović, R.; Zarić, G.; Hyba, H.H.H.; Mnifid, A.A.; Kharud, M.M.M. Spike Length of Winter Wheat Varieties According to Different Ways of Seed Protection. Rom. Biotechnol. Lett. 2018, 23, 13697–13701. [Google Scholar]
  19. Rodríguez, D.; Andrade, F.H.; Goudriaan, J. Effects of phosporus nutrition on tiller emergence in wheat. Plant Soil 1999, 209, 283–295. [Google Scholar] [CrossRef]
  20. Fang, Y.; Du, Y.; Wang, J.; Wu, A.; Qiao, S.; Xu, B.; Zhang, S.; Siddique, K.H.M.; Chen, Y. Moderate Drought Stress Affected Root Growth and Grain Yield in Old, Modern and Newly Released Cultivars of Winter Wheat. Front. Plant. Sci. 2017, 8, 672. [Google Scholar] [CrossRef]
  21. Zhang, L.; He, X.; Liang, Z.; Zhang, W.; Zou, C.; Chen, X. Tiller development affected by nitrogen fertilisation in a high-yielding wheat productive system. Crop Sci. 2020, 60, 1034–1047. [Google Scholar] [CrossRef]
  22. Rajala, A.; Hakala, K.; Mäkelä, P.S.; Peltonen-Sainio, P. Drought Effect on Grain Number and Grain Weight at Spike and Spikelet Level in Six-Row Spring Barley. J. Agron. Crop Sci. 2010, 197, 103–112. [Google Scholar] [CrossRef]
  23. Knezevic, D.; Zecevic, V.; Stamenkovic, S.; Atanasijevic, S.; Milosevic, B. Variability of number of kernels per spike in wheat cultivars (Triticum aestivum L.). J. Cent. Eur. Agric. 2012, 13, 617–623. [Google Scholar] [CrossRef]
  24. Langridge, P.; Reynolds, M. Breeding for drought and heat tolerance in wheat. Theor. Appl. Genet. 2021, 134, 1753–1769. [Google Scholar] [CrossRef] [PubMed]
  25. Rizza, F.; Badeck, F.W.; Cattivelli, L.; Lidestri, O.; di Fonzo, N.; Stanca, A.M. Use of a water stress index to identify barley genotypes adapted to rainfed and irrigated conditions. Crop Sci. 2004, 44, 2127–2137. [Google Scholar] [CrossRef]
  26. Li, C.; Li, L.; Reynolds, M.P.; Wang, J.; Chang, X.; Mao, X.; Ring, R. Recognising the hidden half in wheat: Root system attributes associated with drought tolerance. J. Exp. Bot. 2021, 72, 5117–5133. [Google Scholar] [CrossRef]
  27. Rijal, B.; Baduwal, P.; Chaudhary, M.; Chapagain, S.; Khanal, S.; Khanal, S.; Poudel, P.B. Drought Stress Impacts on Wheat and Its Resistance Mechanisms. Malays. J. Sustain. Agric. 2021, 5, 67–76. [Google Scholar] [CrossRef]
  28. Caverzan, A.; Casassola, A.; Brammer, S.P. Antioxidant responses of wheat plants under stress. Genet. Mol. Biol. 2016, 39, 1–6. [Google Scholar] [CrossRef]
  29. Munns, R.; Richards, R.A. Recent Advances in Breeding Wheat for Drought and Salt Stresses. In Advances in Molecular Breeding Toward Drought and Salt Tolerant Crops; Jenks, M.A., Hasegawa, P.M., Jain, S.M., Eds.; Springer: Berlin/Heidelberg, Germany, 2007; pp. 565–585. [Google Scholar]
  30. Beck, H.E.; Zimmermann, N.E.; McVicar, T.R.; Vergopolan, N.; Berg, A.; Wood, E.F. Present and future Köppen-Geiger climate classification maps at 1-km resolution. Sci. Data 2018, 5, 180214. [Google Scholar] [CrossRef]
  31. Rafferty, J.P. (Ed.) Chapter 2, Climatic Classification. In Climate and Climate Change; Britannica Educational Publishing, Rosen Educational Services: New York, NY, USA, 2011; pp. 100–124. [Google Scholar]
  32. Cane, K.; Eagles, H.A.; Laurie, D.A.; Trevaskis, B.; Vallance, N.; Eastwood, R.F.; Gororo, N.N.; Kuchel, H.; Martin, P.J. Ppd-B1 and Ppd-D1 and their effects in southern Australian wheat. Crop Pasture Sci. 2013, 64, 100–114. [Google Scholar] [CrossRef]
  33. Zadoks, J.C.; Chang, T.T.; Konzak, C.F. A decimal code for the growth stages of cereals. Weed Res. 1974, 14, 415–421. [Google Scholar] [CrossRef]
  34. Guo, Z.; Zhao, Y.; Röder, M.S.; Reif, J.C.; Ganal, M.W.; Chen, D.; Schnurbusch, T. Manipulation and prediction of spike morphology traits for the improvement of grain yield in wheat. Sci. Rep. 2018, 8, 14435. [Google Scholar] [CrossRef]
  35. Mwadzingeni, L.; Shimelis, H.; Rees, D.J.G.; Tsilo, T.J. Genome-wide association analysis of agronomic traits in wheat under drought-stressed and non-stressed conditions. PLoS ONE 2017, 12, e0171692. [Google Scholar] [CrossRef] [PubMed]
  36. Qaseem, M.F.; Qureshi, R.; Shaheen, H. Effects of Pre-Anthesis Drought, Heat and Their Combination on the Growth, Yield and Physiology of diverse Wheat (Triticum aestivum L.) Genotypes Varying in Sensitivity to Heat and drought stress. Sci. Rep. 2019, 9, 6955. [Google Scholar] [CrossRef] [PubMed]
  37. Taheri, S.; Saba, J.; Shekari, F.; Abdullah, T.L. Effects of drought stress condition on the yield of spring wheat (Triticum aestivum) lines. Afr. J. Biotechnol. 2011, 10, 18339–18348. [Google Scholar]
  38. Khyber, J.A.; Soomro, F.; Sipio, W.D.; Baloch, A.W.; Soothar, J.K.; Soothar, M.K.; Ali, Z. Evaluation of Bread Wheat (Triticum aestivum L.) Genotypes forDrought Tolerance through Selection Indices. J. Hortic. Plant Res. 2019, 7, 40–52. [Google Scholar] [CrossRef] [Green Version]
  39. Wasaya, A.; Manzoor, S.; Yasir, T.A.; Sarwar, N.; Mubeen, K.; Ismail, I.A.; Raza, A.; Rehman, A.; Hossain, A.; EL Sabagh, A. Evaluation of Fourteen Bread Wheat (Triticum aestivum L.) Genotypes by Observing Gas Exchange Parameters, Relative Water and Chlorophyll Content, and Yield Attributes under Drought Stress. Sustainability 2021, 13, 4799. [Google Scholar] [CrossRef]
  40. Zhang, A.; Liu, M.; Gu, W.; Chen, Z.; Gu, Y.; Pei, L.; Tian, R. Effect of drought on photosynthesis, total antioxidant capacity, bioactive component accumulation, and the transcriptome of Atractylodes lancea. BMC Plant Biol. 2021, 21, 293. [Google Scholar] [CrossRef]
  41. Litvin, A.G.; van Iersel, M.W.; Malladi, A. Drought Stress Reduces Stem Elongation and Alters Gibberellin-related Gene Expression during Vegetative Growth of Tomato. J. Am. Soc. Hortic. Sci. 2016, 141, 591–597. [Google Scholar] [CrossRef]
  42. Sangtarash, M.H. Responses of Different Wheat Genotypes to Drought Stress Applied at Different Growth Stages. Pak. J. Biol. Sci. 2010, 13, 114–119. [Google Scholar] [CrossRef]
  43. Blum, A.; Ramaiah, S.; Kanemasu, E.T.; Paulsen, G.M. Wheat recovery from drought stress at the tillering stage of development. Field Crops Res. 1990, 24, 67–85. [Google Scholar] [CrossRef]
  44. Abid, M.; Ali, S.; Qi, L.K.; Zahoor, R.; Tian, Z.; Jiang, D.; Snider, J.L.; Dai, T. Physiological and biochemical changes during drought and recovery periods at tillering and jointing stages in wheat (Triticum aestivum L.). Sci. Rep. 2018, 8, 4615. [Google Scholar] [CrossRef]
  45. Arjona, J.M.; Royo, C.; Dreisigacker, S.; Ammar, K.; Villegas, D. Effect of Ppd-A1 and Ppd-B1 Allelic Variants on Grain Number and Thousand Kernel Weight of Durum Wheat and Their Impact on Final Grain Yield. Front. Plant Sci. 2018, 9, 888. [Google Scholar] [CrossRef] [PubMed]
  46. Würschum, T.; Rapp, M.; Miedaner, T.; Friedrich, C.; Longin, H.; Leiser, W.L. Copy number variation of Ppd-B1 is the major determinant of heading time in durum wheat. BMC Genet. 2019, 20, 64. [Google Scholar] [CrossRef] [PubMed]
  47. Matsuyama, H.; Fujita, M.; Seki, M.; Kojima, H.; Shimazaki, Y.; Matsunaka, H.; Chono, M.; Hatta, K.; Kubo, K.; Takayama, T.; et al. Growth and Yield Properties of Near-Isogenic Wheat Lines Carrying Different Photoperiodic Response Genes. Plant Prod. Sci. 2015, 18, 57–68. [Google Scholar] [CrossRef]
  48. Díaz, A.; Zikhali, M.; Turner, A.S.; Isaac, P.; Laurie, D.A.; Hazen, S.P. Copy Number Variation Affecting the Photoperiod-B1 and Vernalization-A1 Genes Is Associated with Altered Flowering Time in Wheat (Triticum aestivum). PLoS ONE 2012, 7, e33234. [Google Scholar] [CrossRef] [PubMed] [Green Version]
  49. Pérez-Gianmarco, T.I.; Slafer, G.A.; González, F.G. Photoperiod-sensitivity genes shape floret development in wheat. J. Exp. Bot. 2019, 70, 1339–1348. [Google Scholar] [CrossRef]
  50. Duggan, B.L.; Domitruk, D.R.; Fowler, D.B. Yield component variation in winter wheat grown under drought stress. Can. J. Plant Sci. 2000, 80, 739–745. [Google Scholar] [CrossRef] [Green Version]
Figure 1. NASA Earth Observatory image [9].
Agronomy 12 02328 g001
Figure 2. The average yield for each variety in each site and the growing season. The letters a and b are the abbreviations for the alleles of the Ppd-D1 gene which were mentioned in the Plant Material (the error bars represent the values of standard deviation).
Agronomy 12 02328 g002
Figure 3. Graphical representation of Spearman correlation matrix among the traits in FIELD 1.
Agronomy 12 02328 g003
Figure 4. Graphical representation of Spearman correlation matrix among the traits in FIELD 2.
Agronomy 12 02328 g004
Table 1. Varieties Characteristics.
VarietyEarlinessAwnsPhotoperiod SensitivityCountry of Origin
Balitusvery earlyawnlessinsensitive (a)Austria
Bohemiavery earlyawnlessinsensitive (a)Czech Republic
IS Conditormoderately earlyawnedsensitive (b)Slovakian Republic
RGT Sacramentomoderately earlyawnedinsensitive (a)France
Tobaksemi-lateawnlesssensitive (b)Germany
Tonnagesemi-lateawnlesssensitive (b)Denmark
Tybaltsemi-lateawnlesssensitive (b)Netherlands
Table 2. Phenological data and days from emergence during sampling.
Year2019/20202020/2021Site
days from emergence216243236276FIELD 1
Zadoks scale64736691
days from emergence222249235275FIELD 2
Zadoks scale67806891
Zadoks Scale: flowering stage 65, ripening from stage 70.
Table 3. Descriptive data of the observed traits and statistical significance of nonparametric ANOVA analyses.
Traits2019/20202020/2021
FIELD 1FIELD 2FIELD 1FIELD 2
Ppd-D1aPpd-D1bPpd-D1aPpd-D1bPpd-D1aPpd-D1bPpd-D1aPpd-D1b
Spike Length *105.9 ± 18.9102.1 ± 7.497.4 ± 16.292.2 ± 7.394.5 ± 16.189.0 ± 9.291.3 ± 18.183.7 ± 6.1
Total Spikelet Number20.2 ± 1.020.8 ± 1.419.1 ± 1.119.3 ± 1.319.5 ± 1.120.2 ± 1.018.4 ± 1.418.8 ± 0.8
Fertile Spikelets17.7 ± 1.218.6 ± 1.616.6 ± 1.617.2 ± 1.317.5 ± 1.118.2 ± 1.416.3 ± 1.316.4 ± 1.1
Fertile Flowers51.9 ± 8.557.0 ± 6.550.8 ± 10.453.8 ± 9.650.9 ± 5.255.3 ± 6.648.2 ± 7.048.3 ± 7.4
Spike Density0.2 ± 0.00.2 ± 0.00.2 ± 0.00.2 ± 0.00.2 ± 0.00.2 ± 0.00.2 ± 0.00.2 ± 0.0
Spike Fertility ****87.7 ± 5.289.0 ± 3.487.2 ± 5.889.1 ± 7.189.4 ± 3.490.2 ± 4.488.4 ± 3.287.5 ± 4.0
Spike Length (2) *99.5 ± 11.985.0 ± 9.895.1 ± 14.981.9 ± 5.286.4 ± 13.881.3 ± 7.081.1 ± 13.577.3 ± 7.2
Total Spikelet Number (2)20.1 ± 0.919.8 ± 1.218.8 ± 1.118.5 ± 0.819.3 ± 1.419.3 ± 0.918.4 ± 1.118.5 ± 1.1
Fertile Spikelets (2)17.9 ± 1.017.6 ± 1.416.6 ± 1.315.9 ± 0.916.9 ± 1.217.17 ± 1.115.3 ± 1.116.0 ± 1.2
Grain Number52.5 ± 5.854.4 ± 6.548.1 ± 8.348.8 ± 6.444.5 ± 4.749.0 ± 5.138.3 ± 5.342.9 ± 6.1
Spike Density (2)0.2 ± 0.00.2 ± 0.00.2 ± 0.00.2 ± 0.00.2 ± 0.00.2 ± 0.00.2 ± 0.00.2 ± 0.0
Spike Fertility (2) ****89.1 ± 5.188.6 ± 4.988.4 ± 6.885.8 ± 4.387.6 ± 3.988.9 ± 5.083.5 ± 4.586.6 ± 4.5
TKW **42.4 ± 2.837.9 ± 1.744.0 ± 1.443.3 ± 2.044.1 ± 2.041.5 ± 1.143.0 ± 1.840.1 ± 1.8
spikes/m2836.7 ± 38.6972.5 ± 126.2591.7 ± 37.2549.1 ± 44.0666.7 ± 74.5748.3 ± 64.8449.9 ± 34.6478.6 ± 56.8
HI0.4 ± 0.00.3 ± 0.00.4 ± 0.00.4 ± 0.00.5 ± 0.00.5 ± 0.00.4 ± 0.00.4 ± 0.0
Yield ***11.4 ± 0.510.1 ± 0.35.5 ± 0.56.3 ± 0.211.3 ± 0.611.66 ± 0.35.9 ± 0.16.1 ± 0.1
* unit is centimeters, ** unit is grams, *** unit is tons per hectare, **** unit is the percentage, red-marked numbers indicate a statistical value of p < 0.05. The photoperiod-insensitive (Ppd-D1a) and the photoperiod-sensitive (Ppd-D1b) groups were tested using a nonparametric ANOVA to find statistically significant differences between these groups in the observed traits.
Publisher’s Note: MDPI stays neutral with regard to jurisdictional claims in published maps and institutional affiliations.

