
The Optimization of the Physical–Thermal and Bioactive Properties of Pumpkin Slices Dried in a Hybrid Microwave–Convective Dryer Using the Response Surface Method


 ,
, 

Abstract
:1. Introduction
2. Materials and Methods
2.1. Sample Preparation
2.2. Hybrid Microwave–Convective Dryer
2.3. Kinetics of Drying
2.4. Specific Energy Consumption
2.5. Color
2.6. Shrinkage
2.7. Rehydration Ratio
2.8. Total Phenol Content
2.9. Antioxidant Activities
2.10. Vitamin C
2.11. Statistical Analysis and Optimization
3. Results
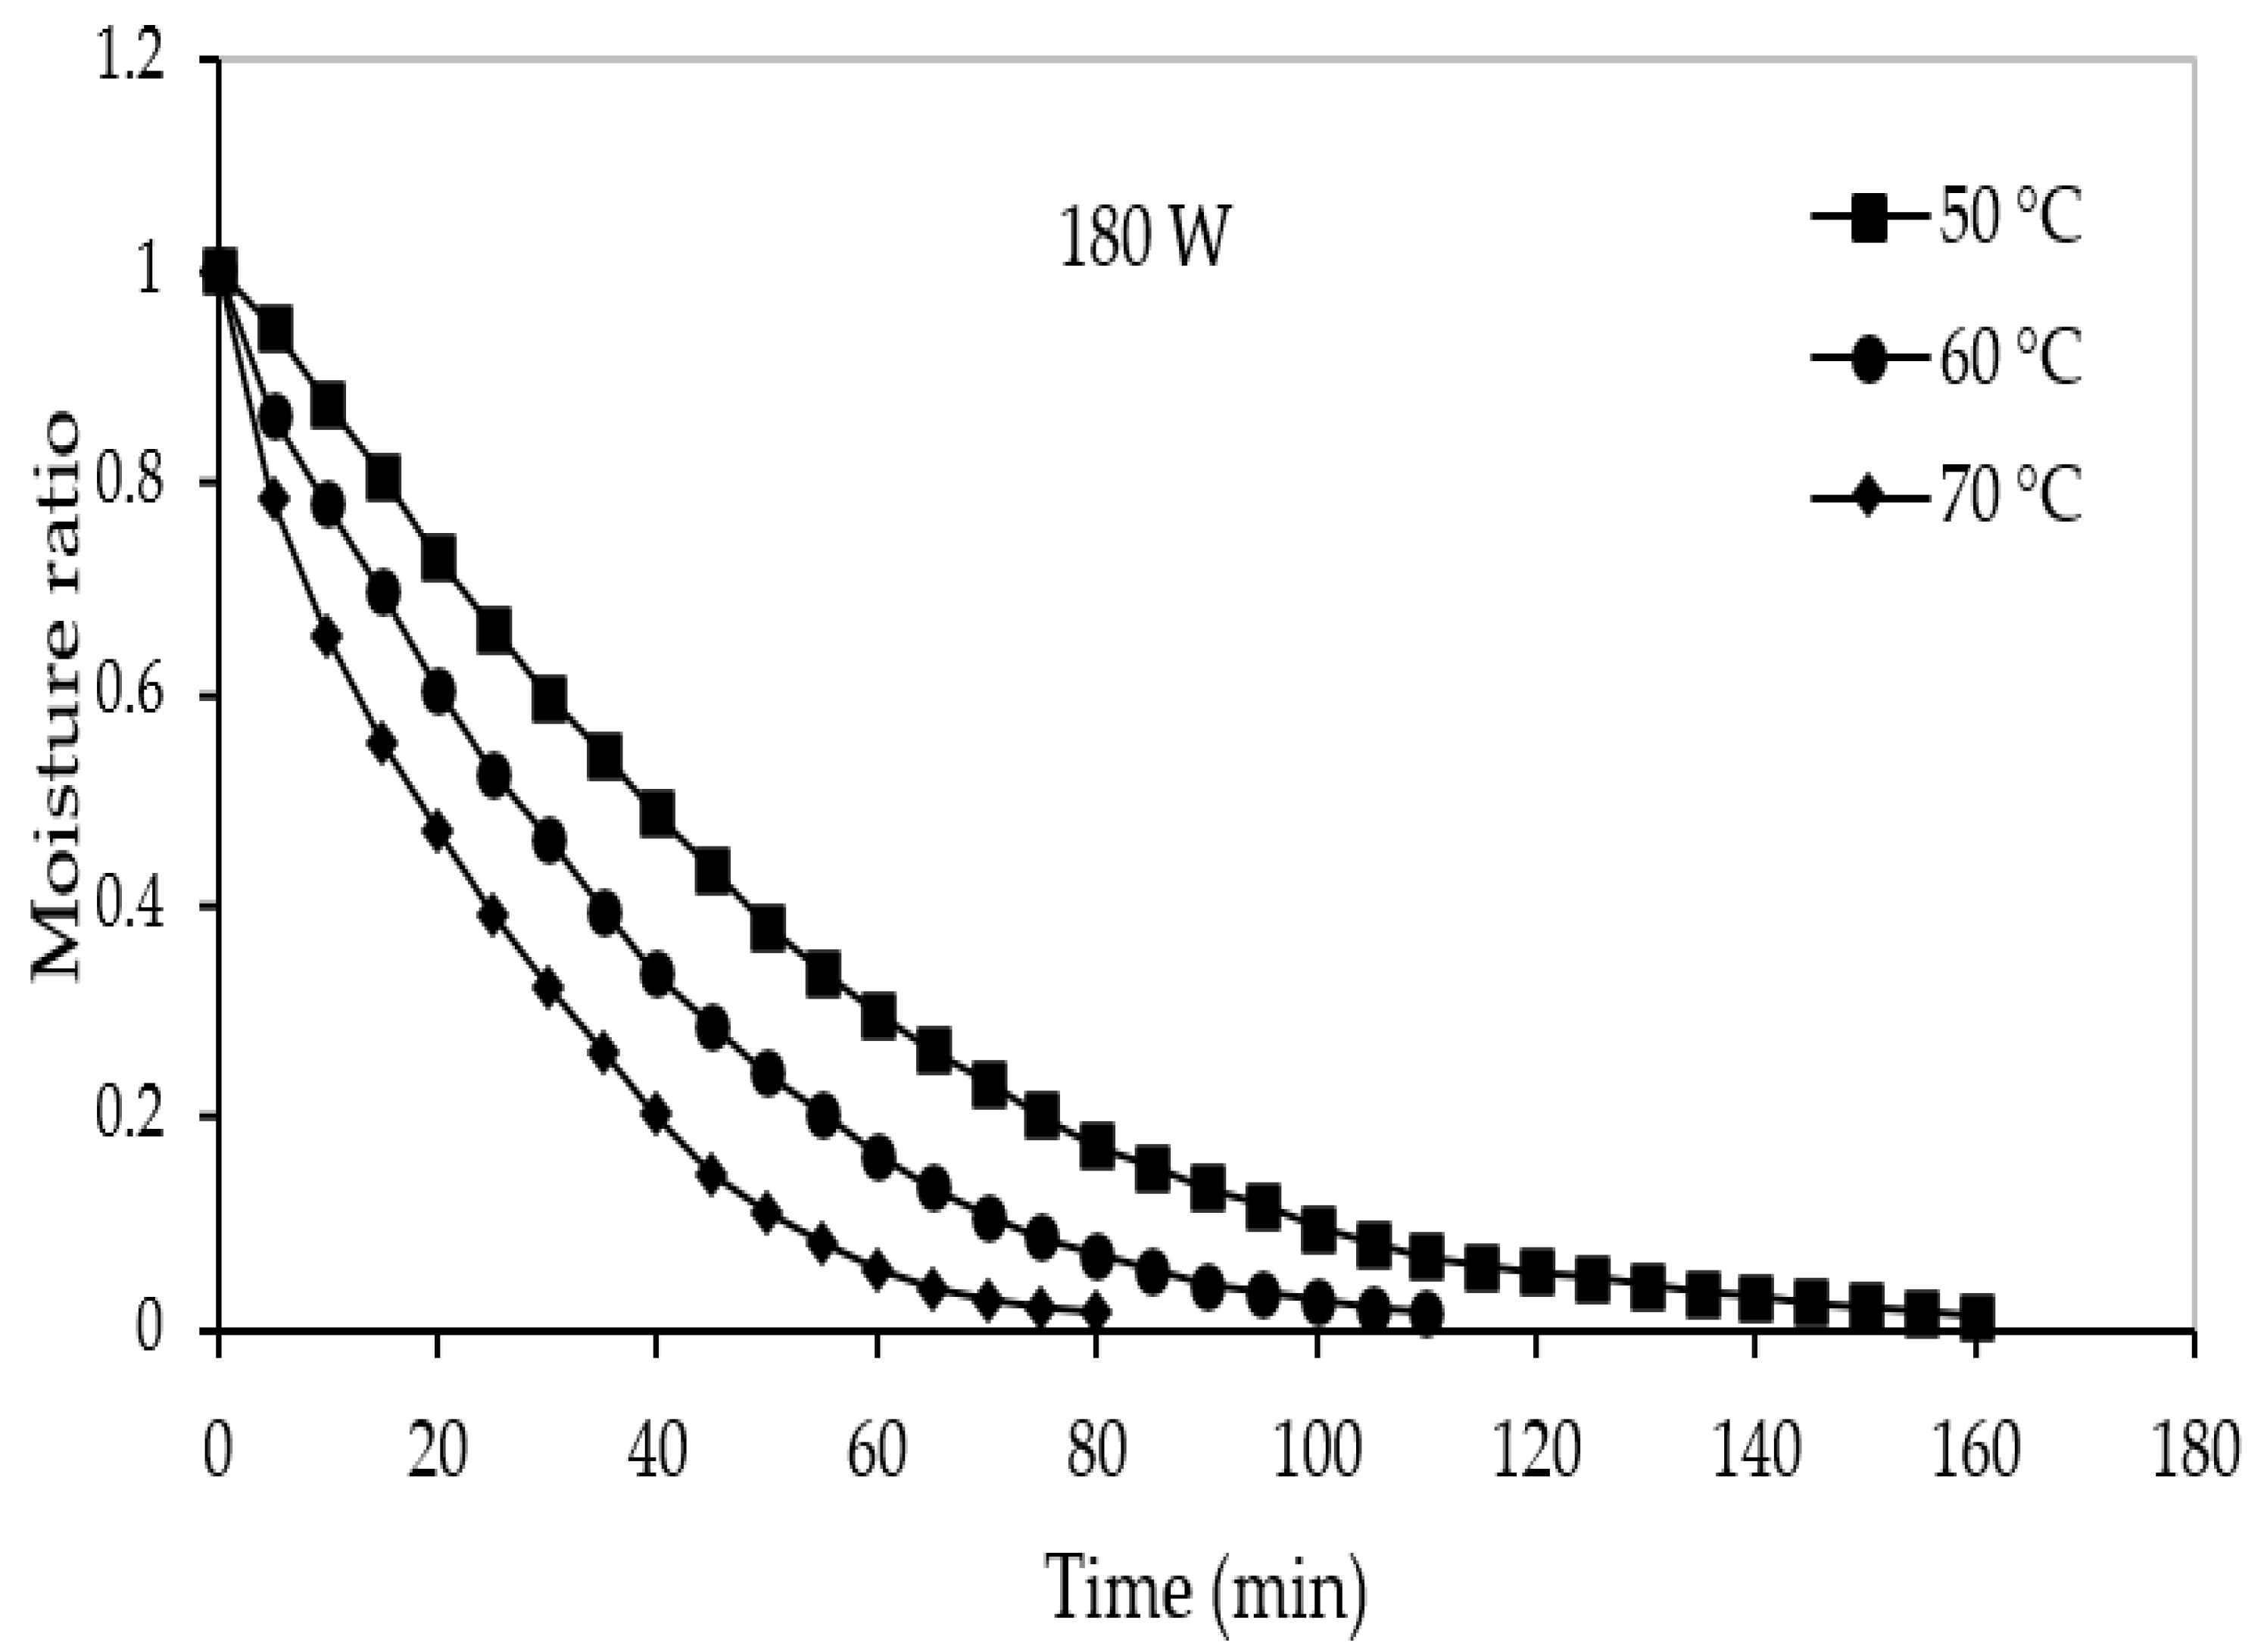
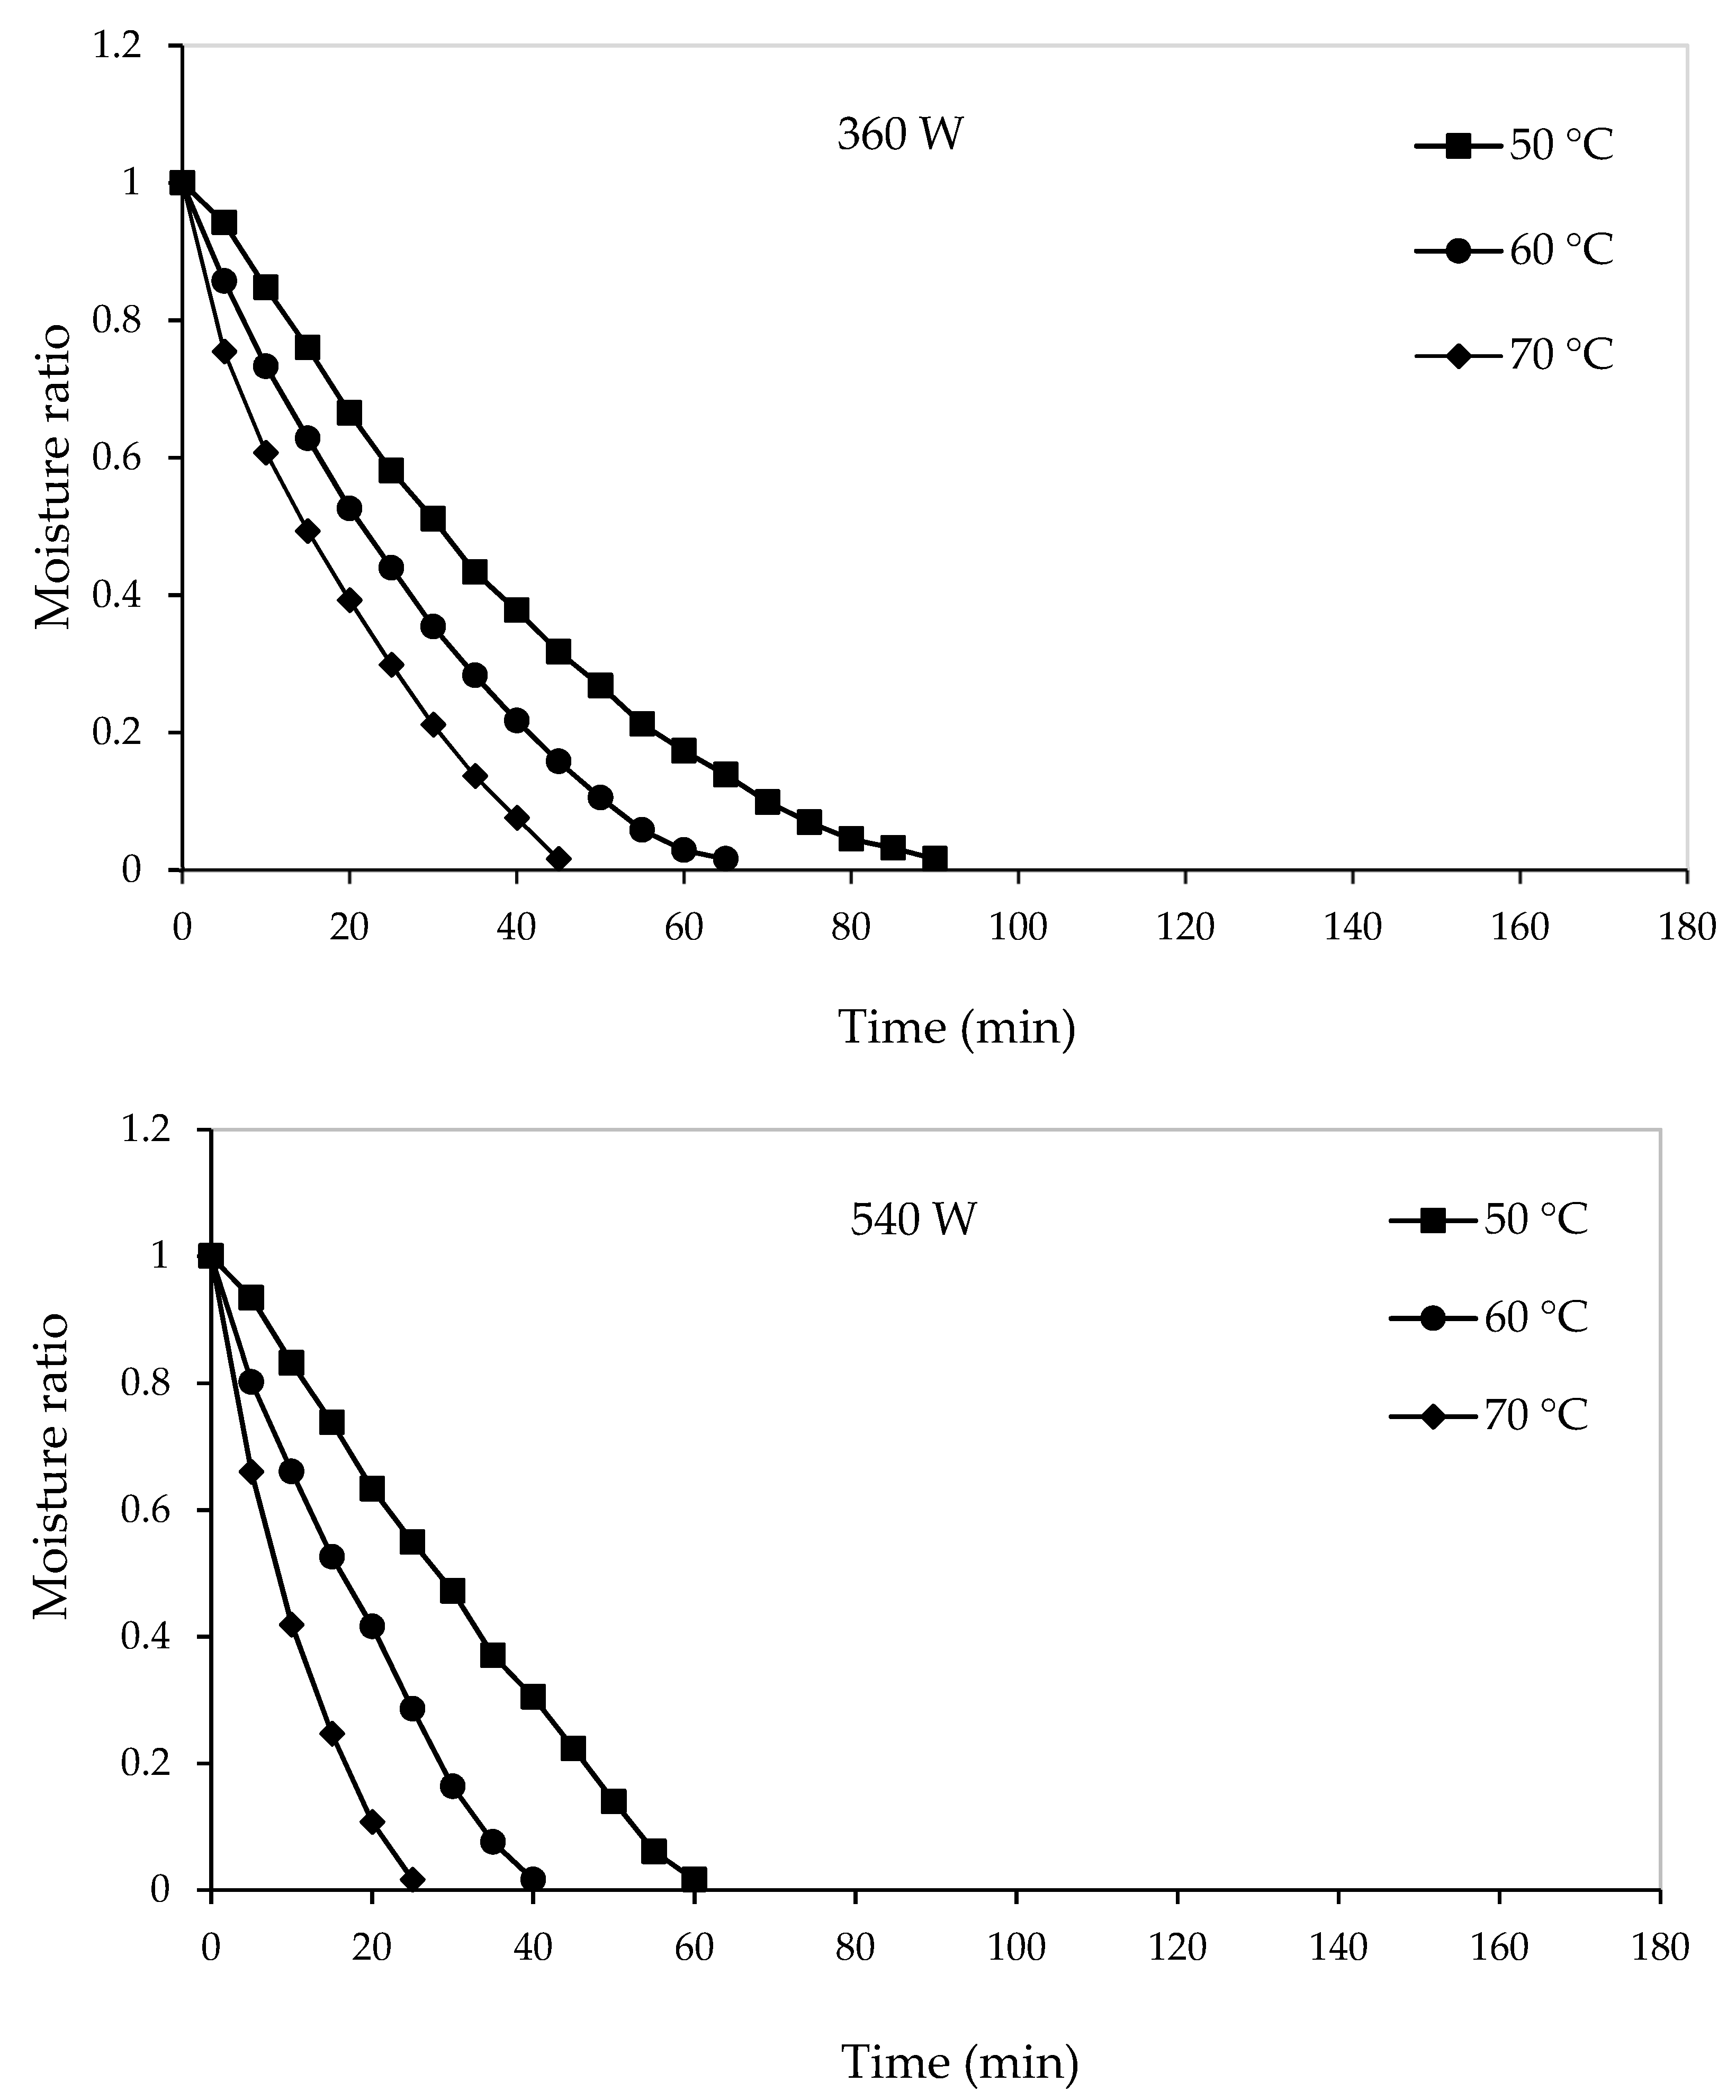
3.1. Drying Kinetics
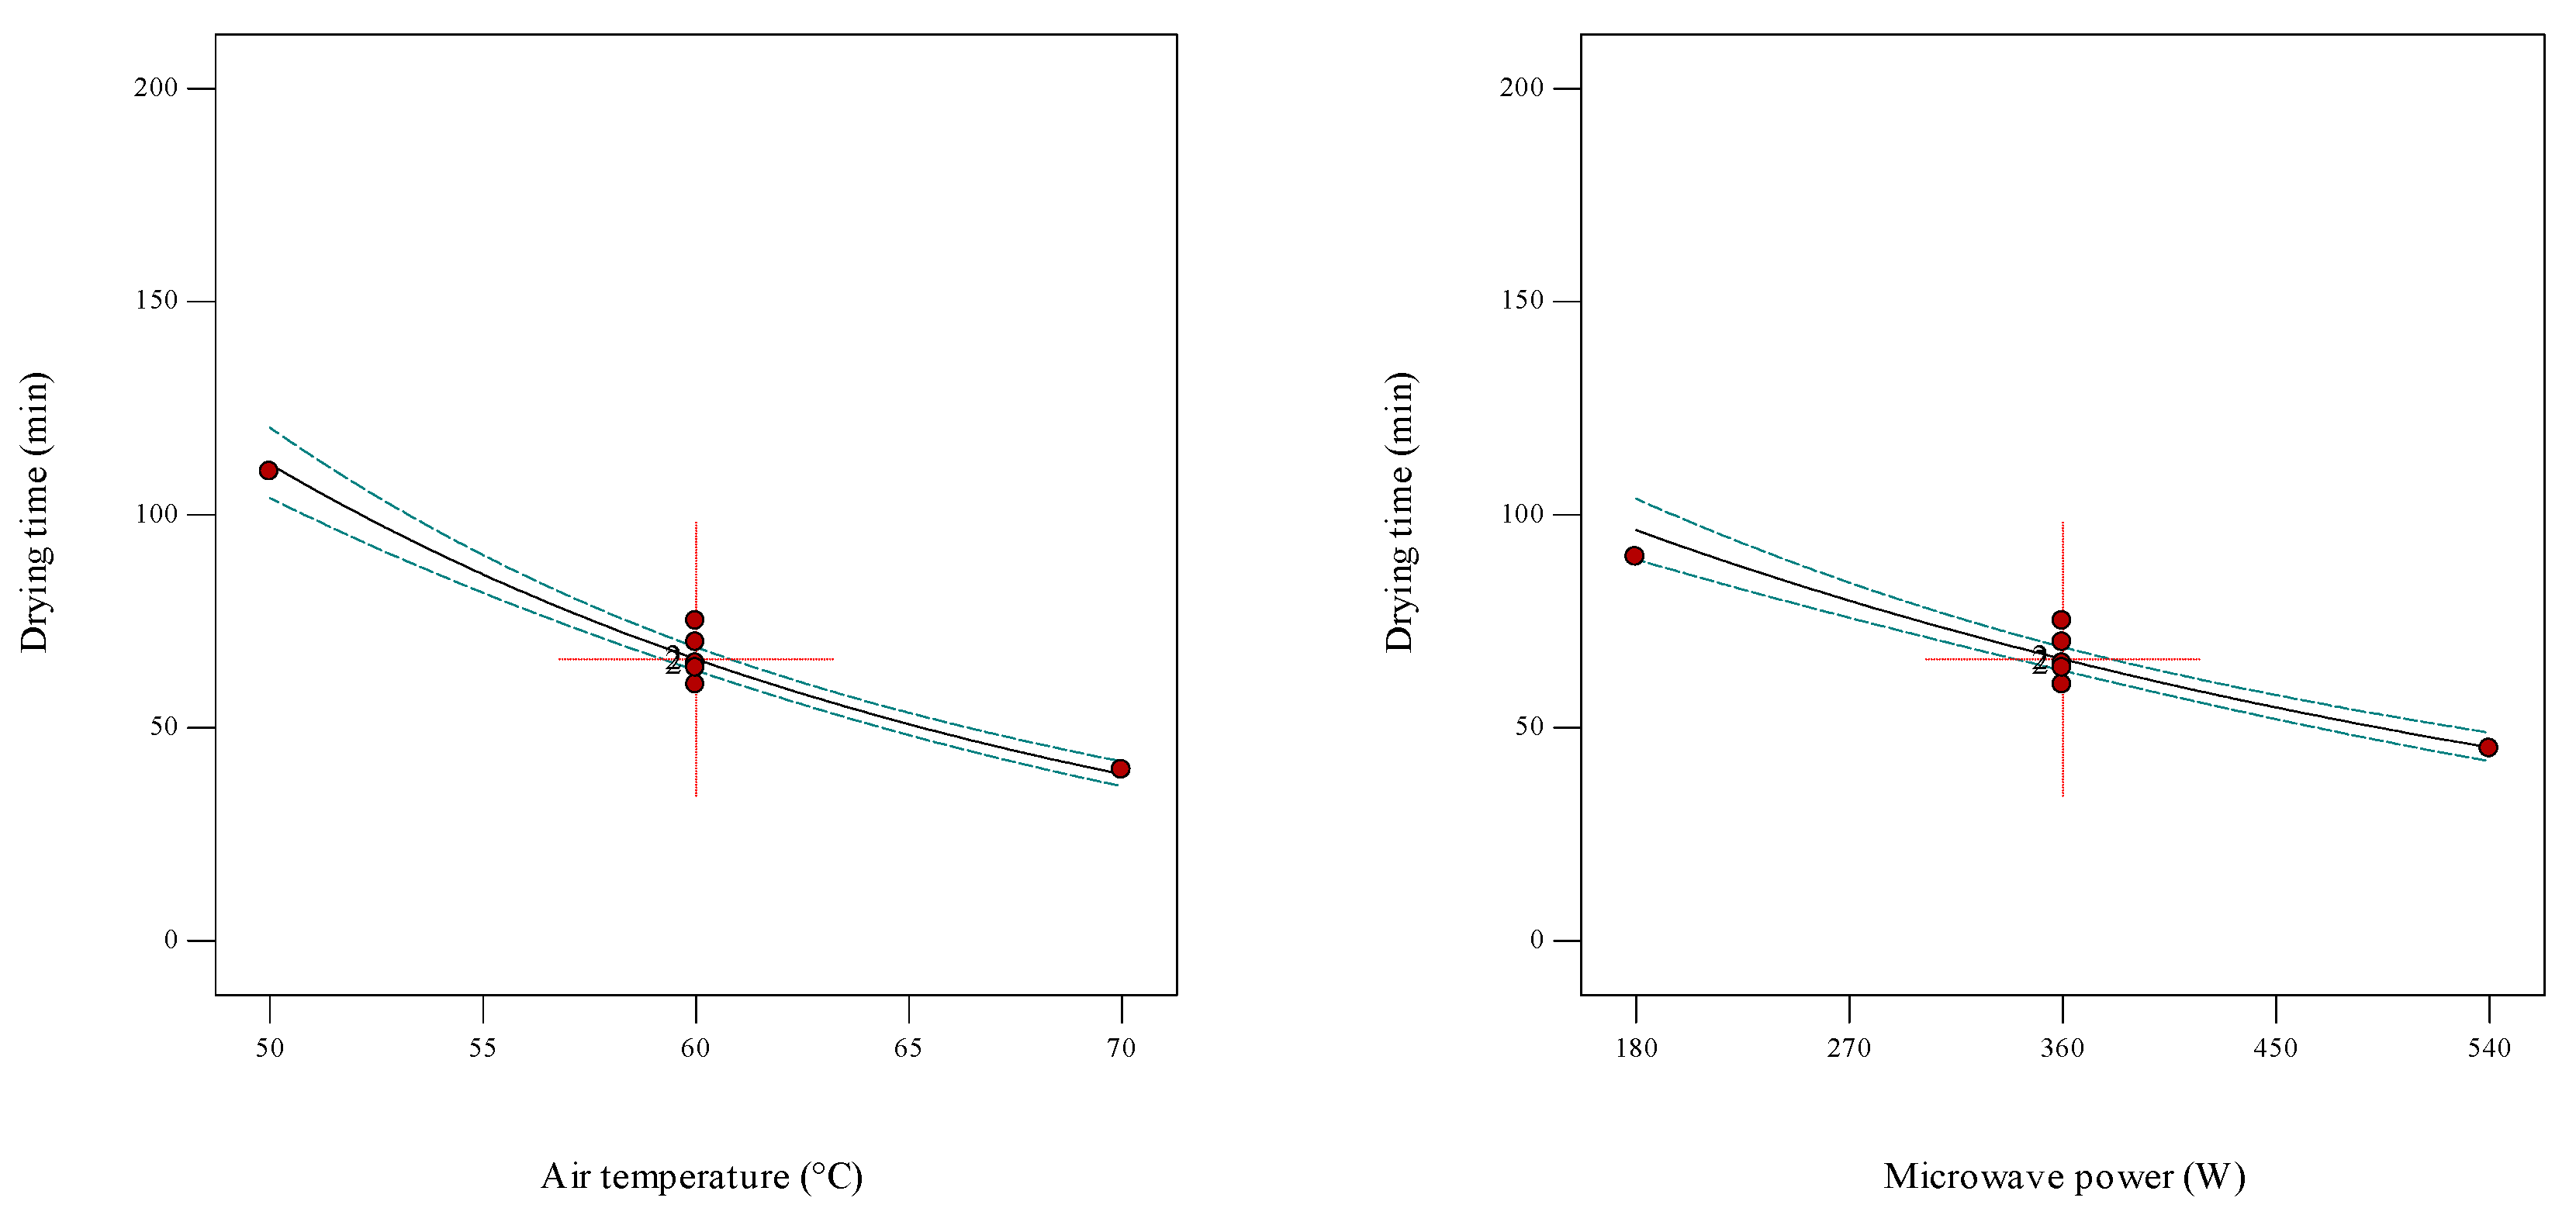
3.2. Drying Time
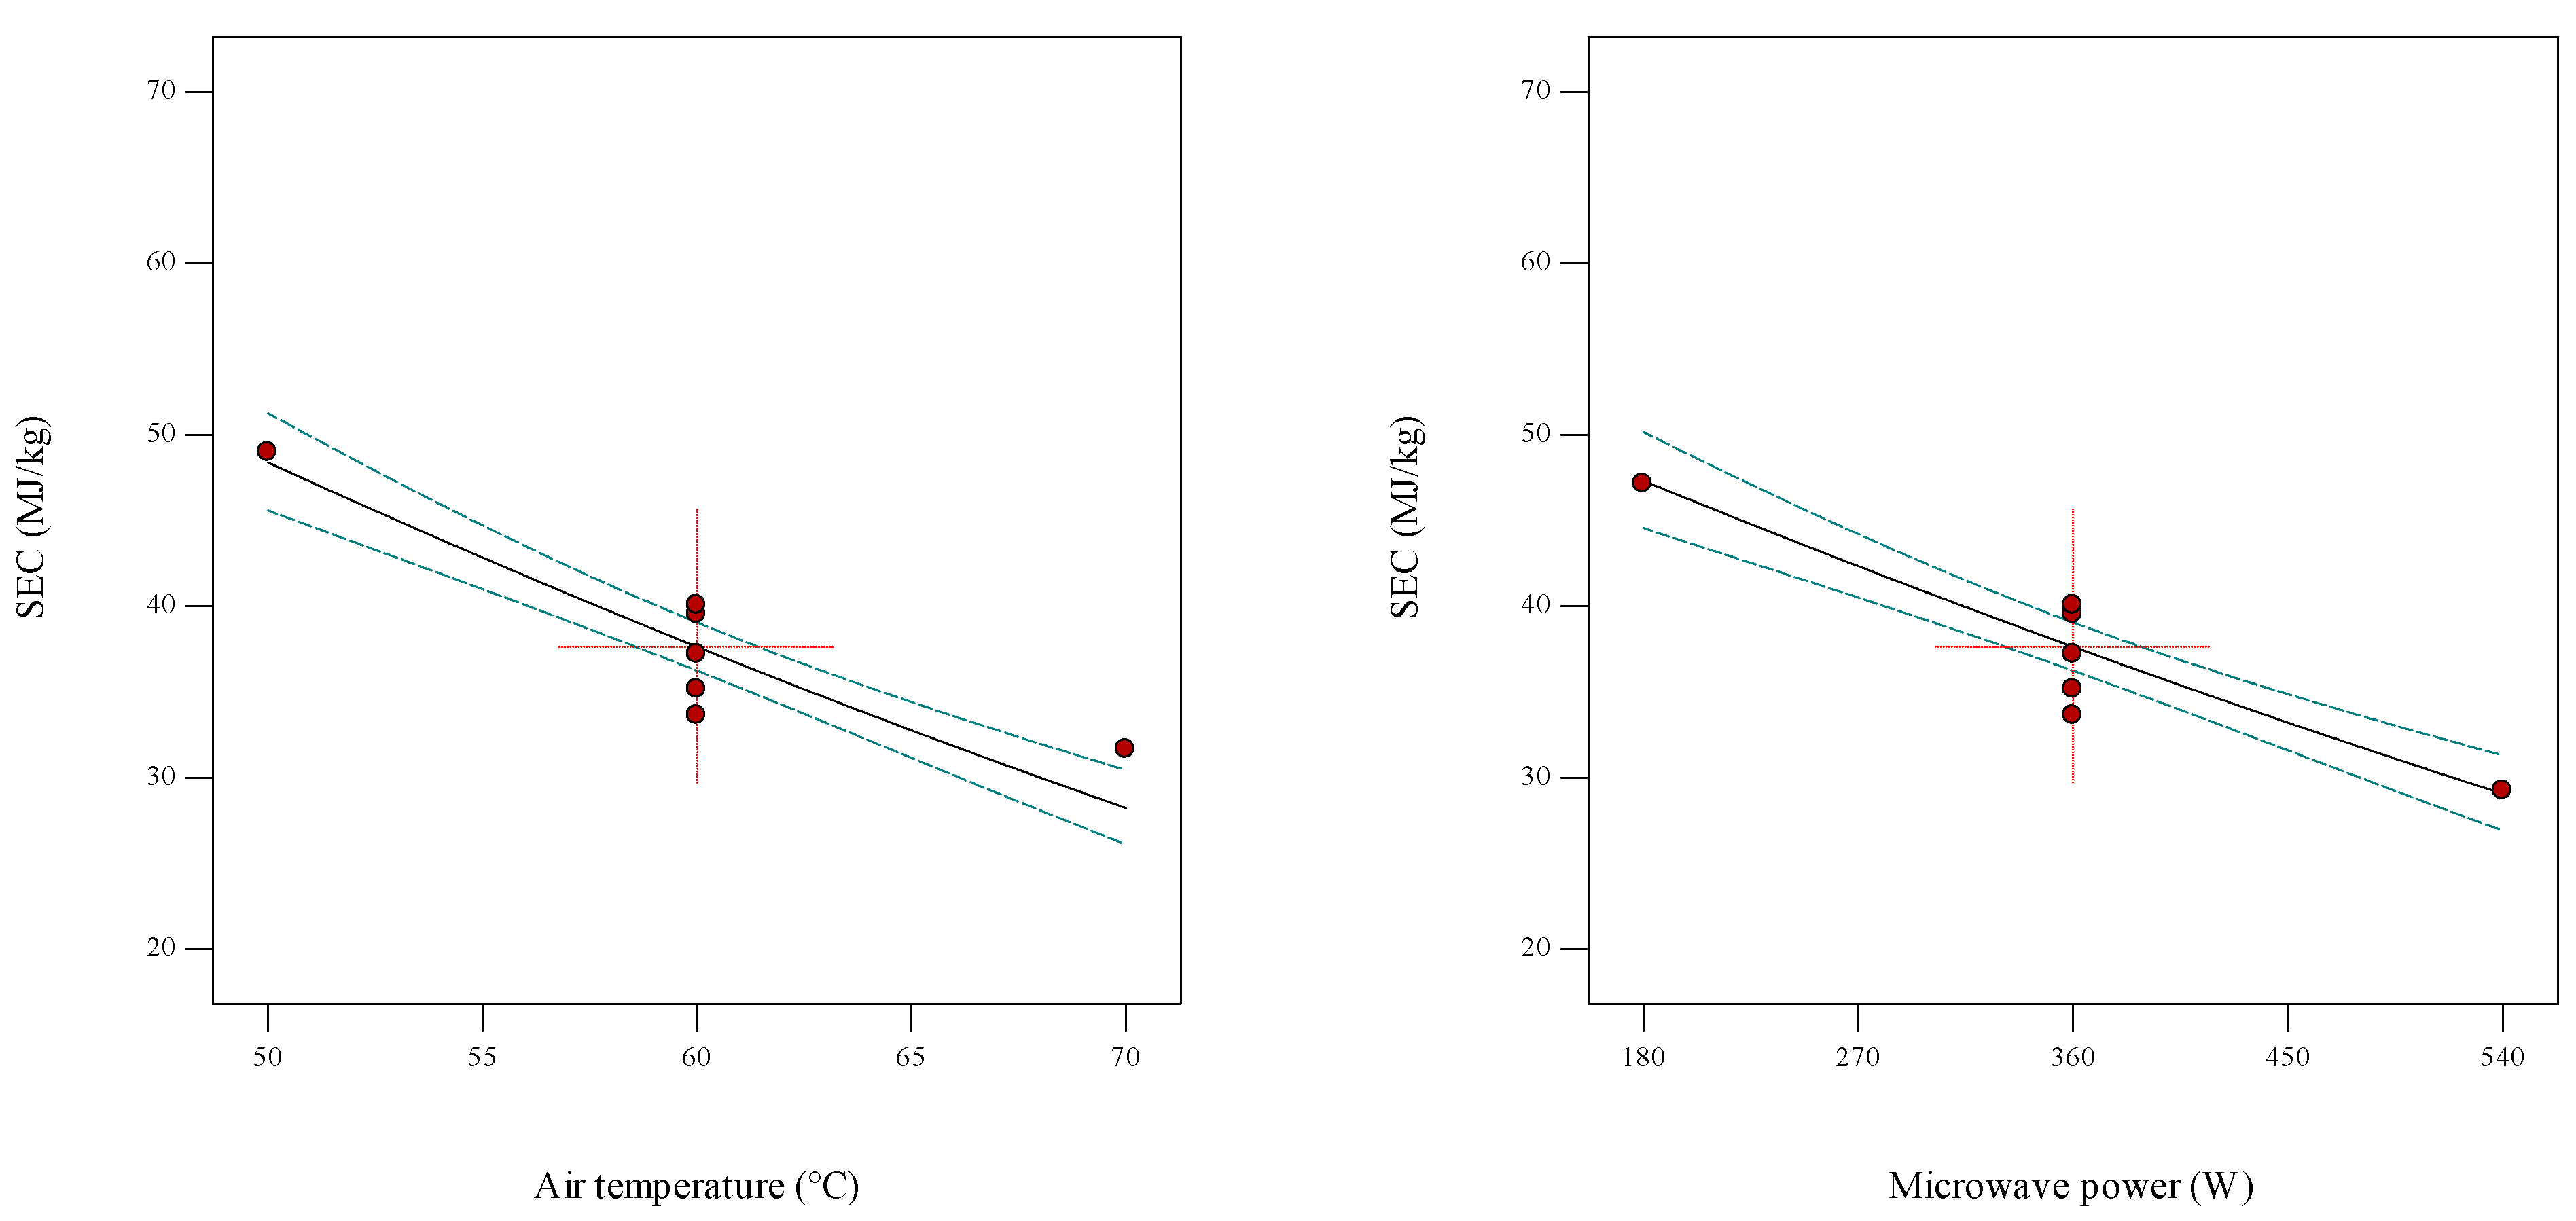
3.3. SEC
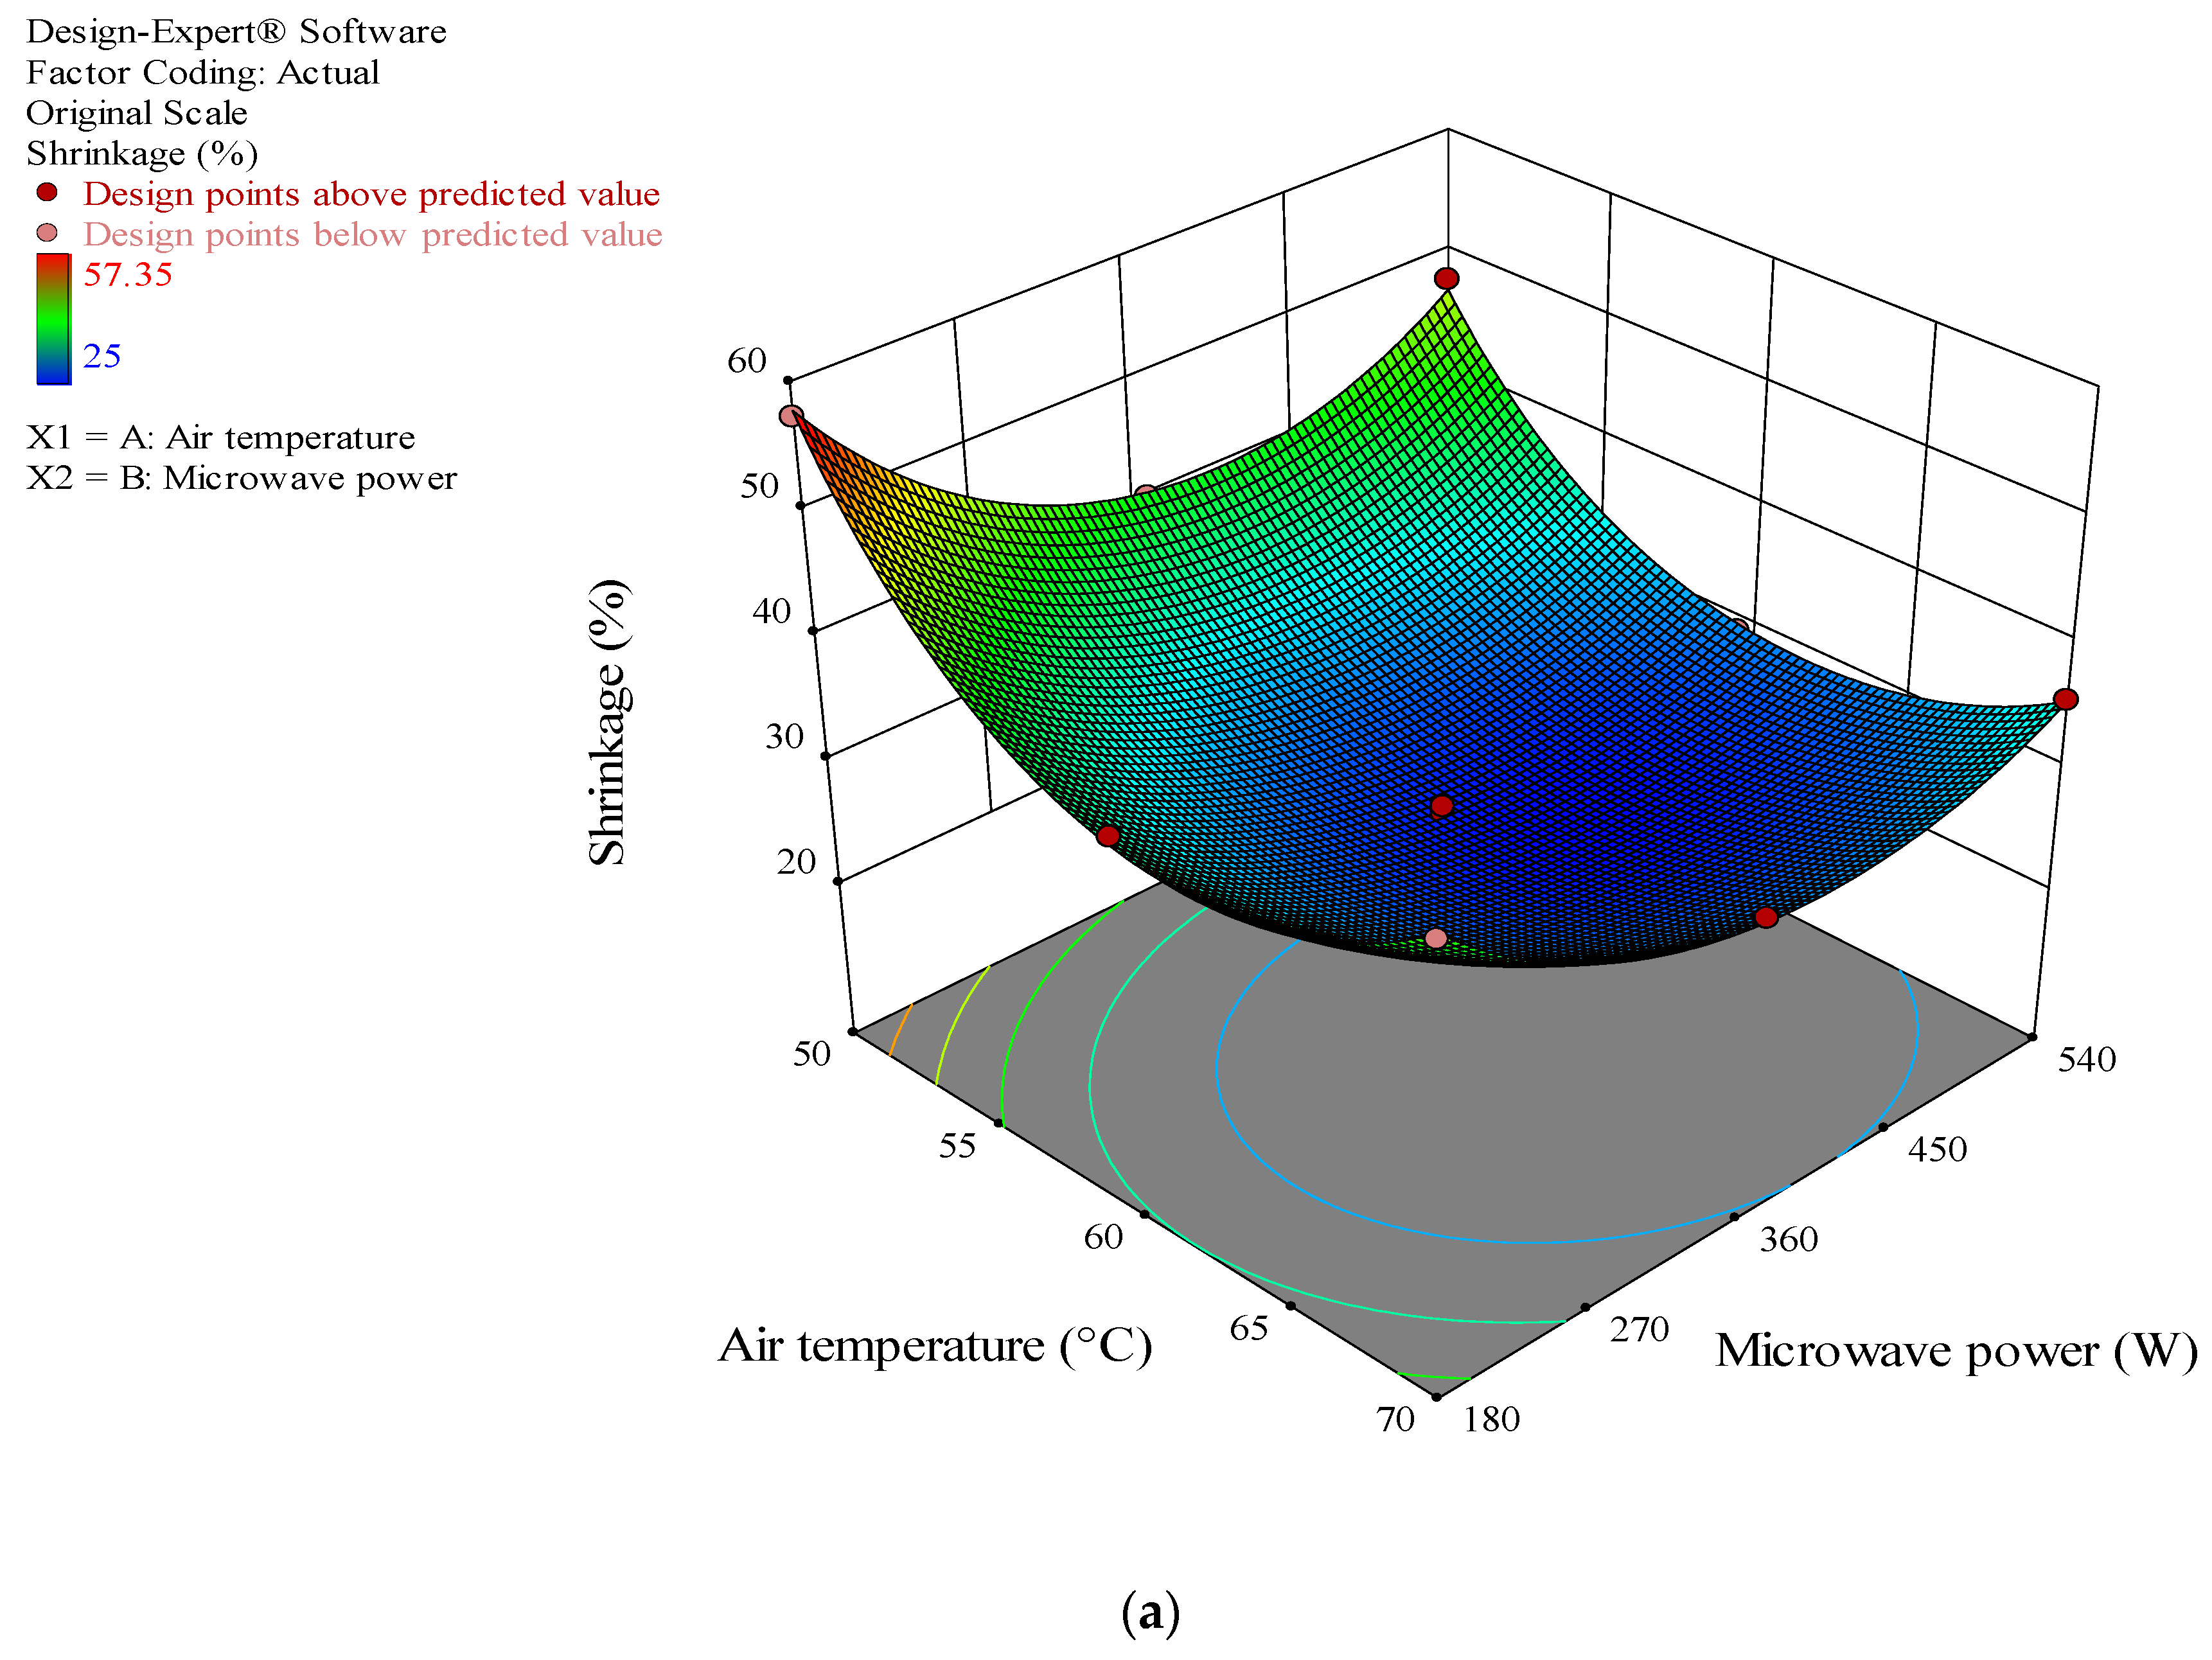
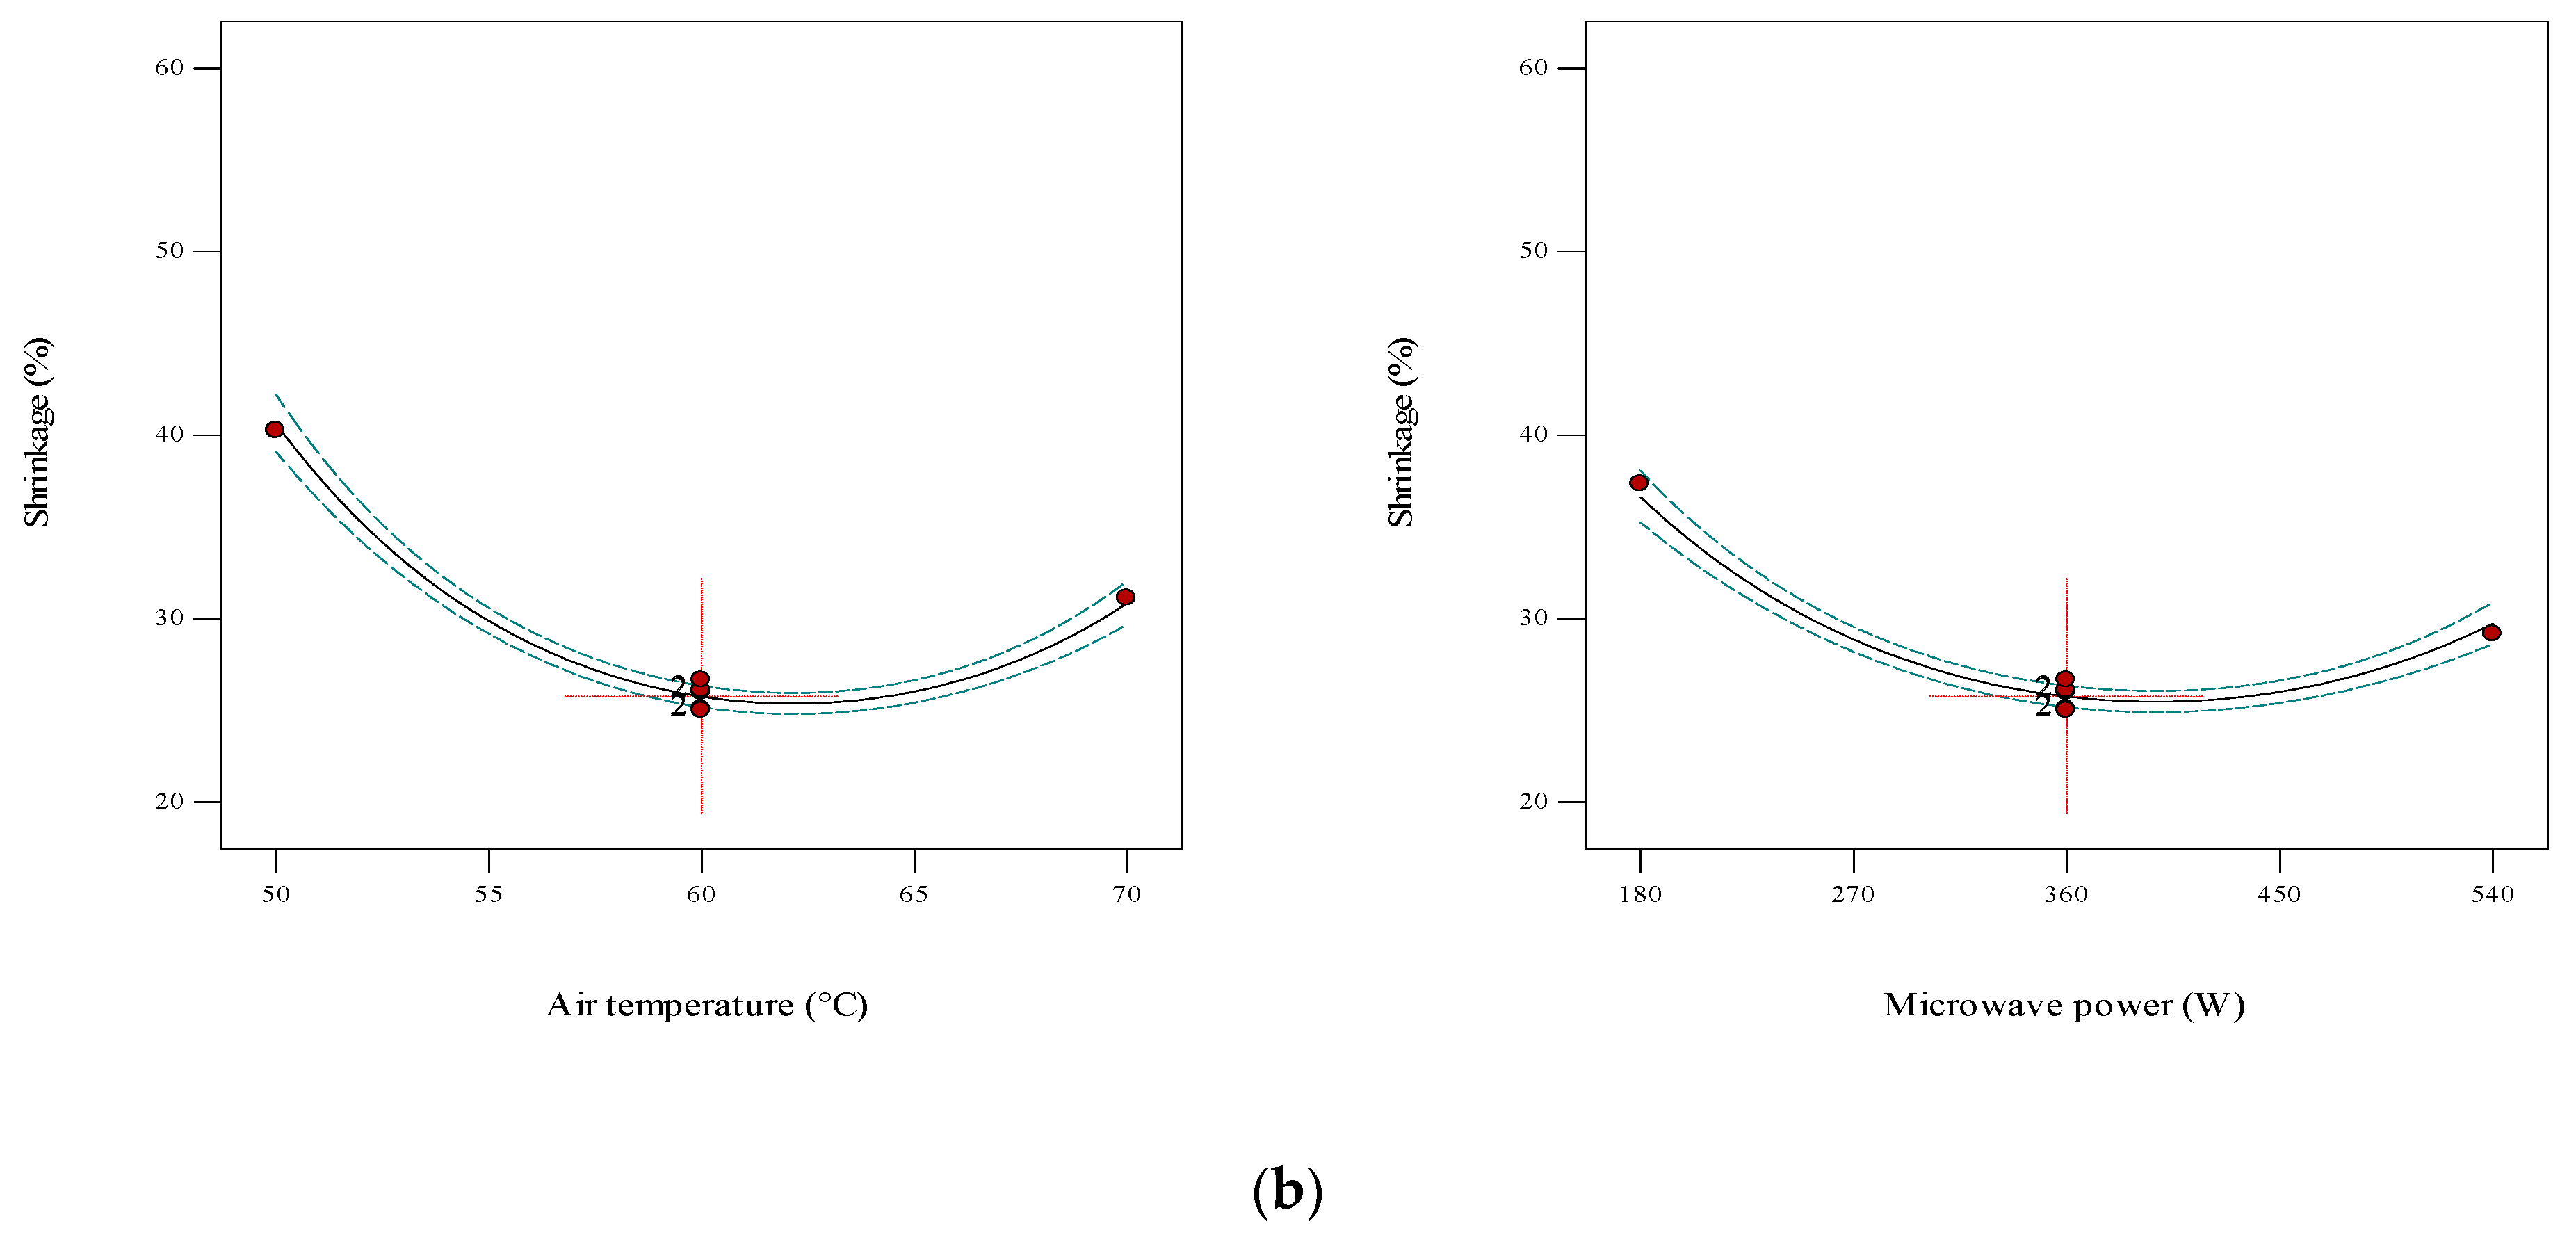
3.4. Shrinkage
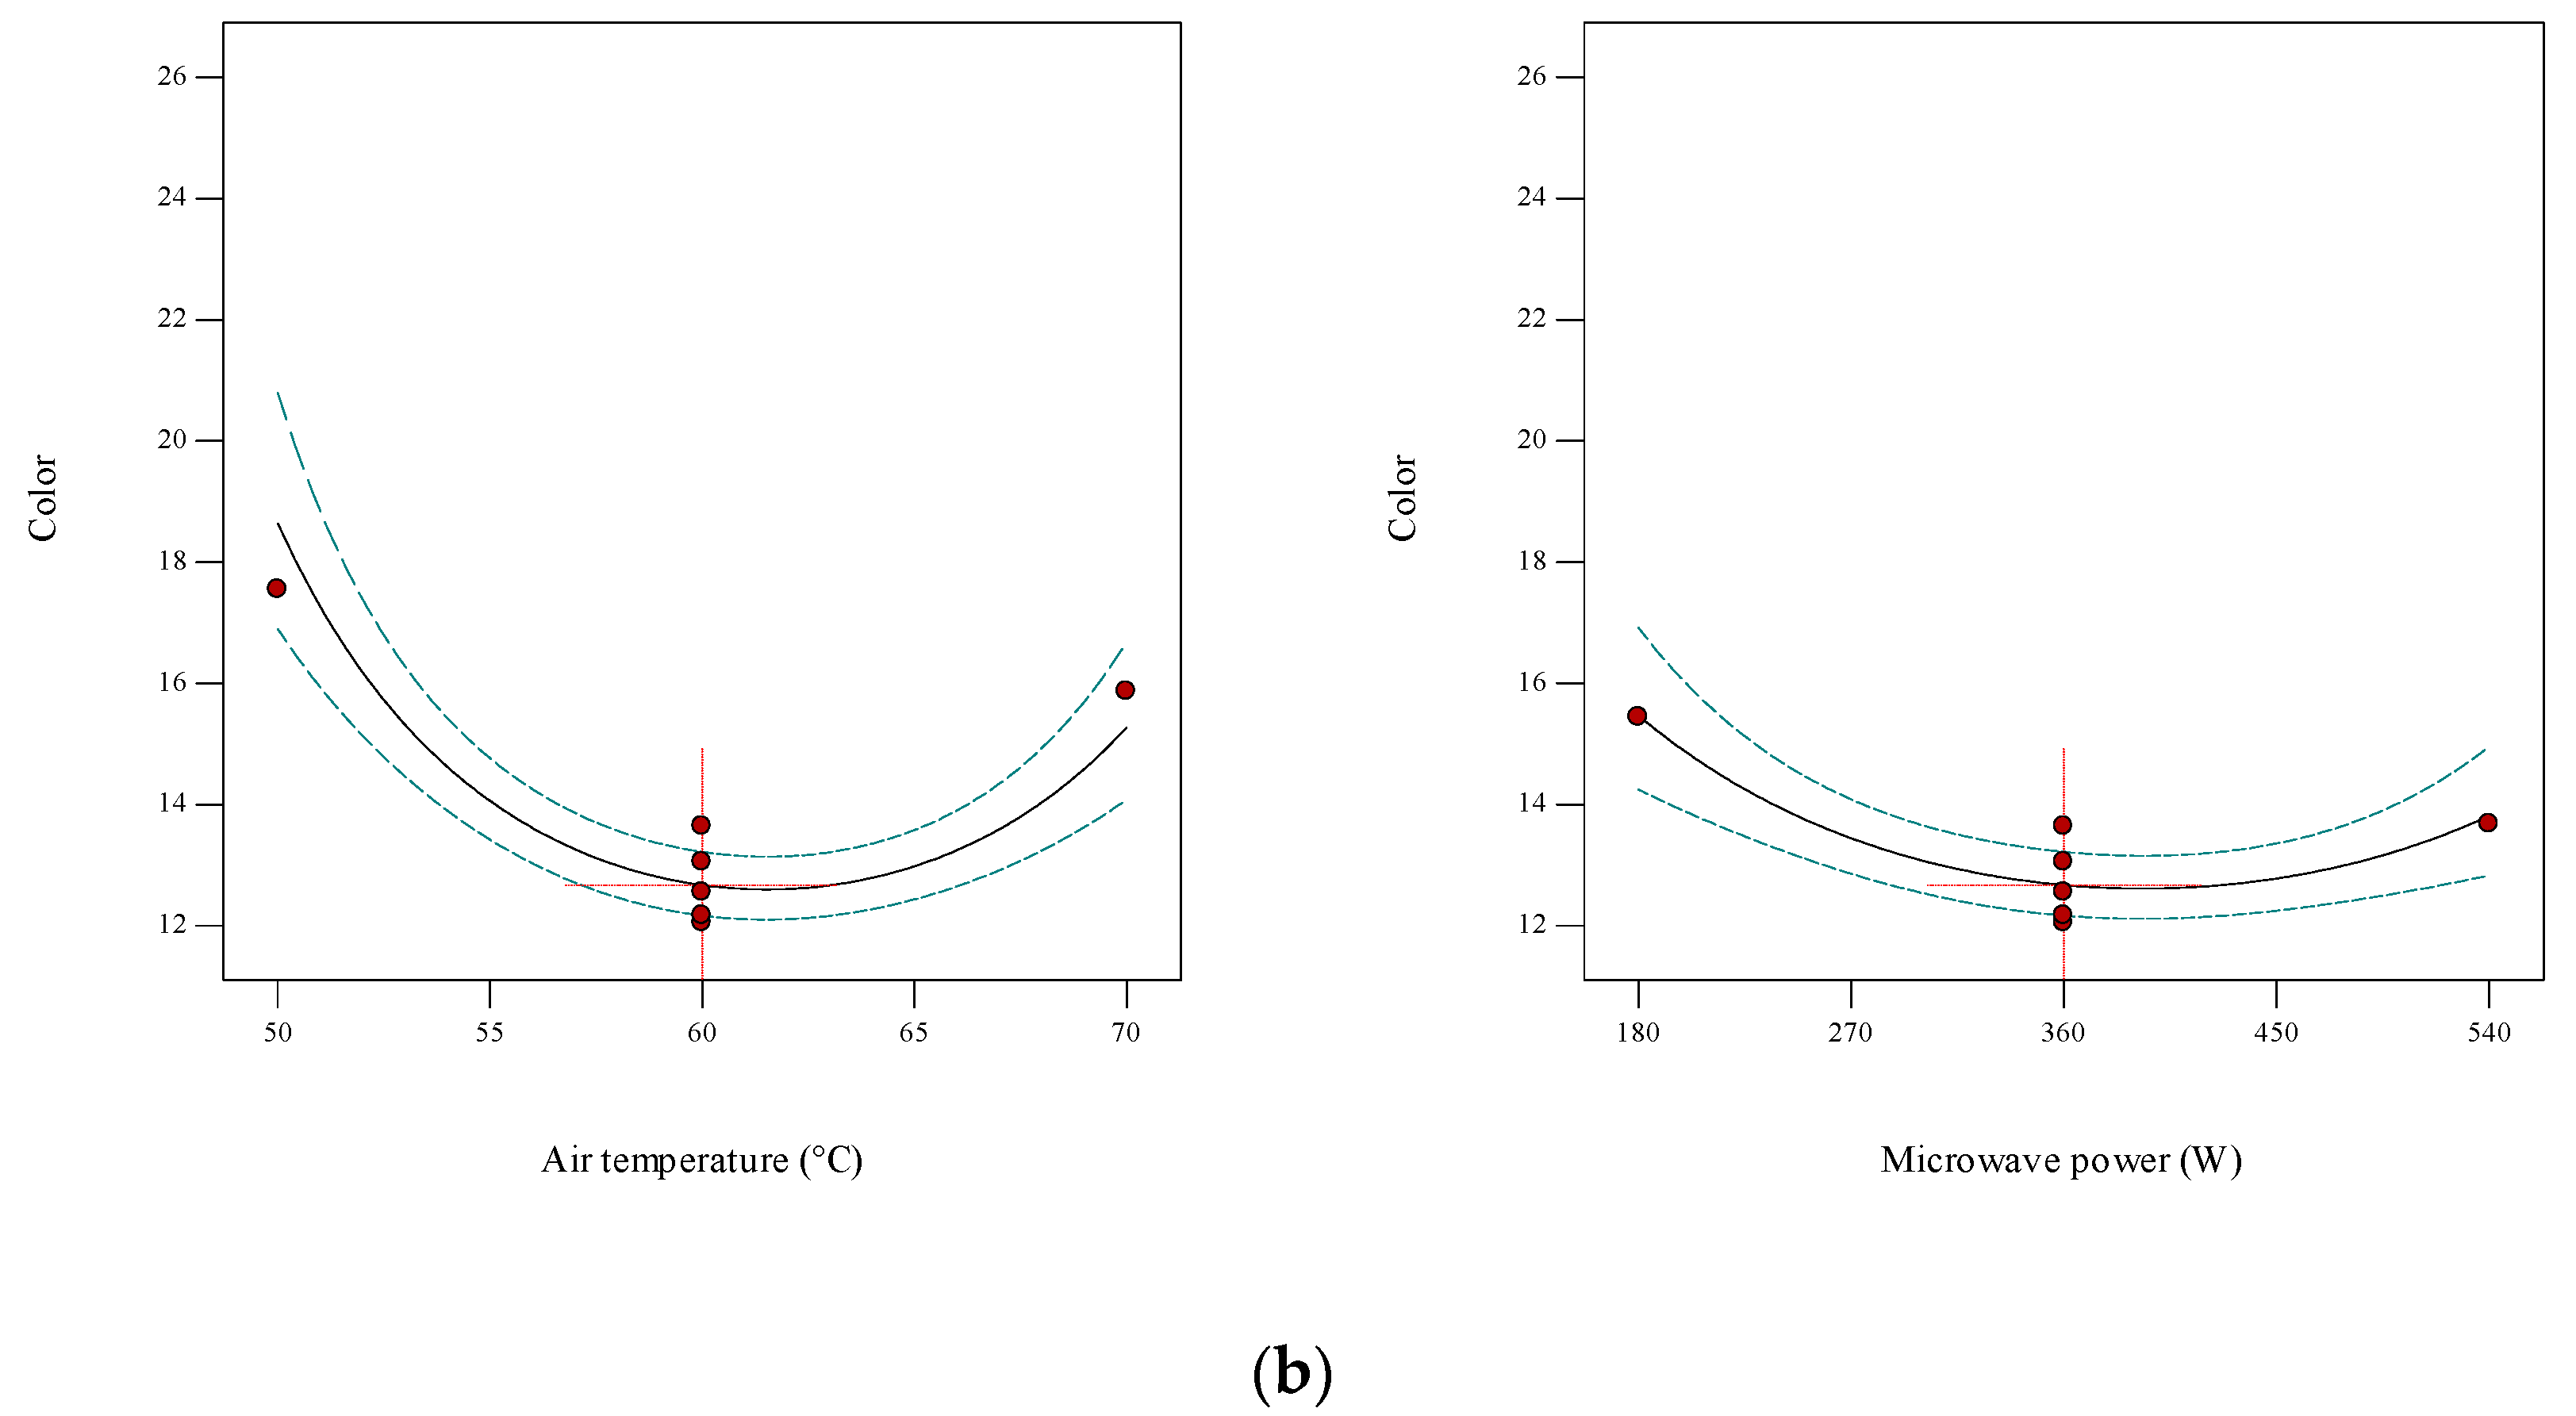
3.5. Color
3.6. Rehydration Ratio
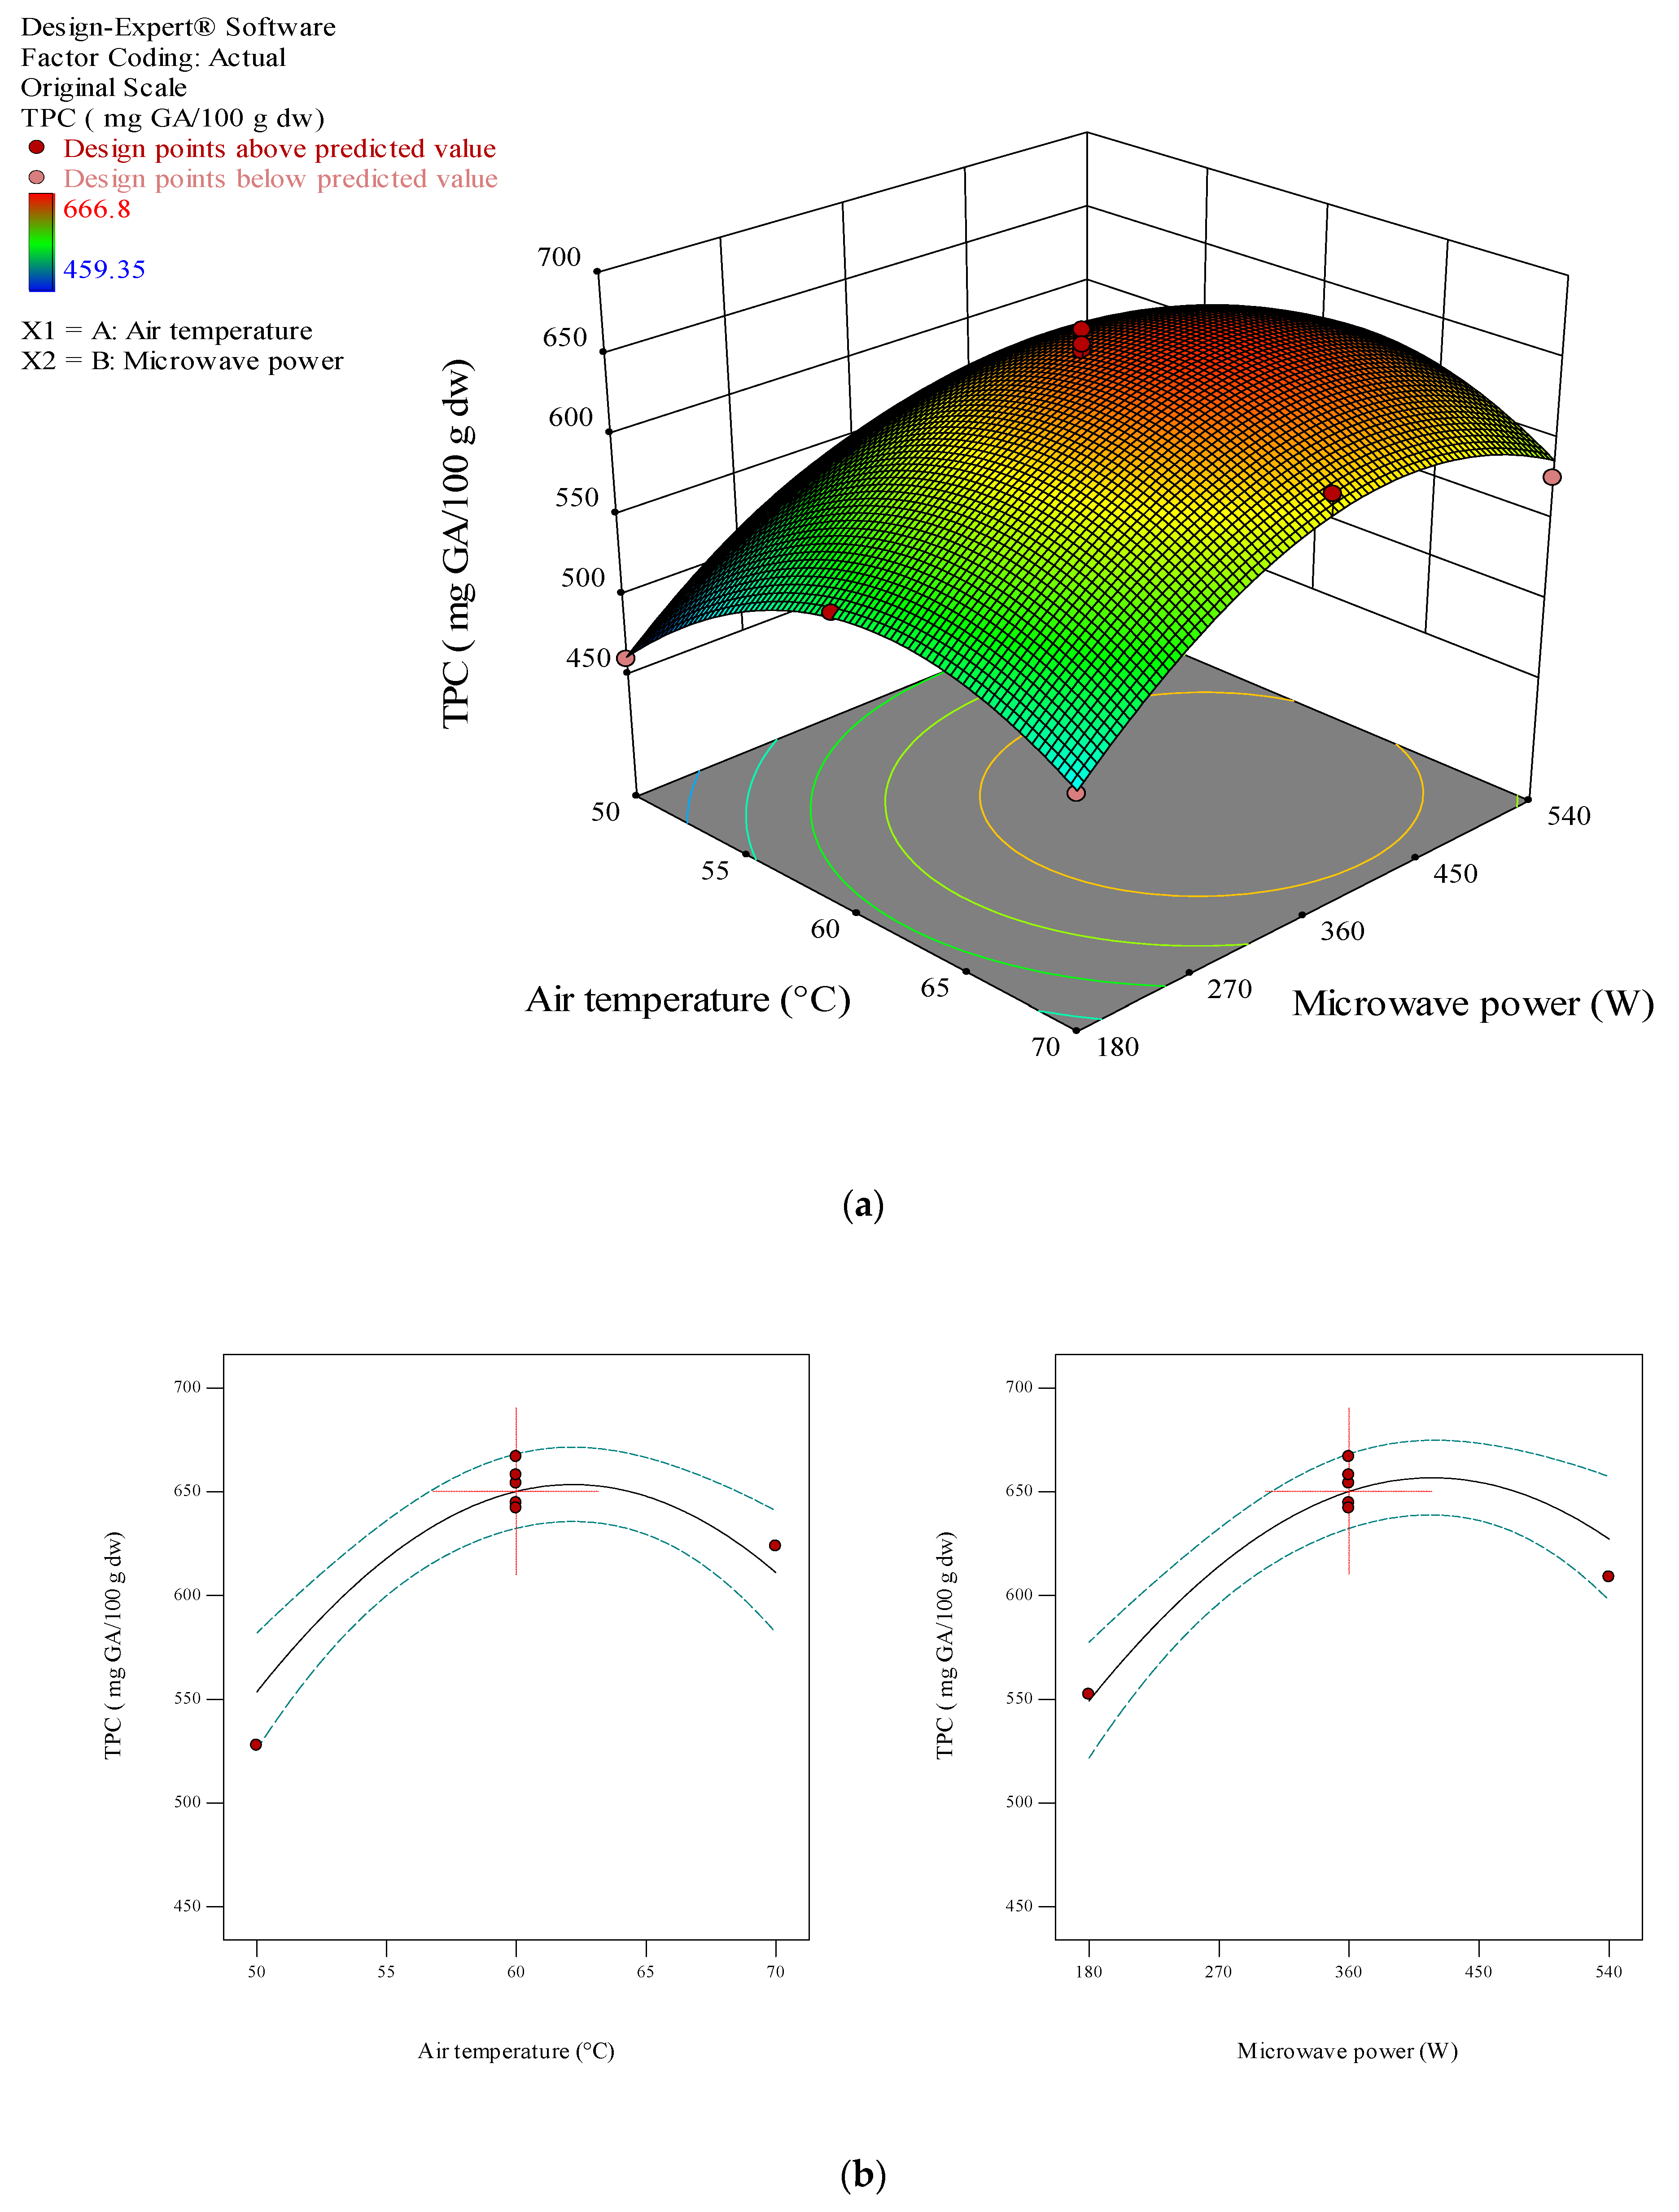
3.7. Total Phenol Content (TPC)
3.8. Antioxidant Capacity
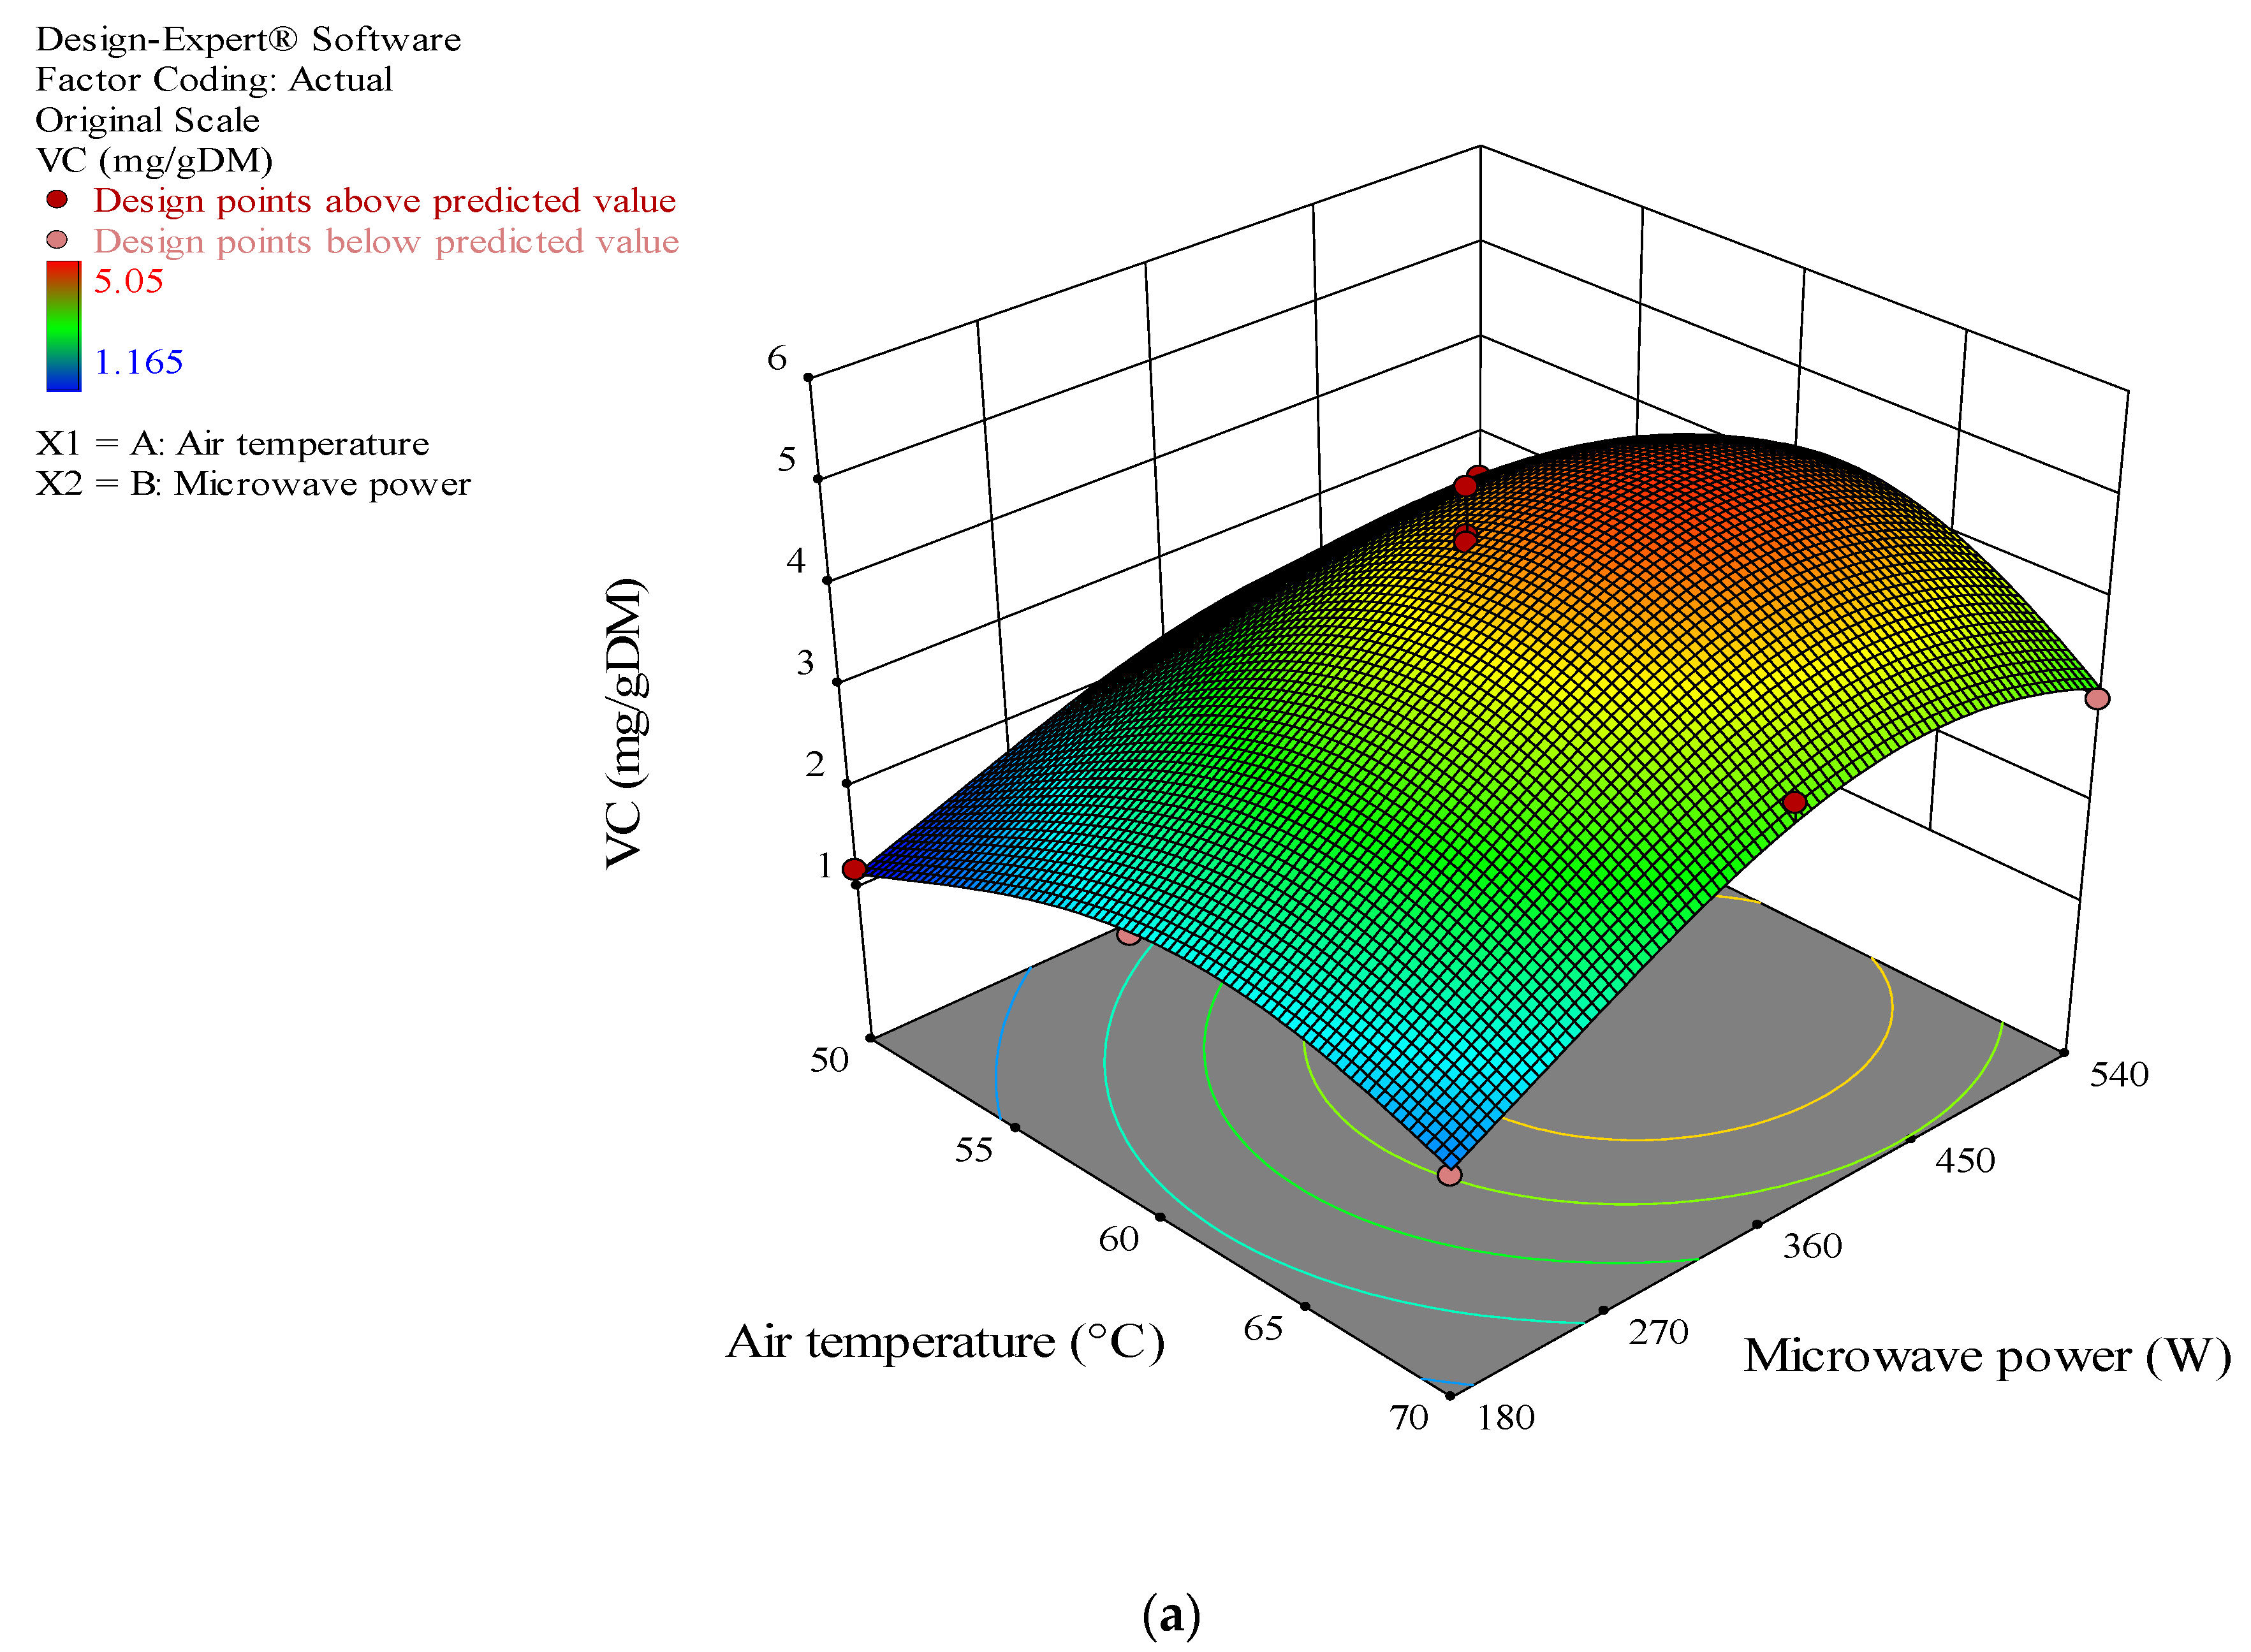
3.9. Vitamin C
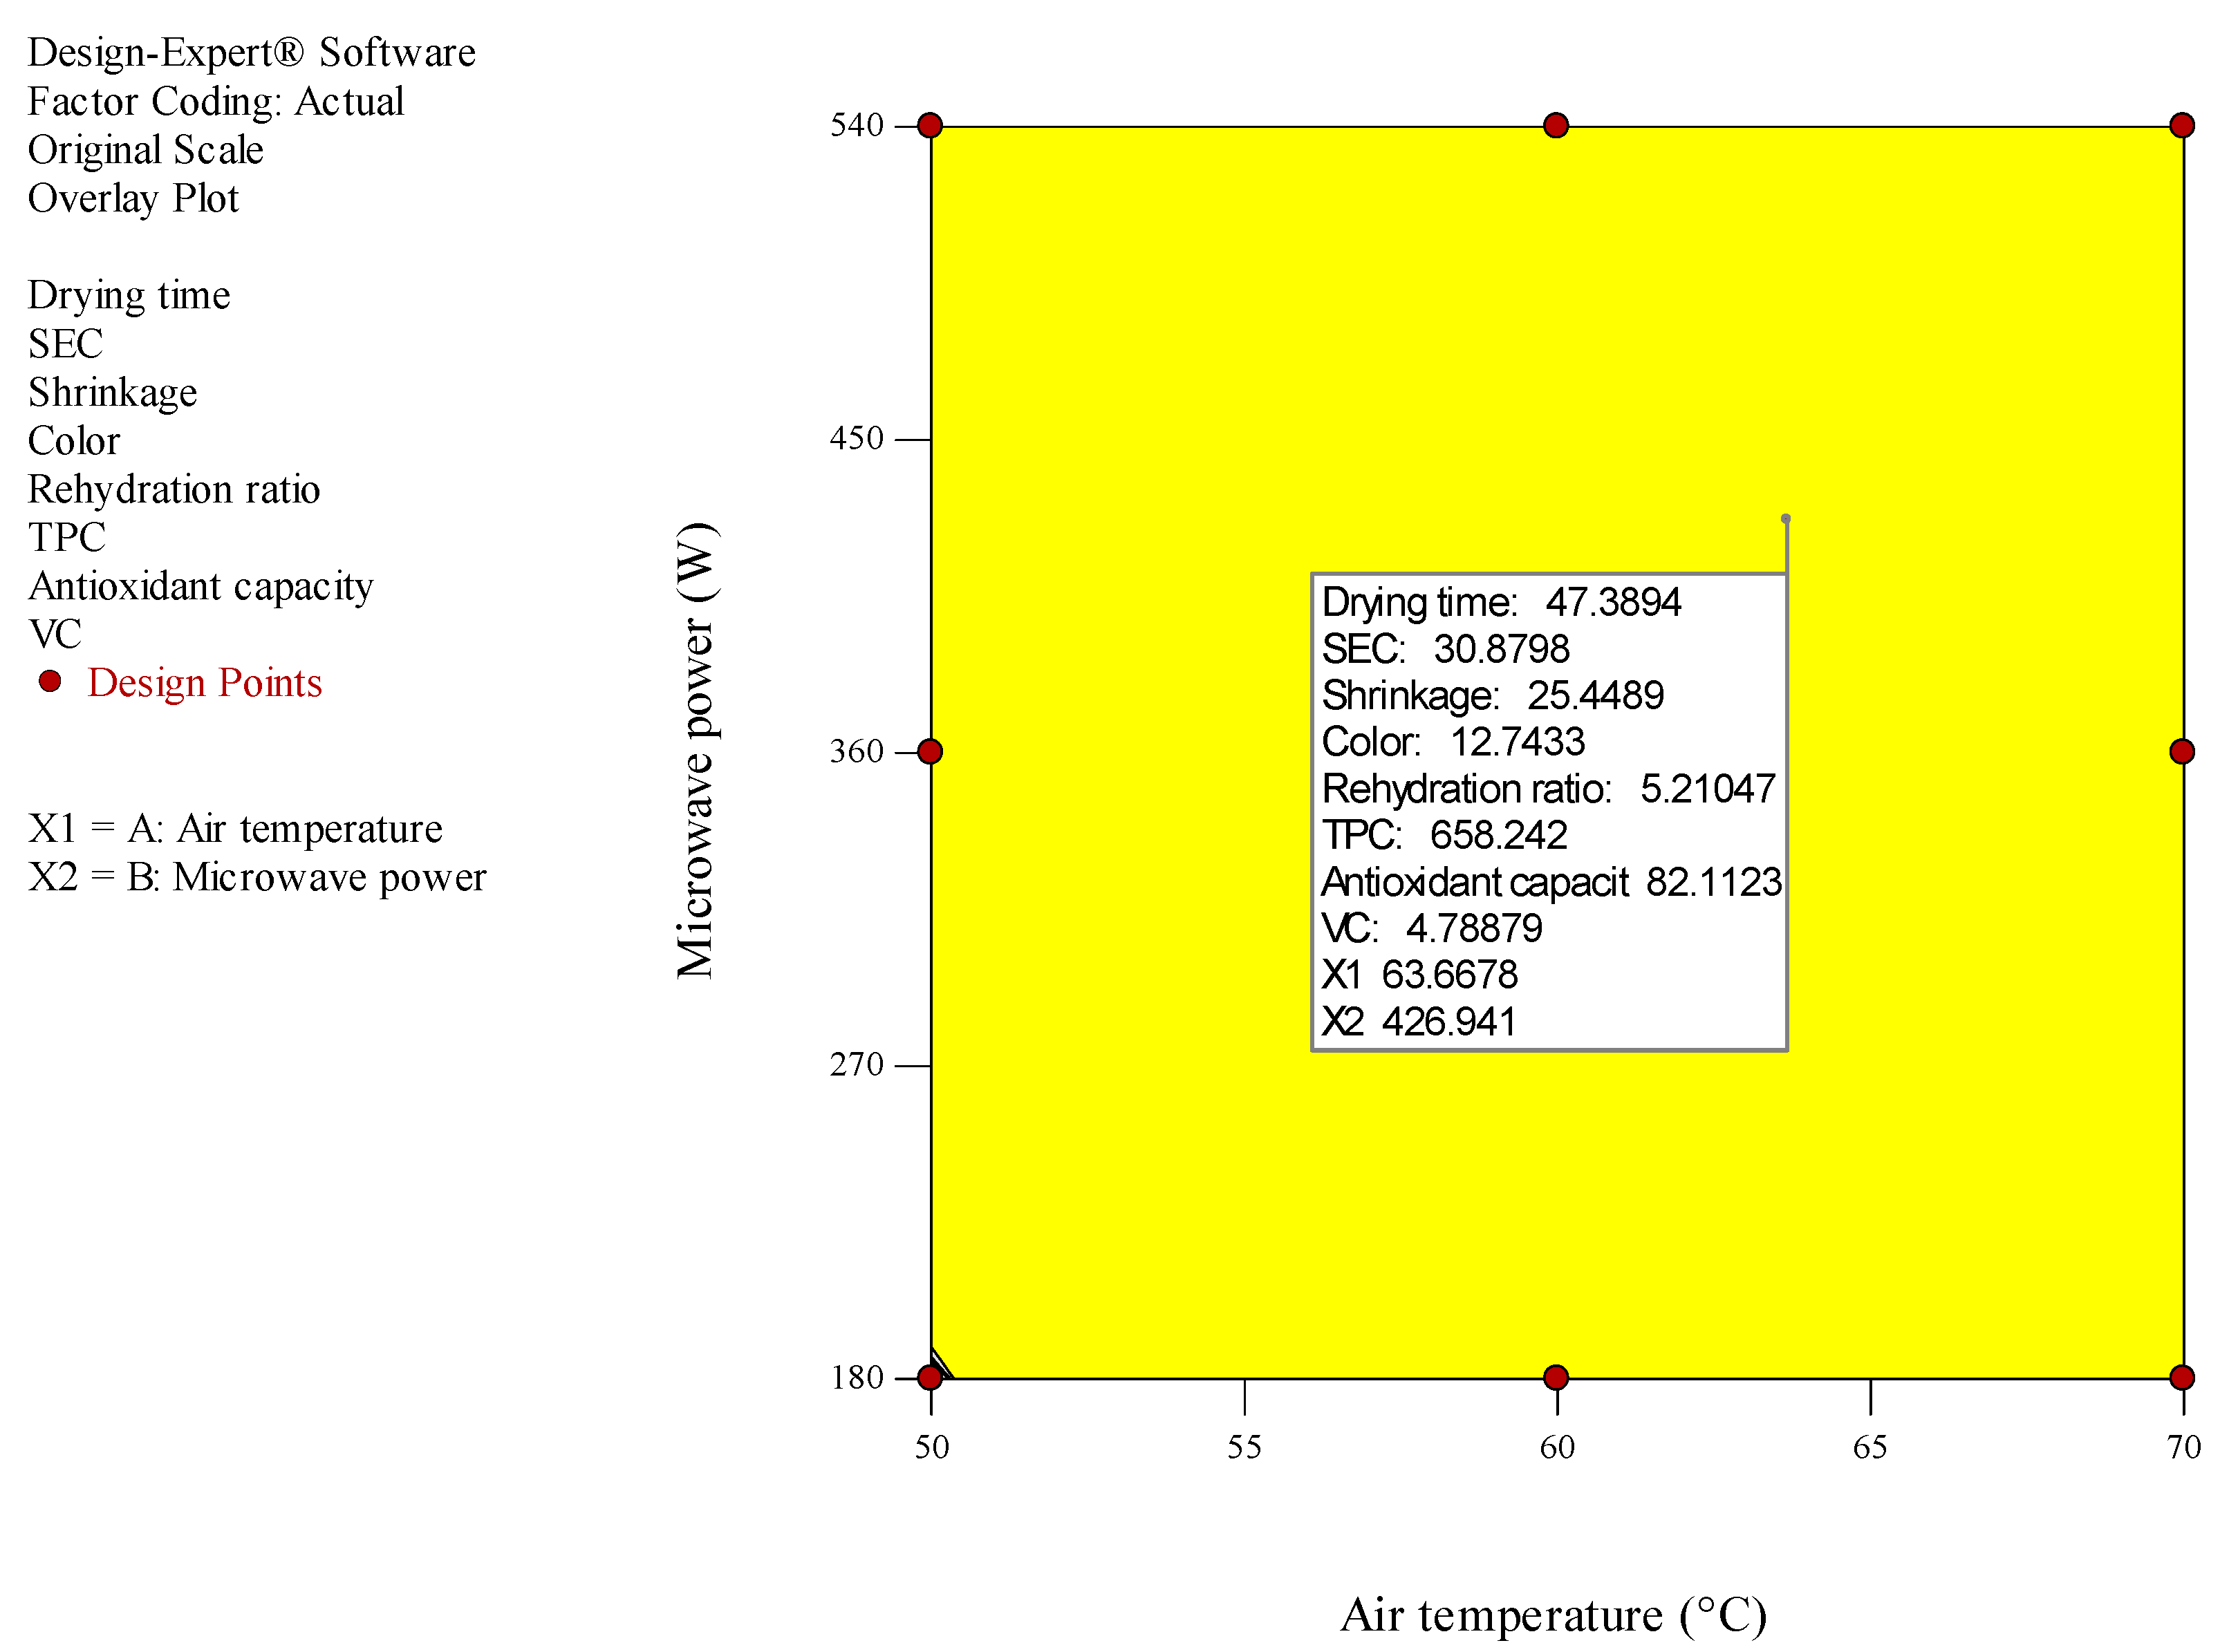
3.10. Optimization
4. Conclusions
Author Contributions
Funding
Institutional Review Board Statement
Informed Consent Statement
Data Availability Statement
Conflicts of Interest
Nomenclature
| Ai | Sample absorbance |
| At | Control absorbance |
| Cpa | Specific heat capacity of air [and 1828.8 J/kg °C] |
| Cpv | Specific heat capacity of vapor [1004.16 J/kg °C] |
| MR | Moisture ratio [-] |
| Mt | Moisture content [g water/g dry matter] |
| Mw | Weight of loss water [kg] |
| Mb | Initial moisture content [g water/g d.m.] |
| Me | Equilibrium moisture content [g water/g dry matter] |
| ha | Absolute air humidity [kgvapor/kgdry air] |
| k | Number of variables and ε is the error |
| P | Microwave power [W] |
| Q | Input air to drying chamber [m3/min] |
| RR | Rehydration ratio [-] |
| SECCon | Specific energy consumption in convective drying [kJ/kg] |
| SECMic | Specific energy consumption in microwave drying [kJ/kg] |
| SECMic-Con | Specific energy consumption of the hybrid MHD [kJ/kg] |
| Tin | Inlet air to drying chamber and respectively [°C] |
| Tout | Ambient air temperatures [°C] |
| t | Drying time (min) |
| V0 | Initial volume [cm3] |
| V | Final volume [cm3] |
| Vh | Specific air volume [m3/kg] |
| Wr | The weight of wet samples [g] |
| Wd | The initial weight of dry samples [g] |
| y | Predicted response |
| L* | Brightness index |
| b* | Yellow–blue index |
| a* | Red–green index |
| Total color difference | |
| β0 | Constant |
| βi | Linear coefficients |
| βjj | Second-order coefficients |
| βij | Denotes the reciprocal coefficient |
References
- Junqueira, J.R.D.J.; Corrêa, J.L.G.; Ernesto, D.B. Microwave, convective, and intermittent microwave–convective drying of pulsed vacuum osmodehydrated pumpkin slices. J. Food Process. Preserv. 2017, 41, e13250. [Google Scholar] [CrossRef]
- Ouyang, M.; Cao, S.; Huang, Y.; Wang, Y. Phenolics and ascorbic acid in pumpkin (Cucurbita maxima) slices: Effects of hot air drying and degradation kinetics. Food Meas. 2021, 15, 247–255. [Google Scholar] [CrossRef]
- Monteiro, R.L.; Link, J.V.; Tribuzi, G.; Carciofi, B.A.M.; Laurindo, J.B. Microwave vacuum drying and multi-flash drying of pumpkin slices. J. Food Eng. 2018, 232, 1–10. [Google Scholar] [CrossRef]
- Sağlam, C.; Çetin, N. Machine learning algorithms to estimate drying characteristics of apples slices dried with different methods. J. Food Process. Preserv. 2022, in press. [Google Scholar] [CrossRef]
- Hii, C.L.; Ong, S.P.; Yap, J.Y.; Putranto, A.; Mangindaan, D. Hybrid drying of food and bioproducts: A review. Dry. Technol. 2021, 39, 1554–1576. [Google Scholar] [CrossRef]
- Huang, J.; Zhang, M. Effect of three drying methods on the drying characteristics and quality of okra. Dry. Technol. 2016, 34, 900–911. [Google Scholar] [CrossRef]
- Shewale, S.R.; Rajoriya, D.; Hebbar, H.U. Low humidity air drying of apple slices: Effect of EMR pretreatment on mass transfer parameters, energy efficiency and quality. Innov. Food Sci. Emerg. Technol. 2019, 55, 1–10. [Google Scholar] [CrossRef]
- Osae, R.; Essilfie, G.; Alolga, R.N.; Bonah, E.; Ma, H.; Zhou, C. Drying of ginger slices—Evaluation of quality attributes, energy consumption, and kinetics study. J. Food Process Eng. 2020, 43, e13348. [Google Scholar] [CrossRef]
- Grekov, D.; Pré, P.; Alappat, B.J. Microwave mode of heating in the preparation of porous carbon materials for adsorption and energy storage applications—An overview. Renew. Sustain. Energy Rev. 2020, 124, 109743. [Google Scholar]
- Kaveh, M.; Abbaspour-Gilandeh, Y.; Nowacka, M. Optimisation of microwave-rotary drying process and quality parameters of terebinth. Biosyst. Eng. 2021, 208, 113–130. [Google Scholar] [CrossRef]
- Kaveh, M.; Golpour, I.; Gonçalves, J.C.; Ghafouri, S.; Guiné, R. Determination of drying kinetics, specific energy consumption, shrinkage, and colour properties of pomegranate arils submitted to microwave and convective drying. Open Agri. 2021, 6, 230–242. [Google Scholar] [CrossRef]
- Li, Y.; Yang, H.; Yang, H.; Wang, J.; Chen, H. Assessment of drying methods on the physiochemical property and antioxidant activity of Cordyceps militaris. Food Meas. 2019, 13, 513–520. [Google Scholar] [CrossRef]
- Sadeghi, E.; Movagharnejad, K.; Haghighi Asl, A. Parameters optimization and quality evaluation of mechanical properties of infrared radiation thin layer drying of pumpkin samples. J. Food Process Eng. 2020, 43, e13309. [Google Scholar] [CrossRef]
- Abbaspour-Gilandeh, Y.; Kaveh, M.; Fatemi, H.; Hernández-Hernández, J.L.; Fuentes-Penna, A.; Hernández-Hernández, M. Evaluation of the changes in thermal, qualitative, and antioxidant properties of terebinth (Pistacia atlantica) fruit under different drying methods. Agronomy 2020, 10, 1378. [Google Scholar] [CrossRef]
- Horuz, E.; Bozkurt, H.; Karataş, H.; Maskan, M. Comparison of quality, bioactive compounds, textural and sensorial properties of hybrid and convection-dried apricots. Food Meas. 2018, 12, 243–256. [Google Scholar] [CrossRef]
- Rashidi, M.; Chayjan, R.A.; Ghasemi, A.; Ershadi, A. Tomato tablet drying enhancement by intervention of infrared-A response surface strategy for experimental design and optimization. Biosyst. Eng. 2021, 208, 199–212. [Google Scholar] [CrossRef]
- Pham, N.D.; Karim, M.A. Investigation of nutritional quality evolution of papaya during intermittent microwave convective drying. Dry. Technol. 2022, 2022, 1–14. [Google Scholar] [CrossRef]
- Chaparro, J.R.; Barón, R.D.; Vargas, M.V.; Arballo, J.R.; Campañone, L.A. Experimental and computational study of fluidized-microwave drying process of shrinking parchment coffee and determination of quality attributes. Int. J. Food Eng. 2022, 18, 383–397. [Google Scholar] [CrossRef]
- Li, X.; Liu, J.; Cai, J.; Xue, L.; Wei, H.; Zhao, M.; Yang, Y. Drying characteristics and processing optimization of combined microwave drying and hot air drying of Termitomyces albuminosus mushroom. J. Food Process. Preserv. 2021, 45, e16022. [Google Scholar] [CrossRef]
- Zahoor, I.; Khan, M.A. Microwave assisted fluidized bed drying of red bell pepper: Drying kinetics and optimization of process conditions using statistical models and response surface methodology. Sci. Hortic. 2021, 286, 110209. [Google Scholar] [CrossRef]
- Nanvakenari, S.; Movagharnejad, K.; Latifi, A. Modelling and experimental analysis of rice drying in new fluidized bed assisted hybrid infrared-microwave dryer. Food Res. Int. 2022, 159, 111617. [Google Scholar] [CrossRef]
- Benseddik, A.; Azzi, A.; Zidoune, M.N.; Khanniche, R.; Besombes, C. Empirical and diffusion models of rehydration process of differently dried pumpkin slices. J. Saudi Soc. Agric. Sci. 2019, 18, 401–410. [Google Scholar] [CrossRef]
- Izli, G.; Yildiz, G.; Berk, D.E. Quality retention in pumpkin powder dried by combined microwave-convective drying. J. Food Sci. Technol. 2022, 59, 1558–1562. [Google Scholar] [CrossRef]
- Kaveh, M.; Abbaspour-Gilandeh, Y. Drying characteristics, specific energy consumption, qualitative properties, total phenol compounds, and antioxidant activity during hybrid hot air-microwave- rotary drum drying of green pea. Iran. J. Chem. Chem. Eng. 2022, 40, 655–672. [Google Scholar]
- Dalvand, M.J.; Mohtasebi, S.S.; Rafiee, S. Modeling of electrohydrodynamic drying process using response surface methodology. Food Sci. Nutr. 2014, 2, 200–209. [Google Scholar] [CrossRef]
- EL-Mesery, H.S.; El-khawaga, S.E. Drying process on biomass: Evaluation of the drying performance and energy analysis of different dryers. Case Stud. Therm. Eng. 2022, 33, 101953. [Google Scholar] [CrossRef]
- Zalazar-Garcia, D.; Roman, M.C.; Fernandez, A.; Asensio, D.; Zhang, X.; Fabani, M.P.; Rodriguez, R.; Mazza, G. Exergy, energy, and sustainability assessments applied to RSM optimization of integrated convective air-drying with pretreatments to improve the nutritional quality of pumpkin seeds. Sustain. Energy Technol. Assess. 2022, 49, 101763. [Google Scholar] [CrossRef]
- Heshmati, M.K.; Khiavi, H.D.; Dehghannya, J.; Baghban, H. 3D simulation of momentum, heat and mass transfer in potato cubes during intermittent microwave-convective hot air drying. Heat Mass Transf. 2022, 2022, 1–16. [Google Scholar] [CrossRef]
- Zhang, Y.; Zielinska, M.; Vidyarthi, S.K.; Zhao, J.-H.; Pei, Y.-P.; Li, G.; Zheng, Z.-A.; Wu, M.; Gao, Z.-J.; Xiao, H.-W. Pulsed pressure pickling enhances acetic acid transfer, thiosulfinates degradation, color and ultrastructure changes of “Laba” garlic. Innov. Food Sci. Emerg. Technol. 2020, 65, 102438. [Google Scholar] [CrossRef]
- Xiao, H.-W.; Law, C.-L.; Sun, D.-W.; Gao, Z.-J. Color change kinetics of American Ginseng (Panax quinquefolium) slices during air impingement drying. Dry. Technol. 2014, 32, 418–427. [Google Scholar] [CrossRef]
- Dehghannya, J.; Kadkhodaei, S.; Heshmati, M.K.; Ghanbarzadeh, B. Ultrasound-assisted intensification of a hybrid intermittent microwave—Hot air drying process of potato: Quality aspects and energy consumption. Ultrasonics 2019, 96, 104–122. [Google Scholar] [CrossRef] [PubMed]
- Majdi, H.; Esfahani, J.A.; Mohebbi, M. Optimization of convective drying by response surface methodology. Comput. Electron. Agric. 2019, 156, 574–584. [Google Scholar] [CrossRef]
- Bhat, T.A.; Hussain, S.Z.; Wani, S.M.; Rather, M.A.; Reshi, M.; Naseer, B.; Qadri, T.; Khalil, A. The impact of different drying methods on antioxidant activity, polyphenols, vitamin C and rehydration characteristics of Kiwifruit. Food Biosci. 2022, 48, 101821. [Google Scholar] [CrossRef]
- Matys, A.; Dadan, M.; Witrowa-Rajchert, D.; Parniakov, O.; Wiktor, A. Response Surface methodology as a tool for optimization of pulsed electric field pretreatment and microwave-convective drying of apple. Appl. Sci. 2022, 12, 3392. [Google Scholar] [CrossRef]
- Li, M.; Wang, B.; Wang, Y.; Liu, J.; Zhang, M. Evaluation of the uniformity, quality and energy cost of four types of vegetables and fruits after pilot-scale pulse-spouted bed microwave (915 MHz) freeze-drying. Dry. Technol. 2022, in press. [Google Scholar] [CrossRef]
- Kesbi, O.M.; Sadeghi, M.; Mireei, S.A. Quality assessment and modeling of microwave convective drying of lemon slices. Eng. Agric. Environ. Food 2016, 9, 216–223. [Google Scholar] [CrossRef]
- Kouhila, M.; Moussaoui, H.; Bahammou, Y.; Tagnamas, Z.; Lamsyehe, H.; Lamharrar, A.; Idlimam, A. Exploring drying kinetics and energy exergy performance of Mytilus chilensis and Dosidicus gigas undergoing microwave treatment. Heat Mass Transf. 2020, 56, 2985–2999. [Google Scholar] [CrossRef]
- Szadzinska, J.; Mierzwa, D. The influence of hybrid drying (microwave-convective) on drying kinetics and quality of white mushrooms. Chem. Eng. Process.-Process Int. 2021, 167, 108532. [Google Scholar] [CrossRef]
- Rashidi, M.; Amiri Chayjan, R.; Ghasemi, A. Optimization of tomato compressed tablet production based on physical, mechanical and thermal properties in a hot air condition with microwave pretreatment. Iran. Food Sci. Technol. Res. J. 2020, 16, 29–42. (In Persian) [Google Scholar]
- Taghinezhad, E.; Kaveh, M.; Jahanbakhshi, A.; Golpour, I. Use of artificial intelligence for the estimation of effective moisture diffusivity, specific energy consumption, color and shrinkage in quince drying. J. Food Process Eng. 2020, 43, e13358. [Google Scholar] [CrossRef]
- Maftoonazad, N.; Dehghani, M.R.; Ramaswamy, H.S. Hybrid microwave-hot air tunnel drying of onion slices: Drying kinetics, energy efficiency, product rehydration, color, and flavor characteristics. Dry. Technol. 2022, 40, 966–986. [Google Scholar] [CrossRef]
- Zia, M.P.; Alibas, I. Influence of the drying methods on color, vitamin C, anthocyanin, phenolic compounds, antioxidant activity, and in vitro bioaccessibility of blueberry fruits. Food Biosci. 2021, 42, 101179. [Google Scholar] [CrossRef]
- Torki-Harchegani, M.; Ghanbarian, D.; Pirbalouti, A.G.; Sadeghi, M. Dehydration behaviour, mathematical modelling, energy efficiency and essential oil yield of peppermint leaves undergoing microwave and hot air treatments. Renew. Sustain. Energy Rev. 2016, 58, 407–418. [Google Scholar] [CrossRef]
- Motevali, A.; Tabatabaee Koloor, R. A comparison between pollutants and greenhouse gas emissions from operation of different dryers based on energy consumption of power plants. J. Clean. Prod. 2017, 154, 445–461. [Google Scholar] [CrossRef]
- Aghilinategh, N.; Rafiee, S.; Hosseinpur, S.; Omid, M.; Mohtasebi, S.S. Optimization of intermittent microwave–convective drying using response surface methodology. Food Sci. Nutr. 2015, 3, 331–341. [Google Scholar] [CrossRef] [PubMed]
- Zhang, P.; Zhou, L.; Bi, J.; Liu, X.; Lyu, J.; Chen, Q.; Wu, X. Drying kinetics and quality attributes of peach cylinders as affected by osmotic pretreatments and infrared radiation drying. Int. J. Food Eng. 2017, 13, 20160023. [Google Scholar] [CrossRef]
- Onwude, D.I.; Hashim, N.; Abdan, K.; Janius, R.; Chen, G. The effectiveness of combined infrared and hot-air drying strategies for sweet potato. J. Food Eng. 2019, 241, 75–87. [Google Scholar] [CrossRef]
- Abbaspour-Gilandeh, Y.; Kaveh, M.; Jahanbakhshi, A. The effect of microwave and convective dryer with ultrasound pre-treatment on drying and quality properties of walnut kernel. J. Food Process. Preserv. 2019, 43, e14178. [Google Scholar] [CrossRef]
- Kumar, D.; Prasad, S.; Murthy, G.S. Optimization of microwave-assisted hot air drying conditions of okra using response surface methodology. J. Food Sci. Technol. 2014, 51, 221–232. [Google Scholar] [CrossRef]
- Karimi, S.; Layeghinia, N.; Abbasi, H. Microwave pretreatment followed by associated microwave-hot air drying of Gundelia tournefortii L.: Drying kinetics, energy consumption and quality characteristics. Heat Mass Transf. 2021, 57, 133–146. [Google Scholar] [CrossRef]
- Liu, J.; Li, X.; Yang, Y.; Wei, H.; Xue, L.; Zhao, M.; Cai, J. Optimization of combined microwave and hot air drying technology for purple cabbage by response surface methodology (RSM). Food Sci. Nutr. 2021, 9, 4568–4577. [Google Scholar] [CrossRef]
- Horuz, E.; Bozkurt, H.; Karataş, H.; Maskan, M. Effects of hybrid (microwave-convectional) and convectional drying on drying kinetics, total phenolics, antioxidant capacity, vitamin C, color and rehydration capacity of sour cherries. Food Chem. 2017, 230, 295–305. [Google Scholar] [CrossRef] [PubMed]
- Zahoor, I.; Khan, M.A. Microwave assisted convective drying of bitter gourd: Drying kinetics and effect on ascorbic acid, total phenolics and antioxidant activity. Food Meas. 2019, 13, 2481–2490. [Google Scholar] [CrossRef]
- Beşir, A.; Gökmen, S.; Gül, L.B.; Yazıcı, F.; Gül, O. Evaluating of microwave drying for hawthorn slice as alternative to convective drying. Braz. Archiv. Biol. Technol. 2022, 65, e22210614. [Google Scholar] [CrossRef]
- Kumar, V.; Shrivastava, S.L. Optimization of vacuum-assisted microwave drying parameters of green bell pepper using response surface methodology. Food Meas. 2017, 11, 1761–1772. [Google Scholar] [CrossRef]
- Izli, N.; Polat, A. Effect of convective and microwave methods on drying characteristics, color, rehydration and microstructure properties of ginger. Food Sci. Technol. 2019, 39, 652–659. [Google Scholar] [CrossRef]
- Wang, H.; Liu, D.; Yu, H.; Wang, D.; Li, J. Optimization of Microwave Coupled Hot Air Drying for Chinese Yam Using Response Surface Methodology. Processes 2019, 7, 745. [Google Scholar] [CrossRef]
- Samoticha, J.; Wojdyło, A.; Lech, K. The influence of different the drying methods on chemical composition and antioxidant activity in chokeberries. LWT 2016, 66, 484–489. [Google Scholar] [CrossRef]
- Hossain, M.; Mitra., S.; Belal, M.; Zzaman, W. Effect of foaming agent concentration and drying temperature on biochemical properties of foam mat dried tomato powder. Food Res. 2021, 5, 291–297. [Google Scholar] [CrossRef]
- Tekgül, Y. Optimization of foaming process: Drying behaviour, physicochemical, and powder properties of hot air-assisted foam-mat dried nectarine. Int. J. Food Eng. 2021, 17, 815–826. [Google Scholar] [CrossRef]


| Independent Variables | Coded Variables | Levels | ||
|---|---|---|---|---|
| −1 | 0 | +1 | ||
| Air temperature (°C) | X1 | 50 | 60 | 70 |
| Microwave power (W) | X2 | 180 | 360 | 540 |
| Exp. Run | Actual Values (Coded Values) | Replication | |
|---|---|---|---|
| Air Temperature (°C) | Microwave Power (W) | ||
| 1 | 60 (0) | 360 (0) | 5 |
| 2 | 50 (−1) | 180 (−1) | 1 |
| 3 | 50 (−1) | 360 (0) | 1 |
| 4 | 50 (−1) | 540 (+1) | 1 |
| 5 | 60 (0) | 180 (−1) | 1 |
| 6 | 60 (0) | 540 (+1) | 1 |
| 7 | 70 (+1) | 180 (−1) | 1 |
| 8 | 70 (+1) | 360 (0) | 1 |
| 9 | 70 (+1) | 540 (+1) | 1 |
| Run | Air Temperature | Microwave Power | Drying Time | SEC | S | Color | RR | TPC | AC | VC |
|---|---|---|---|---|---|---|---|---|---|---|
| C | W | min | MJ/kg | % | - | - | mg GA/100 gdw | % | mg/g DM | |
| 1 | 70 | 180 | 60 | 35.1626 | 43.38 | 19.22 | 3.44 | 511.59 | 72.99 | 1.576 |
| 2 | 60 | 360 | 65 | 37.1955 | 25.99 | 12.55 | 5.21 | 644.57 | 79.91 | 4.592 |
| 3 | 60 | 360 | 75 | 40.0549 | 26.66 | 13.05 | 5.48 | 666.8 | 83.24 | 5.05 |
| 4 | 60 | 360 | 60 | 33.6253 | 25.08 | 12.05 | 4.89 | 654 | 80.95 | 4.254 |
| 5 | 70 | 360 | 40 | 31.6376 | 31.12 | 15.87 | 4.66 | 623.69 | 78.59 | 3.512 |
| 6 | 60 | 360 | 70 | 39.5216 | 26.1 | 13.64 | 5.13 | 642 | 80 | 4.328 |
| 7 | 50 | 540 | 80 | 38.4805 | 47.77 | 22.34 | 3.22 | 559.54 | 66.24 | 2.569 |
| 8 | 60 | 180 | 90 | 47.1273 | 37.35 | 15.44 | 3.89 | 552.27 | 65.59 | 2.154 |
| 9 | 70 | 540 | 25 | 20.0793 | 35.68 | 16.35 | 4.08 | 577.98 | 74.11 | 3.059 |
| 10 | 50 | 360 | 110 | 48.9678 | 40.25 | 17.55 | 3.57 | 527.65 | 68.11 | 1.852 |
| 11 | 60 | 540 | 45 | 29.2443 | 29.17 | 13.68 | 4.28 | 608.87 | 77.11 | 3.658 |
| 12 | 50 | 180 | 160 | 60.2436 | 57.35 | 25.58 | 2.96 | 459.35 | 59.23 | 1.165 |
| 13 | 60 | 360 | 64 | 35.1482 | 25 | 12.17 | 4.96 | 658 | 81.8 | 4.52 |
| Source | Time | SEC | S | Color | RR | TPC | AC | VC |
|---|---|---|---|---|---|---|---|---|
| Model | Linear | Linear | Quadratic | Quadratic | Quadratic | Quadratic | Quadratic | Quadratic |
| Model (p-value) | 0.0001 a | 0.0001 a | 0.0001 a | 0.0001 a | 0.0001 a | 0.0001 a | 0.0001 a | 0.0001 a |
| Lack of Fit (p-value) | 0.88 ns | 0.82 ns | 0.76 ns | 0.78 ns | 0.7 ns | 0.06 ns | 0.05 ns | 0.06 ns |
| R2 | 0.98 | 0.96 | 0.99 | 0.96 | 0.98 | 0.95 | 0.93 | 0.95 |
| Adj. R2 | 0.98 | 0.95 | 0.99 | 0.94 | 0.98 | 0.93 | 0.89 | 0.93 |
| Predicted R2 | 0.97 | 0.93 | 0.99 | 0.91 | 0.96 | 0.82 | 0.73 | 0.83 |
| C.V. | 1.6 | 3.03 | 0.67 | 5.21 | 3.17 | 1.51 | 1.68 | 11.23 |
| Std. Dev. | 0.067 | 0.19 | 0.024 | 7.668 × 10⁻³ | 3.40 × 10⁻³ | 0.37 | 0.14 | 0.12 |
| Response | Intercept | A | B | A2 | B2 |
|---|---|---|---|---|---|
| Ln (Drying time) | 4.189 | −0.525 a | −0.376 a | - | - |
| (SEC) 0.5 | 6.131 | −0.821 a | −0.744 a | - | - |
| Ln (Shrinkage) | 3.248 | −0.138 a | −0.104 a | 0.318 a | 0.248 a |
| 1/(Color) | 0.079 | 0.005 a | 0.003 b | −0.019 a | −0.010 a |
| 1/(Rehydration ratio) | 0.195 | −0.029 a | −0.016 a | 0.051 a | 0.049 a |
| (TPC) 0.5 | 25.495 | 0.595 a | 0.803 a | −1.374 a | −1.258 a |
| (Antioxidant capacity) 0.5 | 8.974 | 0.321 a | 0.198 a | −0.326 a | −0.445 a |
| Ln (VC) | 1.483 | 0.186 a | 0.330 a | −0.474 a | −0.378 a |
| Source | Sum of Squares | df | Mean Square | F Value | p-Value Prob > F | |
|---|---|---|---|---|---|---|
| Model | 2.51 | 2 | 1.26 | 278.52 | <0.0001 | significant |
| A-Air temperature | 1.66 | 1 | 1.66 | 367.99 | <0.0001 | |
| B-Microwave power | 0.85 | 1 | 0.85 | 189.05 | <0.0001 | |
| Residual | 0.045 | 10 | 4.510 × 10⁻³ | |||
| Lack of Fit | 0.015 | 6 | 2.574 × 10⁻³ | 0.35 | 0.8807 | not significant |
| Pure Error | 0.030 | 4 | 7.414 × 10⁻³ | |||
| Cor Total | 2.56 | 12 |
| Source | Sum of Squares | df | Mean Square | F Value | p-Value Prob > F | |
|---|---|---|---|---|---|---|
| Model | 7.37 | 2 | 3.68 | 106.95 | <0.0001 | significant |
| A-Temperature | 4.05 | 1 | 4.05 | 117.47 | <0.0001 | |
| B-Microwave power | 3.32 | 1 | 3.32 | 96.44 | <0.0001 | |
| Residual | 0.34 | 10 | 0.034 | |||
| Lack of Fit | 0.14 | 6 | 0.023 | 0.44 | 0.8209 | not significant |
| Pure Error | 0.21 | 4 | 0.052 | |||
| Cor Total | 7.71 | 12 |
| Source | Sum of Squares | df | Mean Square | F Value | p-Value Prob > F | |
|---|---|---|---|---|---|---|
| Model | 0.90 | 4 | 0.22 | 402.21 | <0.0001 | significant |
| A-Temperature | 0.11 | 1 | 0.11 | 204.45 | <0.0001 | |
| B-Microwave power | 0.065 | 1 | 0.065 | 116.56 | <0.0001 | |
| A2 | 0.28 | 1 | 0.28 | 499.45 | <0.0001 | |
| B2 | 0.17 | 1 | 0.17 | 304.40 | <0.0001 | |
| Residual | 4.474 × 10⁻³ | 8 | 5.592 × 10⁻⁴ | |||
| Lack of Fit | 1.431 × 10⁻³ | 4 | 3.578 × 10⁻⁴ | 0.47 | 0.7585 | not significant |
| Pure Error | 3.043 × 10⁻³ | 4 | 7.607 × 10⁻⁴ | |||
| Cor Total | 0.90 | 12 |
| Source | Sum of Squares | df | Mean Square | F Value | p-Value Prob > F | |
|---|---|---|---|---|---|---|
| Model | 2.341 × 10⁻³ | 4 | 5.853 × 10⁻⁴ | 50.43 | <0.0001 | significant |
| A-Temperature | 2.085 × 10⁻⁴ | 1 | 2.085 × 10⁻⁴ | 17.96 | 0.0028 | |
| B-Microwave power | 8.921 × 10⁻⁵ | 1 | 8.921 × 10⁻⁵ | 7.69 | 0.0242 | |
| A2 | 1.029 × 10⁻³ | 1 | 1.029 × 10⁻³ | 88.67 | <0.0001 | |
| B2 | 2.968 × 10⁻⁴ | 1 | 2.968 × 10⁻⁴ | 25.57 | 0.0010 | |
| Residual | 9.285 × 10⁻⁵ | 8 | 1.161 × 10⁻⁵ | |||
| Lack of Fit | 2.850 × 10⁻⁵ | 4 | 7.124 × 10⁻⁶ | 0.44 | 0.7753 | not significant |
| Pure Error | 6.436 × 10⁻⁵ | 4 | 1.609 × 10⁻⁵ | |||
| Cor Total | 2.434 × 10⁻³ | 12 |
| Source | Sum of Squares | df | Mean Square | F Value | p-Value Prob > F | |
|---|---|---|---|---|---|---|
| Model | 0.030 | 4 | 7.399 × 10⁻³ | 125.84 | <0.0001 | significant |
| A-Temperature | 5.288 × 10⁻³ | 1 | 5.288 × 10⁻³ | 89.93 | <0.0001 | |
| B-Microwave power | 1.546 × 10⁻³ | 1 | 1.546 × 10⁻³ | 26.29 | 0.0009 | |
| A2 | 7.326 × 10⁻³ | 1 | 7.326 × 10⁻³ | 124.59 | <0.0001 | |
| B2 | 6.769 × 10⁻³ | 1 | 6.769 × 10⁻³ | 115.12 | <0.0001 | |
| Residual | 4.704 × 10⁻⁴ | 8 | 5.880 × 10⁻⁵ | |||
| Lack of Fit | 1.704 × 10⁻⁴ | 4 | 4.260 × 10⁻⁵ | 0.57 | 0.7014 | not significant |
| Pure Error | 3.000 × 10⁻⁴ | 4 | 7.500 × 10⁻⁵ | |||
| Cor Total | 0.030 | 12 |
| Source | Sum of Squares | df | Mean Square | F Value | p-Value Prob > F | |
|---|---|---|---|---|---|---|
| Model | 21.48 | 4 | 5.37 | 39.87 | <0.0001 | significant |
| A-Temperature | 2.13 | 1 | 2.13 | 15.82 | 0.0041 | |
| B-Microwave power | 3.87 | 1 | 3.87 | 28.74 | 0.0007 | |
| A2 | 5.22 | 1 | 5.22 | 38.73 | 0.0003 | |
| B2 | 4.38 | 1 | 4.38 | 32.48 | 0.0005 | |
| Residual | 1.08 | 8 | 0.13 | |||
| Lack of Fit | 0.92 | 4 | 0.23 | 5.90 | 0.0569 | not significant |
| Pure Error | 0.16 | 4 | 0.039 | |||
| Cor Total | 22.56 | 12 |
| Source | Sum of Squares | df | Mean Square | F Value | p-Value Prob > F | |
|---|---|---|---|---|---|---|
| Model | 2.20 | 4 | 0.55 | 26.37 | 0.0001 | significant |
| A-Temperature | 0.62 | 1 | 0.62 | 29.75 | 0.0006 | |
| B-Microwave power | 0.24 | 1 | 0.24 | 11.33 | 0.0099 | |
| A2 | 0.29 | 1 | 0.29 | 14.11 | 0.0056 | |
| B2 | 0.55 | 1 | 0.55 | 26.28 | 0.0009 | |
| Residual | 0.17 | 8 | 0.021 | |||
| Lack of Fit | 0.14 | 4 | 0.036 | 6.08 | 0.0543 | not significant |
| Pure Error | 0.024 | 4 | 5.893 × 10⁻³ | |||
| Cor Total | 2.37 | 12 |
| Source | Sum of Squares | df | Mean Square | F Value | p-Value Prob > F | |
|---|---|---|---|---|---|---|
| Model | 2.50 | 4 | 0.62 | 41.67 | <0.0001 | significant |
| A-Temperature | 0.21 | 1 | 0.21 | 13.88 | 0.0058 | |
| B-Microwave power | 0.66 | 1 | 0.66 | 43.79 | 0.0002 | |
| A2 | 0.62 | 1 | 0.62 | 41.52 | 0.0002 | |
| B2 | 0.40 | 1 | 0.40 | 26.43 | 0.0009 | |
| Residual | 0.12 | 8 | 0.015 | |||
| Lack of Fit | 0.10 | 4 | 0.025 | 5.65 | 0.0610 | not significant |
| Pure Error | 0.018 | 4 | 4.501 × 10⁻³ | |||
| Cor Total | 2.62 | 12 |
| Number | Air Temperature | Microwave Power | Drying Time | SEC | Shrinkage | Color | RR | TPC | AC | VC | Desirability |
|---|---|---|---|---|---|---|---|---|---|---|---|
| 1 | 63.668 | 426.941 | 47.389 | 30.879 | 25.449 | 12.743 | 5.210 | 658.241 | 82.112 | 4.789 | 0.901 |
Publisher’s Note: MDPI stays neutral with regard to jurisdictional claims in published maps and institutional affiliations. |
© 2022 by the authors. Licensee MDPI, Basel, Switzerland. This article is an open access article distributed under the terms and conditions of the Creative Commons Attribution (CC BY) license (https://creativecommons.org/licenses/by/4.0/).
Share and Cite
Joudi-Sarighayeh, F.; Abbaspour-Gilandeh, Y.; Kaveh, M.; Hernández-Hernández, J.L. The Optimization of the Physical–Thermal and Bioactive Properties of Pumpkin Slices Dried in a Hybrid Microwave–Convective Dryer Using the Response Surface Method. Agronomy 2022, 12, 2291. https://doi.org/10.3390/agronomy12102291
Joudi-Sarighayeh F, Abbaspour-Gilandeh Y, Kaveh M, Hernández-Hernández JL. The Optimization of the Physical–Thermal and Bioactive Properties of Pumpkin Slices Dried in a Hybrid Microwave–Convective Dryer Using the Response Surface Method. Agronomy. 2022; 12(10):2291. https://doi.org/10.3390/agronomy12102291
Chicago/Turabian StyleJoudi-Sarighayeh, Fatemeh, Yousef Abbaspour-Gilandeh, Mohammad Kaveh, and José Luis Hernández-Hernández. 2022. "The Optimization of the Physical–Thermal and Bioactive Properties of Pumpkin Slices Dried in a Hybrid Microwave–Convective Dryer Using the Response Surface Method" Agronomy 12, no. 10: 2291. https://doi.org/10.3390/agronomy12102291
APA StyleJoudi-Sarighayeh, F., Abbaspour-Gilandeh, Y., Kaveh, M., & Hernández-Hernández, J. L. (2022). The Optimization of the Physical–Thermal and Bioactive Properties of Pumpkin Slices Dried in a Hybrid Microwave–Convective Dryer Using the Response Surface Method. Agronomy, 12(10), 2291. https://doi.org/10.3390/agronomy12102291