Article

Simulation Analysis and Test of Pneumatic Distribution Fertilizer Discharge System

Key Laboratory of Intelligent Agricultural Equipment of Jiangsu Province, College of Engineering, Nanjing Agricultural University, Nanjing 210031, China
*
Author to whom correspondence should be addressed.
Agronomy 2022, 12(10), 2282; https://doi.org/10.3390/agronomy12102282
Submission received: 4 August 2022 / Revised: 13 September 2022 / Accepted: 19 September 2022 / Published: 23 September 2022

Abstract

:
Precision fertilizer application technology is necessary to improve the utilization efficiency of fertilizers in agricultural production. Traditional mechanical fertilization systems risk blockages and uneven application when working in multiple crop rows. Pneumatic fertilization systems have improved efficiency and fertilization quality, however, fewer studies have characterized their designs in regards to the motion of the fertilizer particles. Here, we design and evaluate the parameters of the key components of a pneumatic fertilizer discharge system. Numerical simulations were conducted using a coupled EDEM-FLUENT and gas-phase models together with bench tests to examine the effects of inlet wind speed on the efficiency and consistency of the pneumatic fertilization system. The EDEM-FLUENT simulations showed that the number of fertilizer particles in the grid box set by EDEM was 60 particles in the range from t = 0.275 s to t = 0.5 s, and there was no blockage or cut-off in the pipe. The gas-phase simulation showed that there were tiny vortices in the fertilizer conveying pipe, and the maximum flow rate of its backflow was lower than 3.59 m/s, which had little effect on the fertilizer conveyance. The bench test showed that the inlet wind speed was 35–40 m/s, and the fertilization efficiency was 0.29–0.41 kg/s when the maximum variation coefficient of the row discharge consistency of the pneumatic distribution fertilizer discharge system was 5.55%. The coefficient of variation of the average row discharge consistency was 3.93%, and the average fertilizer discharge met the design requirements. Therefore, the pneumatic distribution system achieves stable operation and meets the requirements of fertilization operations.

1. Introduction

The use of chemical fertilizers is essential for the improvement of food production [1]. China’s use of chemical fertilizer inputs in agriculture continues to rise, with about seven times the amount of fertilizer used in the 1980 [2]. The increasing rate of chemical fertilizer use however is not proportional to the rate of food production; the utilization rate of chemical fertilizer is generally low, causing eutrophication of water resources, adversely affecting the ecological environment, destroying the microbial system, and significantly reducing the quality of soil [3,4,5,6]. Therefore, precision fertilizer application technology to improve the utilization rate of fertilizer has become one of the key issues in the current agricultural development in China [7].
At present, the commonly used machinery for fertilizer application in China is the slotted wheel type fertilizer discharge machine, which is however prone to blockage and poor consistency of each row of fertilizer discharge. Pneumatic distribution type fertilizer spreader can reduce the influence of vibration on the fertilizer discharge device, enhance the quality of fertilizer discharge and realize mechanical precision and balanced fertilizer application [8]. Numerous literature on pneumatic distribution type fertilizer discharge were found. Wang et al. [9] designed and analyzed the key components of the paddy field side-deep fertilizer application device, fertilizer discharger and the pneumatic conveying system. Their study obtained the optimal parameters of the fertilizer discharging speed, the forward speed of the fertilizer applicator, and the fan wind speed. Li et al. [10] conducted a numerical study of the gas-solid two-phase flow coupling model of the gas-fertilizer mixing chamber of the gas-fed rice fertilizer applicator by coupling computational fluid dynamics (CFD)and discrete element method (DEM). They were able to analyze the motion law of gas and fertilizer through the coupling of the two, and to obtain the optimized gas-fertilizer mixing chamber structural parameters and aerodynamic parameters. Yang et al. [11] analyzed the particle motion values of the fertilizer distribution device using the coupled method of EDEM and Fluent, and studied the effects of distributor screw cap cone angle and bellows diameter on the airflow pressure, wind speed and fertilizer particle motion characteristics. Nonetheless, the above studies only optimized a part of the structural parameters of the air-fed fertilizer discharge device, which could not achieve the matching of the whole system and could not guarantee the uniformity of fertilizer application in each row. There were fewer studies on the design of the overall structural parameters, which could not guarantee the stability of the whole system in actual work.
In this paper, the overall structural parameters of the pneumatic distribution fertilizer discharge system’s air delivery device are optimally designed to enable the discharge pipe to meet the consistency requirements for each row of discharge within the standard fertilizer application volume.

2. Materials and Methods

2.1. Structure and Working Principle of the Pneumatic Fertilizer Application System

The pneumatic distribution fertilizer system is made up of: Distributor, Corrugated pipe, Elbow, Fertilizer box, Fertilizer quantifier, Jet feeder and Fan. The bend pipe is connected to the lower end of the bellows, the upper end of the bellows is connected to the distributor shell, the distributor cap is installed at the top of the distributor shell, and the fertilizer discharge pipe is connected to the fertilizer discharge outlet of the distributor shell. The schematic structure of the system is shown in Figure 1.
During operation, the fertilizer is discharged through the fertilizer quantifier and then enters the injector where it is mixed evenly by the high-speed airflow from the fan. The high-speed airflow generates negative pressure, and the fertilizer is sucked into the injector, and then the fertilizer and gas are mixed evenly in the mixing chamber and then transported [12].

2.2. Determination of Basic Parameters and Design of Key Component Parameters

Combined with the technical regulations of oilseed rape production and planting, the actual working conditions of the supporting oilseed rape direct seeding machine and the target parameters of the design to determine the relevant basic design parameters are listed in Table 1 [13].
The maximum delivery volume of the individual distribution system can be derived from the above parameters combined with those of the fertilizer. According to the technical rules, the mass flow rate of the fertilizer in the design calculation should be 1.2 times the total discharge volume of this system.

2.2.1. Fertilizer Particle Suspension Speed

Material suspension speed is one of the main aerodynamic characteristics of the material, according to the material suspension speed to determine the air transport speed of the conveying airflow, is an important reference data for pneumatic sorting, pneumatic conveying and other device design [14].
The equation for the suspension velocity of fertilizer particles is [15]:
v 0 = 4 g 3 d s ( ρ s ρ ) C ρ
where: g is the acceleration of gravity, m/s2; ds is the diameter of fertilizer particles, mm; C is the drag coefficient; ρs is the density of fertilizer, kg/m3; ρ is the density of gas, kg/m3.
Table 2 shows the relevant parameters of urea particles, and it is known that the density of urea is 1337 kg/m3.
The two-phase flow is in the pressure differential resistance zone (Newtonian resistance zone) during the overall conveying process of the system. Its resistance coefficient C = 0.44, air density is taken as 1.205 kg/m3, aerodynamic viscosity μ = 1.82 × 10⁻⁵ Pa·s. It can be calculated that its free suspension speed of urea particles is 7.28~12.86 m/s. In order to ensure the conveying effect, the suspension speed of 12.86 m/s at the maximum particle size of 5 mm is selected.

2.2.2. Air Delivery Speed

The conveying wind speed refers to the air velocity in the pneumatic conveying device. The wind is the conveying power of materials in the conveying pipeline and distribution system. Its conveying speed directly affects the conveying and distribution effect. If the speed is too low to make particles float, particles will deposit in the pipe. Under the premise of ensuring the power and not blocking, the lower conveying speed is selected as far as possible. For general particle clusters: General granular materials in ds > 0.5 mm, m < 15 (m is the mixing ratio) the critical wind speed for the case can be calculated by the following empirical formula:
v m i n = 1.3 v n m 0.25
The critical wind speed for pneumatic conveying of easy-to-acquire urea pellets is vmin = 21.02 m/s. This system uses low pressure delivery therefore a mixing ratio of m = 2.5 [16]. was selected. The system consists of the rising pipe with one bend, which will lead to an increase in pressure loss due to the corrugation, combined with the empirical coefficient of conveying airflow velocity in the literature [17]. The airflow velocity is selected as va = 35 m/s. The conveying air speed is greater than the critical air speed, and the airflow conveying meets the design requirements.

2.2.3. Design of Conveying Pipeline Parameters

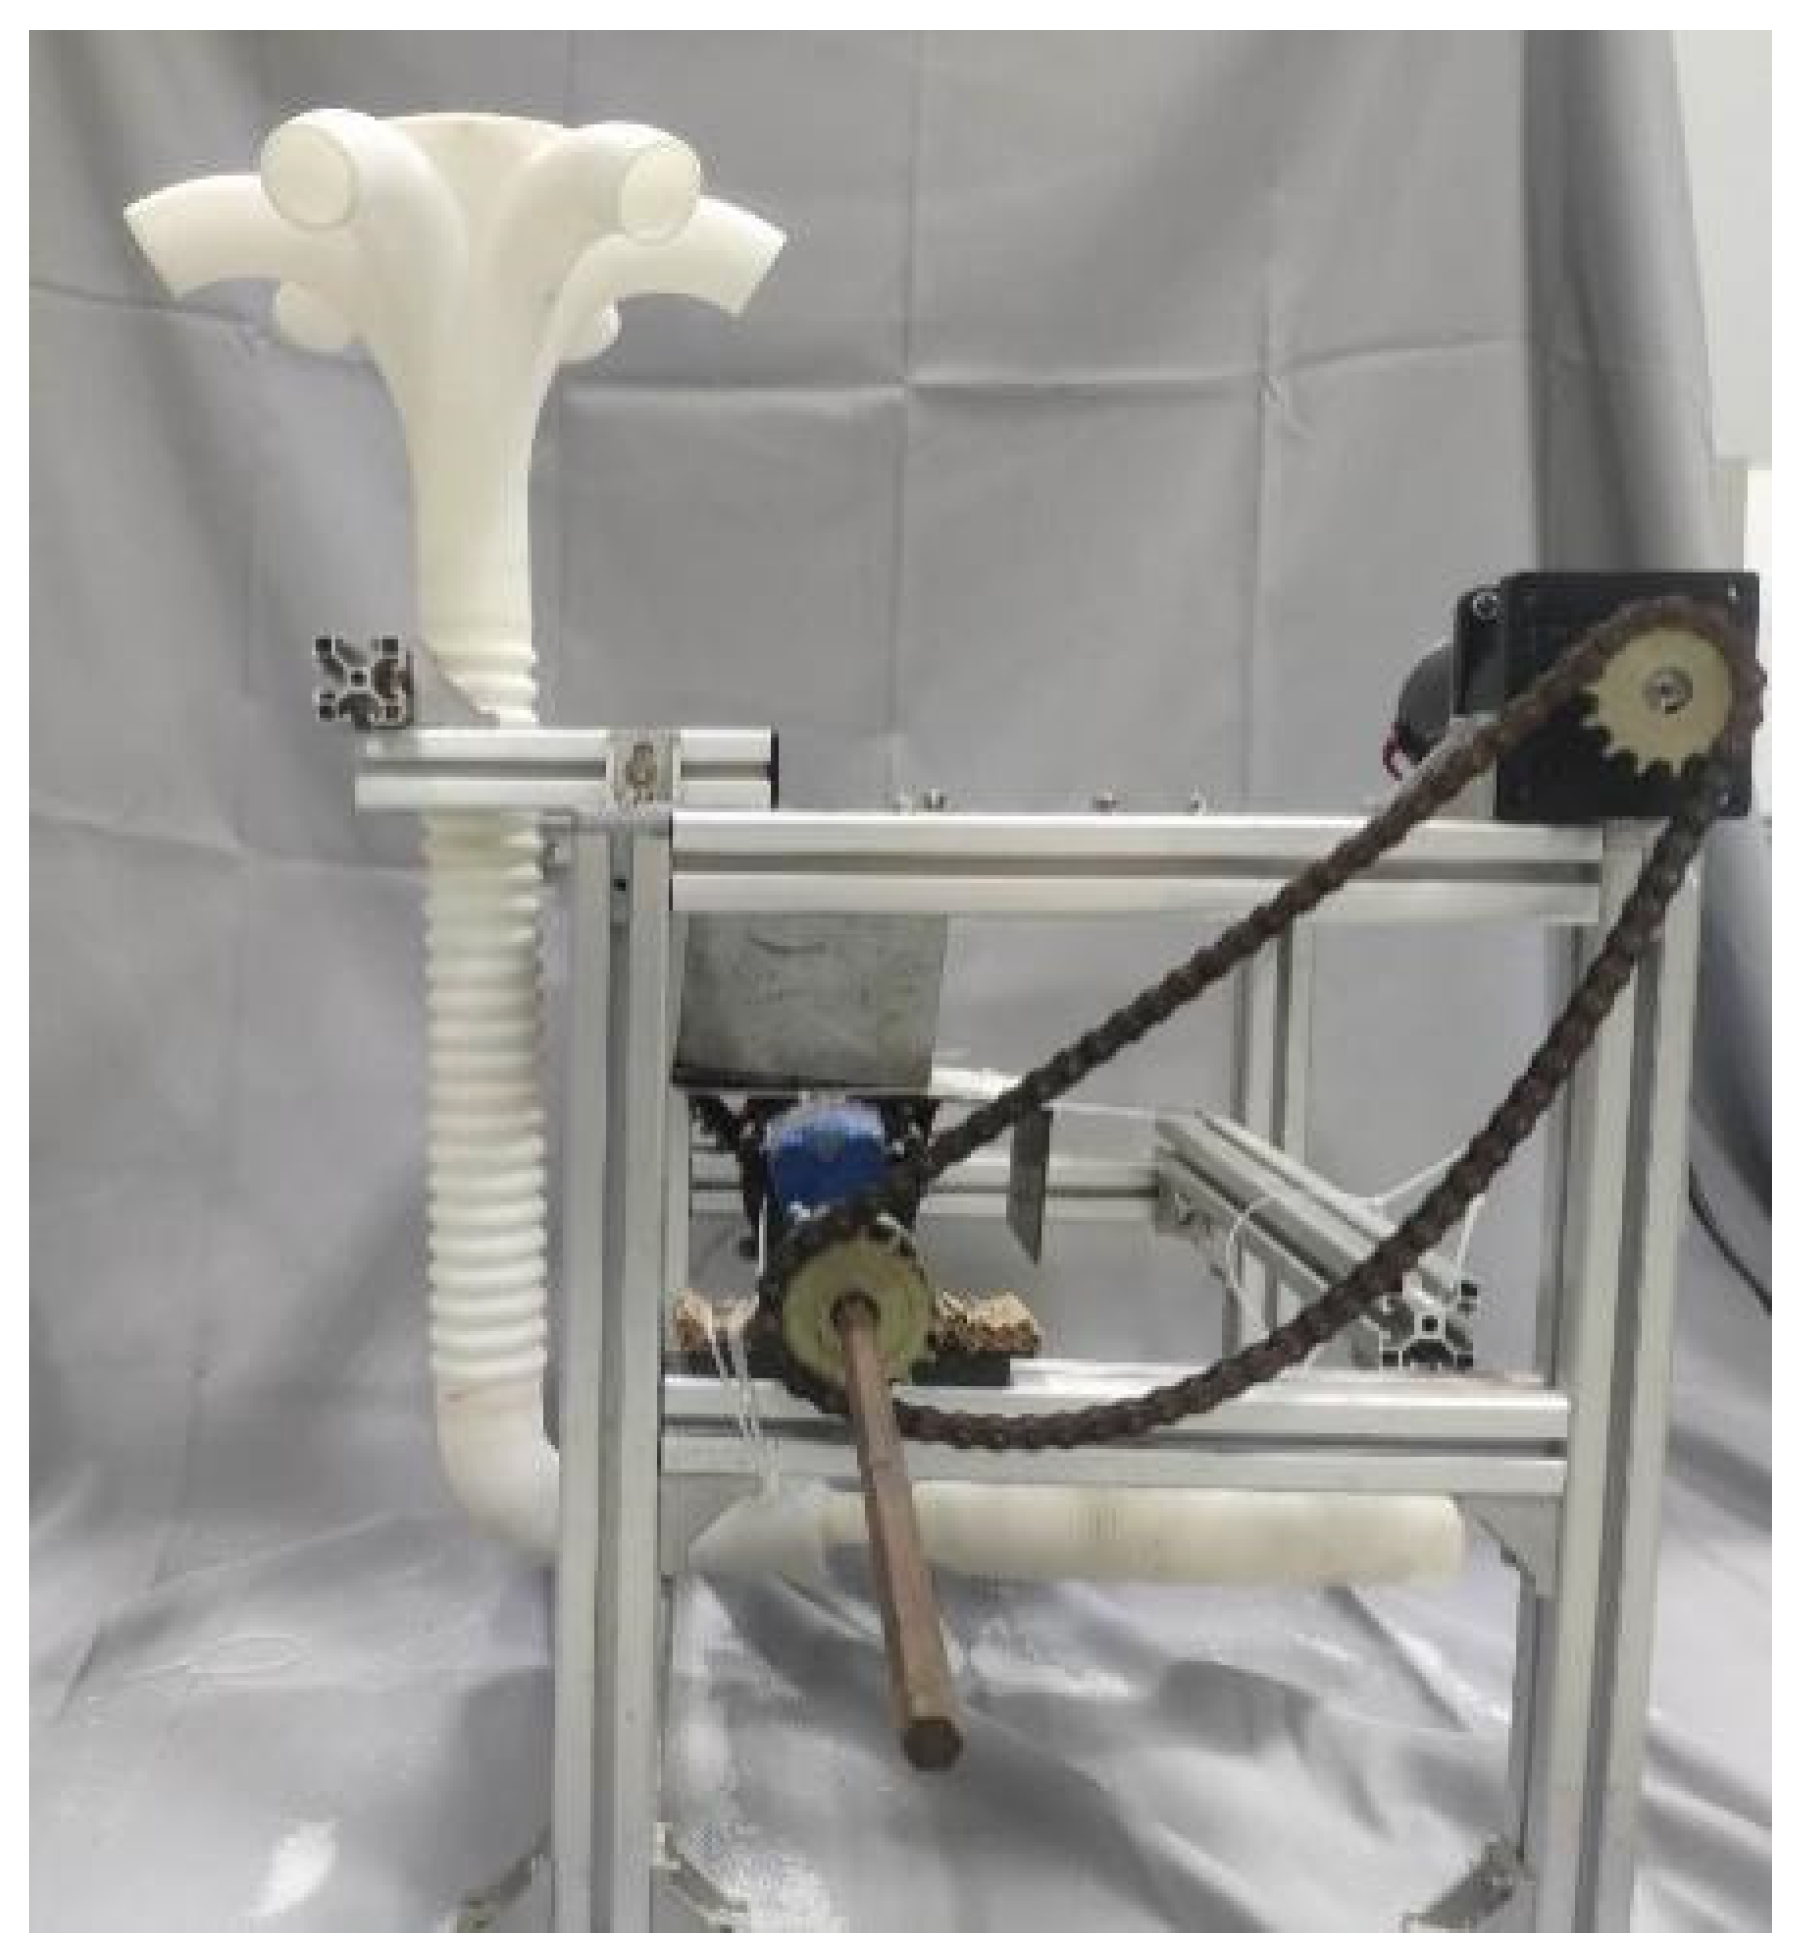
In the study of pneumatic distribution systems it was found that the use of bellows increases the near-wall particle-to-pipe impact and particle-to-particle collisions, allowing for faster uniform distribution inside the pipe. In the study of Jun Du [18], it has been mentioned that the friction coefficient of the increased wall can significantly reduce the particle velocity near the wall, reduce the strength of the particle bundle, and accelerate its dispersion. Therefore, this system uses bellows.
The maximum fertilizer application volume of a single distribution system is 524 kg/hm2, and the forward speed of the machine is 12 km/h. It is easy to obtain the weight WS of material to be conveyed per unit time as 410 g/s.
The amount of air required for conveying can be calculated by Equation (3).
Q a = W a ρ a = W s m ρ a
where, Wa, mass of air required for conveying per unit time, g/s; Ws, mass of material required for conveying per unit time, g/s; m, mixing ratio; ρa, air density, kg/m3; consider the air loss to increase 10~20% margin.
The diameter of the conveying pipe can be calculated by Equation (4).
D = 4 Q a π v a
After reserving the corresponding allowance, determine the diameter of the conveying pipe D = 50 mm.

2.2.4. Bending Parameters Design

In order to change the material conveying direction, the design of bend pipe is usually adopted. The bend tube is designed with bending angle θ = 90°. The diameter of the bend is equal to the diameter of the transport pipe D bend = 50 mm, when the cross-section is round, the local resistance coefficient of the bend resistance is shown in Table 3.
According to Du Jun [18], the longer the two-phase flow acts in the bend, the more compact and difficult to disperse the particle bundle formed, that is, the larger the bend-diameter ratio, the less easy to disperse the outwardly biased particle bundle formed. In other words, the larger the bend diameter ratio is, the less easy to disperse the outwardly biased particles. The bend diameter ratio of the bend tube is chosen to be R/D = 1.0.

2.2.5. Dispenser Parameter Design

The shape of the distributor should be designed to minimize the vortex, turbulence and sharp contraction of gas-solid mixed flow, and comparing the domestic and foreign research results [19,
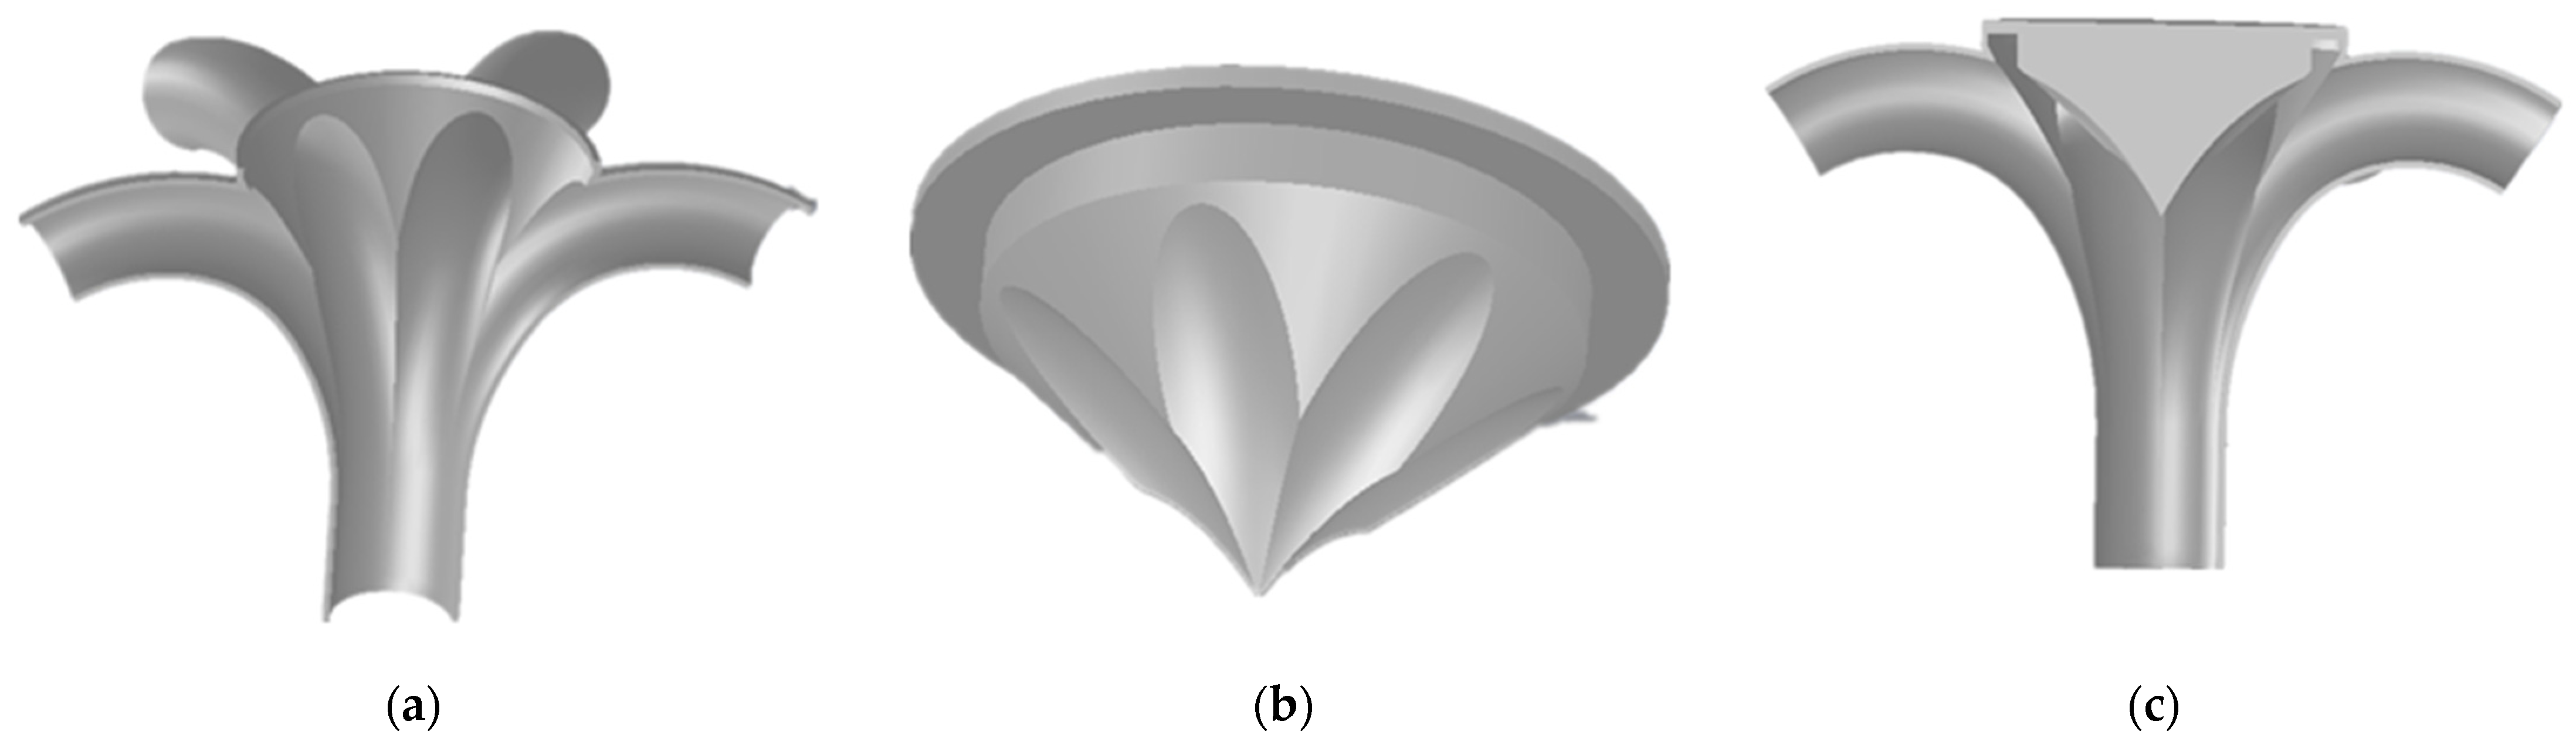
20]. It was found that the streamline distributor designed by V. J. F. Kumar had better distribution effect. Referring to the streamline distributor designed by V. J. F. Kumar, the pipe grooves are added on the basis of streamline distribution, as shown in Figure 2a, so that the particles are “divided” and “gathered” when they hit the upper end cap of the distributor, and the uniform gas-solid. At the same time, the fertilizer particles are influenced by the pipeline gullies to gather in the center of each seed delivery pipe, and the state of scattering around becomes a stable two-phase flow of gas and seed in six channels. Each distribution pipe adopts the design of tapering pipe, which can effectively reduce the vortex caused by pipe resizing and reduce the stagnant fertilizer phenomenon.
Local resistance coefficient of flared pipe ζ :
ζ = λ 8 sin ( 90 θ ) [ 1 ( D 3 D 1 ) 2 ] + K ( 1 D 3 D 1 )
where, denotes the along-travel loss factor, denotes the micropiezometer factor ( N / m 2 ).
The structure of the inner chamber of the distributor is designed to reduce the local drag coefficient, as shown in Figure 2c. Outer diameter D1 = 150 mm, Fertilizer drainage pipe diameter D2 = 40 mm, Diameter of fertilizer guide tube D3 = 50 mm, Wall thickness 3 mm, The radius of the sidewall circle is R = 150 mm.

2.2.6. Jet Feeder Parameters Design

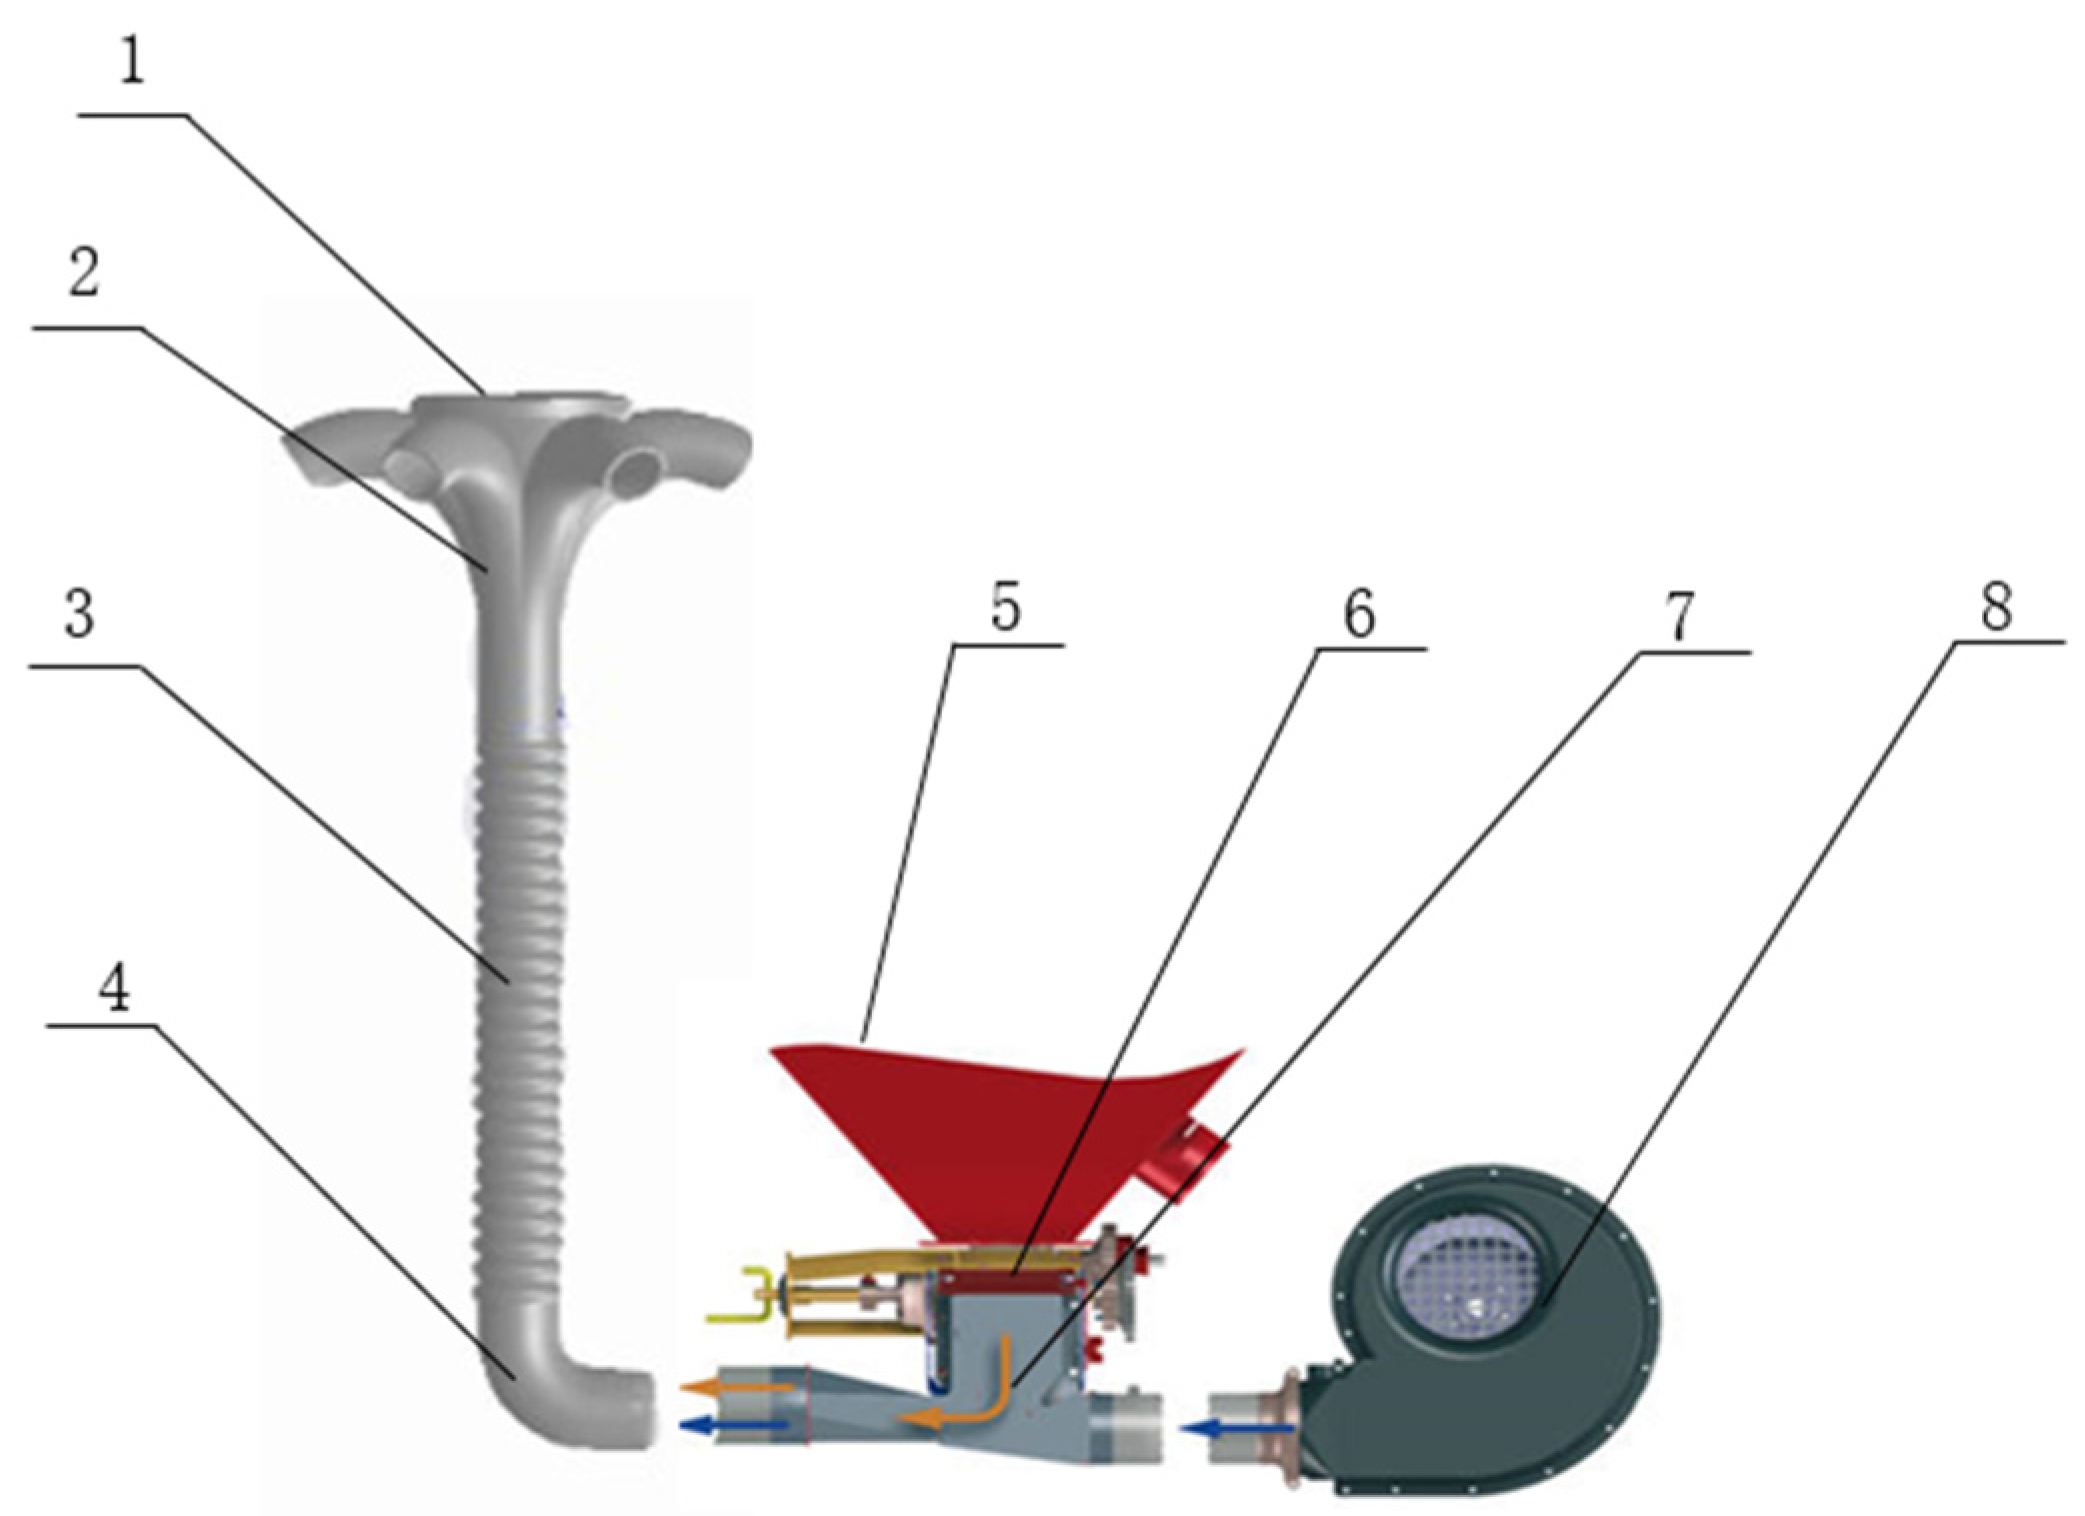
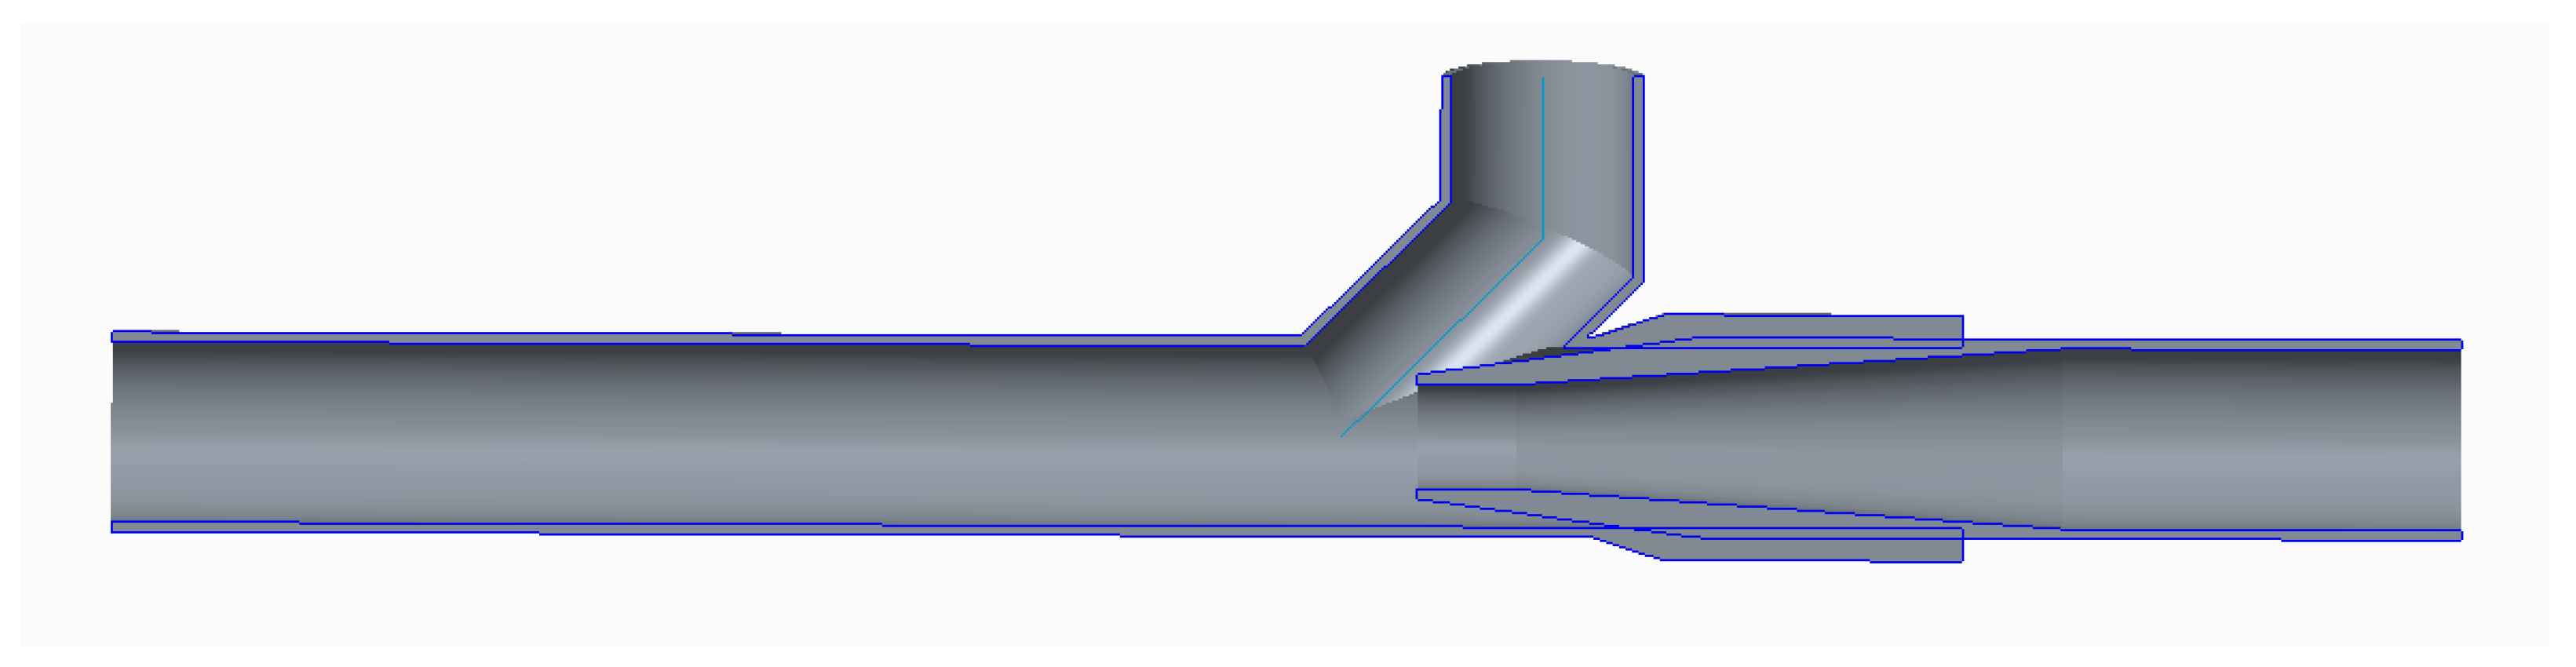
The feeder is a kind of equipment that makes the material and air mix and enter the conveying tube, and is the “throat” of the pneumatic conveying device. The design of the feeder requires that the material and air can be fully mixed in it, so that the air can enter smoothly and the material entering the air flow is in the same direction as the air flow, which can be divided into negative pressure feeder for suction type pneumatic conveying and positive pressure feeder for pressure feeding type. Due to the characteristics of pneumatic distribution type seed discharge system—pressure feeding type material supply distribution, so choose the jet feeder (venturi feeder), which belongs to one of the positive pressure feeders, the structure is shown in Figure 3.
The principle is that when the airflow enters the jet feeder by the nozzle, due to the role of throttling, is a certain degree of vacuum formed within the mixing type, the material will be sucked into the mixing chamber, gas-solid two-phase flow to form the initial mixing into the delivery tube for transport. As shown in the figure, the high pressure gas is ejected from the nozzle, and the resulting jet takes away the surrounding air, so that a negative pressure is formed in the external area of the nozzle. The fertilizer particles at the inlet will be sucked into the pipe and mixed with the high speed air flow.
(1)
Pressure loss estimation
When the air through the nozzle outlet at the section I-I air flow for Q (m3/h), through the section II-II air flow for Q + q, q (m3/h) for the induction of wind through the injection feeder under the mouth, the full pressure at both ends of each pI, pII, listed energy balance formula for
p I = Q + q Q η p II
The full pressure difference between the two cross sections is the pressure loss of the jet feeder, i.e.,
Δ p = p I p II = ( 1 + Z η 1 ) p II
where: Z, air volume ratio, Z = q Q = 0.1 ~ 0.15 ;   η, injection efficiency,   η = 0.6 ~ 0.7 ; pII, section II-II at the full pressure, that is, the sum of pipeline pressure loss and distribution pressure loss.
The calculated pII is 3857.609   N / m 2 , Δ p Feeder is   3214.674   N / m 2 , p I is 7072.283   N / m 2 .
(2)
Nozzle outlet air flow rate is:
v o = 2 g p I γ a
where, γa, the air weight at section I-I, γa ≈ 11.76 N/m3. The air flow velocity at the nozzle v0 is 108.624   m / s .
(3)
Obviously the nozzle position of the highest air velocity, the airflow velocity of this position to calculate the Mach number Ma—characterizing the degree of fluid compressibility of an important dimensionless parameter.
Ma = v 0 / c
where, c, the speed of sound at that point, is taken as 340 m/s, and Ma = 0.3195 .
It is a subsonic incompressible flow, so the airflow is calculated as an incompressible flow in the injector calculation.
(4)
Since the air volume at the inlet and outlet of the nozzle is constant, the following equation can be derived.
v a π D 2 4 = v 0 π d 2 4
This gives the nozzle outlet diameter: d = 0.03122 m, take the nozzle outlet diameter of 0.032 m. Then the nozzle cross-sectional size of 0.0008 m2.
(5)
The use of rectangular section, and so that the cross-sectional area of A = bh 1 , and b = ( 0.8 ~ 0.9 ) D , where D is the diameter of the delivery tube, the nozzle height is
h 1 = A / b
The calculated h1 is 0.0181 m.
(6)
Mixing chamber length is
L = ( 0.5 ~ 0.6 ) b
(7)
The calculated L is 0.0396 m.
The mixing chamber section size is ( b × h 2 ) , then the height of the mixing chamber is
h 2 = Q + q 3600 v 2 b
And v 1 v 2 , by calculation, the air through the nozzle outlet at the section I-I when the air flow for Q for 312.83712 m3/h, through the section II-II when the air flow Q + q for 344.121 m3/h, so the mixing chamber height h2 for 0.0497 m.
(8)
Nozzle shrinkage section length is
L 1 = ( a h 1 ) cot β
Let the side length of a square tube comparable to the cross section of the delivery tube be a, then
a = π D 4 4 ( 0.785 ) 1 2 D
where, β—contraction angle, β = 26 ° ~ 30 ° .
Take the contraction angle β for 30°, ozzle contraction section length L1 for 0.25 m.
(9)
Nozzle diffusion section length is
L 2 = ( a h 2 ) cot α
where, α—Systolic angle, α = 6 ° ~ 8 ° .
Take the contraction angle α is 8°, the nozzle diffusion section length of 0.04 m.

2.3. Fertilizer Drainage System Performance Test

The test materials are shown in the Table 4. Test bench are shown in the Figure 4.
According to NY/T 1003-2006 “Technical specification for quality evaluation of fertilizer application machinery”, the coefficient of variation of the consistency of fertilizer discharge volume in each row of the distribution system was determined. The number of test rows is not less than 6 rows, and the standard deviation S and the coefficient of variation V are calculated for the consistency of fertilizer discharge between rows.
X ¯ = X n
S = ( X X ¯ ) 2 n 1
V = S X ¯ × 100 %
where, X is the amount of fertilizer discharged each time, gram; n is the number of measurements.

Consistency Test of Fertilizer Row by Row

The purpose of this test is to study the fertilizer discharge performance of this pneumatic distribution system under different conveying quality and different inlet air speed conditions, with the consistency of discharge in each row as the main evaluation index. In order to realize the wind speed adjustment, the fan was connected to an external frequency converter, and after adjusting the fan speed by the frequency converter, the inlet wind speed was measured by an anemometer, and the test was conducted after setting the inlet wind speed. The test steps are as follows: the wind speed at the inlet of the feeder was adjusted to 20 m/s, 25 m/s, 30 m/s, 35 m/s, 40 m/s, (corresponding to the operating speed of 12 km/h and the sowing volume of 374.8 kg, 450 kg and 524.7 kg per hm2), and the fertilizer application rate was set to 0.29 kg/s, 0.35 kg/s and 0.41 kg/s (maximum urea flow rate) for the test. Inlet wind speed and fertilization rate parameters are shown in the Table 5.

2.4. Simulation Test Analysis

Calculation Conditions and Parameter Settings

EDEM and Fluent were coupled to study the effect of fertilizer transport in the conveying tube. The collision contact model between particles and particles and between particles and walls was set to Hertz Mindlin (No Slip) collision contact model in EDEM; the particle size was set to normal (normal distribution), and the particle generation position was randomly distributed; the particle plant was set to dynamically generate particles, and the simulation test was conducted with the maximum seed mass flow rate, i.e., the hm2 applied urea amount of 524.7 kg and the forward speed is 12 km/h. The specific settings are shown in Table 6. This paper adopts k ε , realizable model in Fluent. According to the general field environment during fertilizer application operations, velocity—inlet velocity inlet conditions are used with an inlet wind speed of 35 m/s and a direction perpendicular to the inlet plane, and the turbulence intensity as well as the hydraulic diameter is selected for setting, and the turbulence intensity of the fluid is calculated by the following equation.
I = 0.16 Re ( 1 8 )
where Re is the Reynolds number.
Therefore, the turbulence intensity is set as 3.72% and the hydraulic diameter is 0.050 m; each fertilizer discharge outlet is set as zero pressure outlet boundary condition; the wall surface adopts static boundary condition; the simulation calculation adopts SIMPLEC algorithm; the time step of Fluent is set as 100 times of EDEM time step.

3. Results and Discussion

3.1. Analysis of Particle Phase Motion State Based on EDEM—Fluent Coupling

Whether the fertilizer in the conveying pipe is clogged and stable has a great influence on the performance of fertilizer discharge. The movement of urea particles in the conveying pipe was analyzed, mainly to analyze whether there was blockage in the conveying pipe when the maximum urea flow rate was output; and whether the subsequent urea flow rate in the conveying pipe was stable when the uniform discharging was ensured. The urea flow rate was set as the maximum urea flow rate, the inlet wind speed was 35 m/s; the outlet was set as the zero pressure outlet boundary, and the rest of the basic parameters were consistent with the previous calibration parameters.
For the analysis of the presence of blockage, a grid box is set up to show the number of urea particles in that box at each moment, starting at the moment t = 0 s and counting at 0.02 s intervals.
The particle movement inside the tube is observed by EDEM-Display window, and it is found that there is no particle accumulation, and there is no broken flow phenomenon in the process of fan operation; Figure 5 shows the time—particle number line graph inside the box obtained from the simulation after modeling the theoretically calculated conveying tube parameters, and it can be seen from the graph that with the passage of time, the change of particle number inside the box gradually tends to be stable, from t = 0.275 s to t = 0.5 s. 0.275 s to t = 0.5 s time period, the extreme difference of the fluctuation of the number of particles in the box is 60 particles. From the EDEM—Fluent coupled simulation validation test of the particle bellows (Figure 5), it can be seen that. When the urea particles pass through the bend, the velocity direction of the particles changes from the negative direction of the y-axis to the positive direction of the x-axis, the combined velocity experiences a rapid decrease and then an increase, where there is a certain aggregation effect on the urea particles, and the effect brought about by the bend can offset these fluctuations to a certain extent in the case of small fluctuations in the injector ejected fertilizer flow. In summary, the effect brought about by this degree is negligible. As can be seen from the velocity flow vector diagram inside the injector (Figure 6), no vortex is generated at the downstream port and around the nozzle. The overall operation of the system is stable, with no breakage of flow, and the overall conveying situation is uniform and stable. The simulation initially determined that the injector and conveying pipeline meet the design requirements.
According to the virtual experimental results: the airflow will produce a large difference in airflow velocity when passing through the elbow, that is to say, the velocity distribution of the airflow inside the overall circular tube is not uniform in the case of a short stroke, and the velocity of the airflow will gradually tend to be uniform as the distance of the airflow in the vertical tube increases, which is similar to the findings of Du Jun, Levy and Mason and Yilmaz [18,21,22].

3.2. Analysis of Gas Phase Motion State in Distributor Cavity Based on Fluent Simulation

Since the vortex inside the distributor has a great influence on the fertilizer distribution effect, a simulation study was conducted for the distributor, and the main purpose of the simulation was to find the vortex inside the distributor and to analyze its influence.
From Figure 7a, it can be seen that the velocity difference between the upper part and the lower part of the fertilizer delivery pipe is large, with the velocity of the upper part being 9.7 m/s~29.1 m/s and the velocity of the lower part being 0 m/s~6.46 m/s, which is initially judged to be a large velocity difference and prone to the phenomenon of vortex. From Figure 7b as well as Figure 8a, in the internal position of the fertilizer delivery pipe, a small vortex was generated, and the maximum flow velocity of its return was lower than 3.59 m/s. According to the theory related to particle starting, urea particles in the vortex position equivalent to through the bend tube transport, the particle phase will occur to the outside of the bend offset, and the vortex has a certain distance; Secondly, urea particles due to their own inertia, with the vortex back to the direction of speed, to make the relative motion of the particles in such a short stroke to complete the reverse movement, need a huge reverse acceleration, need a huge kinetic energy. It is clear that here that the vortex does not have such a huge kinetic energy; at the same time, from Figure 9, the place is already located inside the fertilizer tube, and the fine vortex will not lead to blockage even if it affects the direction of movement of the particles inside the tube. Therefore, the inner cavity of the dispenser meets the design requirements.

3.3. Results of the Bench Test

The results of the bench test are shown in Table 7.
As can be seen from Table 7, under the conditions of different fertilizer application rates when the inlet wind speed is ≥25 m/s, the highest coefficient of variation of the consistency of the discharge volume of each row of this pneumatic distribution type fertilizer discharge system is 5.55%, which meets the national standard. However, from the viewpoint of the average fertilizer application volume in each row, when the inlet wind speed is 25 m/s, the average fertilizer delivery volume is too low compared with the feeder drop fertilizer volume, which does not meet the requirements. When the inlet wind speed is 30~40 m/s, the fertilizer conveying situation is better. In summary, the highest coefficient of variation of consistency of fertilizer discharge in each line is 5.55% when the inlet wind speed is 30~40 m/s, and the average coefficient of variation of consistency of fertilizer discharge in each line is 3.93%, and the average amount of fertilizer discharge meets the design requirements.

Significance Analysis of the Effect of Inlet Wind Speed on the Quality of Fertilizer Discharge

Through the experimental results in Table 8, it is found that the wind speed is a very important influencing factor on the effect of pneumatic distribution. At present, a large number of studies have been conducted on the gas-solid two-phase flow of pneumatic conveying as a homogeneous flow, without using the means of DEM discrete element analysis. One of the main design bases of the pneumatic distribution fertilizer discharge system designed in this paper is based on the discrete particle model. The results of the previous design and simulation analysis are further validated by the significance analysis of the effect of wind speed on the fertilizer discharge volume.
The effects of different wind speeds on fertilizer discharge at fertilizer application rates of 0.29 kg/s, 0.35 kg/s and 0.41 kg/s were investigated by SPSS. 22.0 (Chicago, IL, USA).
The results of the analysis are shown in Table 8, Table 9 and Table 10 below.
At the same application rate, when the inlet wind speed was low, 20 m/s and 25 m/s respectively, the variability between the fertilizer discharge volume was significant, indicating that the fertilizer discharge volume was influenced by the inlet wind speed, while when the inlet wind speed was high, 30 m/s, 35 and 40 m/s respectively, the variability between the fertilizer discharge volume was not significant, indicating that: when the wind speed was greater than or equal to 30 m/s, the size of the fertilizer discharge volume was less influenced by the inlet wind speed, and the main determining factor was the application rate, therefore, to ensure that the fertilizer discharge volume was controllable, the fertilizer discharge volume was selected under the wind speed ≥30 m/s as far as possible.
Combined with the above test results, it shows that the best working conditions for this pneumatic distribution and fertilizer discharge system are when the inlet wind speed is 30~40 m/s and the fertilizer efficiency is 0.29~0.41 kg/s.

4. Conclusions

This paper combines the concepts of pneumatic conveying and pneumatic conveying to design a pneumatic distribution type fertilizer discharge system. The main working process is numerically simulated by EDEM-FLUENT coupling and gas phase simulation method to analyze the stability and vortex during the working process of the fertilizer discharge system. At the same time, a bench was built for bench testing, and the results were combined with EDEM-FLUENT simulation analysis to show that the average variation coefficient of consistency of each row of the pneumatic distribution type fertilizer discharge system is 3.93% at the inlet wind speed of 30~40 m/s and fertilizer application efficiency of 0.29~0.41 kg/s, which excellent in meeting the standard requirements of fertilization operations.

Author Contributions

Conceptualization, B.C. and R.H.; methodology, B.C.; software, B.C.; validation, B.C., Y.X. and X.Z.; formal analysis, Y.X.; investigation, X.Z.; resources, X.Z.; data curation, B.C.; writing—original draft preparation, B.C.; writing—review and editing, B.C.; visualization, B.C.; supervision, R.H.; project administration, R.H.; funding acquisition, R.H. All authors have read and agreed to the published version of the manuscript.

Funding

The paper is funded by the Jiangsu Provincial Department of Finance, Jiangsu Provincial Agricultural Science and Technology Independent Innovation Fund Project, Project No. CX(19)2012.

Institutional Review Board Statement

Not applicable.

Informed Consent Statement

Not applicable.

Data Availability Statement

The data presented in this study are available on request from the authors. Informed consent was obtained from all subjects involved in the study.

Acknowledgments

The authors thank the editor and anonymous reviewers for providing helpfulsuggestions for improving the quality of this manuscript. All individuals included in this sectionhave consented to the acknowledgement.

Conflicts of Interest

The authors declare no conflict of interest.

References

  1. Zheng, W. Study on Regional Differences of Chemical Fertilizer Application and Its Impact on Grain Production in China. Master’s Thesis, China Agricultural University, Beijing, China, 2005. (In Chinese with English abstract). [Google Scholar]
  2. Zhang, W.L.; Wu, S.X.; Ji, H.J.; Kolbe, H. Situation estimation and Control Countermeasures of agricultural non-point source pollution in China I. situation estimation of agricultural non-point source pollution in China in the early 21st century. China Agric. Sci. 2004, 7, 1008–1017, (In Chinese with English abstract). [Google Scholar]
  3. Guo, G.G.; Cao, L.; Yang, L.P. Chemical fertilizer pollution of farmland soil and its control countermeasures. Mod. Agric. Sci. Technol. 2019, 23, 155–156. (In Chinese) [Google Scholar]
  4. Wu, F.P. Negative impact of long-term excessive application of chemical fertilizer on agricultural ecological environment and countermeasures. China Agric. Inf. 2016, 10, 67–68. (In Chinese) [Google Scholar]
  5. Zuo, X.J. Design and Experimental Study on Air Driven Rice Lateral Deep Precision Fertilization Device; Northwest University of Agriculture and Forestry Science and Technology: Xianyang, China, 2016; (In Chinese with English abstract). [Google Scholar]
  6. Zhou, S.; Sugawara, S.; Riya, S.; Sagehashi, M.; Toyota, K.; Terada, A.; Hosomi, M. Effect of infiltration rate on nitrogen dynamics in paddy soil after high-load nitrogen application containing N-15 tracer. Ecol. Eng. 2011, 37, 685–692. [Google Scholar] [CrossRef]
  7. Fu, H.R.; Li, T.Y.; Cao, H.B.; Zhang, W.F. Study on the driving factors of fertilizer reduction and efficiency increase in China. J. Plant Nutr. Fertil. 2020, 26, 561–580, (In Chinese with English abstract). [Google Scholar]
  8. Zeng, J.Y. Design and Experimental Study on Pneumatic Fertilizer Deep Applicator for Paddy Field; Shenyang Agricultural University: Shenyang, China, 2019. [Google Scholar]
  9. Wang, J.F.; Gao, G.B.; Weng, W.X.; Wang, J.W.; Yan, D.W.; Chen, B.W. Design and test of key components of paddy field side deep fertilization device. J. Agric. Mach. 2018, 49, 92–104, (In Chinese with English abstract). [Google Scholar]
  10. Li, L.W.; Meng, Z.J.; Wang, X.O.; An, X.F.; Wand, P.; Wu, G.W. Simulation analysis of gas-solid two-phase flow in fertilizer conveying device of air driven rice fertilizer applicator. J. Agric. Mach. 2018, 49, 171–180, (In Chinese with English abstract). [Google Scholar]
  11. Yang, Q.L.; Li, Z.H.; Li, H.W.; He, J.; Wang, Q.J.; Lu, C.Y. Numerical analysis of particle motion of centralized fertilizer separation device based on cfd-dem. J. Agric. Mach. 2019, 50, 81–89, (In Chinese with English abstract). [Google Scholar]
  12. Zou, Y. Design and Test of Air Distribution Seed Metering System; Nanjing Agricultural University: Nanjing, China, 2017; (In Chinese with English abstract). [Google Scholar]
  13. Liao, Y.T.; Gao, L.P.; Liao, Q.X.; Li, Y.B.; Fan, W.; Chen, H. Design and test of deep fertilization device for rape precision combined direct seeding machine. J. Agric. Mach. 2020, 51, 65–75, (In Chinese with English abstract). [Google Scholar]
  14. Wen, X.Y.; Jia, H.L.; Zhang, S.W.; Yuan, H.F.; Wang, G.; Chen, T.Y. Measurement test of granular fertilizer suspension velocity based on EDEM-Fluent coupling. Chin. J. Agric. Mach. 2020, 51, 69–77, (In Chinese with English abstract). [Google Scholar]
  15. Yang, L.; Xie, Y.H. Pneumatic Conveying Engineering; China Machine Press: Beijing, China, 2006. (In Chinese) [Google Scholar]
  16. Hu, B.L. Analysis on key points of manufacturing technology of ventilation pipe elbow in ginning plant. China Cotton Processing 2018, 3, 4–6. (In Chinese) [Google Scholar]
  17. Cheng, Z.Q. Design of air supply system. Food Sci. 1984, 4, 50–58. (In Chinese) [Google Scholar]
  18. Du, J. Numerical Simulation of Dilute Phase Pneumatic Conveying Based on CFD-DEM Method. Ph.D. Thesis, Wuhan University, Wuhan, China, 2015. (In Chinese with English abstract). [Google Scholar]
  19. Chang, J.L.; Zhang, X.H. Design and test of 2bq-10 air flow first-order collecting and discharging seed metering system. J. Agric. Eng. 2011, 27, 136–141. (In Chinese) [Google Scholar]
  20. Kumar VJ, F.; Durairaj, C.D. Influence of Head Geometry on the Distributive Performance of Air-assisted Seed Drills. J. Agric. Eng. Res. 2000, 75, 81–95. [Google Scholar] [CrossRef]
  21. Levy, A.; Mason, D.J. The effect of a bend on the particle cross-section concentration and segregation in pneumatic conveying systems. Powder Technol. 1998, 98, 95–103. [Google Scholar] [CrossRef]
  22. Yilmaz, A.; Levy, E.K. Formation and dispersion of ropes in pneumatic conveying. Powder Technol. 2001, 114, 168–185. [Google Scholar] [CrossRef]
Figure 1. Schematic diagram of pneumatic distribution fertilizer discharge system. 1. Distributor screw cap; 2. Dispenser housing; 3. Corrugated pipe; 4. Elbow; 5. Fertilizer box; 6. Fertilizer quantifier; 7. Jet feeder; 8. Fan.
Agronomy 12 02282 g001
Figure 2. Internal structure diagram of distributor. (a) Distributor main model; (b) Distributor upper end cover model; (c) Streamlined shell cavity.
Agronomy 12 02282 g002
Figure 3. Structure diagram of jet feeder.
Agronomy 12 02282 g003
Figure 4. Physical drawing of test bench.
Agronomy 12 02282 g004
Figure 5. Time—Particle Number Diagram.
Agronomy 12 02282 g005
Figure 6. Particle velocity profile.
Agronomy 12 02282 g006
Figure 7. Gas flow rate vector diagram. (a) Gas velocity vector diagram; (b) Local velocity flow vector diagram of injector nozzle position.
Agronomy 12 02282 g007
Figure 8. Distributor air flow analysis diagram. (a) Airflow velocity and flow field distribution; (b) Airflow velocity vector.
Agronomy 12 02282 g008
Figure 9. Air flow analysis diagram in conveying pipe (a) Local air velocity vector of fertilizer conveying pipe; (b) Distribution of local airflow field in fertilizer conveying pipe.
Agronomy 12 02282 g009
Table 1. Basic design parameters of machine.
ParametersResults
Amount of fertilizer applied (kg/hm2)300~524
Operating speed (km/h)6~12
Spacing of fertilizer application rows (mm)300
Number of rows of fertilizer application6
Fertilization depth (mm)80~100
Number of dispensers1
Seed and fertilizer distance (mm)75
Maximum conveying capacity of the distribution system (g/s)410
Table 2. Urea particle related parameters.
ParametersResults
Poisson’s ratio0.25~0.51
Modulus of elasticity (Pa)8.2 × 10⁷~8.9 × 10⁷
Shear modulus (Pa)2.3 × 10⁷~3.56 × 10⁷
Density (kg·m−3)1337
Spherical rate (%)85~96
Grain size/mm1.60~5.00
Table 3. Local drag coefficient of smoothing round bend.
R/D124610
θ = 90°Smooth0.220.140.110.080.11
Rough0.520.280.230.180.20
Table 4. Experiment material.
Equipment NameModelPrecisionRemarks
Wind speed and air volume meterGM89030.001 m/sChina Shenzhen Jumoyuan Technology Co.
Electronic Balance20,0020.01 gChina Hangzhou Youheng Weighing Equipment Co.
Vernier calipers91,5110.03 mmShida Tools Co.
Centrifugal fansHG-2200 Zhejiang Yashiba Motor Co.
Frequency converterSKIV600A2D2G-20.01 HzHangzhou Sanke Inverter Technology Co.
Fertilizer Discharge Performance Test BenchHomemade
Pneumatic distribution system key componentsHomemade
Table 5. Inlet wind speed and fertilization rate parameters.
Test NumberInlet Air Speed/(m/s)Fertilizer Application Rate/(kg/s)
1, 2, 3200.29, 0.35, 0.41
4, 5, 6250.29, 0.35, 0.41
7, 8, 9300.29, 0.35, 0.41
10, 11, 12350.29, 0.35, 0.41
13, 14, 15400.29, 0.35, 0.41
1, 2, 3200.29, 0.35, 0.41
Table 6. EDEM parameter setting.
ParametersNumerical Value
Urea pelletsPoisson’s ratio0.51
Density (kg/m3)1337
Shear modulus (Pa)3.56 × 10⁷
Maximum mass flow rate (g/s)552
Equipment materials (engineering plastics)Poisson’s ratio0.5
Density (kg/m3)900
Shear modulusPa1 × 108
Urea-ureaCrash recovery factor0.28
Static friction coefficient0.36
Rolling friction coefficient0.15
Between urea and equipmentCrash recovery factor0.36
Static friction coefficient0.41
Rolling friction coefficient0.04
Gas phaseSpeed at the entrance (m/s)35
The hydraulic diameter of the round pipe is equal to the diameter of the round pipe.
Table 7. Experment results.
Inlet Wind Speed/(m/s)Fertilizer Application Rate/(kg/s)Average Fertilizer Application Rate/(g)Standard Deviation/(g)Coefficient of Variation of Consistency Scross Rows/%
200.29206.727.843.79
0.35253.2215.406.08
0.41277.4721.017.57
250.29225.0711.975.32
0.35280.229.913.54
0.41312.079.493.04
300.29238.627.813.27
0.35304.6716.925.55
0.41335.4311.323.38
350.29240.548.533.54
0.35301.4812.994.31
0.41340.2112.313.62
400.29240.668.513.53
0.35290.2612.174.19
0.41340.9513.664.01
Table 8. Analysis of the variation number when the amount of fertilizer discharged is 0.29 kg/s.
Sum of SquaresdfMean SquareFSignificance
Between groups(Merged)5189.68241297.42015.7880.000
Linear termComparison4168.16714168.16750.7210.000
Deviation1021.5153340.5054.1440.016
In the group2054.4462582.178
Total7244.12829
Table 9. Analysis of the variation number when the amount of fertilizer discharged is 0.35 kg/s.
Sum of SquaresdfMean SquareFSignificance
Between groups(Merged)10,288.07842572.02013.7010.000
Linear termComparison5455.16415455.16429.0600.000
Deviation4832.91431610.9718.5820.000
In the group4693.02025187.721
Total14,981.09829
Table 10. Analysis of the variation number when the amount of fertilizer discharged is 0.41 kg/s.
Sum of SquaresdfMean SquareFSignificance
Between groups(Merged)17,698.16444424.54122.1710.000
Linear termComparison14,433.916114,433.91672.3260.000
Deviation3264.24831088.0835.4520.005
In the group4989.20125199.568
Total22,687.36529
Publisher’s Note: MDPI stays neutral with regard to jurisdictional claims in published maps and institutional affiliations.

