Relating Profile Wall Root-Length Density Estimates to Monolith Root-Length Density Measurements of Cover Crops

 ,
,  and
and 
Abstract
1. Introduction
2. Materials and Methods
2.1. Experimental Design and Location
2.2. Profile Wall Method
2.3. Monolith Method
2.4. Statistical Analysis
- (1)
- Simple linear regression (LR)
- (2)
- Multiple linear regression (MLR)
3. Results
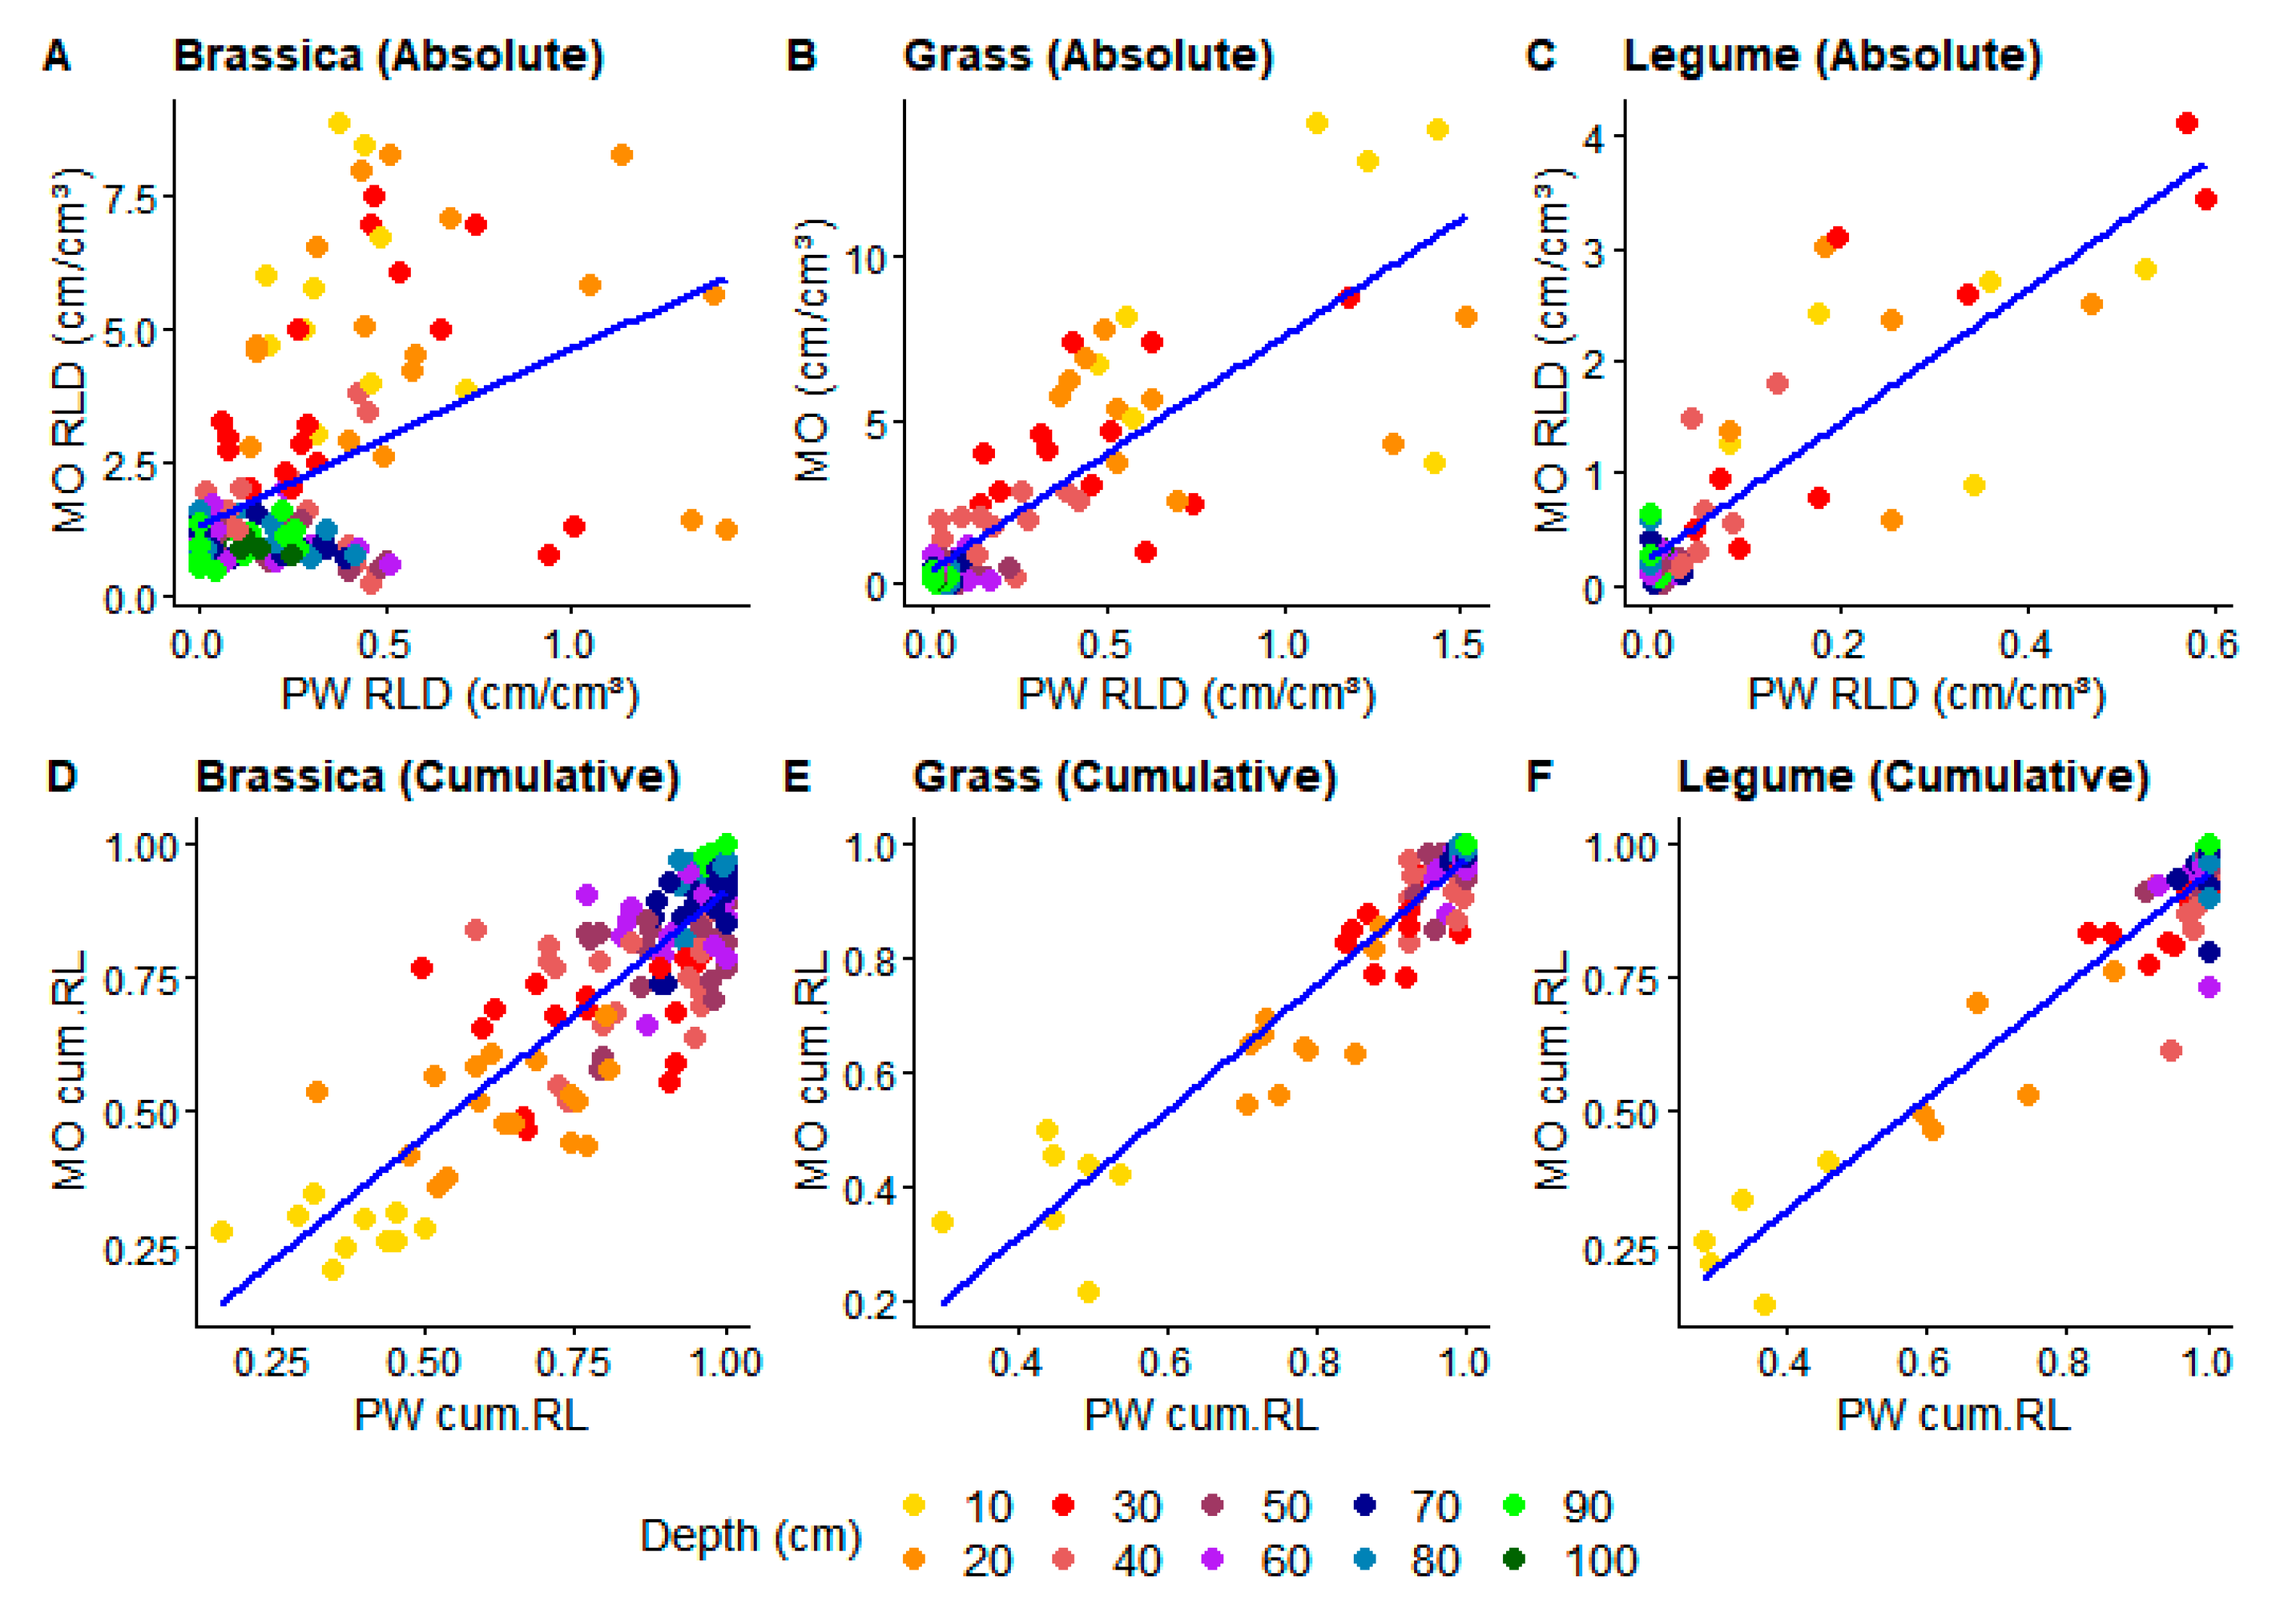
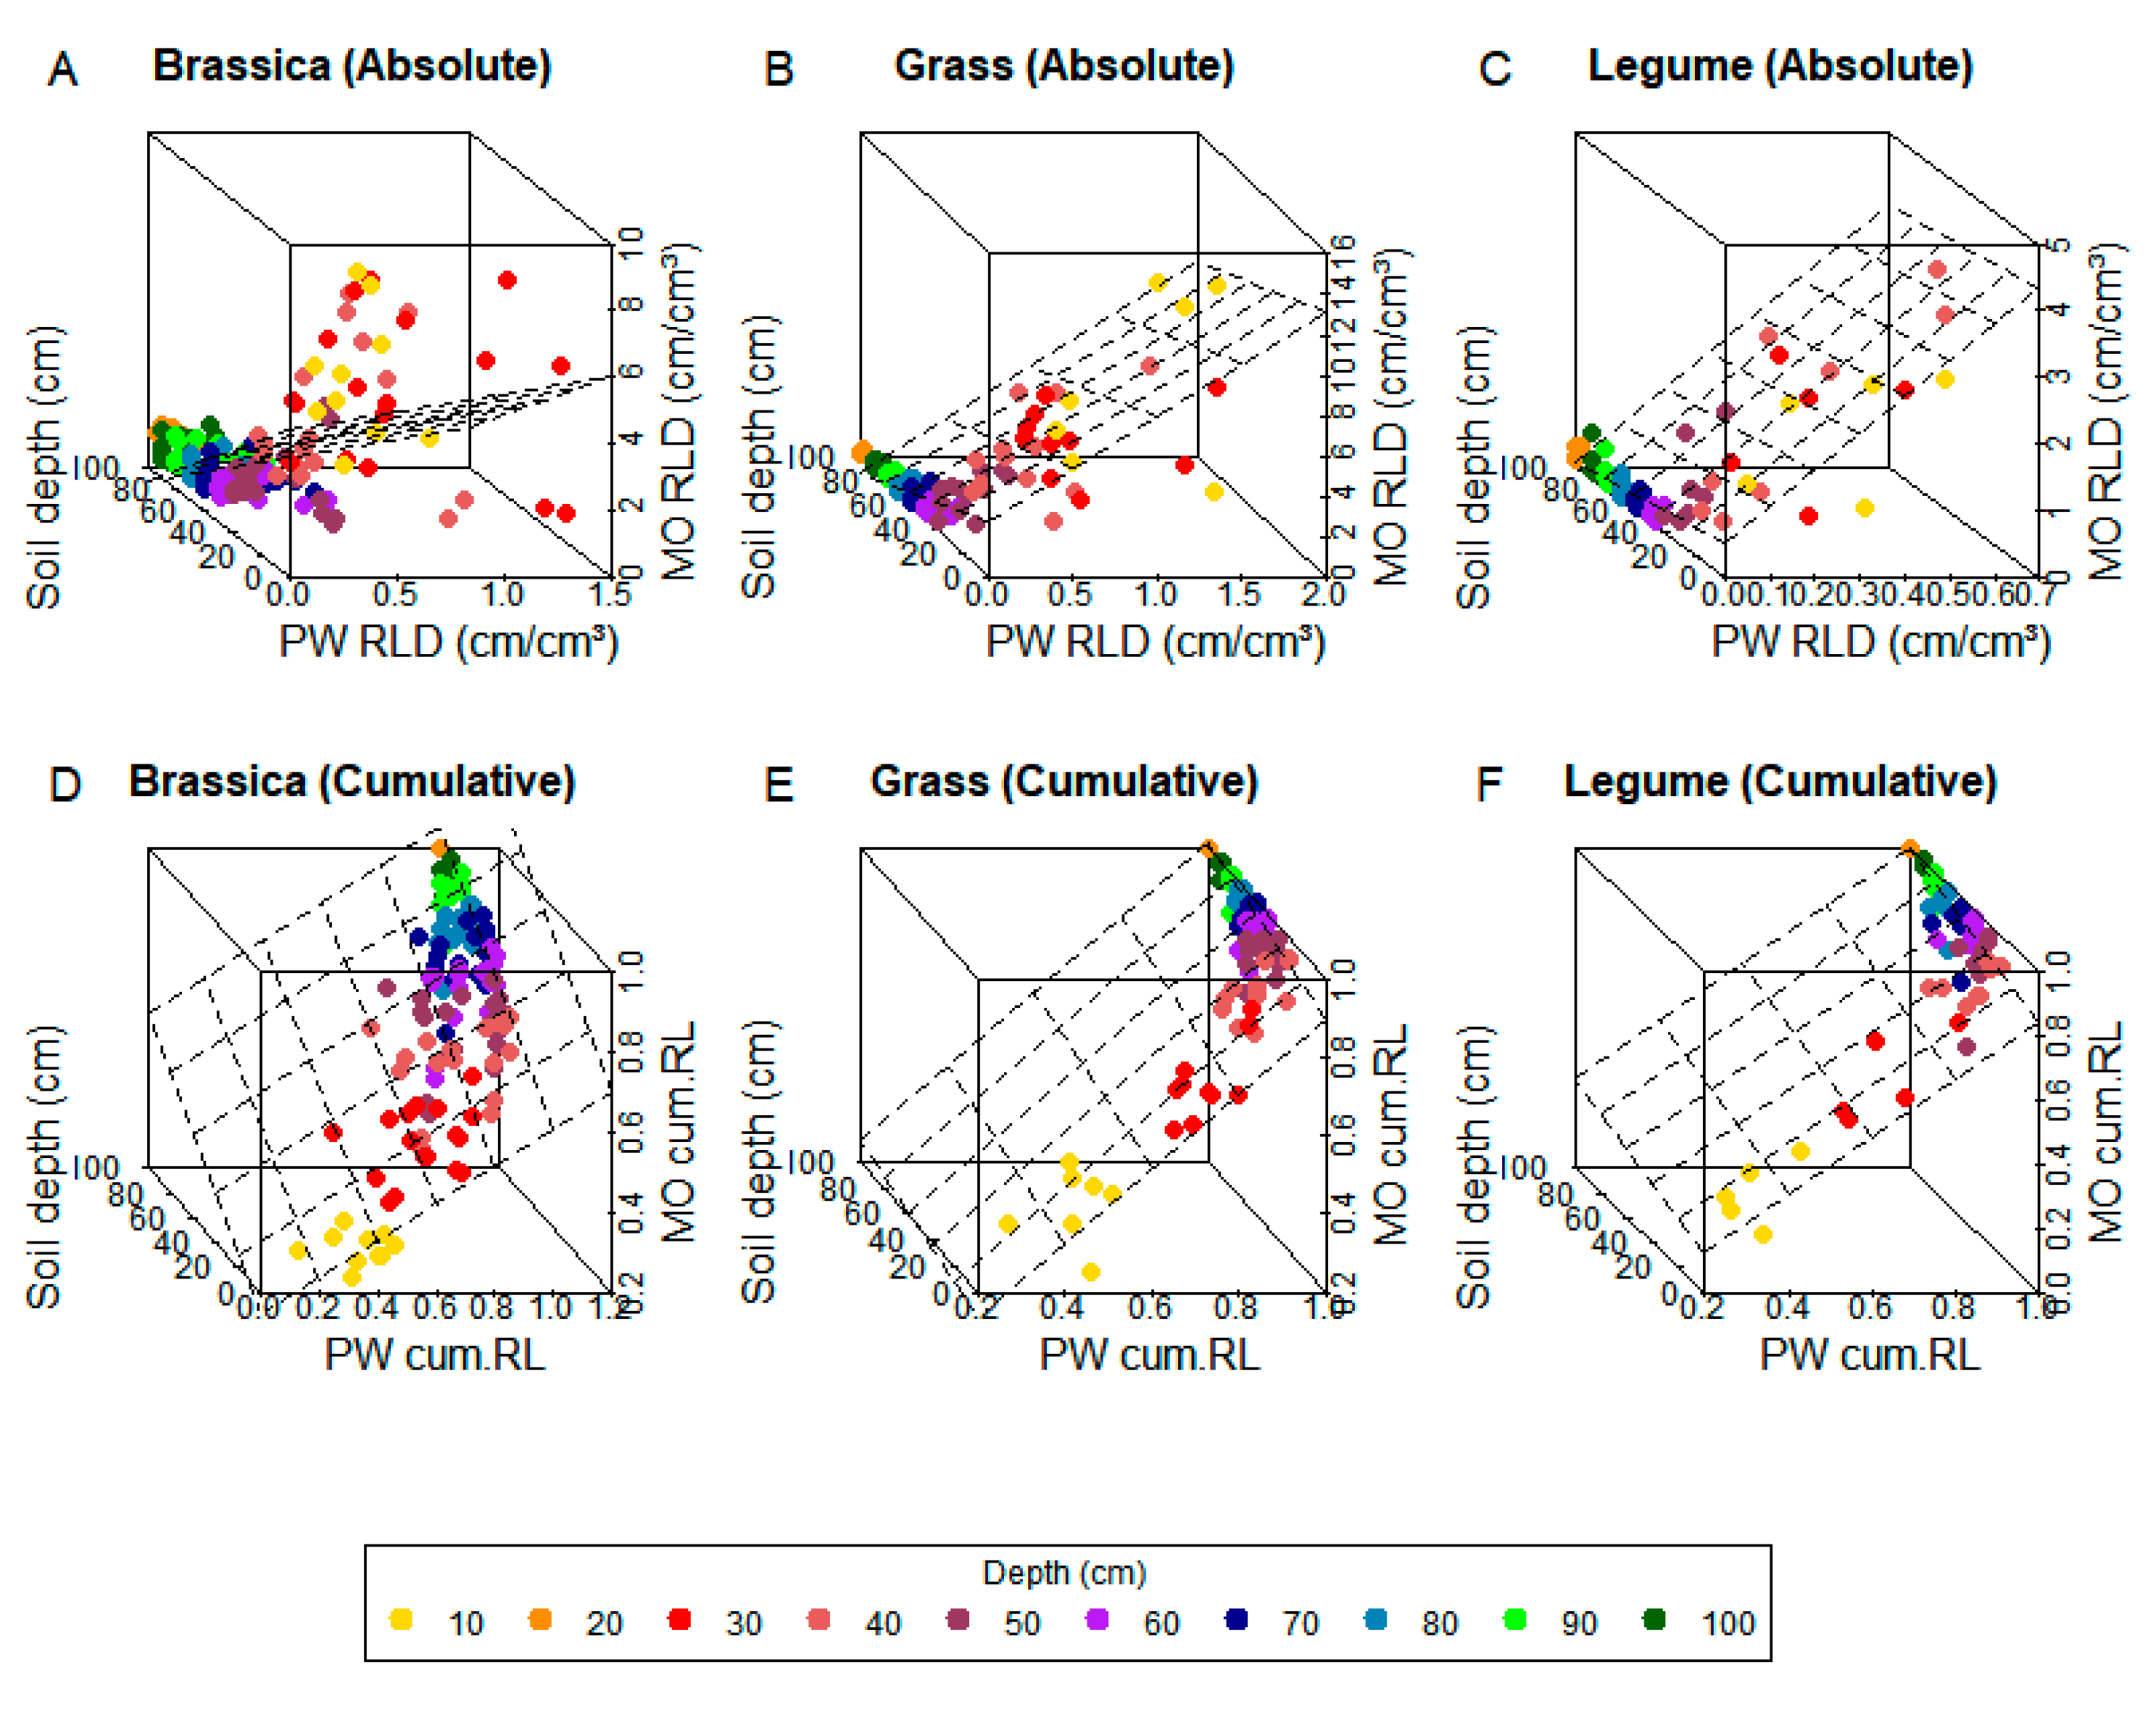
3.1. Model Fitting
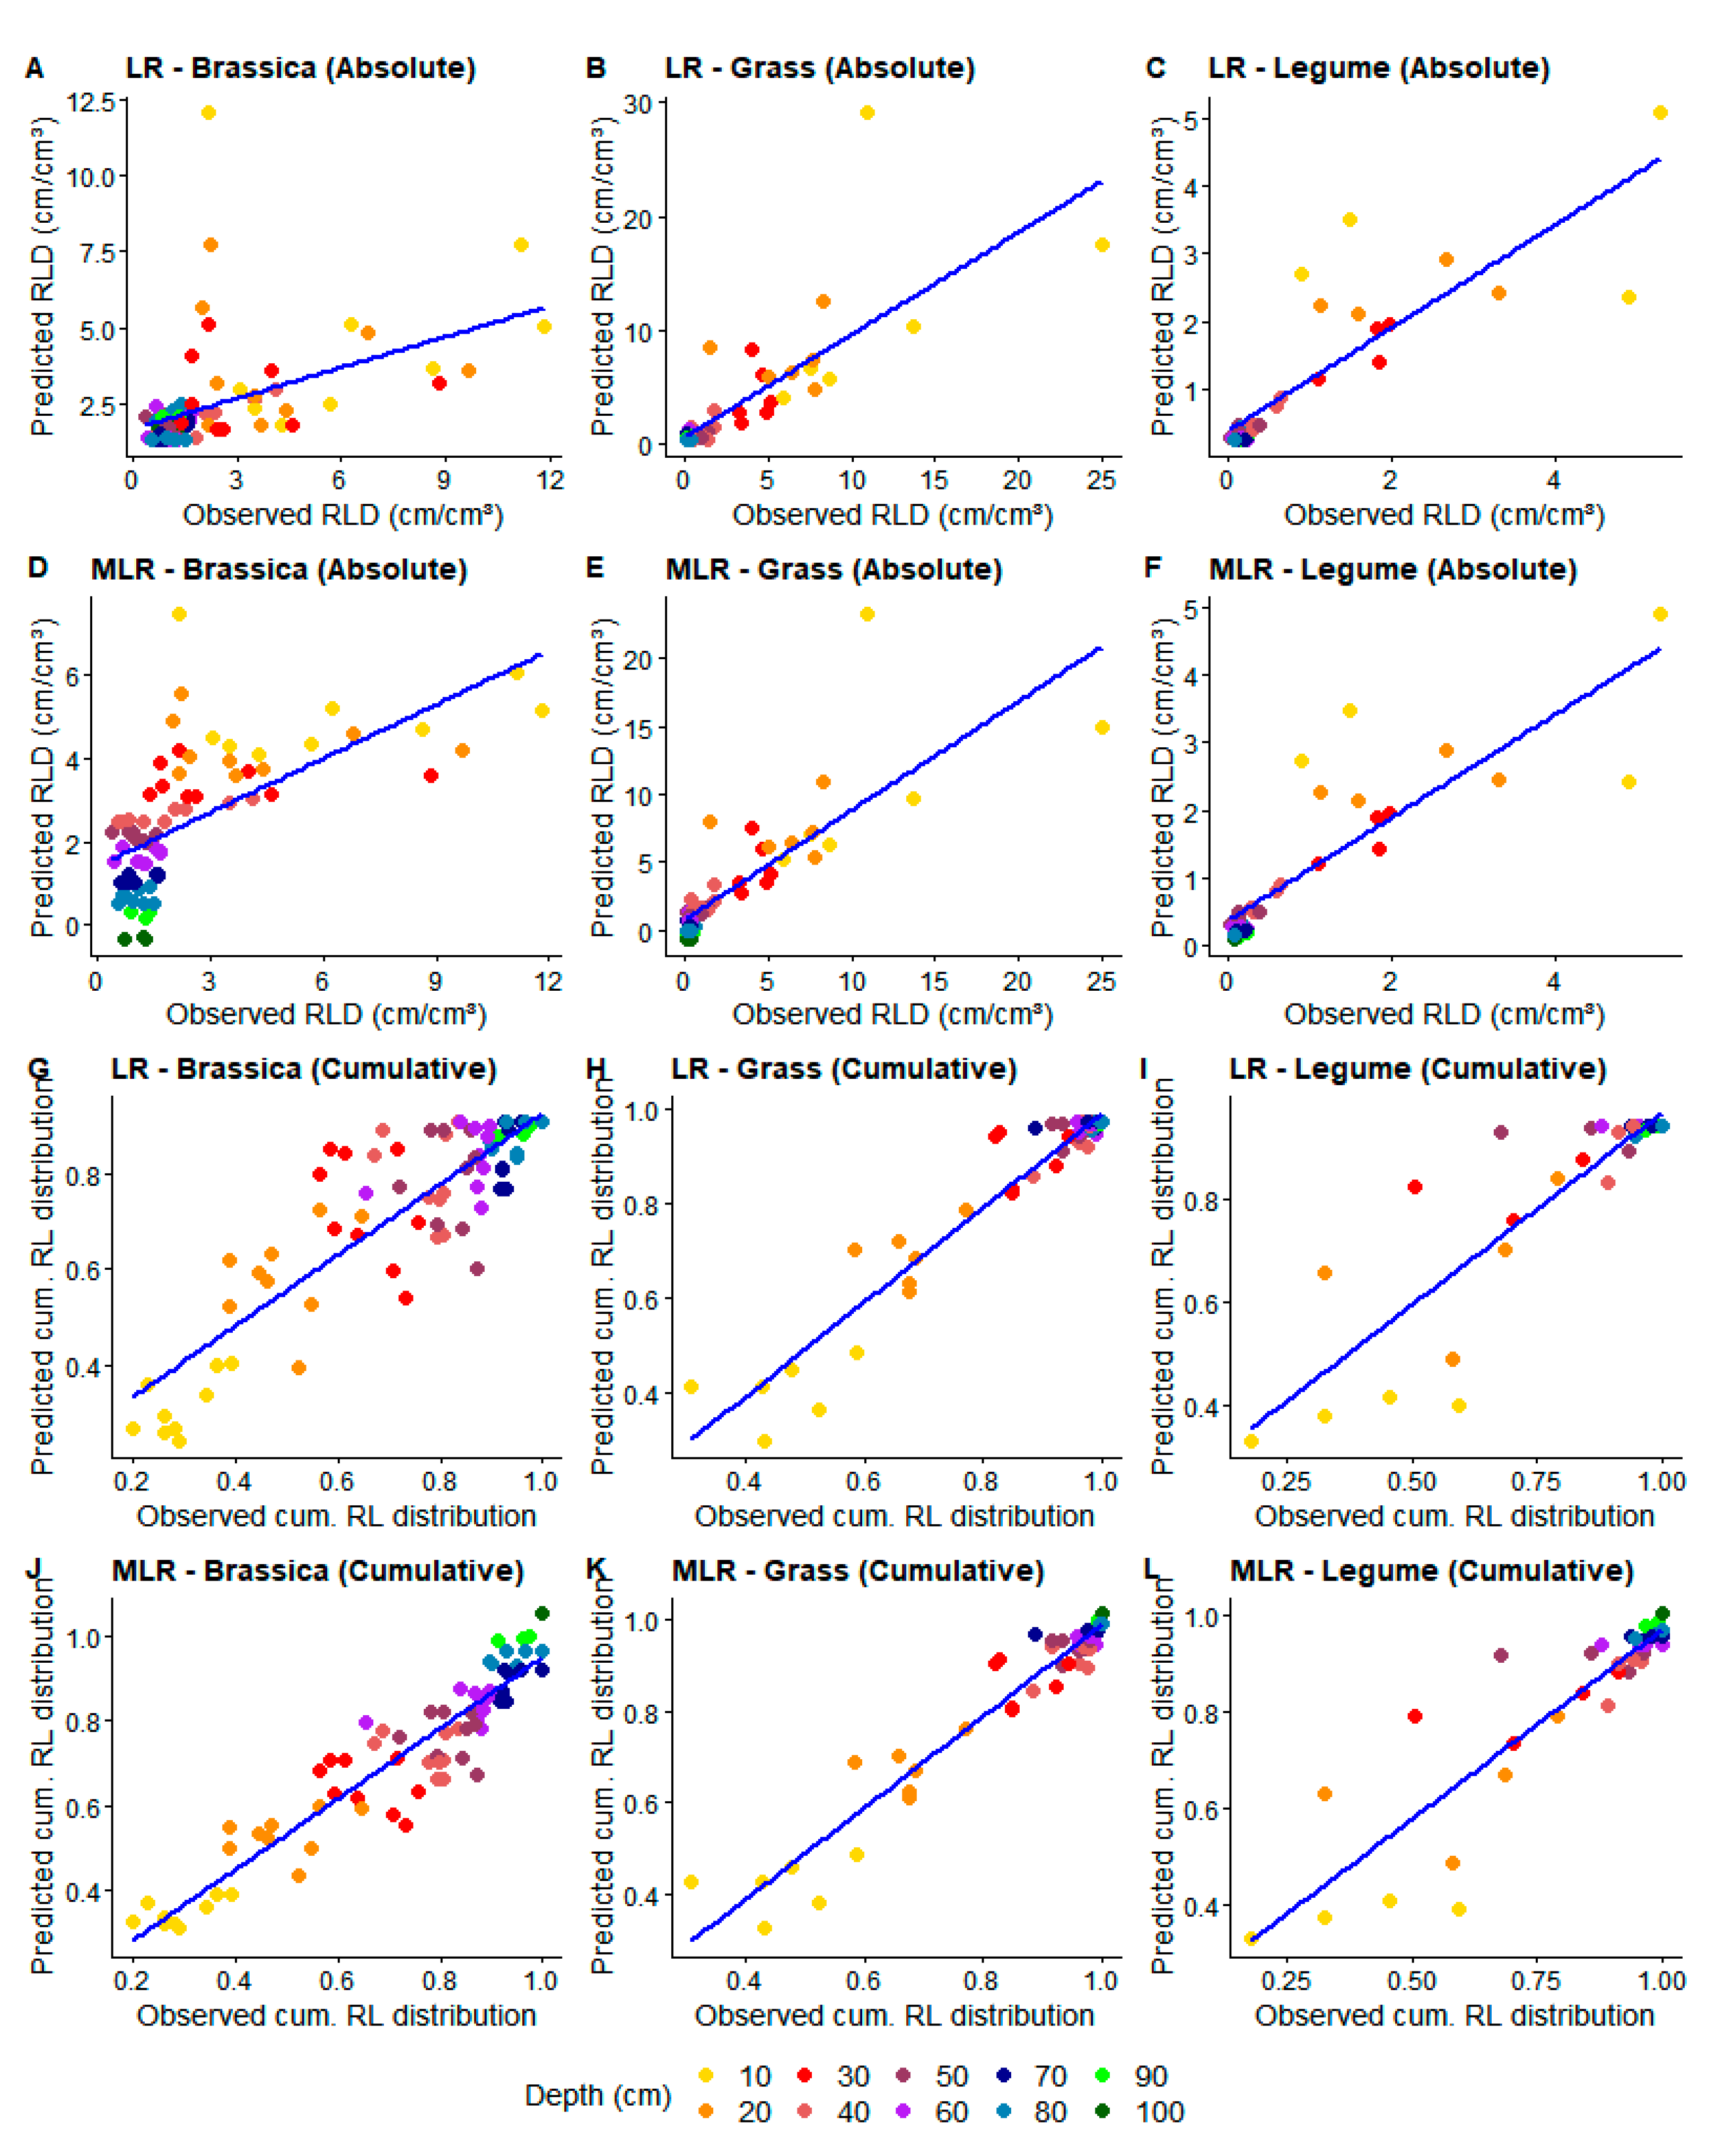
3.2. Model Testing
4. Discussion
5. Conclusions
Supplementary Materials
Author Contributions
Funding
Acknowledgments
Conflicts of Interest
References
- Kristensen, H.L.; Thorup-Kristensen, K. Root growth and nitrate uptake of three different catch crops in deep soil layers. Soil Sci. Soc. Am. J. 2004, 68, 529–537. [Google Scholar] [CrossRef]
- Thorup-Kristensen, K. Root development of nitrogen catch crops and of a succeeding crop of broccoli. Acta Agric. Scand. B Soil Plant Sci. 1993, 43, 58–64. [Google Scholar] [CrossRef]
- Thorup-Kristensen, K. Are differences in root growth of nitrogen catch crops important for their ability to reduce soil nitrate-N content, and how can this be measured? Plant Soil 2001, 230, 185–195. [Google Scholar] [CrossRef]
- Barraclough, P.B. Root growth, macro-nutrient uptake dynamics and soil fertility requirements of a high-yielding winter oilseed rape crop. Plant Soil 1989, 119, 59–70. [Google Scholar] [CrossRef]
- Wendling, M.; Büchi, L.; Amossé, C.; Sinaj, S.; Walter, A.; Charles, R. Influence of root and leaf traits on the uptake of nutrients in cover crops. Plant Soil 2016, 409, 419–434. [Google Scholar] [CrossRef]
- De Baets, S.; Poesen, J.; Gyssels, G.; Knapen, A. Effects of grass roots on the erodibility of topsoils during concentrated flow. Geomorphology 2006, 76, 54–67. [Google Scholar] [CrossRef]
- Sainju, U.M.; Singh, B.P.; Whitehead, W.F. Cover crop root distribution and its effects on soil nitrogen cycling. J. Agron. 1998, 90, 511–518. [Google Scholar] [CrossRef]
- Böhm, W. In situ estimation of root length at natural soil profiles. J. Agr. Sci. 1976, 87, 365–368. [Google Scholar] [CrossRef]
- Böhm, W.; Maduakor, H.; Taylor, H.M. Comparison of five methods for characterizing soybean rooting density and development 1. J. Agr. 1977, 69, 415–419. [Google Scholar] [CrossRef]
- Gao, Y.; Duan, A.; Qiu, X.; Liu, Z.; Sun, J.; Zhang, J.; Wang, H. Distribution of roots and root length density in a maize/soybean strip intercropping system. Agr. Water Manag. 2010, 98, 199–212. [Google Scholar] [CrossRef]
- Gregory, P.J.; Reddy, M.S. Root growth in an intercrop of pearl millet/groundnut. Field Crops Res. 1982, 5, 241–252. [Google Scholar] [CrossRef]
- Yu, Y.; Loiskandl, W.; Kaul, H.-P.; Himmelbauer, M.; Wei, W.; Chen, L.; Bodner, G. Estimation of runoff mitigation by morphologically different cover crop root systems. J. Hydrol. 2016, 538, 667–676. [Google Scholar] [CrossRef]
- Upchurch, D.R. Conversion of minirhizotron-root intersections to root length density. In Minirhizotron Observation Tubes: Methods and Applications for Measuring Rhizosphere Dynamics; Taylor, H., Ed.; ASA CSSA SSSA: Madison, WI, USA, 1987; pp. 51–65. [Google Scholar]
- Parker, C.J.; Carr, M.K.V.; Jarvis, N.J.; Puplampu, B.O.; Lee, V.H. An evaluation of the minirhizotron technique for estimating root distribution in potatoes. J. Agric. Sci. 1991, 116, 341–350. [Google Scholar] [CrossRef]
- Buckland, S.T.; Campbell, C.D.; Mackie-Dawson, L.A.; Horgan, G.W.; Duff, E.I. A method for counting roots observed in minirhizotrons and their theoretical conversion to root length density. Plant Soil 1993, 153, 1–9. [Google Scholar] [CrossRef]
- Liao, R.; Bai, Y.; Liang, H.; An, S.; Ren, S.; Cao, Y.; Le, Z.; Lu, J.; Liu, J. Root growth of maize as studied with minirhizotrons and monolith methods. Arch. Agr. Soil Sci. 2015, 61, 1343–1356. [Google Scholar] [CrossRef]
- Li, L.; Sun, J.; Zhang, F.; Guo, T.; Bao, X.; Smith, F.A.; Smith, S.E. Root distribution and interactions between intercropped species. Oecologia 2006, 147, 280–290. [Google Scholar] [CrossRef]
- Böhm, W. Methods of Studying Root Systems; Springer: Berlin/Heidelberg, Germany, 1979. [Google Scholar]
- Köpke, U. Ein Vergleich von Feldmethoden zur Bestimmung des Wurzelwachstums Landwirtschaftlicher Kulturpflanzen. Ph.D. Thesis, University of Göttingen, Göttingen, Germany, 1979. [Google Scholar]
- Gregory, P.J. Plant roots: Growth, activity and interaction with soils. Ann. Bot. 2007, 100, 151–152. [Google Scholar]
- Gaiser, T.; Perkons, U.; Küpper, P.M.; Puschmann, D.U.; Peth, S.; Kautz, T.; Pfeifer, J.; Ewert, F.; Horn, R.; Köpke, U. Evidence of improved water uptake from subsoil by spring wheat following lucerne in a temperate humid climate. Field Crops Res. 2012, 126, 56–62. [Google Scholar] [CrossRef]
- Han, E.; Kautz, T.; Perkons, U.; Uteau, D.; Peth, S.; Huang, N.; Horn, R.; Köpke, U. Root growth dynamics inside and outside of soil biopores as affected by crop sequence determined with the profile wall method. Biol. Fertil. Soils 2015, 51, 847–856. [Google Scholar] [CrossRef]
- Yang, J.M.; Yang, J.Y.; Liu, S.; Hoogenboom, G. An evaluation of the statistical methods for testing the performance of crop models with observed data. Agric. Syst. 2014, 127, 81–89. [Google Scholar] [CrossRef]
- St-Pierre, N.R. Comparison of model predictions with measurements: A novel model-assessment method. J. Dairy Sci. 2016, 99, 4907–4927. [Google Scholar] [CrossRef] [PubMed]
- Delory, B.M.; Weidlich, E.W.A.; Meder, L.; Lütje, A.; Duijnen, R.; Weidlich, R.; Temperton, V.M. Accuracy and bias of methods used for root length measurements in functional root research. Methods Ecol. Evol. 2017, 8, 1594–1606. [Google Scholar] [CrossRef]
- Goubran, F.H.; Richards, D. The estimation of root length in samples and sub-samples: Comparison of a visual and an automatic method. Plant Soil 1979, 52, 77–83. [Google Scholar] [CrossRef]
- De Ruijter, F.J.; Veen, B.W.; Van Oijen, M. A comparison of soil core sampling and minirhizotrons to quantify root development of field-grown potatoes. Plant Soil 1996, 182, 301–312. [Google Scholar] [CrossRef]
- Ephrath, J.E.; Silberbush, M.; Berliner, P.R. Calibration of minirhizotron readings against root length density data obtained from soil cores. Plant Soil 1999, 209, 201–208. [Google Scholar] [CrossRef]
- Vepraskas, M.J.; Hoyt, G.D. Comparison of the trench-profile and core methods for evaluating root distributions in tillage studies. J. Agr. 1988, 80, 166–172. [Google Scholar] [CrossRef]
- Dusserre, J.; Audebert, A.; Radanielson, A.; Chopart, J.-L. Towards a simple generic model for upland rice root length density estimation from root intersections on soil profile. Plant Soil 2009, 325, 277–288. [Google Scholar] [CrossRef]
- Samson, B.K.; Sinclair, T.R. Soil core and minirhizotron comparison for the determination of root length density. Plant Soil 1994, 161, 225–232. [Google Scholar] [CrossRef]
- Osipitan, O.A.; Dille, J.A.; Assefa, Y.; Knezevic, S.Z. Cover Crop for Early Season Weed Suppression in Crops: Systematic Review and Meta-Analysis. Agron. J. 2018, 110, 2211–2221. [Google Scholar] [CrossRef]
- Kemper, R.; Bublitz, T.A.; Müller, P.; Kautz, T.; Döring, T.F.; Athmann, M. Vertical root distribution of different cover crops determined with the profile wall method. Agriculture 2020, 10, 503. [Google Scholar] [CrossRef]
- Klimek-Kopyra, A.; Kulig, B.; Głąb, T.; Zając, T.; Skowera, B.; Kopcińska, J. Effect of plant intercropping and soil type on specific root length. Rom. Agr. Res. 2015, 221–230. [Google Scholar]
- De Wit, C.T.; Bergh, J.P.V.D. Competition between herbage plants. J. Agr. Sci. 1965, 13, 212–221. [Google Scholar]
- Grace, J.B.; Tilman, D. Perspectives on Plant Competition; Elsevier: Amsterdam, The Netherlands, 1990. [Google Scholar]
- Hauggaard-Nielsen, H.; Ambus, P.; Jensen, E.S. Temporal and spatial distribution of roots and competition for nitrogen in pea-barley intercrops—A field study employing 32P technique. Plant Soil 2001, 236, 63–74. [Google Scholar] [CrossRef]
- Mead, R.; Willey, R.W. The concept of a ‘Land Equivalent Ratio’ and advantages in yields from intercropping. Ex. Agric. 1980, 16, 217–228. [Google Scholar] [CrossRef]
- Regent Instruments Inc. WinRHIZOTM.; Regent Instruments Inc.: Quebec City, QC, Canada, 2017. [Google Scholar]
- R Core Team. R: A Language and Environment for Statistical Computing; R Foundation for Statistical Computing: Vienna, Austria, 2021. [Google Scholar]
- Hawkins, D.M. The problem of overfitting. J. Chem. Inf. Comput. Sci. 2004, 44, 1–12. [Google Scholar] [CrossRef]
- Akaike, H. Information theory and an extension of the maximum likelihood principle. In Proceedings of the 2nd International Symposium on Information Theory, Tsahkadsor, Armenia, 2–8 September 1971; Petrov, B.N., Csaki, F., Eds.; Akademiai Kiado: Budapest, Hungary, 1998; pp. 267–281. [Google Scholar]
- Loague, K.; Green, R.E. Statistical and graphical methods for evaluating solute transport models: Overview and application. J. Contam. Hydrol. 1991, 7, 51–73. [Google Scholar] [CrossRef]
- Austin, E.E.; Wickings, K.; McDaniel, M.D.; Robertson, G.P.; Grandy, A.S. Cover crop root contributions to soil carbon in a no-till corn bioenergy cropping system. GCB Bioenergy 2017, 9, 1252–1263. [Google Scholar] [CrossRef]
- Sinclair, T.R.; Seligman, N. Criteria for publishing papers on crop modeling. Field Crops Res. 2000, 68, 165–172. [Google Scholar] [CrossRef]
- Kücke, M.; Schmid, H.; Spiess, A. A comparison of four methods for measuring roots of field crops in three contrasting soils. Plant Soil 1995, 172, 63–71. [Google Scholar] [CrossRef]
- Passioura, J.B. Simulation models: Science, snake oil, education, or engineering? J. Agron. 1996, 88, 690–694. [Google Scholar] [CrossRef]
- Bodner, G.; Loiskandl, W.; Hartl, W.; Erhart, E.; Sobotik, M. Characterization of cover crop rooting types from integration of rhizobox imaging and root atlas information. Plants 2019, 8, 514. [Google Scholar] [CrossRef] [PubMed]
- Chopart, J.L.; Siband, P. Development and validation of a model to describe root length density of maize from root counts on soil profiles. Plant Soil 1999, 214, 61–74. [Google Scholar] [CrossRef]
- Heeraman, D.A.; Juma, N.G. A comparison of minirhizotron, core and monolith methods for quantifying barley (Hordeum vulgare L.) and fababean (Vicia faba L.) root distribution. Plant Soil 1993, 148, 29–41. [Google Scholar] [CrossRef]
- Chopart, J.-L.; Sine, B.; Dao, A.; Muller, B. Root orientation of four sorghum cultivars: Application to estimate root length density from root counts in soil profiles. Plant Root 2008, 2, 67–75. [Google Scholar] [CrossRef][Green Version]
- Lopez-Zamora, I.; Falcão, N.; Comerford, N.B.; Barros, N.F. Root isotropy and an evaluation of a method for measuring root distribution in soil trenches. For. Ecol. Manag. 2002, 166, 303–310. [Google Scholar] [CrossRef]


| Crop/Mixture Species | Cultivar | Dominant Crop | Crop Group | Seed Quantity (kg/ha) |
|---|---|---|---|---|
| Winter rye (Secale cereale L.) | Bonfire | Grasses | 120 | |
| Bristle oat (Avena strigosa Schreb.) | Pratex | Grasses | 80 | |
| Blue lupin (Lupinus angustifolius L.) | Boruta | Legumes | 120 | |
| Crimson clover (Trifolium incarnatum L.) | Linkarus | Legumes | 30 | |
| Oil radish (Raphanus sativus L. var. oleiformis Pers.) | Siletina | Brassica | 25 | |
| Tillage radish (Raphanus sativus L. var. oleiformis Pers.) | Deeptill | Brassica | 12 | |
| Winter turnip rape (Brassica rapa L. var. silvestris (Lam.) Briggs) | Jupiter | Brassica | 15 | |
| Mixed crops | ||||
| Oil radish/green rye | Oil radish | Brassica | 12.5/60 | |
| Oil radish/crimson clover | Oil radish | Brassica | 6.25/22.5 | |
| Oil radish/crimson clover/winter rye | Oil radish | Brassica | 8.5/10/40 | |
| Blue lupin/winter rye | Winter rye | Grasses | 60/60 | |
| Blue lupin/winter rye | Winter rye | Grasses | 90/30 | |
| Crop Family | Soil Depth (cm) | Mean RLD (cm/cm3) | Sd RLD (cm/cm3) | Mean cum. RL | Sd cum. RL | Mean Error (cm/cm3) (abs.) | Mean Error (cm/cm3) (cum.) | n | ||||
|---|---|---|---|---|---|---|---|---|---|---|---|---|
| MO | PW | MO | PW | MO | PW | MO | PW | |||||
| Brassicas | 10 | 6.40 | 1.04 | 3.60 | 0.89 | 0.288 | 0.362 | 0.06 | 0.08 | 5.36 | −0.07 | 27 |
| 20 | 4.83 | 0.69 | 2.53 | 0.48 | 0.507 | 0.632 | 0.08 | 0.13 | 4.15 | −0.13 | 27 | |
| 30 | 3.78 | 0.44 | 2.36 | 0.33 | 0.673 | 0.793 | 0.09 | 0.14 | 3.34 | −0.12 | 27 | |
| 40 | 1.68 | 0.20 | 1.03 | 0.18 | 0.749 | 0.850 | 0.09 | 0.12 | 1.48 | −0.10 | 27 | |
| 50 | 1.00 | 0.14 | 0.32 | 0.15 | 0.801 | 0.891 | 0.08 | 0.10 | 0.86 | −0.09 | 27 | |
| 60 | 1.05 | 0.15 | 0.40 | 0.16 | 0.856 | 0.925 | 0.07 | 0.07 | 0.91 | −0.07 | 27 | |
| 70 | 0.99 | 0.11 | 0.33 | 0.13 | 0.908 | 0.950 | 0.06 | 0.05 | 0.88 | −0.04 | 27 | |
| 80 | 1.06 | 0.12 | 0.33 | 0.14 | 0.956 | 0.972 | 0.05 | 0.03 | 0.93 | −0.02 | 25 | |
| 90 | 1.05 | 0.13 | 0.34 | 0.10 | 0.973 | 0.986 | 0.03 | 0.01 | 0.91 | −0.01 | 15 | |
| 100 | 1.02 | 0.12 | 0.21 | 0.06 | 1.000 | 1.000 | 0.00 | 0.00 | 0.90 | 0.00 | 9 | |
| Grasses | 10 | 11.56 | 1.72 | 6.49 | 1.40 | 0.442 | 0.476 | 0.11 | 0.07 | 9.84 | −0.03 | 18 |
| 20 | 5.68 | 0.98 | 1.95 | 0.63 | 0.687 | 0.773 | 0.09 | 0.06 | 4.70 | −0.09 | 18 | |
| 30 | 4.33 | 0.49 | 1.93 | 0.31 | 0.866 | 0.923 | 0.06 | 0.05 | 3.84 | −0.06 | 18 | |
| 40 | 1.54 | 0.16 | 0.84 | 0.14 | 0.931 | 0.965 | 0.04 | 0.03 | 1.38 | −0.03 | 18 | |
| 50 | 0.43 | 0.06 | 0.34 | 0.07 | 0.949 | 0.979 | 0.03 | 0.02 | 0.37 | −0.03 | 18 | |
| 60 | 0.37 | 0.04 | 0.30 | 0.05 | 0.964 | 0.988 | 0.03 | 0.01 | 0.32 | −0.02 | 18 | |
| 70 | 0.29 | 0.03 | 0.21 | 0.03 | 0.976 | 0.994 | 0.02 | 0.01 | 0.26 | −0.02 | 18 | |
| 80 | 0.25 | 0.02 | 0.17 | 0.02 | 0.986 | 0.997 | 0.02 | 0.00 | 0.23 | −0.01 | 18 | |
| 90 | 0.25 | 0.02 | 0.14 | 0.02 | 0.992 | 0.999 | 0.01 | 0.00 | 0.23 | −0.01 | 12 | |
| 100 | 0.20 | 0.01 | 0.11 | 0.01 | 1.000 | 1.000 | 0.00 | 0.00 | 0.19 | 0.00 | 9 | |
| Legumes | 10 | 2.95 | 0.83 | 1.66 | 0.89 | 0.338 | 0.436 | 0.14 | 0.10 | 2.12 | −0.10 | 12 |
| 20 | 2.27 | 0.52 | 1.02 | 0.44 | 0.602 | 0.753 | 0.14 | 0.12 | 1.75 | −0.15 | 12 | |
| 30 | 1.89 | 0.25 | 1.23 | 0.18 | 0.812 | 0.924 | 0.11 | 0.06 | 1.64 | −0.11 | 12 | |
| 40 | 0.61 | 0.06 | 0.52 | 0.04 | 0.886 | 0.972 | 0.09 | 0.03 | 0.55 | −0.09 | 12 | |
| 50 | 0.16 | 0.01 | 0.10 | 0.01 | 0.910 | 0.985 | 0.08 | 0.03 | 0.15 | −0.08 | 12 | |
| 60 | 0.16 | 0.01 | 0.09 | 0.01 | 0.931 | 0.991 | 0.07 | 0.02 | 0.15 | −0.06 | 12 | |
| 70 | 0.18 | 0.00 | 0.11 | 0.01 | 0.948 | 0.994 | 0.05 | 0.01 | 0.18 | −0.05 | 11 | |
| 80 | 0.20 | 0.01 | 0.15 | 0.01 | 0.968 | 0.997 | 0.03 | 0.01 | 0.19 | −0.03 | 10 | |
| 90 | 0.08 | 0.00 | 0.66 | 0.01 | 0.989 | 0.999 | 0.01 | 0.00 | 0.23 | −0.01 | 8 | |
| 100 | 0.09 | 0.00 | 0.32 | 0.01 | 1.000 | 1.000 | 0.00 | 0.00 | 0.19 | 0.00 | 5 | |
| Data Type | Crop Group | Model | AIC | R2 | |||
|---|---|---|---|---|---|---|---|
| Absolute data (RLD) | Brassicas | Simple linear | 614.36 | 0.20 * | 1.32 | 3.28 | - |
| Multiple linear | 552.04 | 0.48 * | 4.41 | 1.08 | −0.05 | ||
| Grasses | Simple linear | 414.51 | 0.68 * | 0.45 | 7.10 | - | |
| Multiple linear | 400.59 | 0.72 * | 2.83 | 5.18 | −0.04 | ||
| Legumes | Simple linear | 100.26 | 0.76 * | 0.25 | 5.99 | - | |
| Multiple linear | 100.05 | 0.77 * | 0.53 | 5.46 | −0.004 | ||
| Cumulative data (cum. RL) | Brassicas | Simple linear | −236.34 | 0.72 * | −0.01 | 1.10 | - |
| Multiple linear | −325.69 | 0.85 * | 0.92 | 0.47 | 0.004 | ||
| Grasses | Simple linear | −309.70 | 0.90 * | −0.13 | 1.10 | - | |
| Multiple linear | −327.27 | 0.92 * | −0.06 | 0.95 | 0.001 | ||
| Legumes | Simple linear | −160.31 | 0.89 * | −0.10 | 1.05 | - | |
| Multiple linear | −172.19 | 0.91 * | −0.05 | 0.90 | 0.002 |
| Data Type | Crop Group | Model | R2 | MAE | RMSE |
|---|---|---|---|---|---|
| Absolute data (RLD) | Brassicas | Simple linear | 0.23 * | 1.37 | 2.22 |
| Multiple linear | 0.42 * | 1.25 | 1.86 | ||
| Grasses | Simple linear | 0.63 * | 1.41 | 3.13 | |
| Multiple linear | 0.68 * | 1.35 | 2.63 | ||
| Legumes | Simple linear | 0.73 * | 0.39 | 0.71 | |
| Multiple linear | 0.73 * | 0.39 | 0.70 | ||
| Cumulative data (cum. RL) | Brassicas | Simple linear | 0.76 * | 0.09 | 0.11 |
| Multiple linear | 0.88 * | 0.07 | 0.08 | ||
| Grasses | Simple linear | 0.92 * | 0.04 | 0.05 | |
| Multiple linear | 0.93 * | 0.04 | 0.05 | ||
| Legumes | Simple linear | 0.77 * | 0.07 | 0.11 | |
| Multiple linear | 0.80 * | 0.06 | 0.10 |
Publisher’s Note: MDPI stays neutral with regard to jurisdictional claims in published maps and institutional affiliations. |
© 2021 by the authors. Licensee MDPI, Basel, Switzerland. This article is an open access article distributed under the terms and conditions of the Creative Commons Attribution (CC BY) license (https://creativecommons.org/licenses/by/4.0/).
Share and Cite
Bublitz, T.A.; Kemper, R.; Müller, P.; Kautz, T.; Döring, T.F.; Athmann, M. Relating Profile Wall Root-Length Density Estimates to Monolith Root-Length Density Measurements of Cover Crops. Agronomy 2022, 12, 48. https://doi.org/10.3390/agronomy12010048
Bublitz TA, Kemper R, Müller P, Kautz T, Döring TF, Athmann M. Relating Profile Wall Root-Length Density Estimates to Monolith Root-Length Density Measurements of Cover Crops. Agronomy. 2022; 12(1):48. https://doi.org/10.3390/agronomy12010048
Chicago/Turabian StyleBublitz, Tábata Aline, Roman Kemper, Phillip Müller, Timo Kautz, Thomas F. Döring, and Miriam Athmann. 2022. "Relating Profile Wall Root-Length Density Estimates to Monolith Root-Length Density Measurements of Cover Crops" Agronomy 12, no. 1: 48. https://doi.org/10.3390/agronomy12010048
APA StyleBublitz, T. A., Kemper, R., Müller, P., Kautz, T., Döring, T. F., & Athmann, M. (2022). Relating Profile Wall Root-Length Density Estimates to Monolith Root-Length Density Measurements of Cover Crops. Agronomy, 12(1), 48. https://doi.org/10.3390/agronomy12010048