Article

Hazelnuts (Corylus avellana L.) from Spontaneous Flora of the West Part of Romania: A Source of Nutrients for Locals

1
Faculty of Horticulture and Forestry, Banat’s University of Agricultural Sciences and Veterinary Medicine “King Michael I of Romania” from Timisoara, Calea Aradului 119, RO-300645 Timisoara, Romania
2
Faculty of Agriculture, Banat’s University of Agricultural Sciences and Veterinary Medicine “King Michael I of Romania” from Timisoara, Calea Aradului 119, RO-300645 Timisoara, Romania
3
Faculty of Food Engineering, Banat’s University of Agricultural Sciences and Veterinary Medicine King “Michael I of Romania” from Timisoara, Calea Aradului 119, RO-300645 Timisoara, Romania
4
Faculty of Veterinary Medicine, Banat’s University of Agricultural Sciences and Veterinary Medicine “King Michael I of Romania” from Timisoara, Calea Aradului 119, RO-300645 Timisoara, Romania
5
Marin Drăcea National Institute for Research and Development in Forestry, Eroilor Blvd. 128, RO-077190 Voluntari, Romania
6
Horticulture Department, University of Agricultural Science and Veterinary Medicine, RO-400372 Cluj-Napoca, Romania
*
Authors to whom correspondence should be addressed.
These authors contributed equally to this work.
Agronomy 2022, 12(1), 214; https://doi.org/10.3390/agronomy12010214
Submission received: 25 November 2021 / Revised: 11 January 2022 / Accepted: 12 January 2022 / Published: 16 January 2022
(This article belongs to the Special Issue Agricultural Products: Nutritional Value and Functional Properties)

Abstract

:
In this study, the nutritional potential of some hazelnut varieties from the spontaneous flora of Romania was analyzed as a means to increase the sustainability of the local production. The chemical composition from hazelnuts (Corylus avellana L.) from spontaneous flora was determined in terms of mineral substances, protein, as well as essential and non-essential amino acids. The eight amino acids investigated had the following average values: Arg—0.68 g/100 g, Phe—0.415 g/100 g, Ser—0.277 g/100 g, Glu—0.188 g/100 g, Asp—0.133 g/100 g, Pro—0.038 g/100 g, and Lys—0.031 g/100 g. The average values of metal content were in the ranges: 88.39–146.98 µg·g−1 (Fe); 96.93–123.23 µg·g−1(Zn); 46.68–100.38 µg·g−1 (Cu); 26.00–87.78 µg·g−1 (Mn); 4.87–32.19 µg·g−1 (Ni); 1.87–2.84 µg·g−1 (Cr); and 1.29–1.86 µg·g−1 (Cd). Crude protein content values were in the range 16.33–22.31%. In order to harness this nutritional potential, the variety with superior quality indices was included, in the form of flour, in biscuit-type baked goods that were characterized from nutritional and sensory points of view. The results showed that the content of polyphenols increased with the addition of hazelnut flour, as did the content of polyunsaturated fatty acids.

1. Introduction

In the context of accelerated population growth, finding new food sources with high nutritional and functional potential is a research direction intensively addressed in the agricultural/horticultural/food fields.Hazelnut (Corylus avellana L.), known since ancient times, is a popular nut world-wide, appreciated for the quality of its fruit, for its decorative value, as well as for its property of stabilizing soils, consolidating land, and minimizing erosion [1].
Hazelnut is a wind-pollinated plant species, naturally reclaimed and recovered by the whole of Europe, from Norway to the Iberian Peninsula and the Ural Mountains [2,3]. It is mainly spread along the coasts of the Black Sea region of Turkey, southern Europe (Italy, Spain, Portugal, and France), and in some areas of the United States (Oregon and Washington). Hazelnut is also found in New Zealand, China, Azerbaijan, Chile, Georgia, and Iran [4]. In Romania, hazelnuts are part of the spontaneous flora, found in people’s gardens, but in the last 10 years hazelnut plantations have been established for both the Romanian and Italian varieties, in different regions of the country: Timis, Alba, Cluj, and Mures [1]. The official data from FAOSTAT on the cultivation of hazelnuts in Romania showed that in 2019, the harvested area of hazelnuts was 890 ha, yield hg/ha—2584 fruit, production, 230 tons. In 2020, there was an increase in yield (22,254 hg/ha) and in the production of hazelnuts obtained—1580 ha [5]. The hazelnut grows naturally in forests; however, in some areas where the fruits are not harvested, their use in food is limited.
The spontaneous growth of the hazelnut and the occupation of some forested pastures, in assortment with other forest species, is not without threats. The European agricultural sector is constantly improving its resilience and sustainability through local assessments and strategies at the level of agricultural systems, which often include hazelnuts. The cutting of trees and shrubs, implicitly also of hazelnut, of dimensions of more than 8 cm, is conditioned, however, by the marking of the trees by the authorities, which means that it cannot be done without a cutting authorization (Order 1651/31 October 2000) [6]. This, together with a lack of labor force at the level of private properties, makes it somewhat difficult to clear the meadows of woody vegetation, many non-exploited areas being valued today with the help of forest vegetation.
The threat of spontaneous hazelnut populations on meadows suggests a relatively low durability. However, spontaneous hazelnut populations in the forest fund are not subject to such threats. The forest microclimate and the specific vegetation of the hazelnut in the shrub layer or at the edge of the forest minimize the effect of climate change on these species. The effect of climate change on hazelnut shrubs productivity is particularly prevalent in intensive crops, such as in Turkey, the largest producer of hazelnuts, where the impact of climate change on hazelnut production has a large impact on the global hazelnut sector [7]. Some research even suggests the need for the deforestation of lands with a favorable climate to establish new hazelnut cultivation areas [8]. Other threats to hazelnut production are linked to diseases and pests. Research on hazelnut diseases and pests mainly addresses intensive crops, from which 150 species of insects and mites were identified [9]. In the case of hazelnuts, most pests affect production by causing direct or indirect damage, but some affect the quality of the core, feeding on it and reducing production [10]. Few are pests of economic importance; the damage caused by the others is relatively minor, even in untreated crops [9]. In addition to pest species, 130 species of natural enemies of pests have been identified [11]. The spontaneous existence of hazelnut in the forest environment with a rich and varied composition, but also the existence of isolated specimens on meadows, as is the case of specimens from which samples were collected in this study, makes it difficult to spread new diseases and pests specific to hazelnut.
In Romania, the cultivation of hazelnut shrubs is not done in an intensive system, as they are found spontaneously or rarely planted on fragmented lands, on private property. Given these aspects, the cultivation, or rather the spontaneous growth of hazelnut shrubs in these areas and the harvesting of hazelnuts, does not affect the agricultural systems in the region. Damage can only occur spontaneously, through the natural afforestation of pastures with forest species, including hazelnut, and the transformation of these pastures into forests, over time. But in this case, one cannot speak of a singular impact of hazelnuts or hazelnut harvesting on the agricultural systems of the region. Even in the case of intensive hazelnut plantations, the real impact on the environment is controversial [12]. However, it is well known that in intensive agricultural systems, the use of fertilizers and pesticides is often excessive and harmful to the environment [13], while sustainable agriculture supports a sustainable agricultural system [14]. It is well known that hazelnuts are an important source of proteins, amino acids, and microelements for the human body, and that their composition is strongly influenced by environmental conditions [15]. Hazelnuts are used in human food as fresh fruit or processed in a multitude of products (cakes, ice-creams, salads, candies, chocolate [16,17]). Around 90% of the global production is used in the food industry and the shell, representing 10%, is marketed as a byproduct for feed [18,19].
Worldwide, hazelnut consumption is on the rise, with more and more people including them in their daily diet. As consumers have become increasingly interested in the composition of food, the global demand for nonmeat protein sources, with a balanced content of amino acids, has also increased. Due to their high nutritional value and rich content of B vitamins (B1, B2, B3, B5), nicotinamide, and especially vitamin E (tocopherol), fats, protein, carbohydrates, minerals, dietary fiber, and phenolic antioxidants, the consumption of hazelnuts is correlated with decreased risk of coronary heart disease, atherosclerosis, and some forms of cancer. Hazelnuts are anti-inflammatory and hypolipidemic foods [20] that are the second richest source of MUFAs after walnuts [21]. Di Renzo et al. [22] studied the effect of hazelnut butter treatment on the body and the genomic response of genes responsible for oxidative stress and inflammation.
Hazelnut flour can successfully replace wheat flour because it is low in carbohydrates and rich in dietary protein and fiber. The most common functional recipes based on hazelnut flour include biscuits, muffins, and cookies, where the wheat flour fraction can be replaced in various proportions with hazelnut flour [23]. The functional properties and rheological characteristics of defatted hazelnut flour protein produced from defatted hazelnut flour [24] recommend its use. Defatted hazelnut flour and defatted hazelnut cake, respectively, were included in different food formulations, such as burgers [25], ice cream [26], and bread [27]. Hazelnuts fall into the category of functional food matrices; their consumption is increasingly recommended by nutritionists to remedy various deficiencies [24].
Considering the concept of a circular economy and the promotion of sustainability and alternative resources, the exploitation of hazelnuts as possible functional matrices in food is a topical approach with positive economic, social, and environmental impacts [28].
In this context, the purpose of this study was to determine the chemical composition of hazelnuts from local, spontaneous populations in Timiş County and parks in Timisoara, Romania in order to recommend these as a sustainable food matrix. In addition, an innovative solution was proposed to harness the nutritional and functional potential of hazelnuts as flour in a biscuit-type product.

2. Materials and Methods

2.1. Samples of Huzelnuts

The hazelnut shrubs from which the samples were collected grow on land that is privately owned by the locals. They grow spontaneously or are cultivated, but without benefiting from intensive, regulars or planned agricultural practices.
In the period 25 September–10 October 2018, hazelnuts (Corylus avellana L.) were harvested from the following localities of Timiş County: Mosnita Veche (C1) (45°44′4″ N 21°19′48″ E), Timisoara (C2) (45°47′58″ N 21°17′38″ E), Sanmihaiu German (C3) (45°42′51″ N 21°22′23″ E), Topolovat (C4) (45°46′32″ N 21°37′44″ E), and Lugoj (C5) (45°41′10″ N 21°54′2″ E). These locations were chosen because in this area there are a large number of hazelnut shrubs that grow spontaneously and for which the fruit is used to a small extent in food.
Shrubs occupy lands that are not cultivated with other species of agronomic or horticultural interest, marginal lands of the property, and lands that are partially forested spontaneously. The only agricultural practices, applied especially in the early development of shrubs, are planting (as appropriate), mowing, and clearing the land around the hazel shrubs of other woody plants, and watering in very dry periods when the life of shrubs is endangered. From this point of view, it can be said that the hazelnuts used in the study come from organic farming.
In order to cover the whole range of agronomic and vegetation conditions, when choosing the samples, it was taken into account that the hazelnut harvesting should be performed both from isolated shrubs and shrubs that were in competition with other shrubs, fruit trees, or trees. The hazelnut shrubs from which the samples were collected grew in different conditions of soil, field slope, aspect, and altitude. Variables such as canopy cover, aspect, and field slope explain some of the variations observed in the production of hazelnut shrubs [29]. The samples were not chosen only from shrubs located in optimal vegetation conditions; on the contrary, great care was taken for the test sample collected to cover as varied vegetation conditions as possible. In the present paper, the sampling from shrubs that vegetate in different conditions aimed for the homogeneity of the test sample in relation to these conditions, and not the correlation of some aspects regarding the physical or chemical properties of the hazelnuts with the vegetation conditions.
One hundred hazelnuts were harvested from each location, which, after shelling, were prepared for the determination of microelements, crude protein, and amino acids. Analyses were performed at the Interdisciplinary Platform of B.U.A.S.V.M. “King Mihai I of Romania” from Timisoara. The samples were washed with deionized water and dried in the oven with ventilation POL-EKO-APARATURA (Wodzislaw, Poland) at a temperature of 105 °C for 12 h. For homogenization, they were crusted into the mill with a stainless steel knife robot-coupe Blixer 3 B (Montceau-en-Bourgagne, France).

2.2. Crude Protein Determination

The crude protein content (CP) was calculated based on the total nitrogen content determined by the Kjeldahl method (AOAC Official Method 950.48) [30]. CP = Total N (%) 5.48 [31].

2.3. Ash Determination

Preparation of hazelnut samples for the determination of the ash content was made by dry ashing technique. One gram of sample was introduced into an open crucible and heated at a temperature of 550 °C under atmospheric pressure in a muffle furnace (SLN 53 STD, POL-EKO-Aparatura SP, Wodzislaw, Poland) in order to remove organic matter by thermal decomposition. The resulting ash was dissolved in 6 N HCl (Sigma-Aldrich Chemie GmbH, München, Germany), and, after filtration, the solution was brought to the volume of 50 mL with bidistilled water. The metal content was determined by atomic absorption spectrometry technique using a Varian Spectra 240 FS spectrophotometer (Palo Alto, CA, USA). The working conditions are presented in Table 1. Air:acetylene ratio 13.50:2. Nebulizer uptake rate: 5 L/min. For calibration, standard solutions were used with concentrations ranging from 0.3 to 3 μg/L, prepared from multielement solution ICP standard solution of 1000 mg/L.

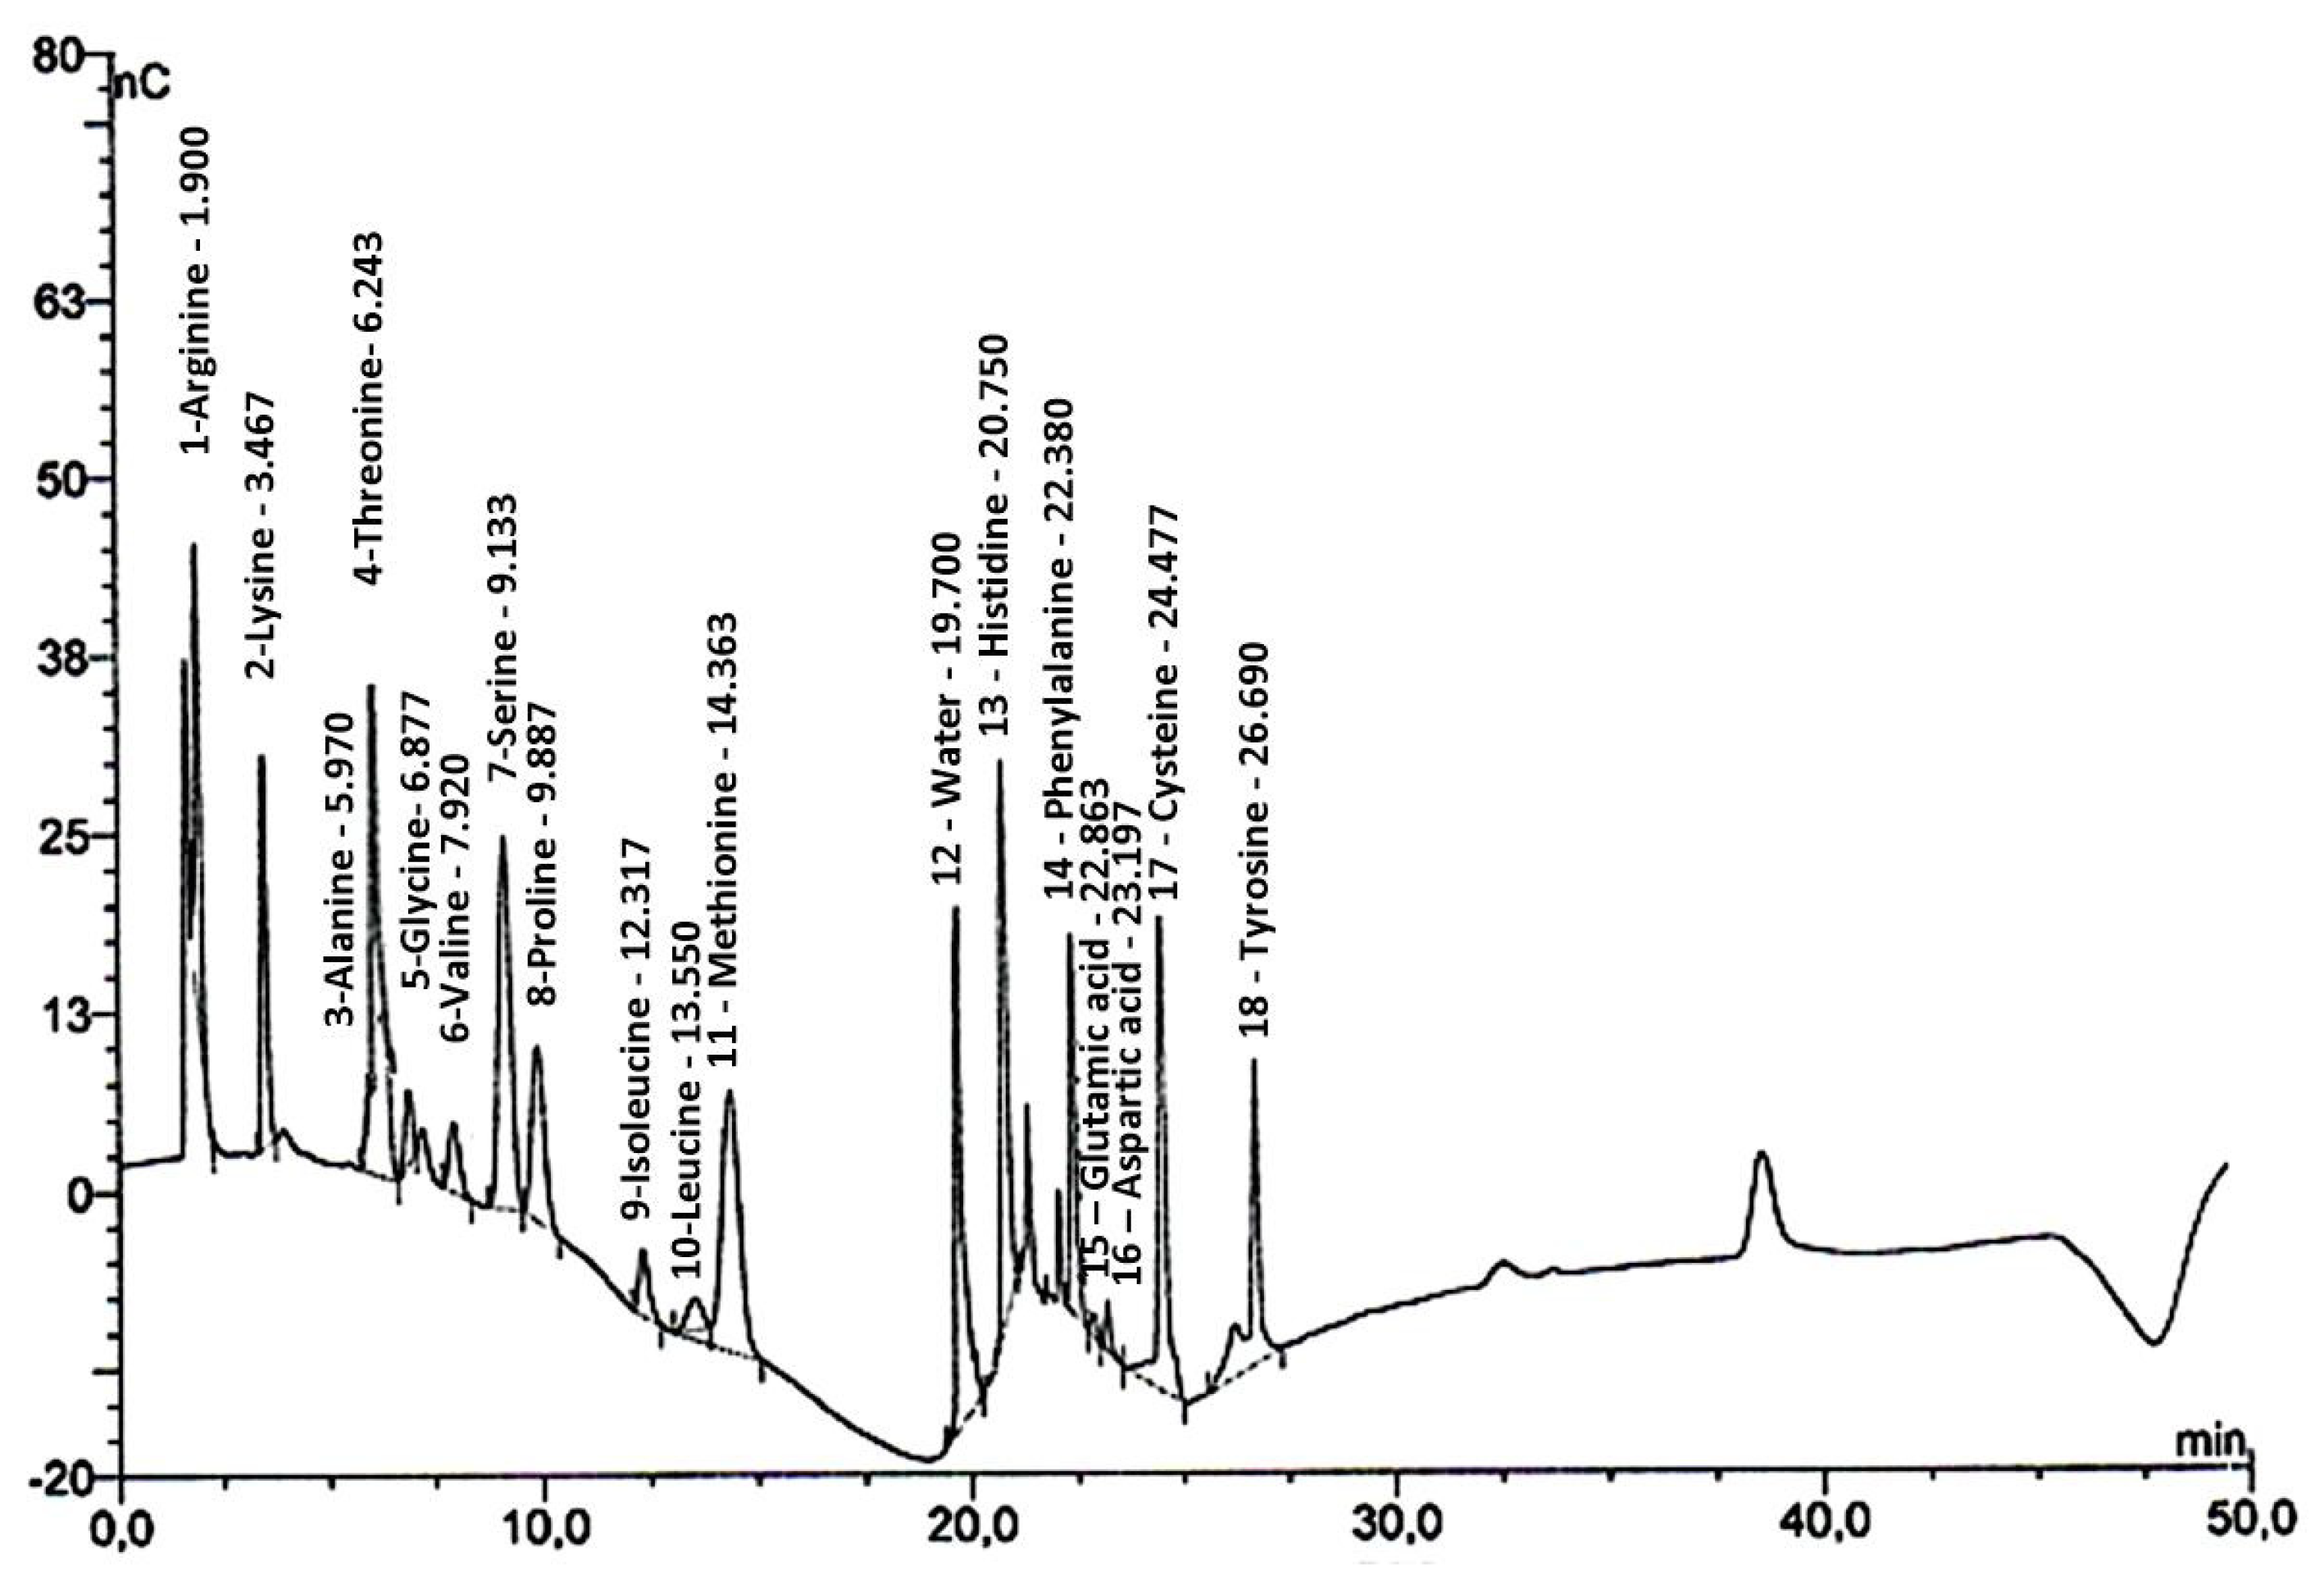
2.4. Amino Acids Determination

Determination of amino acids (AA), with the exception of sulfur amino acids, involves their acid hydrolysis in the presence of 6 M HCl (Sigma-Aldrich Chemie GmbH, München, Germany) and identification and chromatographic quantification using the DIONEX ICS-3000 amino acid analyzer (Sunnyvale, CA, USA) belonging to Interdisciplinary Research Platform of Banat’s University of Agricultural Sciences and Veterinary Medicine, “King Michael I of Romania” from Timisoara.
The sample (0.5 g) was hydrolyzed with 10 mL of 6 M HCl (Sigma-Aldrich Chemie GmbH, München, Germany) for 24 h at a temperature of 100 °C. The sample was filtered through a Millipore Whatman 0.2 µm filter (Sigma-Aldrich Chemie GmbH, München, Germany), and diluted 1:10 with 0.1 N HCl.
Chromatographic conditions:
AMINOPAC PA10 Chromatography column (2 × 250 mm, P/N 055406), AMI-NOPAC PA10 precursor (2 × 50 mm, P/N 055407) (ThermoFisher, Waltham, MA, USA), Mobile phases: E1, water, E2, 250 mM NaOH, E3, Mobile: 0.25 mL/min (Table 2); Reference electrode: pH/Ag/AgCl; 30 °C column temperature. The chromatogram of the standard of amino acids (SAA) is presented in Figure 1.

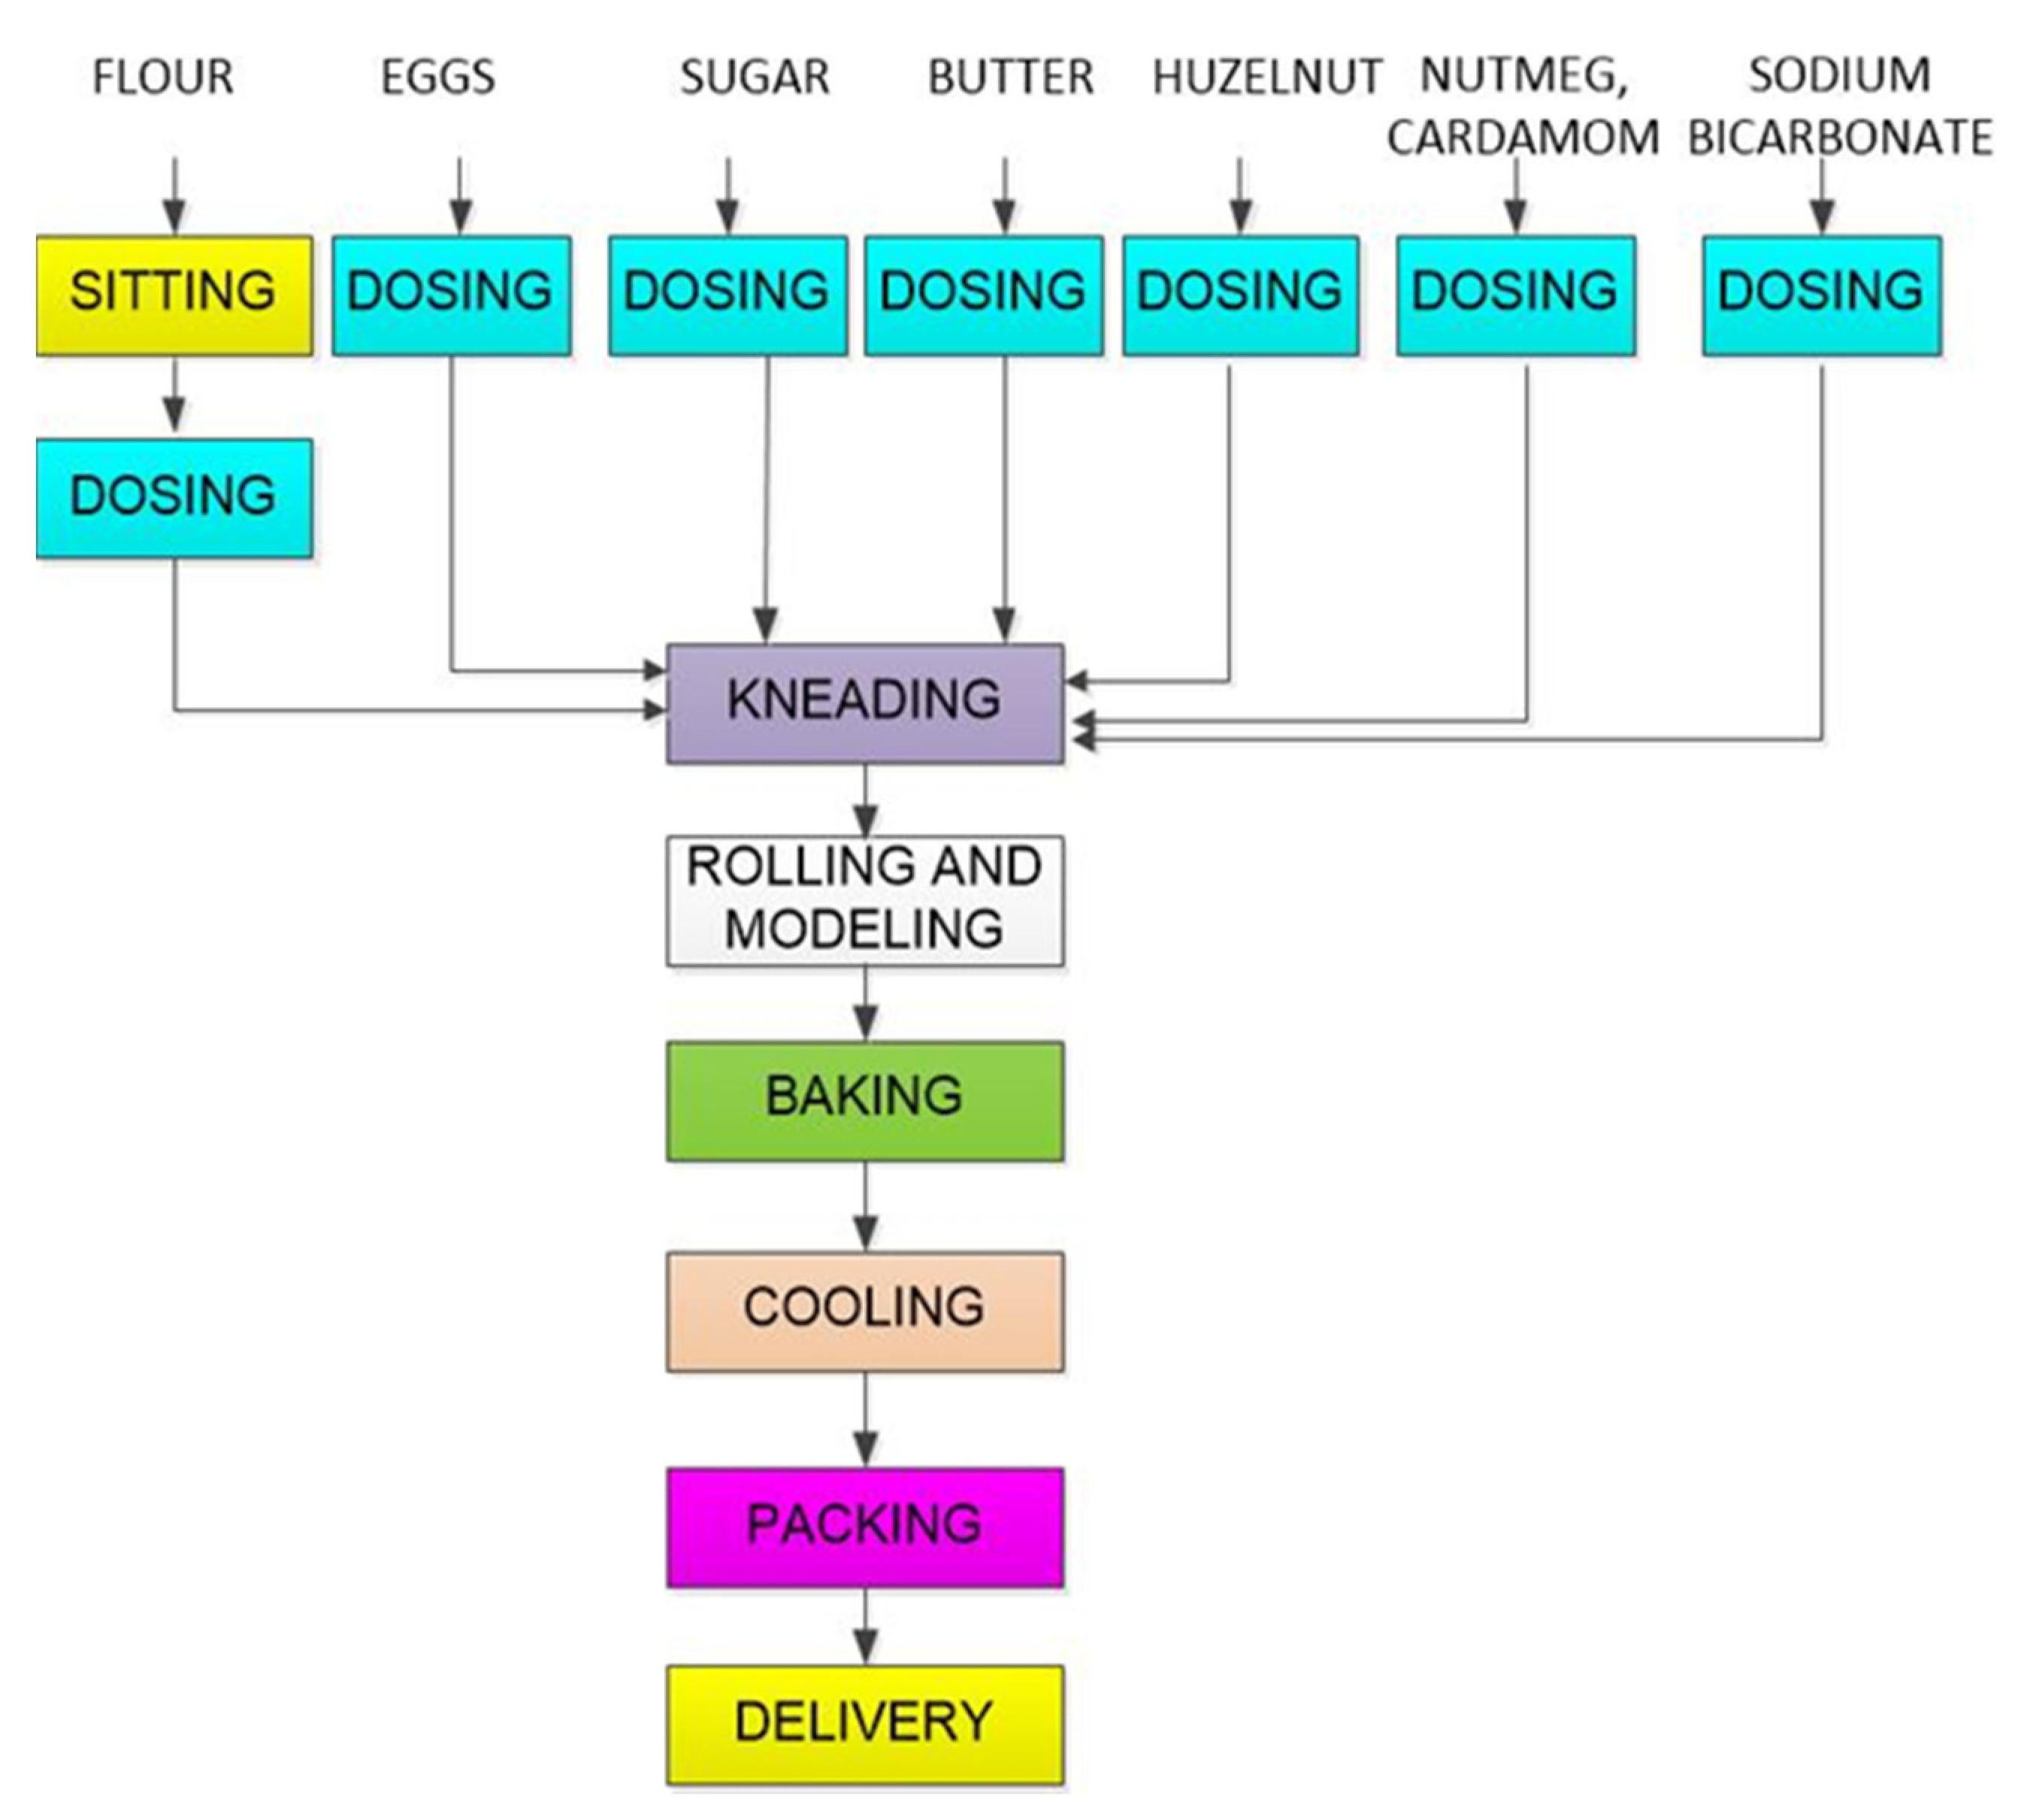
2.5. Preparation of Biscuits, Raw Materials, Recipes, and Baking Conditions

The hazelnut flour was obtained from hazelnut fruits (Corylus avellana L.) sample C5, because out of all the samples analyzed, this type of hazelnut yielded the best results. The hazelnut fruits were initially oven-dried at 40 °C (final moisture content 2%) using POL-EKO-APARATURA (Wodzislaw, Poland) and finely ground with robot-coupe Blixer 3 B (Montceau-en-Bourgagne, France). With the exception of hazelnut flour, all the ingredients were purchased from the supermarket.
The biscuits were produced to the recipe: 250 g white wheat flour, an egg, 150 g soft butter, 75 g powdered sugar, 3 g nutmeg, 3 g cardamom, a teaspoon of baking soda; the total weight of the dough was 615 g. The biscuits were obtained by replacing the commercial white wheat flour (Boromir, Rm. Vâlcea, Romania) with different proportions (5, 10, 15 g/100 g) of hazelnut flour obtained as described above. For each recipe, three batches were created on the same day. This resulted in four types of biscuit: simple (control sample), with the addition of nuts in the proportion of 5, 10 and 15%. Figure 2 shows the technological scheme for obtaining biscuits. Four biscuit samples (Figure 3) were obtained: CB-control (control biscuits), HB—5% (biscuits with 5% hazelnuts), HB—10% (biscuits with 10% hazelnuts), and HB—15% (biscuits with 15% hazelnuts).
The ingredients were mixed (Maxima Planetary Mixer Model: Mpm 7, Nijver-heidsweg, Rp Mijdrecht, Netherlands) for 9 min at intermediate speed. The resulting dough was kept at 4 °C for 60 min, rolled by hand using a rolling pin to a thickness of 0.5 cm, cut into circular shapes (4 cm in diameter), baked (180 °C for 20 min) in an Esmach oven (1200 W, 50 Hz, Grisignano, Italy), and then stored in polypropylene bags until further analysis.

2.6. Proximate Composition of Biscuits

The proximate composition of biscuits was assessed according to ISO methods: moisture SR 91/2007 pct.10, protein SR EN ISO 8968-1:2014; total lipid SR 91:2007 pct.14.4; mineral substances SR ISO 2171/2010, sugar SR ISO 91-2007 [32]. The carbohydrate content (%) was calculated as the difference between 100 and the sum of the following fractions: lipids, proteins, ash, fiber, and moisture.
The caloric intake, also known as the energy value, is calculated by summing the caloric intake produced by individual nutrients (lipids, carbohydrates, and proteins) by taking into account the following correlations: 1 g lipids = 9 kcal, 1 g protein = 4 kcal, 1 g carbohydrates = 4 kcal.

2.7. Total Polyphenol Content of Biscuits

Total polyphenols from biscuits were detected using the Folin-Ciocalteu method [33]. The polyphenols from biscuits samples were extracted in an ethanolic solution 70% (v/v) (SC CHIMREACTIV SRL, Bucharest, Romania). Briefly, 1 g of each sample was ground and treated with solvent to a volume of 10 mL; the mixture was stirred for 60 min and filtered. The ethanolic extract (0.5 mL) was treated with Folin-Ciocalteu reagent (Sigma-Aldrich Chemie GmbH, München, Germany) (1.25 mL) diluted 1:10 (v/v) with distilled water. The samples were kept at room temperature for 5 min and further treated with 1 mL Na2CO3 60 g/L (Geyer GmbH, Renningen, Germany). After incubation (INB500 thermostat, Memmert GmbH, Schwabach, Germany) at 50 °C for 30 min, the absorbance was measured at 750 nm using a UV-VIS spectrophotometer (Specord 205; Analytik Jena AG, Jena, Germany). The calibration curve was obtained using gallic acid (Sigma-Aldrich Chemie GmbH, München, Germany) as standard (concentration interval: 5–250 μg/mL). Results were expressed as mg GAE/g raw propolis.

2.8. Determination of Fatty Acids Composition of Biscuits Using GC–MS

Fatty acids composition was detected after sample derivatization to obtain methyl esters (FAMEs). For this, 0.1 g of the sample was treated with 3 mL of 20% boron trifluoride (BF3) methanolic solution (Merck KGaA, Darmstadt, Germany). Derivatization was performed for one hour at 80 °C in an ultrasonic bath. After cooling, 2.5 mL of 10% sodium chloride solution was added and the methyl esters were extracted into 2 mL of hexane; the organic layer was separated by centrifugation at 3000 rpm for 15 min and the esters from hexane fraction (1 μL) were identified using GCMS-QP2010 PLUS (Shimadzu, Kyoto, Japan) equipped with an AT-WAX column (30 m × 0.32 mm × 1 μm). The flow rate of the carrier gas (helium) was 1 mL/min. The separation conditions were: initial column temperature, 140 °C for 10 min, followed by a gradient of 7 °C/min to 250 °C, and the temperature was then maintained 10 min (the total analysis time of a sample was 35.71 min). The splitting ratio was 1:10, and the injection port temperature was set at 250 °C. The temperature of the ion source and the GC–MS interface was 210 °C and 255 °C, respectively. Methyl esters were identified using the NIST 05 spectrum library, and quantification was performed by the area standardization method. The percentage of the various lipid compounds was determined by relating the peak area corresponding to a given compound to the total area of all peaks in the chromatogram [34]. Total saturated fatty acids (SFA), monounsaturated fatty acids (MUFA), polyunsaturated fatty acids (PUFA), and total unsaturated fatty acids (UFA) were calculated.
Saturated fatty acids (SFA) were calculated based on the sum of C4:0, C6:0, C8:0, C10:0, C12:0, C14:0, C15:0, C16:0, C17:0, and C18:0; monounsaturated fatty acids (MUFA) were calculated as the sum of C10:1, C16:1, and C18:1; and polyunsaturated fatty acids (PUFA) were calculated as the sum of C18:2, C18:3, and C20:4. Unsaturated fatty acids (UFA) were calculated as sum of MUFA and PUFA.

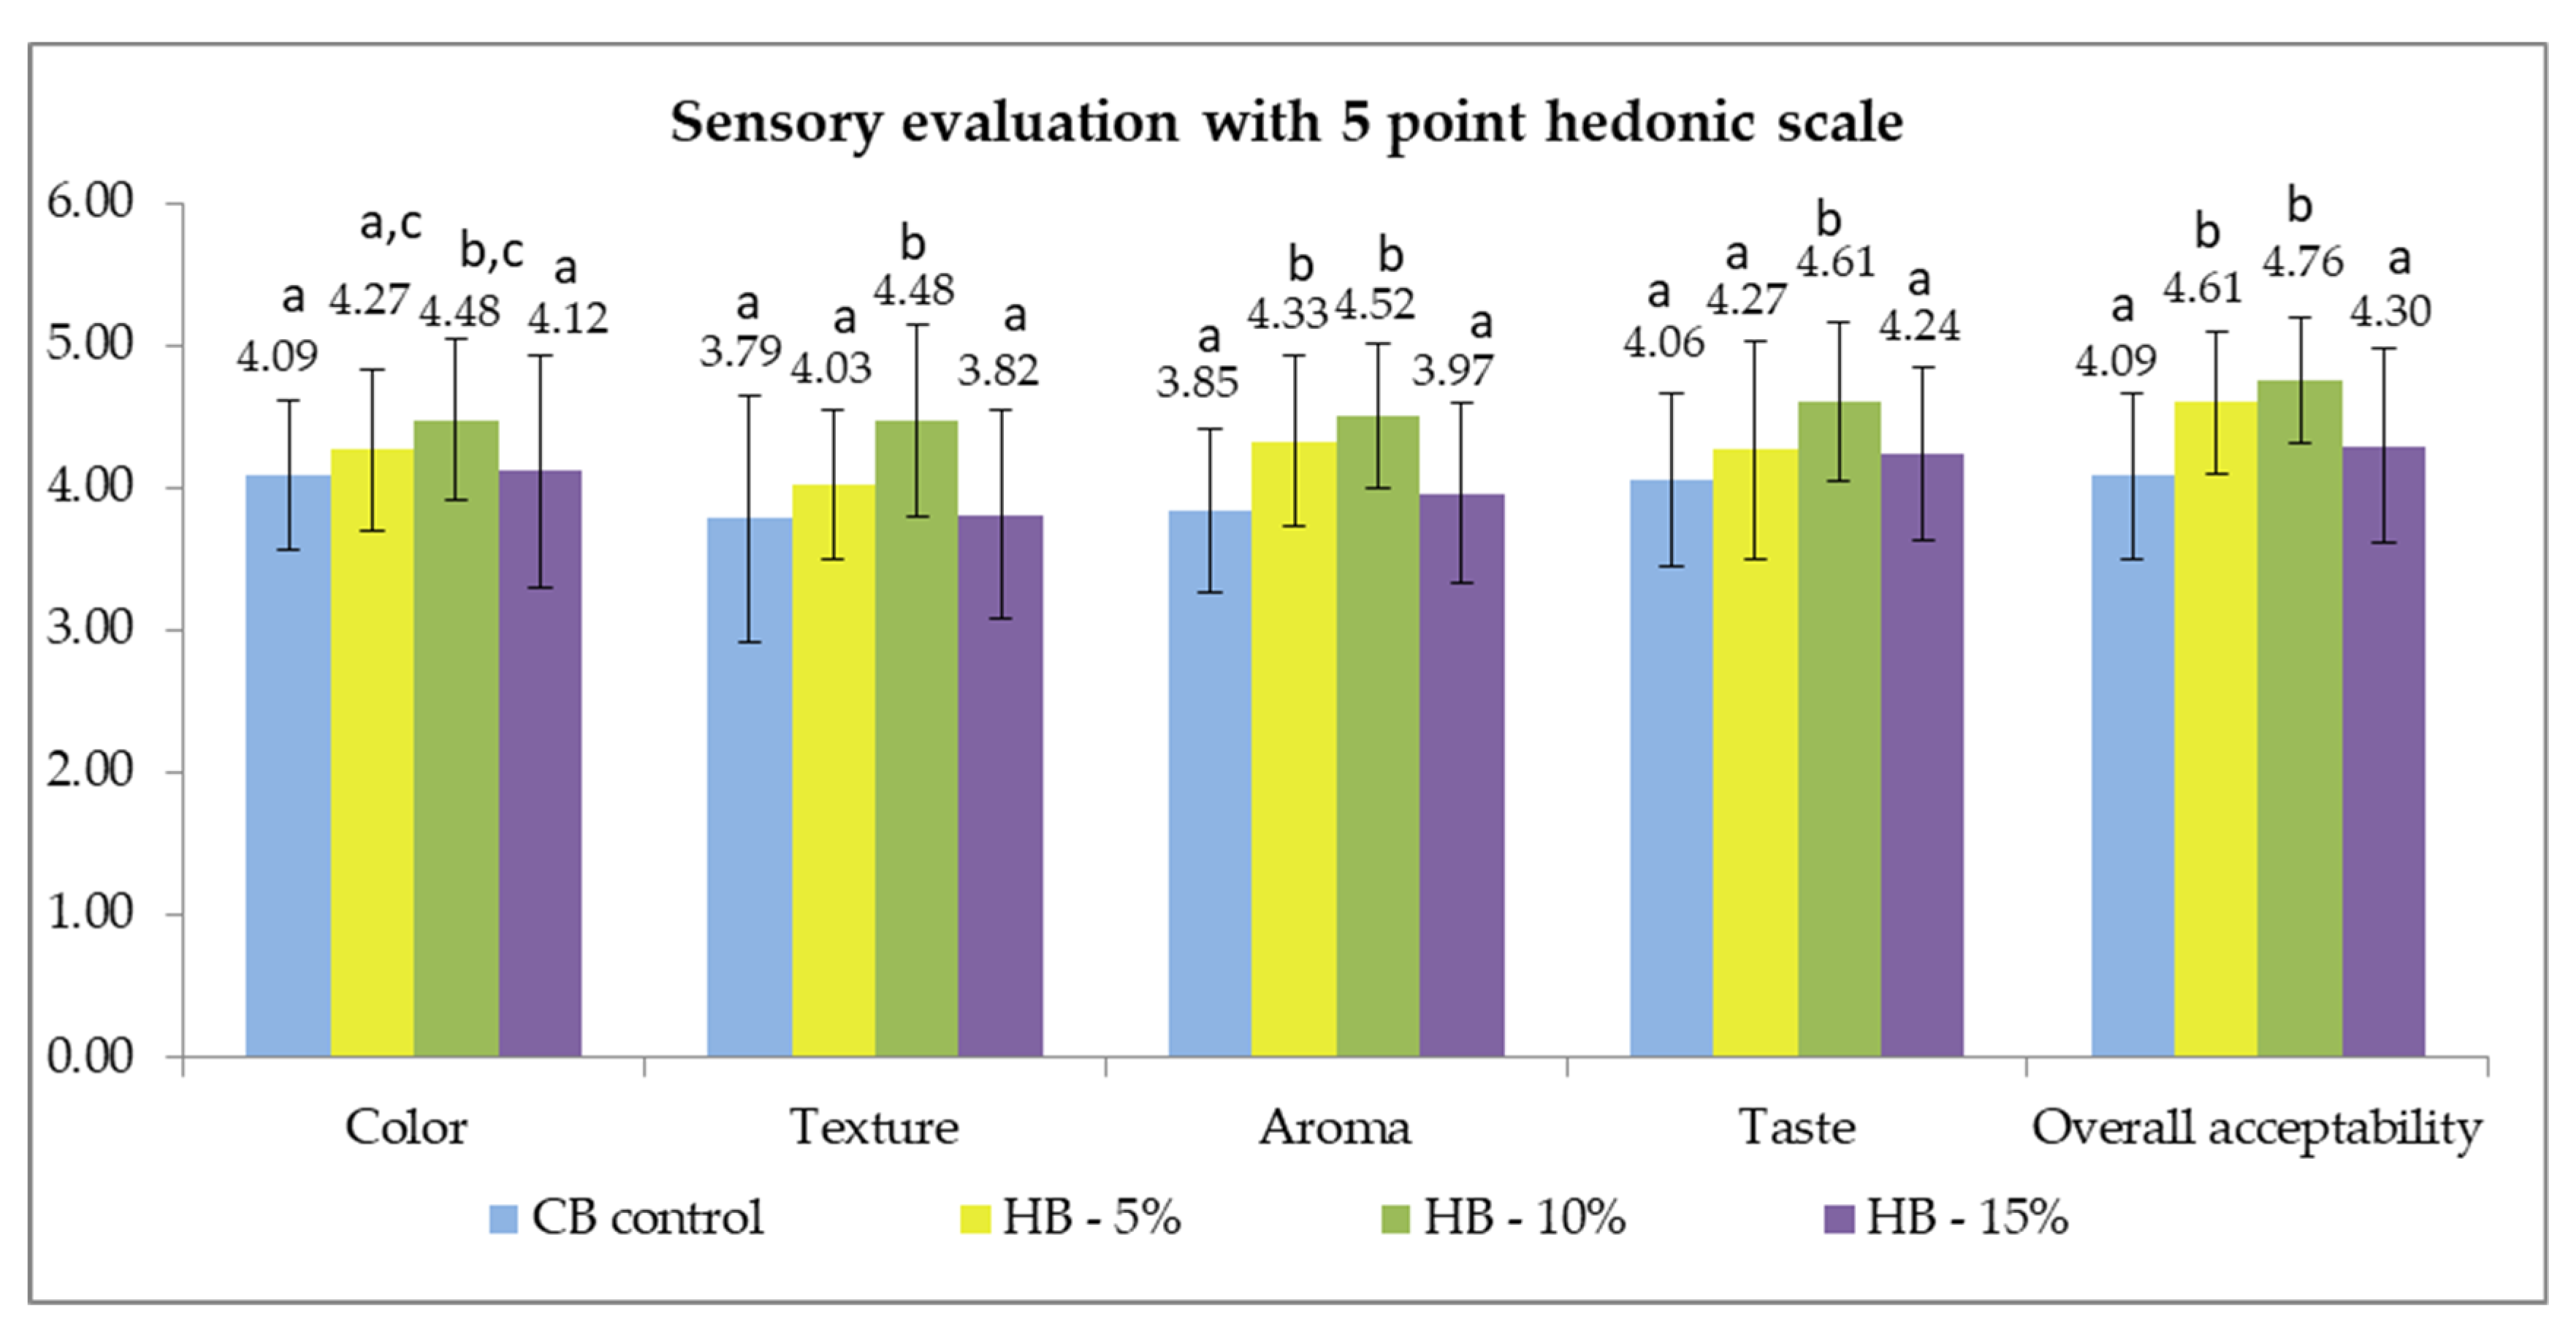
2.9. Sensorial Analysis of Biscuits

Four biscuit samples, CB–control (control biscuits), HB—5% (biscuits with 5% hazelnuts), HB—10% (biscuits with 10% hazelnuts), and HB—15% (biscuits with 15% hazelnuts), were evaluated by a panel consisting of 33 assessors (15 males and 18 females), non-smokers, between the ages of 20 and 45, without known cases of food allergies. The samples were presented once at a time to each panelist in cardboard plates with two-digit characters. For this assessment, a five-point hedonic scale was used [35] as follows: 1 = extremely dislike; 2 = slightly dislike; 3 = neither like nor dislike; 4 = slightly like; 5 = extremely like. Panelists were asked to evaluate the sensory attributes of the coded sample, including color, consistency, flavor, taste, and overall acceptance based on their liking degree (five point hedonic scale): 5 = like extremely; 4 = like slightly; 3 = neither like nor dislike; 2 = dislike slightly; 1 = dislike extremely [36,37].
The ranges of score and acceptability level were as follows: 1.00–1.49 = Not Acceptable (NA); 1.5–2.49 = Slightly Acceptable (SA); 2.50–3.49 = Moderately Acceptable (MA); 3.5–4.49 = Acceptable (A); 4.5–5.00 = Highly Acceptable (HA). Panelists were asked to rinse their mouths with still water after assessing each sample. All 33 panelists were trained according to ISO 6658:2017 [35].

2.10. Statistical Analysis

All determinations were performed in triplicate and the results are reported as mean values ± standard deviation (SD). Differences between means were analyzed with a one-way ANOVA, followed by multiple comparison analysis using the t-test (two-sample assuming equal variances). Differences were considered significant for p-values < 0.05. Correlations between variables were determined using SPSS 20. For total polyphenols content, all replicates’ mean values and standard deviations were calculated using GraphPad Prism (v.5.0 software, Manufacture, San Diego, CA, USA).

3. Results and Discussion

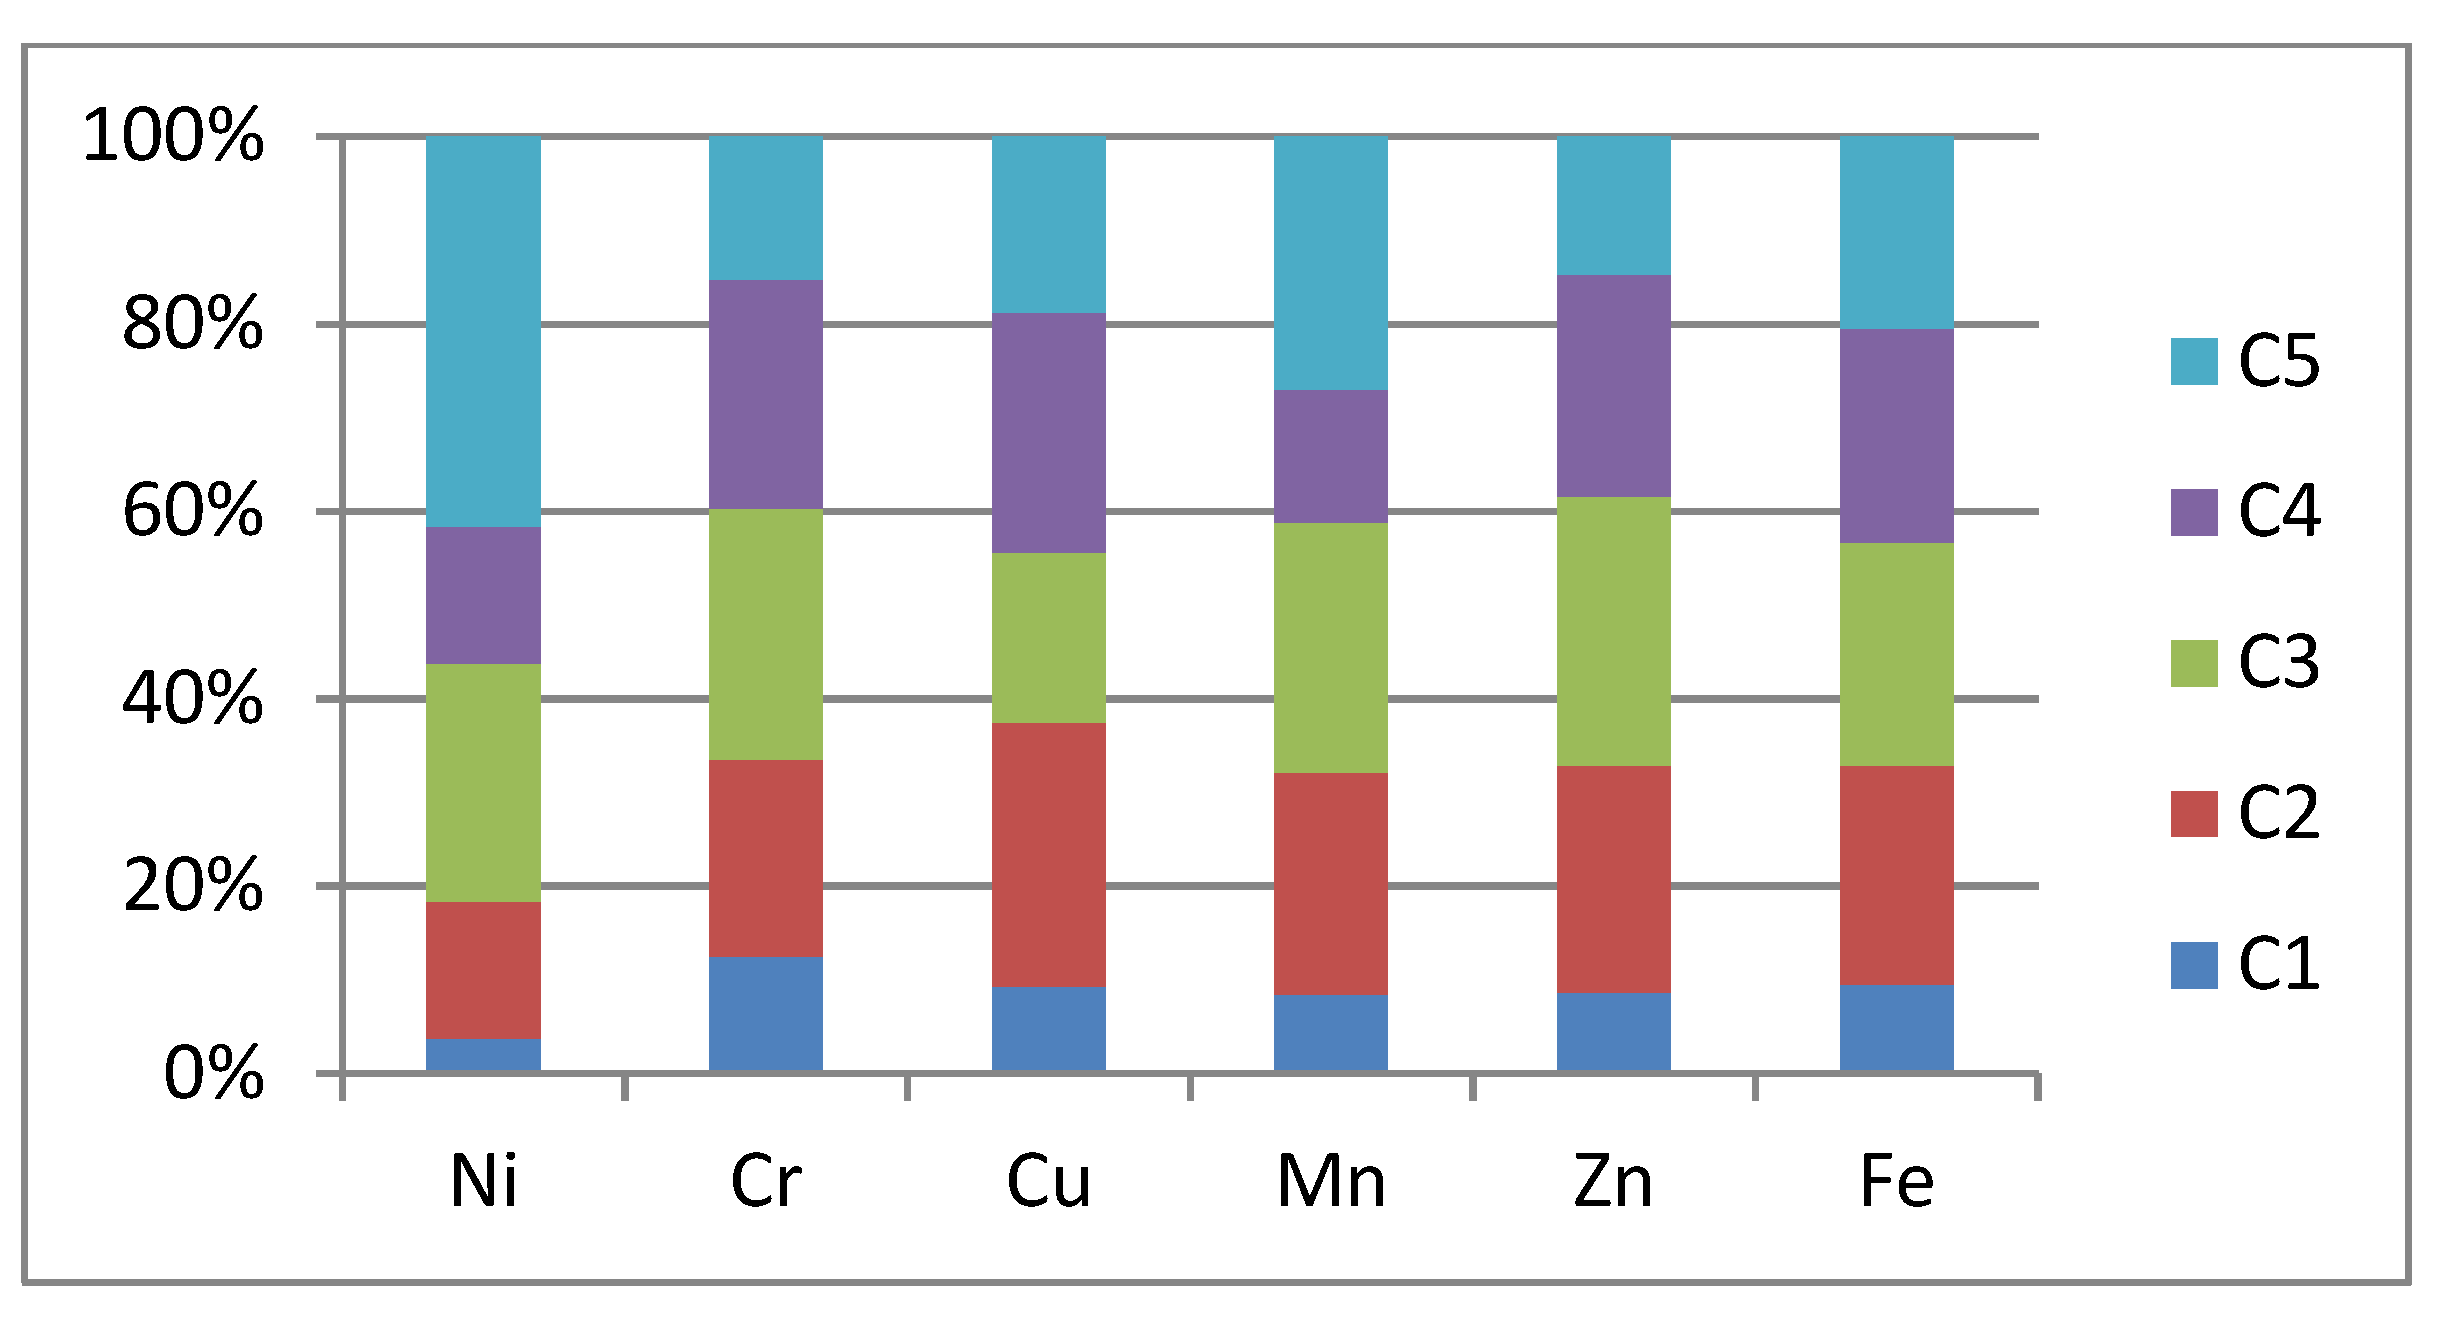
3.1. Ash and Metals Content

Average values (calculated using ANOVA) of ash content, Ni, Cr, Cu, Mn, Zn, and Fe, determined in samples C1–C5, are presented in Table 3; the percentage distribution of metals in the analyzed samples is shown in Figure 4. It can be observed that the ash content ranged between 2.31–2.63%, values comparable to those reported by Alasalvar et al. [38], who identified an ash content between 2.0–2.3% in hazelnuts, and Tunçil [39], who identified a 2.57% ash content in hazelnuts. The highest values were determined in hazelnut samples from the Lugoj area (C5).
The average values of the determined metal content presented in Table 3 indicate that iron and zinc were the most abundant metals, with copper the least abundant.
Copper is an essential microelement, vital to the health of living organisms. In the human body, copper, alongside iron, participates in the formation of red blood cells and in maintaining the health of the blood vessels, nerves, bones and immune system. The copper content determined in the samples analyzed ranged from 47.67 to 100.38 µg·g−1. The highest values were determined in sample C2 (Timisoara), four times higher than the values reported by Chung et al. [40]. Hazelnuts can be considered as a food source of copper. However, due to its toxic effect over a certain limit, the control of the amount of copper ingested in the daily diet is very important [41,42]. In 2006, The Institute of Medicine established a dietary intake for copper for adults of around 900 µg/day [43].
The zinc content determined in C1–C5 hazelnut samples was comparable to that determined by Cevik et al. [44], but higher than that determined by Özkutlu et al. [45] and Dobhal et al. [46], being in the range 96.93–123.23 μg·g−1. The highest values were determined in samples C2, harvested from the Timisoara area.
Zinc is an essential microelement in the human body, second only to Fe in that its presence in the body is achieved exclusively by ingestion. Zinc deficiency in the human body occurs as a result of inadequate zinc absorption, an increase in the amount of Zn eliminated from the body, or an increase in the Zn requirement. The maximum admissible zinc dose was set at 300 µg·kg−1 body weight·day−1 [47].
Although iron is an abundant element on Earth, it forms oxides in contact with atmospheric air that are hardly soluble; thus, it is not readily absorbed by the body. Among the elements determined in this study, iron had the highest concentration. The total iron concentration in hazelnut samples ranged between 88.39 and 146.98 µg·g−1, values comparable to those determined by Cevik et al., 2009 [44]. The highest values were determined in sample C5 harvested in the Lugoj area. Iron is an essential element for all living organisms and is involved in a wide variety of metabolic processes, including oxygen transport and DNA synthesis.
Manganese is an essential nutrient for the proper functioning of the human body, involved in bone formation, amino acids, and cholesterol carbohydrate metabolism. For adults, the appropriate dose is 2–2.3 mg/day (dietary reference intake) [48]. The manganese content determined in samples C1–C5 was in the range 26.00–87.78 µg·g−1; the highest values were recorded in sample C5 taken from Timisoara. These values are similar to those reported by Özkutlu et al. [45], but lower than those reported by Cevik et al. [44].
The total chromium content determined in the analyzed hazelnut samples was in the range 1.87–2.84 µg−1, about 100 times higher than the values reported by Ozkutlu et al. [45] and comparable with values reported by Cabrera et al. [49]. The highest values were observed in hazelnut samples taken from Mosnita Veche (C1).
Cr+3 is biologically active and found in food, while Cr+6 is a toxic form, which results from industrial pollution. USEPA [50] established a maximum daily intake rate of 3 µg·kg−1 of body weight/day. In human tissues, Cr content decreases with age, except in the lungs, where chromium is accumulated.
The main source of nickel for living organisms is food, of which a major contribution comes from plants. Due to the fact that the nickel content in the soil can vary considerably from place to place, the amount of nickel from plants consumed as food can also vary from place to place [51]. The highest values of nickel content were determined in the samples collected in Lugoj (C5) (29.76–35.16 µg·g−1, with a mean value of 32.19 µg·g−1), and were three or more times higher than the others. The lowest content of nickel (4.62–5.46 µg·g−1, with a mean value of 4.87 µg·g−1) was established in C1 samples (hazelnuts from Mosnita Veche). It is known that the consumption of even small amounts of nickel triggers strong allergies, more so than any other element. In February 2012, the EFSA set a safe level, known as the tolerable daily intake (TDI), of 2.8 µg Ni·kg−1 of body weight daily. Excessive consumption of hazelnuts, more than 100 g per day, can trigger allergies and should be avoided [52].
According to the obtained results, the hazelnut sample C5 from Lugoj area ensures an optimal intake of microelements, especially Fe, Zn, and Cu.
As we have shown above, as no herbicides or other chemicals are used, it can be considered that the hazelnuts used in the study come from organic farming; in view of this and in conjunction with the spontaneous growing of hazelnut shrubs, the possible negative impact on the agricultural systems of the region is non-existent.
The importance of ecological and soil factors on the quality of hazelnut production is also demonstrated by research in the Black Sea region of Turkey, where some of the highest quality hazelnuts in the world are produced [53].
Organic farming involves a ban on the use of herbicides, and in the case of hazelnut production, an alternative is to cut the grass 2–3 times a year and especially before harvesting [54], a practice used in the case of the shrubs from which samples were collected.
However, the agronomic conditions of the different samples have impacted their composition, through differences in site conditions, i.e., soil, field slope, aspect, elevation, and competition from other species of trees and shrubs in the vicinity. The competition leads to different pruning and growth of shrub branches. In this regard, some research shows that the highest quality of hazelnuts and the highest yield was obtained from shrubs with a maximum of six branches [55]. Other researchers also discuss the influence of field conditions on hazelnut specimens, stating that what needs to be done to identify and differentiate hazelnut genotypes with superior characteristics is to perform some morpho-agronomic assessments in field conditions [56].

3.2. Crude Protein and Amino Acid Content

From the data presented in Table 4, it is observed that the crude protein (CP) content ranged between 16.33–22.31%, values comparable to those reported by Savage and Mc Neil [57]. The highest values were determined in hazelnut samples from the Lugoj area (C5).
Eight essential and nonessential AA (Arginine–Arg, Serine–Ser, Glycine–Gly, Glutamic acid–Glu, Aspartic acid–Asp, Proline–Pro, Phenylalanine–Phe, and Lysine–Lys) were analyzed in hazelnut samples. The major analyzed amino acid was Arg (mean value 0.683 g/100 g), followed by Phe (0.415 g/100 g), Ser (0.277 g/100 g), Glu (0.188 g/100 g), Asp (0.133 g/100 g), Pro (0.038 g/100 g), and Lys (0.031 g/100 g).
Arginine represents a conditionally essential amino acid that may be required depending on the health status or life cycle of the individual. Arg is essential for infants and growing children. Arg was predominant in all cultivars; the highest value was recorded in C2 (0.931 g/100 g) and the lowest in C4 (0.365 g/100 g). In respect to nonessential Asp content, C1 (0.249 g/100 g) had the highest value and C5 (0.012 g/100 g) contained trace amounts. The values obtained in our samples were lower than the ones reported by Gunes et al. [58] in different hazelnut varieties.
Serine plays an important role in the catalytic function of many enzymes. Serine content was the highest in C5 (0.461 g/100 g) and the lowest in C4 (0.210 g/100 g). Glutamic acid is a nonessential amino acid that has protective effects on the heart muscle and supports brain function. Glu content in hazelnut samples ranged between 0.042 and 0.252 g/100 g; the highest value was obtained in C5. Gly was found at trace quantities (0.026 g/100 g). Pro content ranged from 0.013 g/100 g (C1) to 0.127 g/100 (C4). Glu varied between 0.142 g/100 g in C2 and 0.250 g/100 g in C4. Lower values (between 7.29–30.5 mg/100 g dry weight) were reported by Silva et al. [15] in hazelnut cultivars from Portugal.
Koksal et al. [59] reported similar AA patterns in different hazelnut Turkish varieties. Additionally, Alasalvar et al. [4], showed that the major amino acids in Corylus avellana L. cultivars were glutamic acid, arginine, and aspartic acid. The same AA profile was reported by Xu and Hanna [60] in Nebraska hybrid hazelnut meal.
Regarding the essential amino acids analyzed in hazelnut samples, Phe content ranged from 0.249 g/100 g (C1) to 0.648 g/100 g (C3). Phenylalanine is an essential amino acid that id required to assure normal anabolism. Phenylalanine is used in the manufacture of food and drink products for its analgesic and antidepressant functions, while lysine is a precursor compound of arginine and histidine [61]. Lysine content was between 0.013 g/100 g (C4) and 0.081 g/100 g (C5). Similar values for Phe content but higher for Lys content were reported by Gunes et al. [58]. Other authors highlighted that defatted hazelnut flour is an attractive nutritional alternative for the amino acid supplementation of cereals and legumes [62]. Hazelnut meal was evaluated as an alternative protein source to fishmeal, as up to 40% could be included in diets for gilthead sea bream juveniles without adverse effects on growth rate or body composition [63].

3.3. Correlation between Analyzed Parameters

Analyzing the data presented in Table 5, we found significant positive correlations between Fe–Mn and Fe–Cu and Mn–Ni (p < 0.01) and Fe–Ni, Mn–Cu.
The Pearson correlation coefficient matrix between the CP content and the eight amino acids determinations shown in Table 6 indicates significant positive correlations (p < 0.01) between CP–Ly and CP–Glu.Ac, and significant negative correlation (p < 0.01) CP–Fen, respectively. Analyzing the relationship between metal and amino acid content identified positive correlations between Cr–Gly, Cr–Ac.Asp, Mn–Ly, Zn–Arg, Fe–Ly (p < 0.01), and between Ni–Se, Ni–Ly, Cr–Ly, Cu–Glu.Ac, Mn–Arg, Mn–Se, Fe–Ac.Glu (p < 0.05), respectively.
Significant negative correlations were observed between Ni–Fen, Cr–Se, Cu–Fen, Mn–Pro, Zn–Pro and Fe–Fen (p < 0.01), Mn–Ac.Asp, Zn–Ac.Asp (p < 0.05), respectively.

3.4. The Proximate Composition of Biscuits

In order to evaluate the nutritional properties and the possibility of their use as a source of protein, hazelnut biscuits (HB) with different percentages of hazelnut flour were analyzed. Table 7 presents the proximate composition of biscuits. In the HB manufacturing recipe, the analyzed experimental variant C1 was used, which presented the highest protein content (21.34%). Control biscuits (CB) are the biscuits obtained from wheat flour without the addition of hazelnuts.
From the experimental results, it can be observed that the water content is between 6.33 ± 0.15 g/100 g and 6.80 ± 0.08 g/100 g, with significant differences (p > 0.05) between the samples of biscuits containing added hazelnuts and the control sample. The mineral content of the samples analyzed was between 1.24 ± 0.02 g/100 g and 1.44 ± 0.03 g/100 g, with significant differences (p > 0.05) between the samples of biscuits containing added hazelnuts and the control sample. The protein content of HBs was higher compared to that of CB, and increased as the proportion of added hazelnuts increased; there were significant differences (p > 0.05) between the protein values of the four types of biscuit. However, the lipid fraction was higher in the HB 5% (12.97 ± 0.19%), HB 10% (15.33 ± 0.30%), HB 15% (17.70 ± 0.23%) biscuits compared to the CB (10.60 ± 0.34%). The total carbohydrate content of hazelnut biscuits was 72.02% (HB5%), 64.54 (HB10%), and 59.73% (HB15%); that of hazelnut CB biscuits was 72.26%. The energy value calculated based on the lipid, protein, and carbohydrate intake provided by the constituent raw materials varies in the order of HB 15% > HB 10% > HB 5% > CB. The reference value varies similarly to the energy value.
The total lipid, protein, and ash contents of natural and roasted hazelnuts were in good agreement with the results reported in previous studies [36,60]. Alasalvar et al. [4] highlighted that higher amounts of extracted lipids were detected in roasted hazelnut compared to fresh samples. This slight difference could be attributed to simultaneous occurrence of two different factors; (1) the presence of the skin in natural hazelnuts, and (2) the temperature applied during the roasting process may possibly have caused cell destruction and protein denaturation, which could improve lipid extractability [36]. Similar to the total lipid content, the differences in ash and protein contents of natural and roasted hazelnuts were insignificant (p > 0.05).

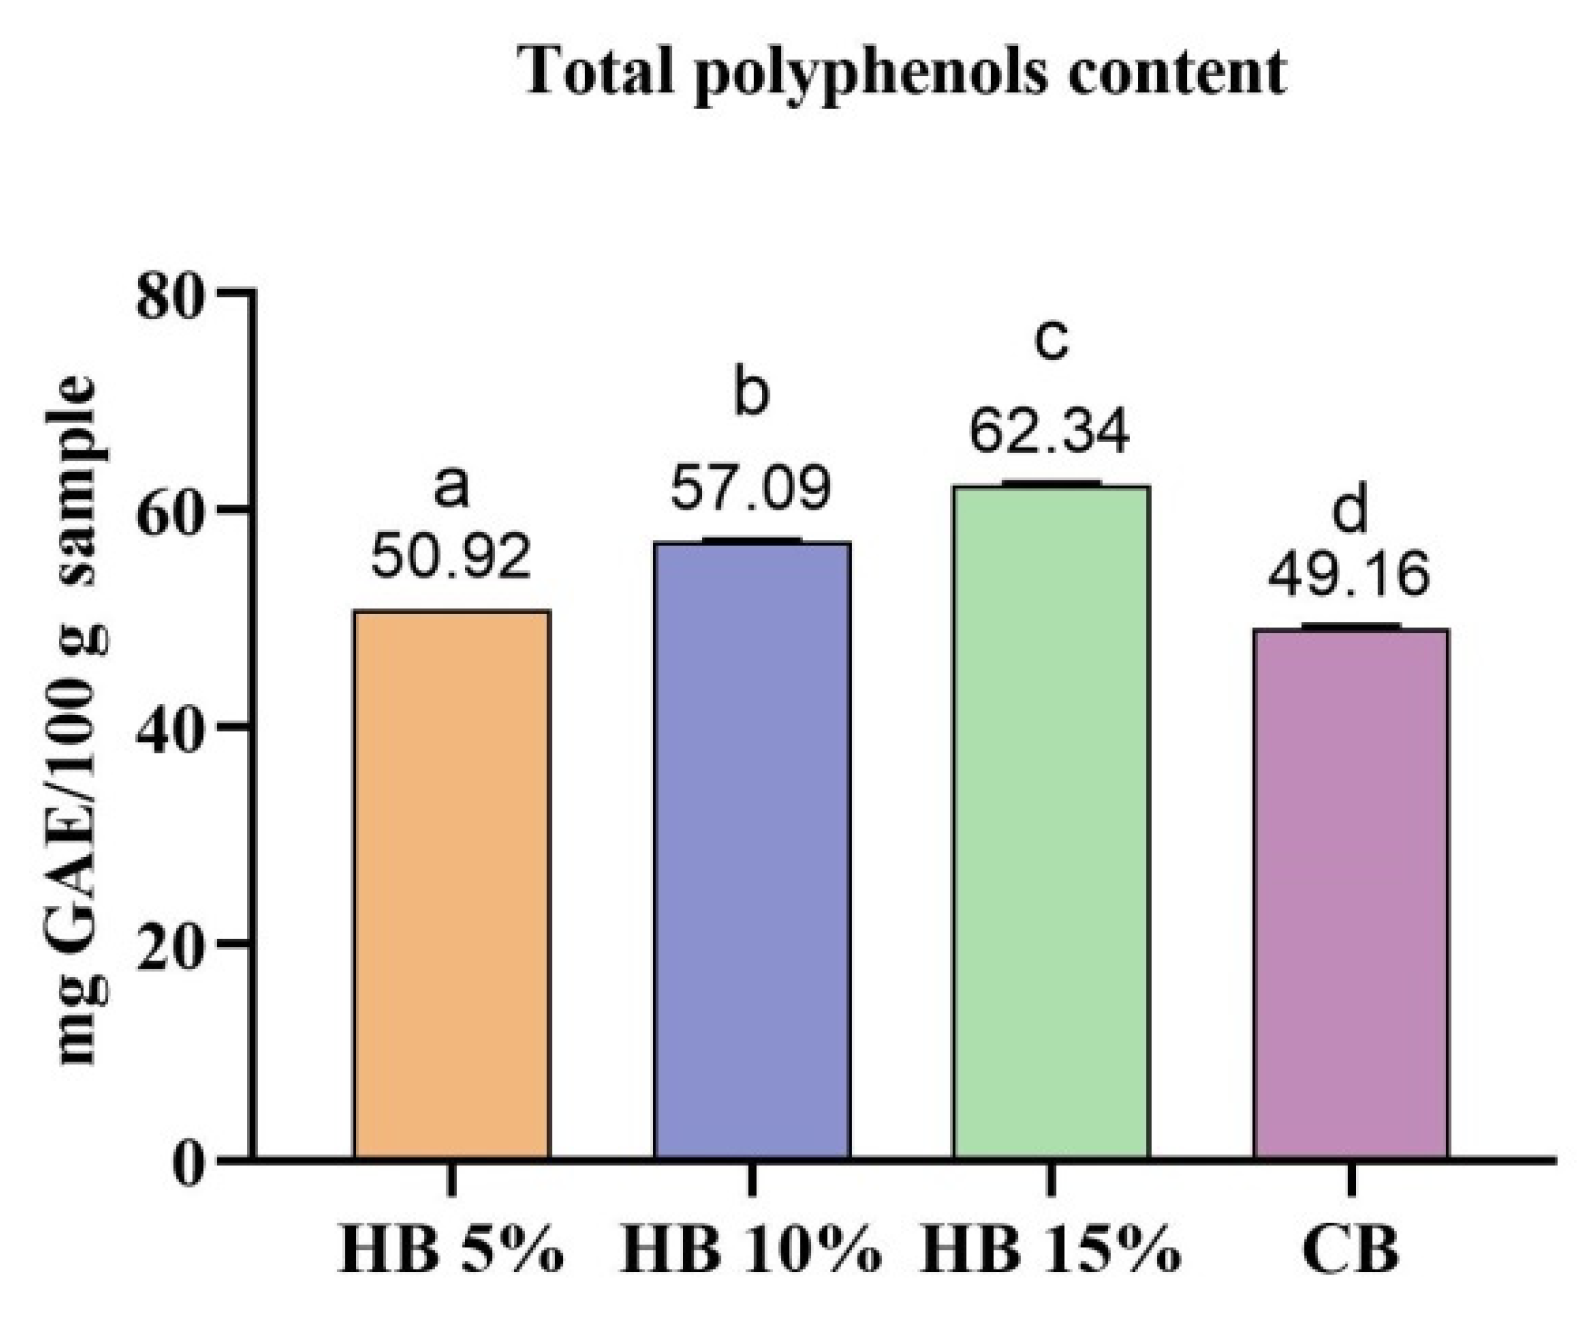
3.5. Polyphenols Composition of Biscuits

The results regarding the TP content of the biscuit samples analyzed are shown in Figure 5 and are expressed as gallic acid equivalents (GAE).
From the analysis of the resulting data it can be seen that the content of polyphenols increases with the increased hazelnut flour content in the sample. Thus, it can be observed that the highest TP content is found in HB 15% (62.34 ± 0.08 mg GAE/100 g sample) while the lowest value was recorded for the control sample CB (49.16 ± 0.08 mg GAE/100 g); this is due to the high content of polyphenols in hazelnuts [64].
Similar values were reported by Pop et al. [34] for walnut oilcake, namely 136.33 mg GAE/100 g and by Bakkalbasi et al. [64] for walnut press-cake, of 58.207 mg GAE/100 g.

3.6. Fatty Acids Composition of Biscuits

GC–MS identified a total of 20 fatty acids in the analyzed samples, of which 11 were saturated fatty acids, 3 were monounsaturated fatty acids, and 3 were polyunsaturated fatty acids (Table 8).
Regarding the data obtained, it can be seen that the samples of biscuits containing hazelnut flour had a lower content of saturated fatty acids compared to the control sample (64.396%); this content was inversely proportional to the proportion of hazelnut flour added (59.649% for HB 5%, 58.608% for HB 10% and 57.862% for HB15%). Regarding the content of unsaturated fatty acids, their proportion increased with the increase in the content of added hazelnut flour (34.023% for CB, 38.656% for HB 5%, 40.125% for HB 10%, and 40.885% for HB 15%). This was due to the low SFA content (4–16%) of walnuts and the high MUFA (especially oleic acid) and PUFA content, namely omega-6 and omega-3 fatty acids (linoleic acid (C18:2, n − 6), linolenic acid (C18:3, n − 3) and arachidonic acid, C20:4, n − 6) [65]. The high content of UFA was also reported by Pop et al. [34] for walnut oilcake and by Bakkalbasi et al. [64] for walnut press-cake.

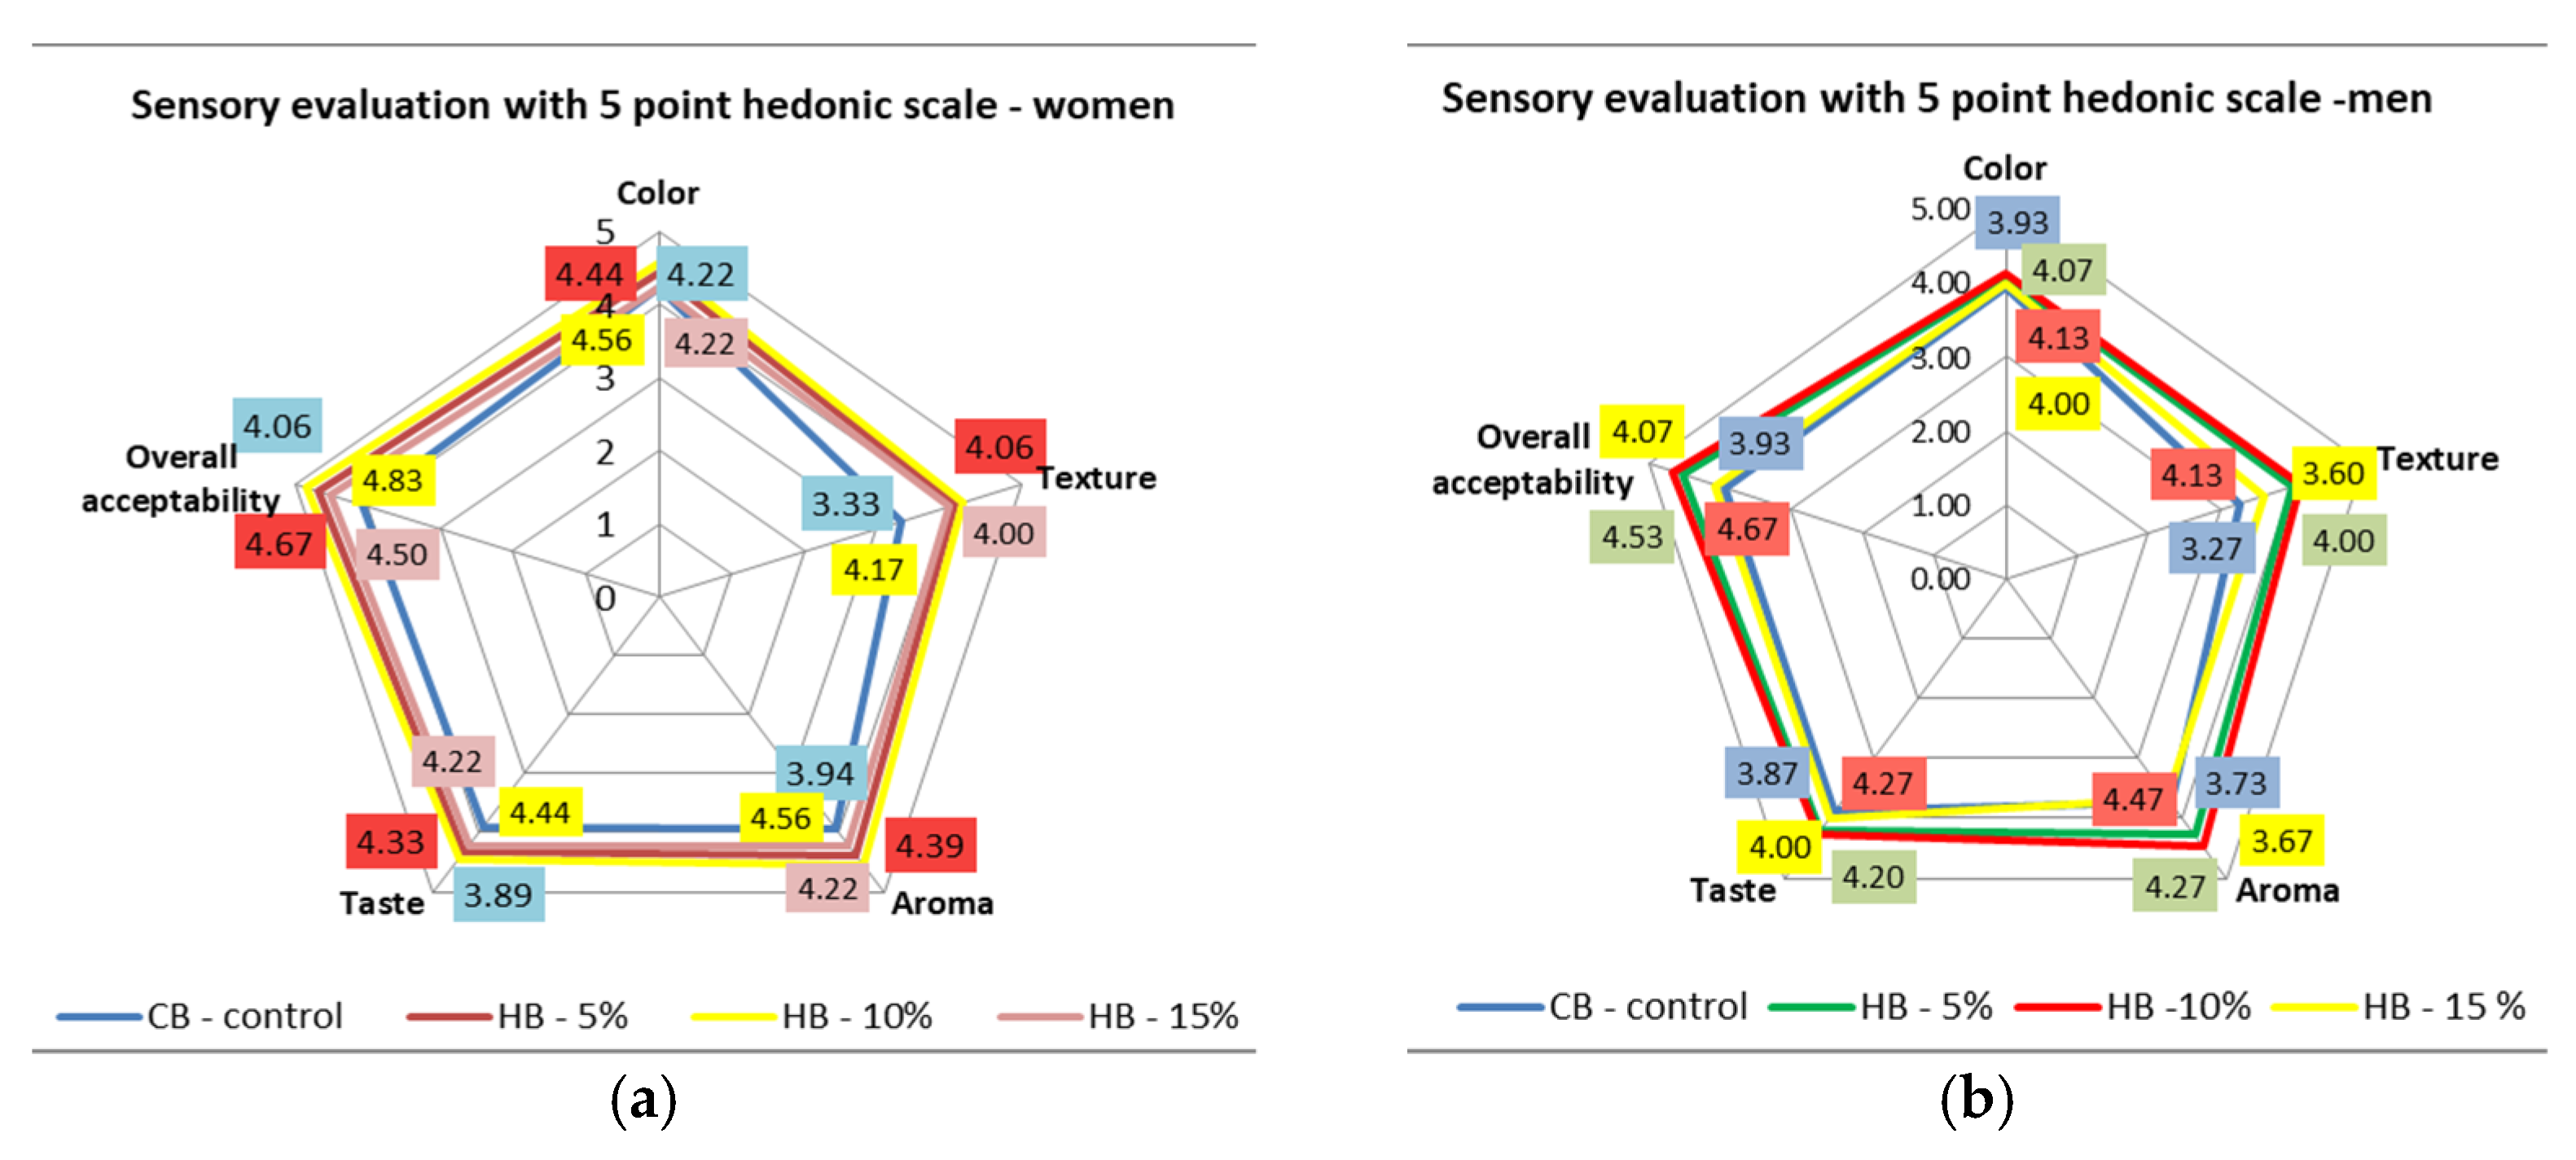
3.7. Sensorial Analysis of Biscuits

Sensory evaluation of the biscuits was carried out in order to assess consumer acceptability. Figure 6 indicates the mean scores for the sensory attributes (color, texture, aroma, taste, and overall acceptability) of the studied biscuits: CB–control (control biscuits), HB—5% (biscuits with 5% hazelnuts), HB—10% (biscuits with 10% hazelnuts), and HB—15% (biscuits with 15% hazelnuts).
The most highly appreciated was the HB—10% sample, which obtained mean scores of 4.48 for color, 4.48 for texture, 4.52 for aroma, 4.61 for taste, and 4.76 for overall acceptability (Figure 6), falling within the 4.5–5.00 score range which indicates high acceptability (HA). All other samples (CB–control, HB 5% and HB 15%) fell within the 3.5–4.49 level of acceptance (Acceptable–A) for texture, color, aroma, and taste. In terms of overall acceptability, biscuits with 5% hazelnuts were in the highly acceptable class (HA), with a score of 4.61, while CB–control and HB—15% were in the Acceptable (A) class (Figure 6). Similar studies regarding sensory evaluation of biscuits have been carried out by Ho and Latif [66] and Pestorić et al. [36].
Figure 7 indicates the average scores given by female and male panelists to the biscuits tested. All samples were evaluated by women as acceptable, with scores higher than 4 falling into the highly acceptable (HA) class, except texture (3.33), aroma (3.94) and taste (3.89) of control sample, which were in the Acceptable (A) class.
Highly appreciated by women were biscuits with 10% hazelnuts, with the highest score for overall acceptability (4.83) followed by color and aroma (4.56), taste (4.44), and texture (4.17) attributes (Figure 7a). The HB—5% and HB—15% samples were less appreciated by women, compared to the HB—10% sample, and obtained overall acceptability scores of 4.67 and 3.83, respectively. The lowest score for overall acceptability was given to the control sample (4.06) (Figure 7a).
The studied biscuits were less appreciated by men compared with women; the scores obtained for the evaluated attributes fell into the Acceptable (A) class (3.50–4.49). The highest scores were assigned to overall acceptability for HB 10% (4.67) and HB 5% (4.53) (Figure 7b).
Following the sensory evaluation, which highlights consumer acceptance, it can be observed out that the samples with 10% hazelnuts (HB 10%) were highly appreciated by the panelists and the scores placed this sample in the highly acceptable class (HA).

4. Conclusions

Due to their high energy values and pleasant taste, hazelnuts are one type of nut consumed on a large scale, especially in regions favorable to the development of local populations of Corylus avellane L. The rational consumption of hazelnuts to avoid allergies can provide nutritional balance by ensuring the necessary intake of amino acids and metals in the human body.
The obtained results indicate that hazelnuts from the spontaneous flora of Romania are an important source of amino acids and microelements, and represent a sustainable alternative to classical protein matrices. The inclusion of hazelnut flour in biscuit recipes contributes to the increased the functionality of these products, resulting in special polyphenols, greater unsaturated fatty acids content, and improved sensory attributes.
The present study confirms the potential of plant matrices from local spontaneous flora and their use as a food source in the context of the circular and sustainable economy.

Author Contributions

Conceptualization D.S.P., I.R., E.A. and O.A.I.; methodology, D.S.P., I.R., I.C., E.A., A.A.B., I.H., M.B., M.N. and I.P.; validation, E.A., I.R., M.B. and S.R.; data curation, M.V.B. and F.L.C.; writing—original draft preparation, D.S.P., I.R., I.C., E.A. and A.A.B.; writing—review and editing, D.S.P., I.R., I.C., E.A., A.A.B. and I.C.C.; visualization, D.S.P., I.R., I.C., E.A., A.A.B., I.H., O.A.I., M.B., I.C.C., S.R., F.L.C., M.V.B., M.N. and I.P. All authors have read and agreed to the published version of the manuscript.

Funding

This research is published from own funds of the Banat’s University of Agricultural Sciences and Veterinary Medicine “King Michael I of Romania” from Timisoara.

Institutional Review Board Statement

Not applicable.

Informed Consent Statement

Not applicable.

Data Availability Statement

The report of the analyzes performed for the samples in the paper can be found at the Interdisciplinary Research Platform (PCI) belonging to the Banat University of Agricultural Sciences and Veterinary Medicine “King Michael I of Romania” from Timisoara, being registered with number 54c/26 September 2018.

Acknowledgments

We were able to carry out this research with the support of the Interdisciplinary Research Platform belonging to the Banat University of Agricultural Sciences and Veterinary Medicine “King Michael I of Romania” from Timisoara, where the analysis were made.

Conflicts of Interest

The authors declare no conflict of interest.

References

  1. Iordănescu, O.A.; Brădean, D.R.; Blidariu, A. The behavior of some hazelnuts in the south area of Timiș county, in terms of external features of the fruits. Sci. Pap. Hortic. 2014, 58, 39–42. [Google Scholar]
  2. San-Miguel-Ayanz, J.; de Rigo, D.; Caudullo, G.; Houston Durrant, T.; Mauri, A. European Atlas of Forest Tree Species; The Publications Office of the European Union: Luxembourg, 2016. [Google Scholar]
  3. Enescu, C.M.; Houston Durrant, T.; de Rigo, D.; Caudullo, G. Corylus avellana in Europe: Distribution, habitat, usage and threats. In European Atlas of Forest Tree Species; The Publications Office of the European Union: Luxembourg, 2016; pp. 86–87. [Google Scholar]
  4. Alasalvar, C.; Pelvan, E.; Amarowicz, R. Effects of roasting on taste active compounds of Turkish hazelnut varieties (Corylus avellana L.). J. Agric. Food. Chem. 2010, 58, 8674–8679. [Google Scholar] [CrossRef] [PubMed]
  5. The Food and Agriculture Organization (FAO). Available online: http://www.fao.org/faostat/en/#data/QC (accessed on 15 March 2021).
  6. Order 1651/31.10.2000 al Ministerul Apelor Pădurilor și Protectiei Sociale—Privind Normele Tehnice Pentru Evaluarea Volumului de Lemn Destinat Comercializării; Ministerul Apelor Pădurilor și Protectiei Sociale: Bucharest, Romania, 2000.
  7. An, N.; Turp, M.T.; Türkeş, M.; Kurnaz, M.L. Mid-term impact of climate change on hazelnut yield. Agriculture 2020, 10, 159. [Google Scholar] [CrossRef]
  8. Ustaoglu, B.; Karaca, M. The effects of climate change on spatiotemporal changes of hazelnut Corylus avellana cultivation areas in the Black Sea Region Turkey. Appl. Ecol. Environ. Res. 2014, 12, 309–324. [Google Scholar] [CrossRef]
  9. Tuncer, C.; Ecevit, O. Current status of hazelnut pests in Turkey. Acta Hortic. 1997, 445, 545–552. [Google Scholar] [CrossRef]
  10. Tuncer, C.; Saruhan, I.; Akca, I. The insect pest problem affecting hazelnut kernel quality in Turkey. Acta Hortic. 2005, 686, 367–376. [Google Scholar] [CrossRef]
  11. Tuncer, C.; Akça, I.; Saruhan, I. Integrated pest management in Turkish hazelnut orchards. Acta Hortic. 2001, 556, 419–430. [Google Scholar] [CrossRef]
  12. Nera, E.; Paas, W.; Reidsma, P.; Paolini, G.; Antonioli, F.; Severini, S. Assessing the resilience and sustainability of a hazelnut farming system in Central Italy with a participatory approach. Sustainability 2020, 12, 343. [Google Scholar] [CrossRef] [Green Version]
  13. Cukur, T.; Atıs, E.; Akyuz, Y. The contribution of extension activities to multifunctional agriculture. Extension education worldwide. In Proceedings of the 21st ESEE European Seminar on Extension Education, Antalya, Turkey, 2–6 September 2013; p. 93. [Google Scholar]
  14. Aydoğan, M.; Demiryürek, K. Communication networks for organic hazelnut growers in Samsun. Extension Education Worldwide. In Proceedings of the 21st ESEE European Seminar on Extension Education, Antalya, Turkey, 2–6 September 2013; p. 45. [Google Scholar]
  15. Silva, A.P.; Santos, A.; Cavalheiro, J.; Ribeiro, C.; Santos, F.; Goncalves, B. Fruit chemical composition of hazelnut cultivars grown in Portugal. J. Appl. Hortic. 2007, 9, 157–161. [Google Scholar] [CrossRef]
  16. Demirbas, A. Phenolics from hazelnut kernels by supercritical methanol extraction. Energ. Source Part A 2007, 29, 791–797. [Google Scholar] [CrossRef]
  17. Boccacci, P.; Botta, R. Investigating the origin of hazelnut (Corylus avellana L.) cultivars using chloroplast microsatellites. Genet. Resour. Crop. Evol. 2009, 56, 851–859. [Google Scholar] [CrossRef]
  18. Amaral, J.S.; Casal, S.; Citová, I.; Santos, A.; Seabra, R.M.; Oliveira, B.P.P. Characterization of several hazelnut (Corylus avellana L.) cultivars based in chemical, fatty acid and sterol composition. Eur. Food Res. Technol. 2006, 222, 274–280. [Google Scholar]
  19. Iordănescu, O.A. Pomicultură Generală și Special; Eurobit: Timișoara, Romania, 2011. [Google Scholar]
  20. Tey, S.L.; Brown, R.C.; Chisholm, A.W.; Delahunty, C.M.; Gray, A.R.; Williams, S.M. Effects of different forms of hazelnuts on blood lipids and α-tocopherol concentrations in mildly hypercholesterolemic individuals. Eur. J. Clin. Nutr. 2010, 65, 117–124. [Google Scholar] [CrossRef] [PubMed] [Green Version]
  21. Perna, S.; Giacosa, A.; Bonitta, G.; Bologna, C.; Isu, A.; Guido, D.; Rondanelli, M. Effects of hazelnut consumption on blood lipids and body weight: A systematic review and Bayesian meta-analysis. Nutrients 2016, 8, 747. [Google Scholar] [CrossRef] [PubMed]
  22. Di Renzo, L.; Cioccoloni, G.; Bernardini, S.; Abenavoli, L.; Aiello, V.; Marchetti, M.; Cammarano, A.; Alipourfard, I.; Ceravolo, I.; Gratteri, S. A Hazelnut-enriched diet modulates oxidative stress and inflammation gene expression without weight gain. oxid med cell longev. Oxidative Med. Cell. Longev. 2019, 2019, 1–11. [Google Scholar] [CrossRef] [PubMed]
  23. Hulzetnut Hill. Available online: https://www.hazelnuthill.com/about/everything-you-need-to-know-about-hazelnut-flour (accessed on 22 April 2021).
  24. Tunç, M.T.; Kahyaoglu, T. Turkish tombul hazelnut (Corylus avellana L.) protein concentrates: Functional and rheological properties. J. Food Sci. Technol. 2015, 52, 1024–1031. [Google Scholar]
  25. Turhan, S.; Sagir, I.; Sule Ustun, N. Utilization of hazelnut pellicle in low-fat beef burgers. Meat Sci. 2005, 71, 312–316. [Google Scholar] [CrossRef] [PubMed]
  26. Dervisoglu, M. Influence of hazelnut flour and skin addition on the physical, chemical and sensory properties of vanilla ice cream. Int. J. Food Sci. Technol. 2006, 41, 657–661. [Google Scholar] [CrossRef]
  27. Anil, M. Using of hazelnut testa as a source of dietary fiber in breadmaking. J. Food Eng. 2007, 80, 61–67. [Google Scholar] [CrossRef]
  28. Poșta, D.S. Arboricultură Ornamental; Agroprint: Timișoara, Romania, 2019. [Google Scholar]
  29. Marks-Block, T.; Lake, F.K.; Curran, L.M. Effects of understory fire management treatments on California Hazelnut, an ecocultural resource of the Karuk and Yurok Indians in the Pacific Northwest. For. Ecol. Manag. 2019, 450, 117517. [Google Scholar] [CrossRef]
  30. AOAC. Official Method 950.48, Total Kjeldahl Nitrogen, Nuts and Nuts Products; AOAC: Rockville, MD, USA, 1950. [Google Scholar]
  31. Venkatachalam, M.; Sathe, S.K. Chemical composition of selected edible nut seeds. J. Agric. Food Chem. 2006, 54, 4705–4714. [Google Scholar] [CrossRef] [PubMed]
  32. ISO Methods: Moisture SR 91/2007 pct.10, protein SR EN ISO 8968-1:2014; Total Lipid SR 91:2007 pct.14.4; Mineral Substances SR ISO 2171/2010, Sugar SR ISO 91-2007. Available online: https://ipstesting.com/find-a-test/iso-test-methods/ (accessed on 24 November 2021).
  33. Cocan, I.; Alexa, E.; Danciu, C.; Radulov, I.; Galuscan, A.; Obistioiu, D.; Morvay, A.A.; Sumalan, R.M.; Poiana, M.A.; Pop, G.; et al. Phytochemical screening and biological activity of Lamiaceae family plant extracts. Exp. Ther. Med. 2018, 15, 1863–1870. [Google Scholar] [CrossRef] [PubMed] [Green Version]
  34. Pop, A.; Păucean, A.; Socaci, S.A.; Alexa, E.; Man, S.M.; Mureșan, V.; Chiş, M.S.; Salanță, L.; Popescu, I.; Berbecea, A.; et al. Quality characteristics and volatile profile of macarons modified with walnut oilcake by-product. Molecules 2020, 25, 2214. [Google Scholar] [CrossRef] [PubMed]
  35. ISO 6658:2017(en); Sensory Analysis—Methodology—General Guidance. ISO: Geneva, Switzerland, 2017.
  36. Pestorić, M.; Škrobot, D.; Žigon, U.; Šimurina, O.; Filipčev, B.; Belović, M.; Mišan, A. Sensory profile and preference mapping of cookies enriched with medicinal herbs. Int. J. Food Prop. 2016, 20, 350–361. [Google Scholar] [CrossRef] [Green Version]
  37. Dumbrava, D.; Popescu, L.A.; Soica, C.M.; Nicolin, A.; Cocan, I.; Negrea, M.; Alexa, E.; Obistioiu, D.; Radulov, I.; Popescu, S.; et al. Nutritional, antioxidant, antimicrobial, and toxico-logical profile of two innovative types of vegan, sugar-free chocolate. Foods 2020, 9, 1844. [Google Scholar] [CrossRef] [PubMed]
  38. Alasalvar, C.; Shahidi, F.; Liyanapathirana, C.M.; Ohshima, T. Turkish Tombul hazelnut (Corylus avellana L.). 1. Compositional characteristics. J. Agric. Food Chem. 2003, 51, 3790–3796. [Google Scholar] [CrossRef] [PubMed]
  39. Tunçil, Y.E. Dietary fibre profiles of Turkish Tombul hazelnut (Corylus avellana L.) and hazelnut skin. Food Chem. 2020, 316, 126338. [Google Scholar] [CrossRef] [PubMed]
  40. Chung, K.H.; Shin, K.O.; Hwang, H.J.; Choi, K.S. Chemical composition of nuts and seeds sold in Korea. Nutr. Res. Pract. 2013, 7, 82–88. [Google Scholar] [CrossRef] [PubMed] [Green Version]
  41. Tapiero, H.; Townsend, D.M.; Tew, K.D. Trace elements in human physiology and pathology. Copper. Biomed. Pharmacother. 2003, 57, 386–398. [Google Scholar] [CrossRef]
  42. Erdemir, U.S.; Gucer, S. Bioaccessibility of copper in Turkish hazelnuts (Corylus avellana L.) by chemical fractionation and in vitro methods. Biol. Trace Elem. Res. 2005, 167, 146. [Google Scholar] [CrossRef] [PubMed]
  43. Institute of Medicine. Dietary Reference Intakes: The Essential Guide to Nutrient Requirements; The National Academies Press: Washington, DC, USA, 2006. [Google Scholar] [CrossRef]
  44. Cevik, U.; Celik, N.; Celik, A.; Damla, N.; Coskuncelebi, K. Radioactivity and heavy metal levels in hazelnut growing in the Eastern Black Sea Region of Turkey. Food Chem. Toxicol. 2009, 47, 2351–2355. [Google Scholar] [CrossRef]
  45. Özkutlu, F.; Doğru, Y.Z.; Özenç, N.; Yazici, G.; Turan, M.; Akçay, F. The importance of Turkish hazelnut trace and heavy metal contents for human nutrition. Afr. J. Soil Sci. 2013, 1, 37–44. [Google Scholar]
  46. Dobhal, K.; Singh, N.; Semwal, A.; Negi, A. A brief review on: Hazelnuts. Int. J. Recent Sci. Res. 2018, 9, 23680–23684. [Google Scholar]
  47. Scherz, H.; Kirchhoff, E. Trace elements in foods: Zinc contents of raw foods—A comparison of data originating from different geographical regions of the world. J. Food Compos. Anal. 2006, 19, 420–433. [Google Scholar] [CrossRef]
  48. Institute of Medicine. Dietary Reference Intakes for Vitamin A, Vitamin K, Arsenic, Boron, Chromium, Copper, Iodine, Iron, Manganese, Molyb-denum, Nickel, Silicon, Vanadium, and Zinc, Panel on Micronutrients; National Academies Press: Washington, DC, USA, 2001; ISBN 10:0-309-07279-4. [Google Scholar]
  49. Cabrera, C.; Lloris, F.; Giménez, R.; Olalla, M.; López, M.C. Mineral content in legumes and nuts: Contribution to the Spanish dietary intake. Sci. Total Environ. 2003, 308, 1–14. [Google Scholar] [CrossRef]
  50. United States Environmental Protection Agency (USEPA). Integrated Risk Information System, IRIS—Revised. Federal Register 2005, 70, 10616. [Google Scholar]
  51. Ashimav, D.S. Low nickel diet in dermatology. Indian J. Dermatol. 2013, 58, 240. [Google Scholar]
  52. EFSA. Cadmium dietary exposure in the European population. EFSA J. 2012, 10, 2551. [Google Scholar] [CrossRef]
  53. Ercisli, S. A short review of the fruit germplasm resources of Turkey. Genet. Resour. Crop Evol. 2004, 51, 419–435. [Google Scholar] [CrossRef]
  54. Roversi, A. Observations on hazelnut organic farming. Bulg. J. Agric. Sci. 2016, 22, 171–175. [Google Scholar]
  55. Bak, T.; Karadeniz, T. Effects of branch number on quality traits and yield properties of European hazelnut (Corylus avellana L.). Agriculture 2021, 11, 437. [Google Scholar] [CrossRef]
  56. Campa, A.; Rodriguez Madrera, R.; Suárez Valles, B.; Ferreira, J.J. Variation of morphological, agronomic and chemical composition traits of local hazelnuts collected in northern Spain. Front. Plant Sci. 2021, 1, 12. [Google Scholar]
  57. Savage, G.P.; Mc Neil, D.L. Chemical composition of hazelnuts (Corylus avellana L.) grown in New Zeeland. Int. J. Food Sci. Nutr. 1998, 49, 199–203. [Google Scholar] [CrossRef]
  58. Gunes, N.T.; Köksal, A.İ.; Artık, N.; Poyrazoğlu, E. Biochemical content of hazelnut (Corylus avellana L.) cultivars from West Black Sea Region of Turkey. Eur. J. Hort. Sci. 2010, 75, S77–S84. [Google Scholar]
  59. Köksal, İ.; Artik, N.; Şimşek, A.; Güneş, N. Nutrient composition of hazelnut (Corylus avellana L.) varieties cultivated in Turkey. Food Chem. 2006, 99, 509–515. [Google Scholar] [CrossRef]
  60. Xu, Y.; Hanna, M. Nutritional and anti-nutritional compositions of defatted Nebraska hybrid hazelnut meal. Int. J. Food Sci. Technol. 2011, 46, 2022–2029. [Google Scholar] [CrossRef] [Green Version]
  61. Zhai, M.; Wang, Z.; Wang, D.; Xu, J.; Shi, G. Comparative analysis of mineral elements and essential amino acids compositions in juglans sigillata and J. regia walnuts kernels. Not. Bot. Horti Agrobot. Cluj-Napoca 2014, 42, 36–42. [Google Scholar] [CrossRef] [Green Version]
  62. Villarroel, M.; Biolley, E.; Ballester, D. Protein complementation of defatted hazelnut flour with pea flour. Arch. Latinoam. Nutr. 1990, 40, 379–386. [Google Scholar] [PubMed]
  63. Emre, Y.; Sevgili, H.; Şanlı, M. Partial replacement of fishmeal with hazelnut meal in diets for juvenile gilthead sea bream (Sparus aurata). Isr. J. Aquac. Bamidgeh 2008, 60, 198. [Google Scholar]
  64. Bakkalbasi, E.; Raciye Meral, R.; Dogan, I.S. Bioactive compounds, physical and sensory properties of cake made with walnut press-cake. J. Food Qual. 2015, 38, 422–430. [Google Scholar] [CrossRef]
  65. Ros, E.; Mataix, J. Fatty acid composition of nuts—Implications for cardiovascular health. Br. J. Nut. 2006, 96, S29–S35. [Google Scholar] [CrossRef] [PubMed] [Green Version]
  66. Ho, L.-H.; Latif, N.W.A. Nutritional composition, physical properties, and sensory evaluation of cookies prepared from wheat flour and pitaya (Hylocereusundatus) peel flour blends. Cogent Food Agric. 2016, 2, 1136369. [Google Scholar]
Figure 1. The chromatogram of standard of AA.
Agronomy 12 00214 g001
Figure 2. The technological scheme for obtaining biscuits.
Agronomy 12 00214 g002
Figure 3. Images of prepared hazelnut biscuits.
Agronomy 12 00214 g003
Figure 4. The comparative distribution of metals in the hazelnut samples.
Agronomy 12 00214 g004
Figure 5. Content of total polyphenols in the studied samples. Mean values are expressed as mg gallic acid equivalent GAE/g sample. The error bars indicate standard deviation. Different letters among samples indicate significant differences (p < 0.05) among values according to the t-test.
Agronomy 12 00214 g005
Figure 6. Global values of the sensory evaluation (consumer acceptance) of studied biscuits (CB—control, HB—5%, HB—10%, HB—15%) by using 5-point hedonic scale (n = 33). Different letters (a–c) among samples for the same sensory attributes indicate significant differences (p < 0.05) among values according to the t-test.
Agronomy 12 00214 g006
Figure 7. Mean scores of sensory attributes (color; texture; aroma and taste) for biscuits (CB–control, HB—5%, HB—10%, HB—15%) depending on gender ((a) women; (b) men).
Agronomy 12 00214 g007
Table 1. Working conditions for Varian Spectra 240 FS spectrophotometer.
MetalWavelength
λ (nm)
Lamp Current (mA)Slit Width
(mm)
Ni23240.2
Cr357.970.2
Cu324.840.5
Mn279.550.2
Zn21351
Fe248.350.2
Table 2. Gradient conditions for AA determination.
Time (min)%E1%E2%E3
080200
280200
1280200
1680200
24683240
30362440
30.120800
32.120800
32.280200
5280200
Table 3. Ash content and metal concentration in C1–C5 hazelnut samples (mean values).
SampleAshNiCrCuMnZnFe
(g/100g)(µg·g−1)(µg·g−1)(µg·g−1)(µg·g−1)(µg·g−1)(µg·g−1)
C12.34 ± 0.03 a4.87 ± 0.39 a2.84 ± 0.16 a79.10 ± 2.42 a45.79 ± 0.37 a105.33 ± 0.33 a114.55 ± 0.96 a
C22.54 ± 0.05 b7.88 ± 0.39 b2.00 ± 0.11 b100.38 ± 10.84 b54.05 ± 0.58 b123.23 ± 0.73 b117.59 ± 1.36 b
C32.33 ± 0.03 a 10.12 ± 0.44 c1.88 ± 0.03 b47.67 ± 1.28 c44.85 ± 0.67 a108.56 ± 1.73 c,d88.39 ± 4.27 c
C42.63 ± 0.07 b,c6.36 ± 0.50 d1.87 ± 0.08 b73.30 ± 3.95 d26.00 ± 1.89 c96.93 ± 1.30 c92.45 ± 4.12 c
C52.31 ± 0.04 a 32.19 ± 2.24 e2.07 ± 0.28 b95.81 ± 2.20 b87.78 ± 3.06 d107.07 ± 13.13 a,d146.98 ± 20.65 d
The values are expressed as mean values ± standard deviations of all measurements. a–e A t-test was used to compare the mean differences registered among samples; data within the same column sharing different superscripts are significantly different (p < 0.05); data within the same column sharing the same superscripts are not significantly different (p > 0.05).
Table 4. Crude protein and amino acid content.
SampleC1C2C3C4C5Mean
CP (g/100 g)21.34 ± 1.13 a19.54 ± 0.49 b,c16.33 ± 1.11 b,d20.63 ± 0.808 a,c22.31 ± 0.963 a,d20.04
Arg (g/100 g)0.643 ± 0.029 a0.931 ± 0.083 b0.773 ± 0.074 a,b,c 0.365 ± 0.024 b0.704 ± 0.025 c0.683
Ser (g/100 g)0.255 ± 0.052 a0.279 ± 0.066 a0.411 ± 0.111 b0.210 ± 0.0316 a0.461 ± 0.026 b0.277
Lys (g/100 g)0.062 ± 0.0064 a0.001 ± 0.0001 b(0.001 ± 0.0001) b0.013 ± 0.003 c0.081 ± 0.0077 c0.031
Gly (g/100 g)0.028 ± 0.0045 a0.016 ± 0.00094 b 0.006 ± 0.0006 c0.072 ± 0.0051 c(0.016 ± 0.001 b0.026
Phe (g/100 g)0.249 ± 0.034 a0.42 ± 0.049 b0.648 ± 0.043 c0.345 ± 0.0439 b(0.412 ± 0.0075) b0.415
Glu (g/100 g)0.171 ± 0.032 a0.142 ± 0.032 a0.161 ± 0.0293 a0.214 ± 0.0204 b0.252 ± 0.031 a,b0.188
Asp (g/100 g)0.249 ± 0.025 a0.164 ± 0.0097 b0.082 ± 0.005 c0.159 ± 0.0123 b0.012 ± 0007 d0.133
Pro (g/100 g)0.013 ± 0.003 a0.018 ± 0.000 a0.017 ± 0.0053 a0.127 ± 0.0029 b0.016 ± 0.0021 a0.038
The values are expressed as mean values ± standard deviations of all measurements. a–c A t-test was used to compare the mean differences registered among samples; data within the same row sharing different superscripts are significantly different (p < 0.05); data within the same row sharing the same superscripts are not significantly different (p > 0.05).
Table 5. Pearson correlation coefficient matrix for metal and amino acid content in hazelnut samples.
ArgSerLysGlyFenGlu.AcAsp.AcProNiCrCuMnZnFe
Arg10.364−0.144−0.1710.086−0.571 **−0.680 **−0.836 **0.115−0.0660.2590.463 *0.799 **0.254
Ser0.3641−0.054−0.788 **−0.431−0.173−0.853 **−0.1940.561 *−0.714 **−0.0730.513 *0.1600.180
Lys−0.144−0.05410.411−0.568 **0.457 *0.256−0.1900.519 *0.496 *0.3910.671 **−0.2390.710 **
Gly−0.171−0.788 **0.41110.3930.0260.752 **−0.213−0.3350.922 **0.008−0.145−0.1150.057
Fen0.086−0.431−0.568 **0.3931−0.698 **0.257−0.190−0.692 **0.218−0.631 **−0.685 **0.087−0.714 **
Glu.Ac−0.571 **−0.1730.457 *0.026−0.698 **10.3480.595 **0.2690.1000.550 *0.156−0.3430.459 *
Asp.Ac−0.680 **−0.853 **0.2560.752 **0.2570.34810.444 *−0.4340.629 **−0.084−0.510 *−0.505 *−0.193
Pro−0.836 **−0.194−0.190−0.213−0.1900.595 **0.444 *1−0.156−0.293−0.108−0.565 **−0.622 **−0.351
Ni0.1150.561 *0.519 *−0.335−0.692 **0.269−0.434−0.1561−0.2160.2650.729 **0.0200.511 *
Cr−0.066−0.714 **0.496 *0.922 **0.2180.1000.629 **−0.293−0.21610.1600.0630.0720.244
Cu0.259−0.0730.3910.008−0.631 **0.550 *−0.084−0.1080.2650.16010.522 *0.3520.727 **
Mn0.463 *0.513 *0.671 **−0.145−0.685 **0.156−0.510 *−0.565 **0.729 **0.0630.522 *10.3190.849 **
Zn0.799 **0.160−0.239−0.1150.087−0.343−0.505 *−0.622 **0.0200.0720.3520.31910.176
Fe0.2540.1800.710 **0.057−0.714 **0.459 *−0.193−0.3510.511 *0.2440.727 **0.849 **0.1761
** Correlation is significant at the 0.01 level (two-tailed). * Correlation is significant at the 0.05 level (two-tailed).
Table 6. Pearson correlation coefficient matrix for crude protein and amino acid content in hazelnut samples.
CPArSeLyGlyFenGlu.AcAsp.AcPro
CP1
Ar−0.3591
Se−0.2640.3641
Ly0.678 **−0.144−0.0541
Gly0.314−0.171−0.788 **0.4111
Fen−0.640 **0.086−0.431−0.568 **0.3931
Glu.Ac0.791 **−0.571 **−0.1730.457 *0.026−0.698 **1
Asp.Ac.0.372−0.680 **−0.853 **0.2560.752 **0.2570.3481
Pro0.226−0.836 **−0.194−0.190−0.213−0.1900.595 **0.444 *1
** Correlation is significant at the 0.01 level (two-tailed). * Correlation is significant at the 0.05 level (two-tailed).
Table 7. Proximate composition of biscuits.
ProductsHumidity g/100 g ProductAsh
g/100 g Product
Protein
g/100 g
Product
Lipids g/100 g ProductCarbohydrates g/100 g ProductEnergetic Value kcal/100 g ProductReference Consumption g/100 g Product
HB 5%6.33 ± 0.15 a1.31 ± 0.03 a7.38 ± 0.09 a12.97 ± 0.19 a72.02434.2821.71
HB 10%6.40 ± 0.13 a1.37 ± 0.02 b10.36 ± 0.14 b15.33 ± 0.30 b64.54445.5622.28
HB 15%6.60 ± 0.08 a1.44 ± 0.03 b14.54 ± 0.15 c17.70 ± 0.23 c59.73456.3222.82
CB6.80 ± 0.08 b1.24 ± 0.02 c9.10 ± 0.26 d10.60 ± 0.34 d72.26420.8421.04
The values are expressed as mean values ± standard deviations of all measurements. a–d A t-test was used to compare the mean differences registered among samples; data within the same column sharing different superscripts are significantly different (p < 0.05); data within the same column sharing the same superscripts are not significantly different (p > 0.05).
Table 8. Fatty acids composition of biscuit samples.
Shorthand NomenclatureFatty Acid NameTypeRetention timeFatty Acid Content (%)
CBHB 5%HB 10%HB 15%
C4:0Butyric acidSFA9.2942.351 ± 0.052 a1.624 ± 0.040 b1.422 ± 0.042 c1.388 ± 0.034 c
C6:0Caproic acidSFA11.4501.258 ± 0.024 a1.189 ± 0.024 a,c1.167 ± 0.049 a,c1.092 ± 0.028 b,c
C8:0Caprilyc acidSFA15.2960.800 ± 0.028 a0.779 ± 0.017 a0.799 ± 0.017 a0.724 ± 0.031 a
C10:0Capric acidSFA20.5591.959 ± 0.057 a1.931 ± 0.028 a1.950 ± 0.071 a1.844 ± 0.059 a
C12:0Lauric acidSFA26.2112.599 ± 0.082 a2.456 ± 0.086 a2.463 ± 0.076 a2.372 ± 0.052 a
C14:0Myristic acidSFA31.5889.624 ± 0.368 a8.794 ± 0.311 a8.792 ± 0.314 a8.875 ± 0.191 a
C17:0Isomargaric acidSFA32.8470.209 ± 0.006 a0.139 ± 0.006 b0.155 ± 0.007 b0.140 ± 0.007 b
C15:0Pentadecanoic acidSFA34.0920.965 ± 0.028 a0.858 ± 0.020 a0.843 ± 0.011 a0.826 ± 0.041 a
C16:0Acid palmiticSFA36.53334.081 ± 1.124 a32.206 ± 0.554 a31.487 ± 0.604 a31.110 ± 1.131 a
C17:0Acid margaricSFA37.6420.797 ± 0.040 a0.431 ± 0.008 b0.669 ± 0.014 c0.325 ± 0.007 d
C18:0Stearic acidSFA40.9909.753 ± 0.337 a9.242 ± 0.202 a8.861 ± 0.327 a9.166 ± 0.460 a
C10:1Decenoic acidMUFA23.1070.216 ± 0.006 a0.186 ± 0.006 b,c0.200 ± 0.007 a,c0.166 ± 0.004 b
C16:1Palmitoleic acidMUFA37.8492.130 ± 0.064 a1.852 ± 0.042 b1.863 ± 0.041 b1.865 ± 0.038 b
C18:1Oleic acid, Δ6MUFA41.81725.559 ± 1.003 a31.047 ± 0.663 b33.421 ± 1.082 b34.313 ± 1.093 b
C18:2, n − 6Linoleic acidPUFA43.7344.441 ± 0.126 a4.587 ± 0.191 a3.774 ± 0.147 b3.791 ± 0.130 b
C18:3, n − 3Linolenic acid, cisPUFA46.4141.384 ± 0.051 a0.667 ± 0.017 b0.611 ± 0.021 b0.607 ± 0.016 b
C20:4, n − 6Arachidonic acidPUFA50.4270.293 ± 0.007 a0.317 ± 0.008 a0.256 ± 0.057 a,c0.143 ± 0.007 b,c
ΣSFA 64.39659.64958.60857.862
ΣMUFA 27.90533.08535.48436.344
ΣPUFA 6.1185.5714.6414.541
ΣUFA 34.02338.65640.12540.885
Other compounds 1.4191.1541.1411.123
The values are expressed as mean values ± standard deviations of all measurements. a–c A t-test was used to compare the mean differences registered among samples; data within the same row sharing different superscripts are significantly different (p < 0.05); data within the same row sharing the same superscripts are not significantly different (p > 0.05).
Publisher’s Note: MDPI stays neutral with regard to jurisdictional claims in published maps and institutional affiliations.

