
Observed Changes in Agroclimate Metrics Relevant for Specialty Crop Production in California

Abstract
1. Introduction
2. Data and Methods
2.1. Agroclimate Metrics
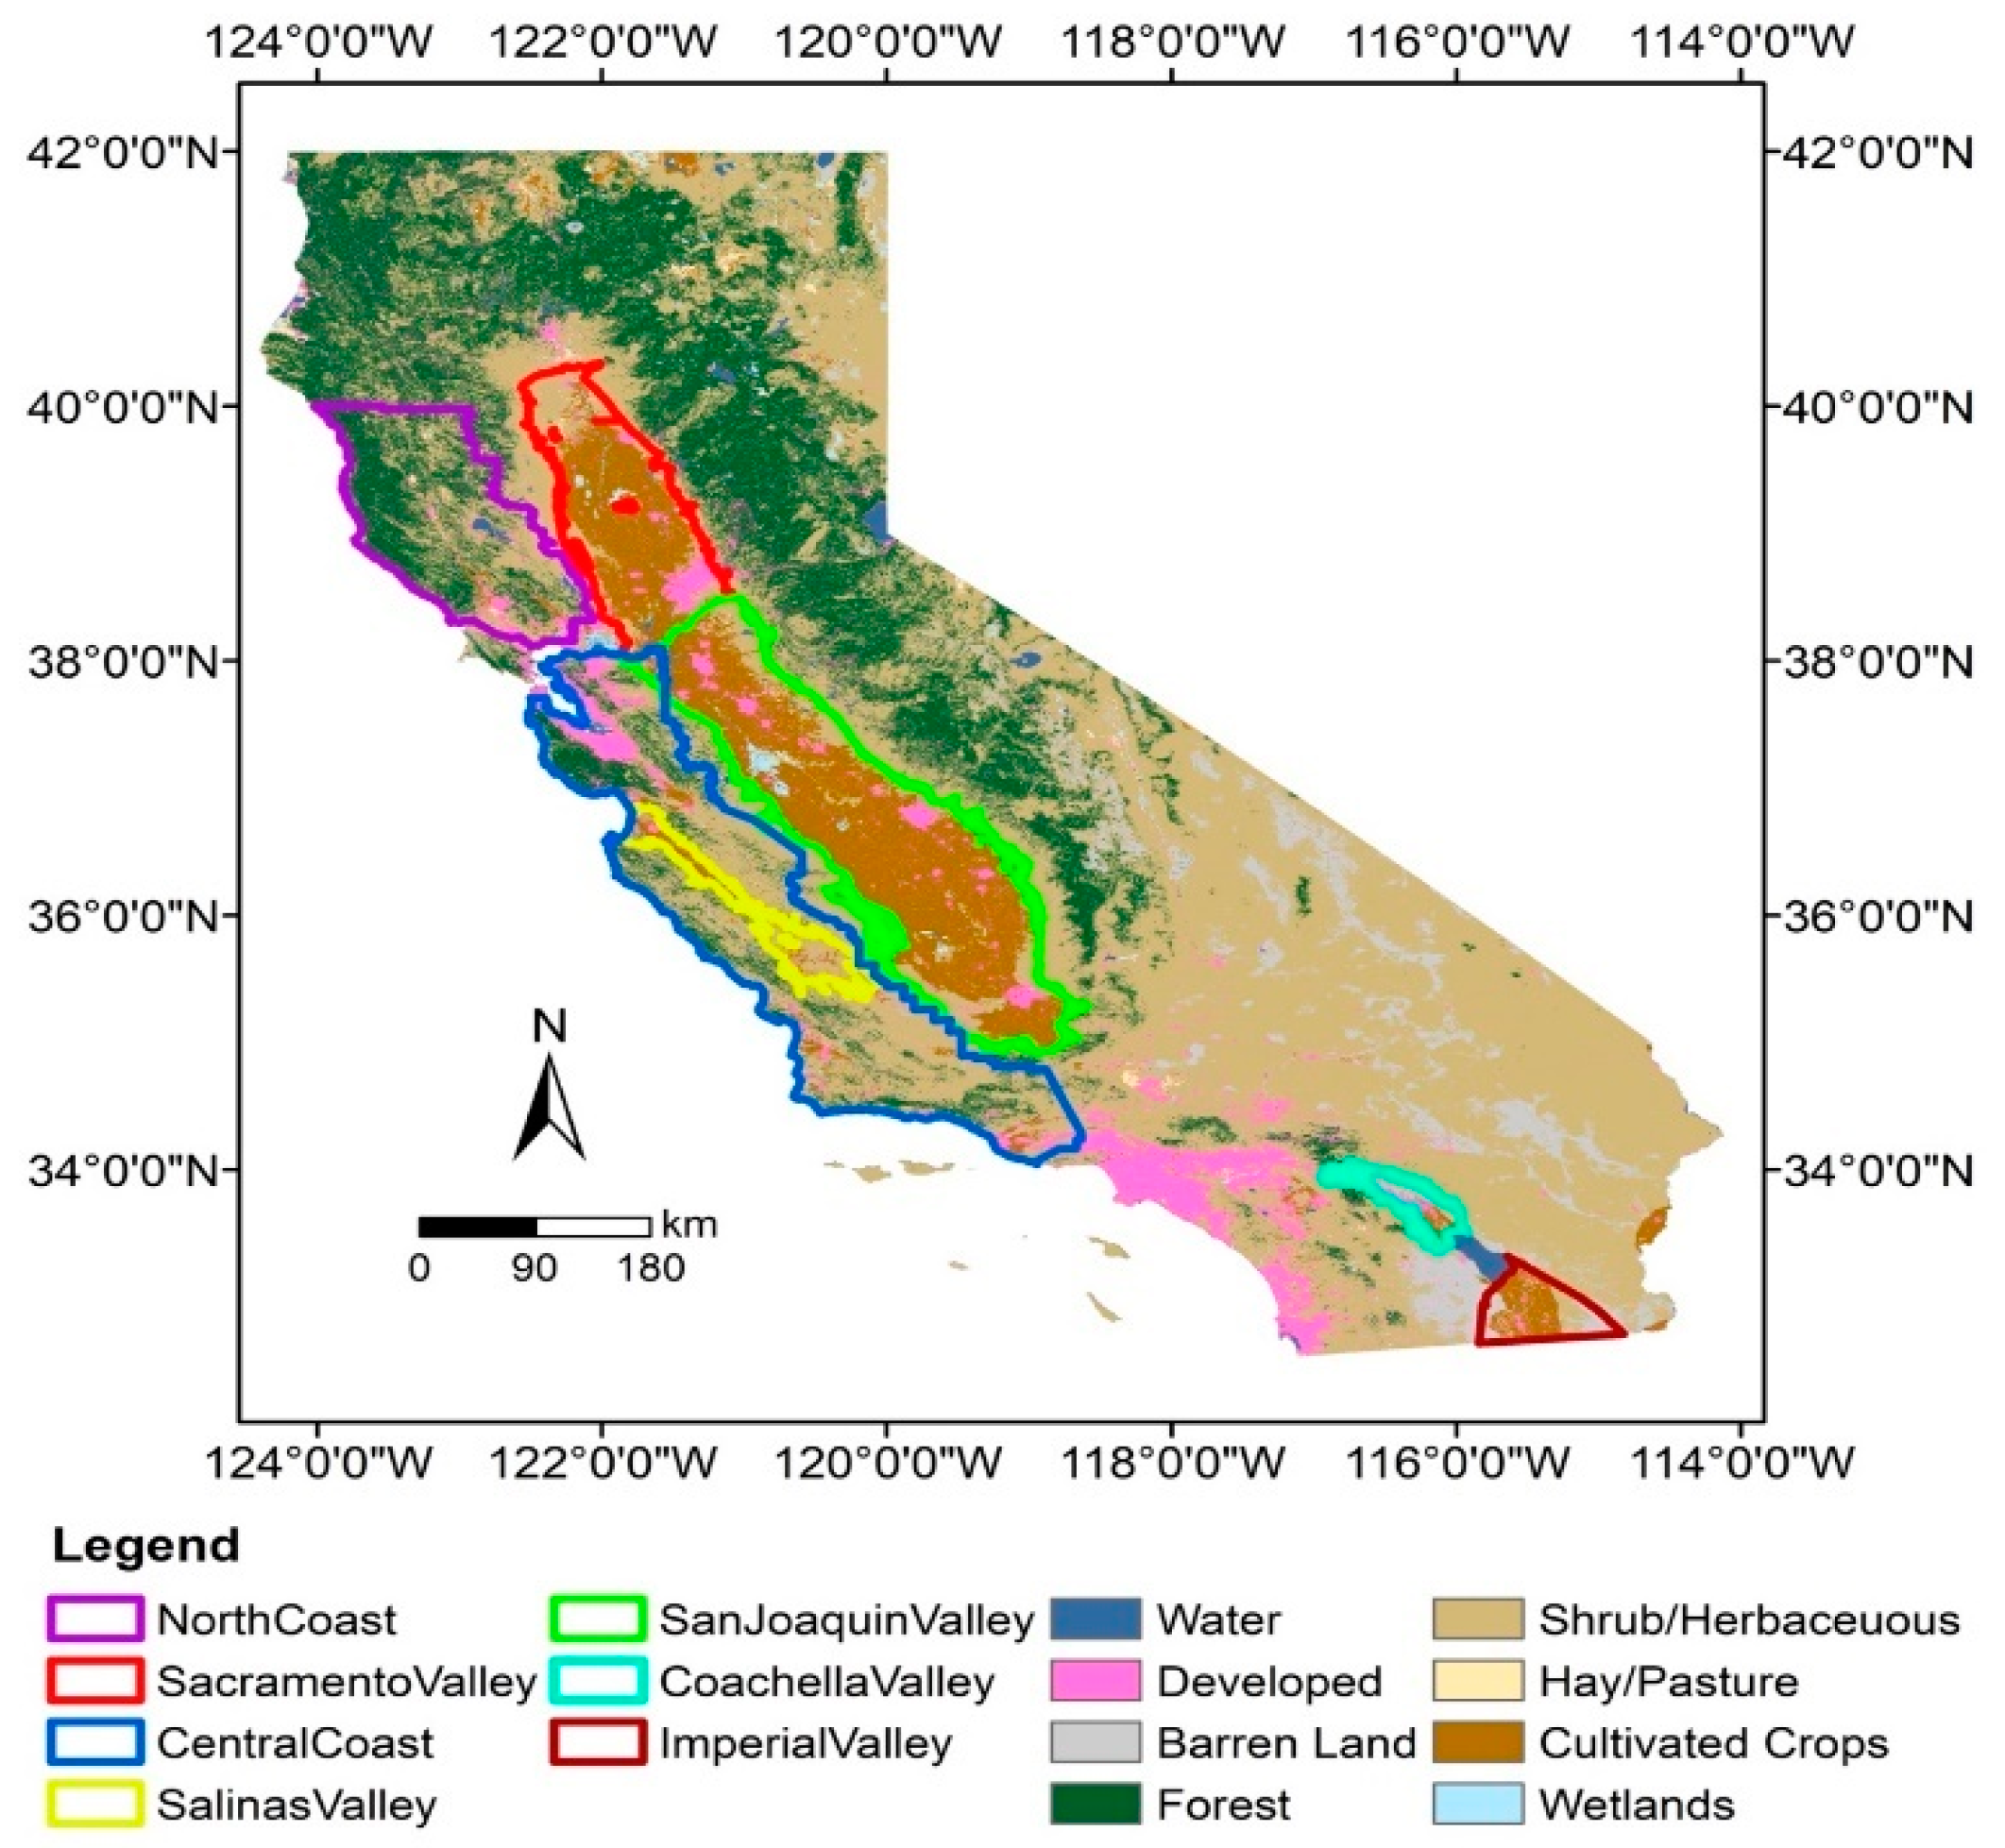
2.2. Study Area
2.3. Climate Data
2.4. Difference and Trend Analysis
3. Results and Discussion
3.1. Changes between Normal Periods and Implications for Specialty Crop Production
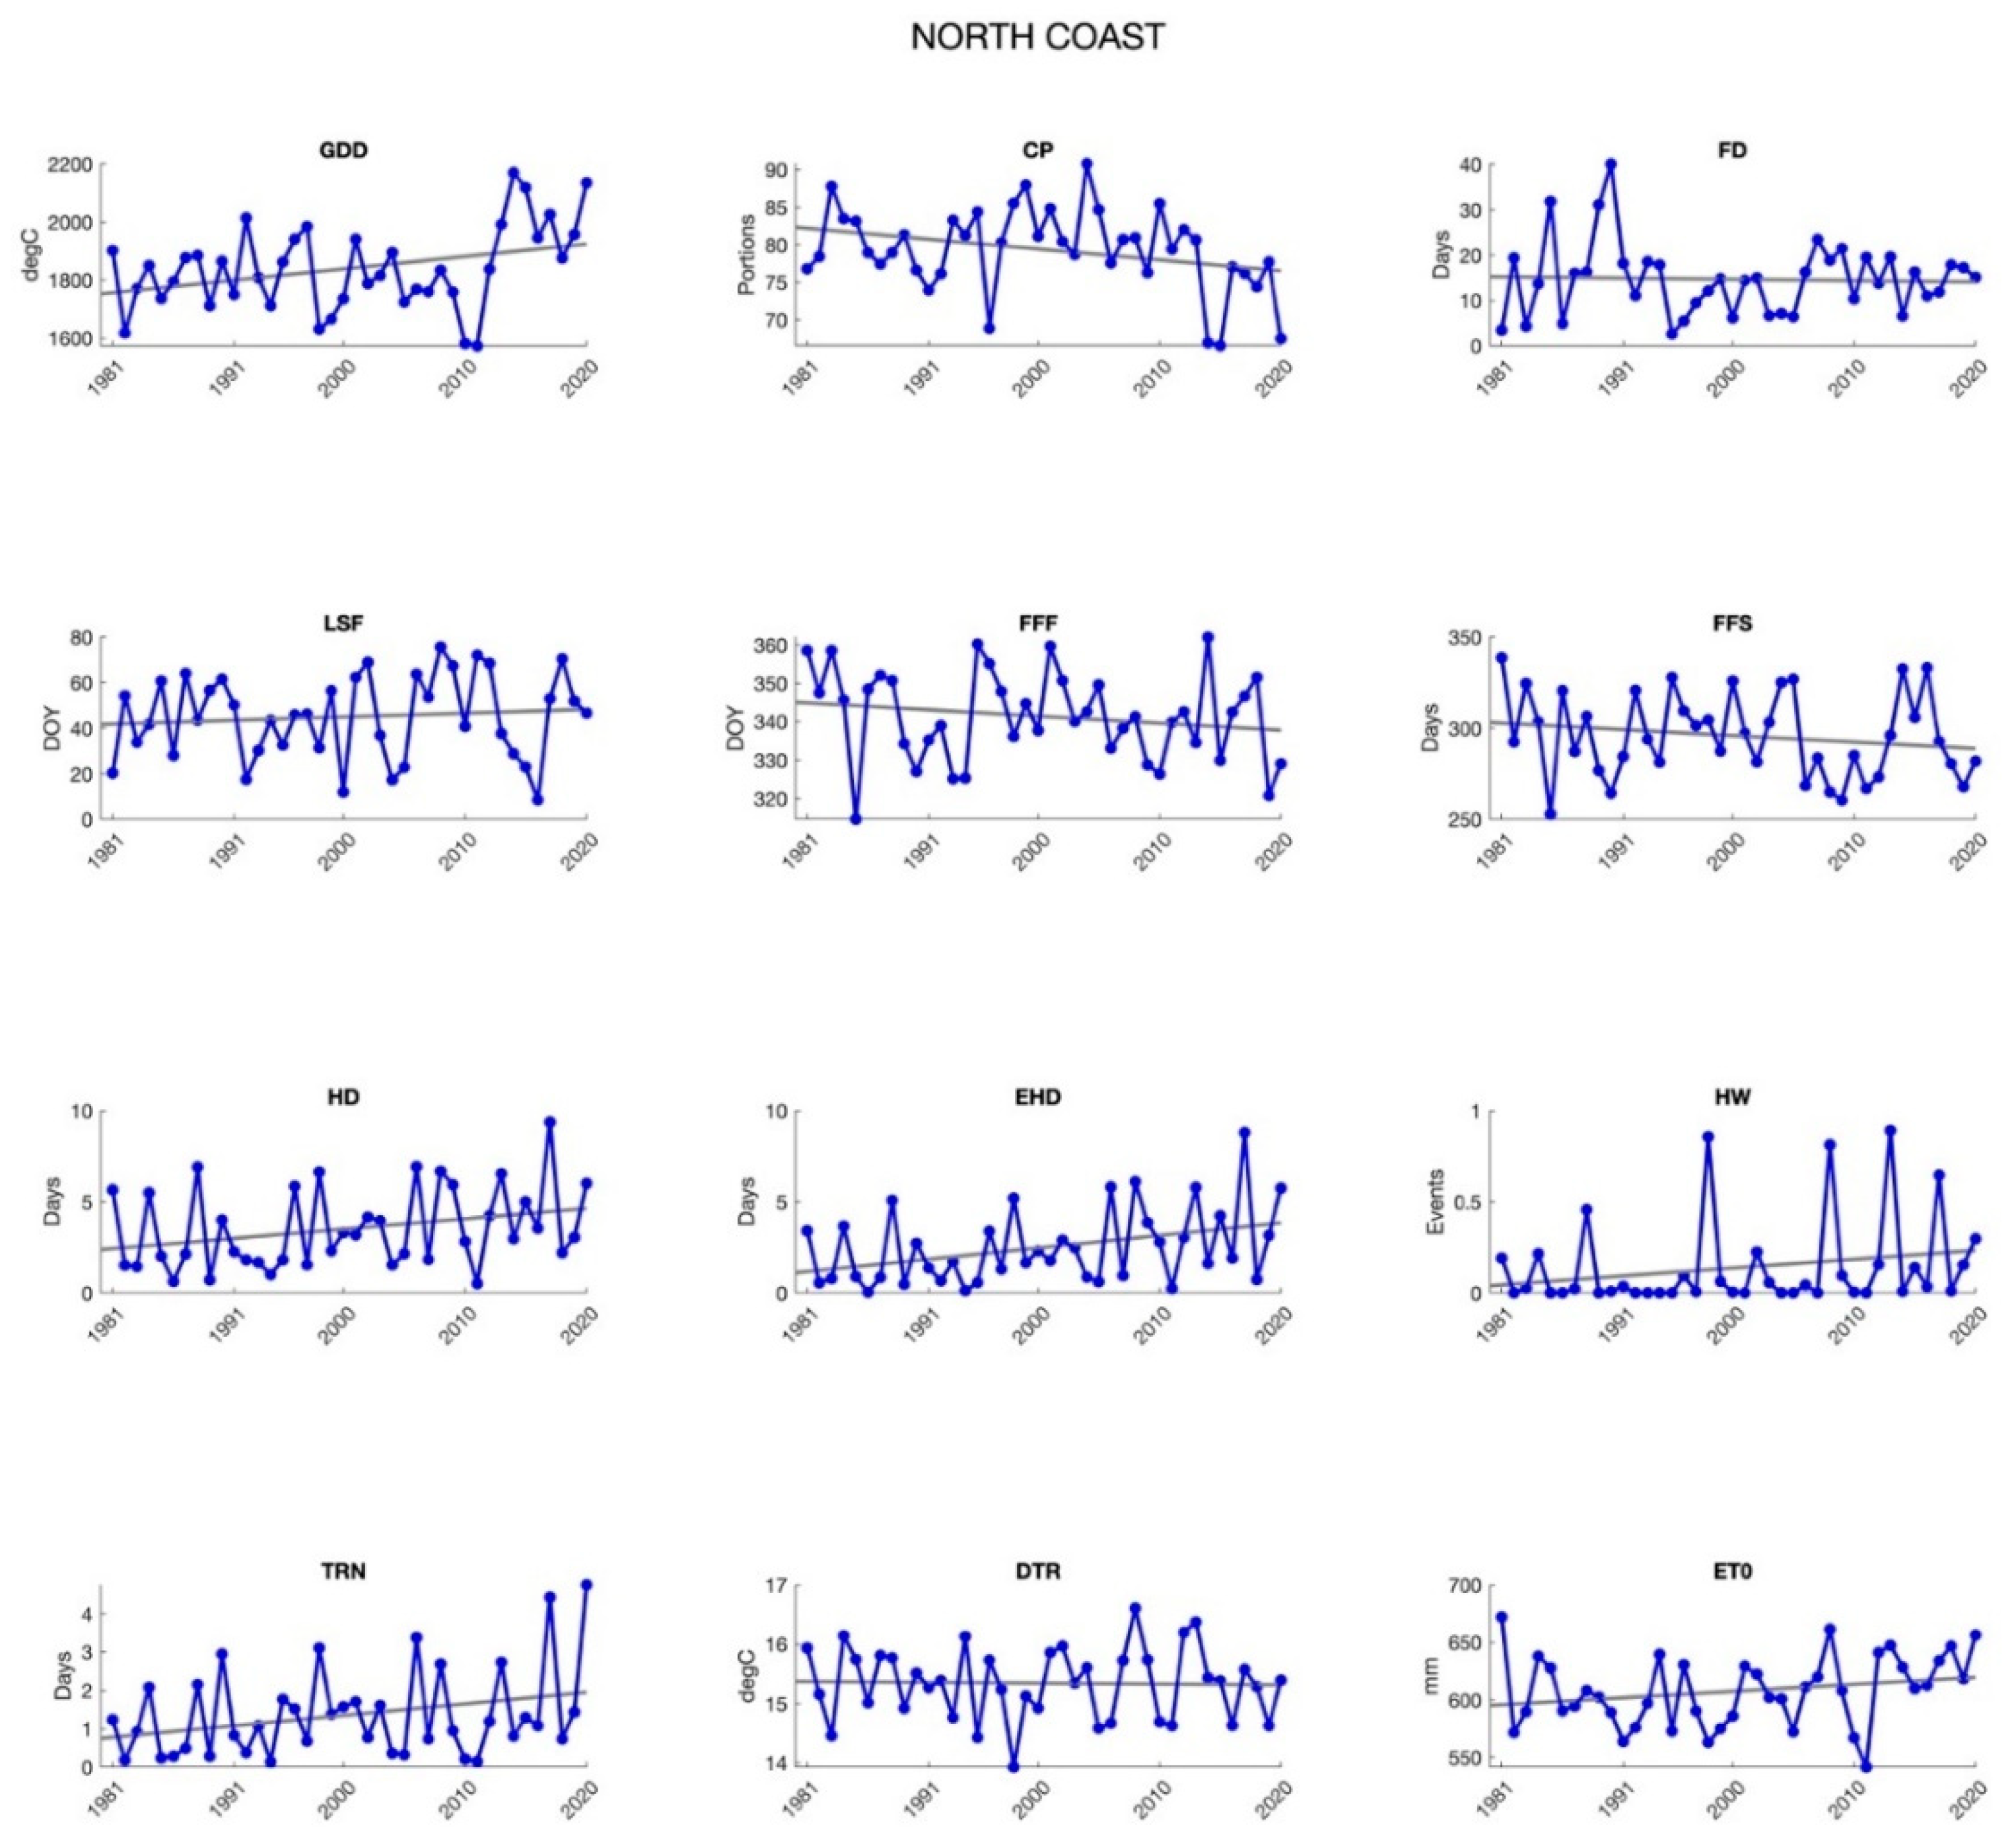
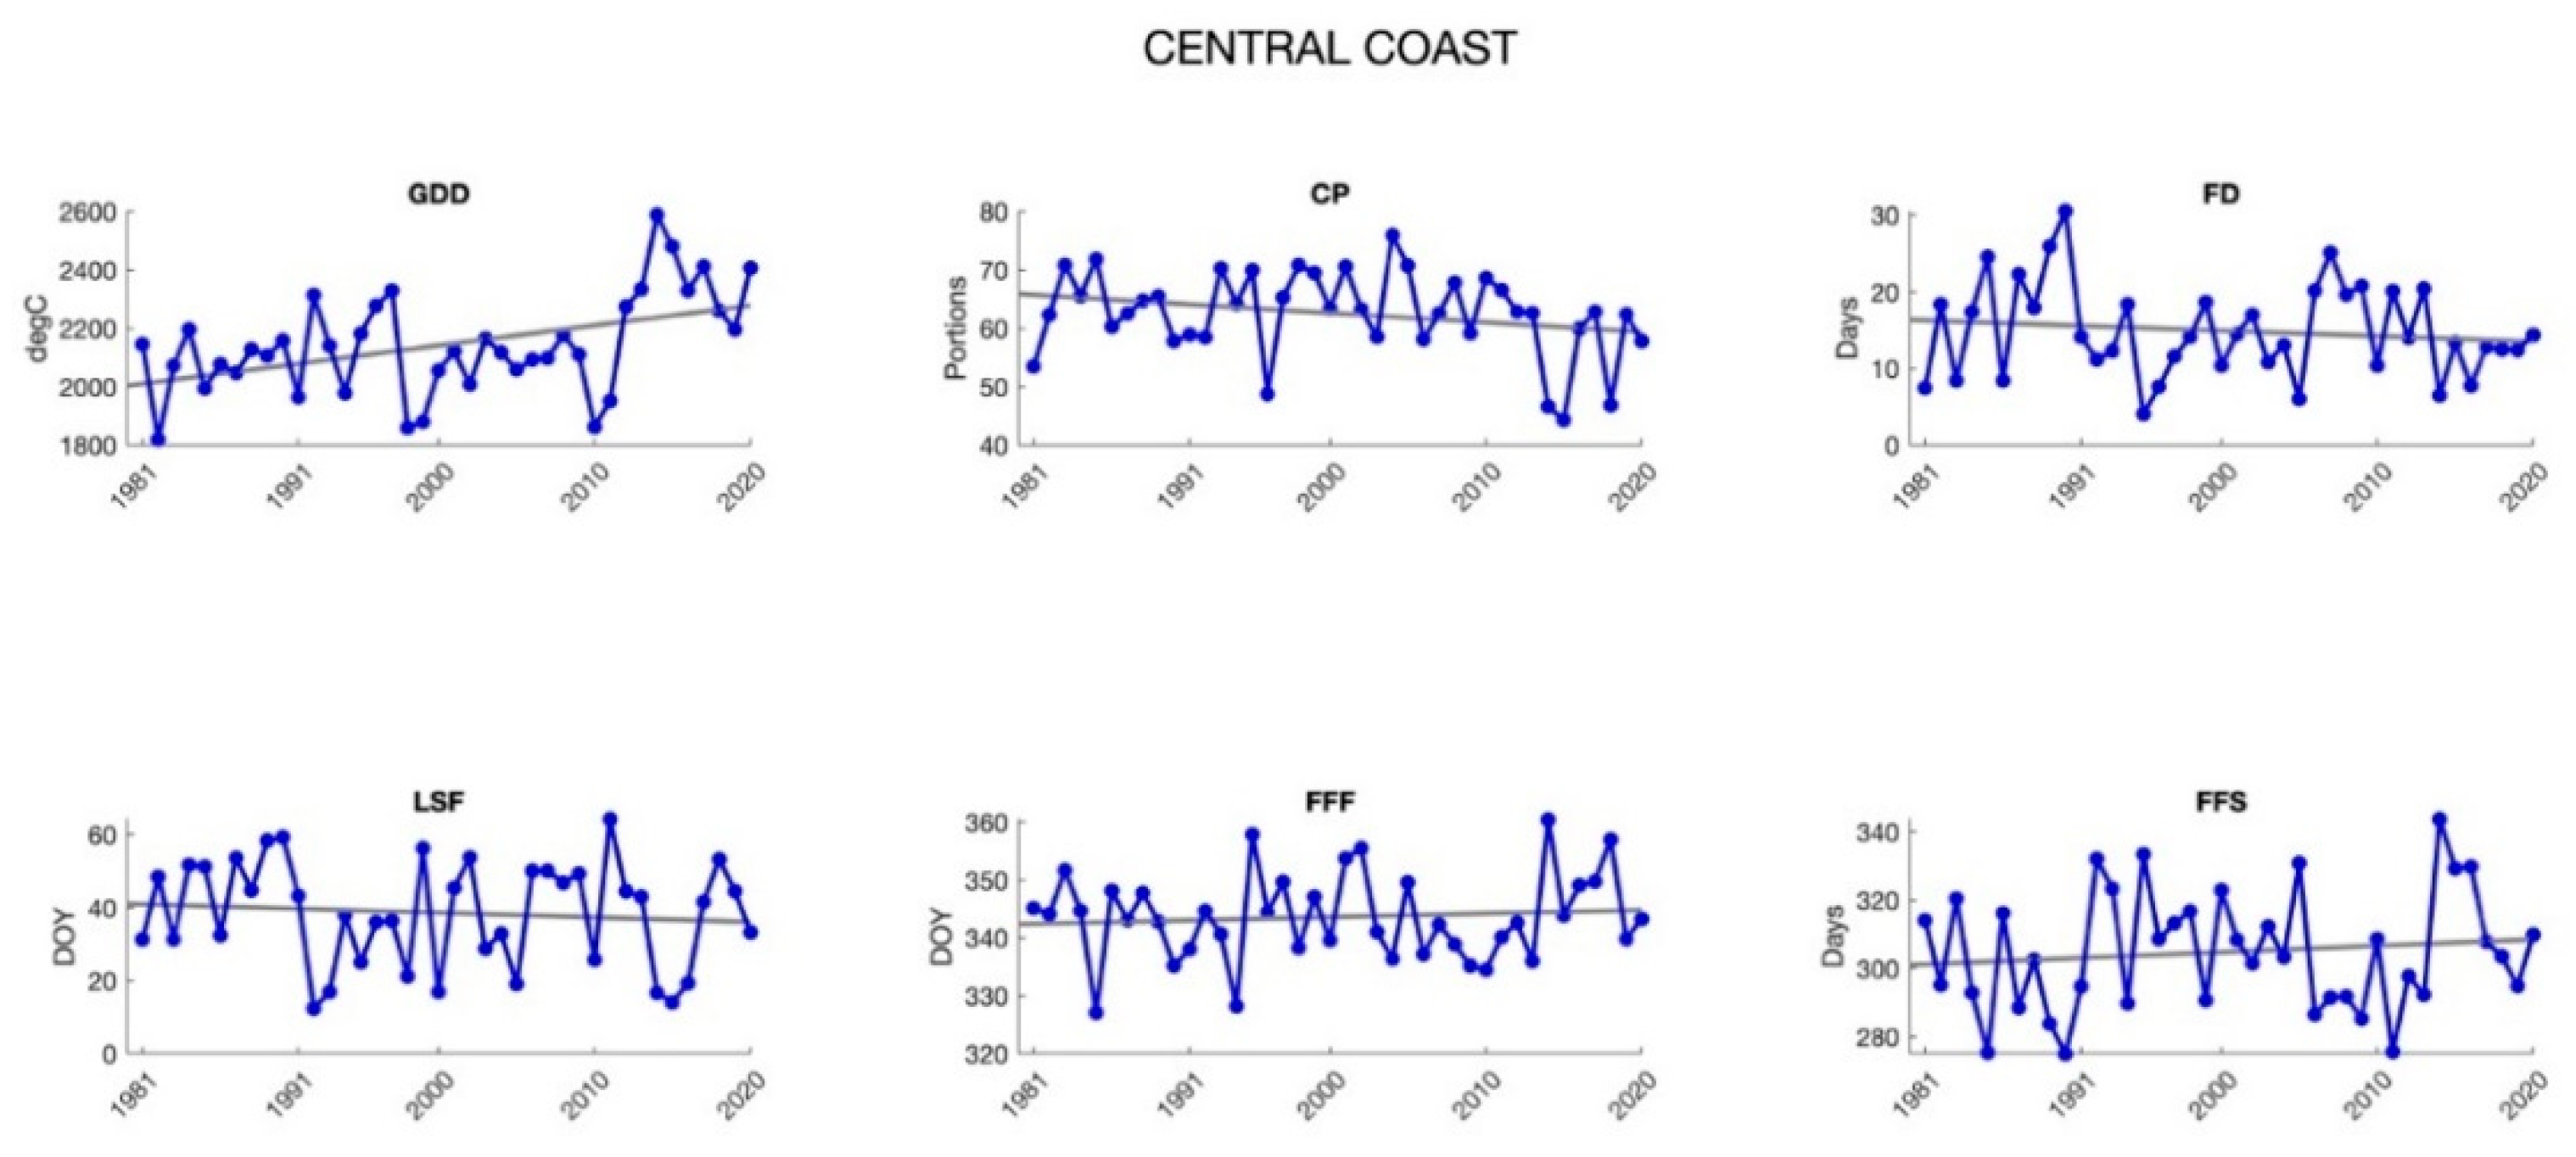
3.1.1. North and Central Coasts
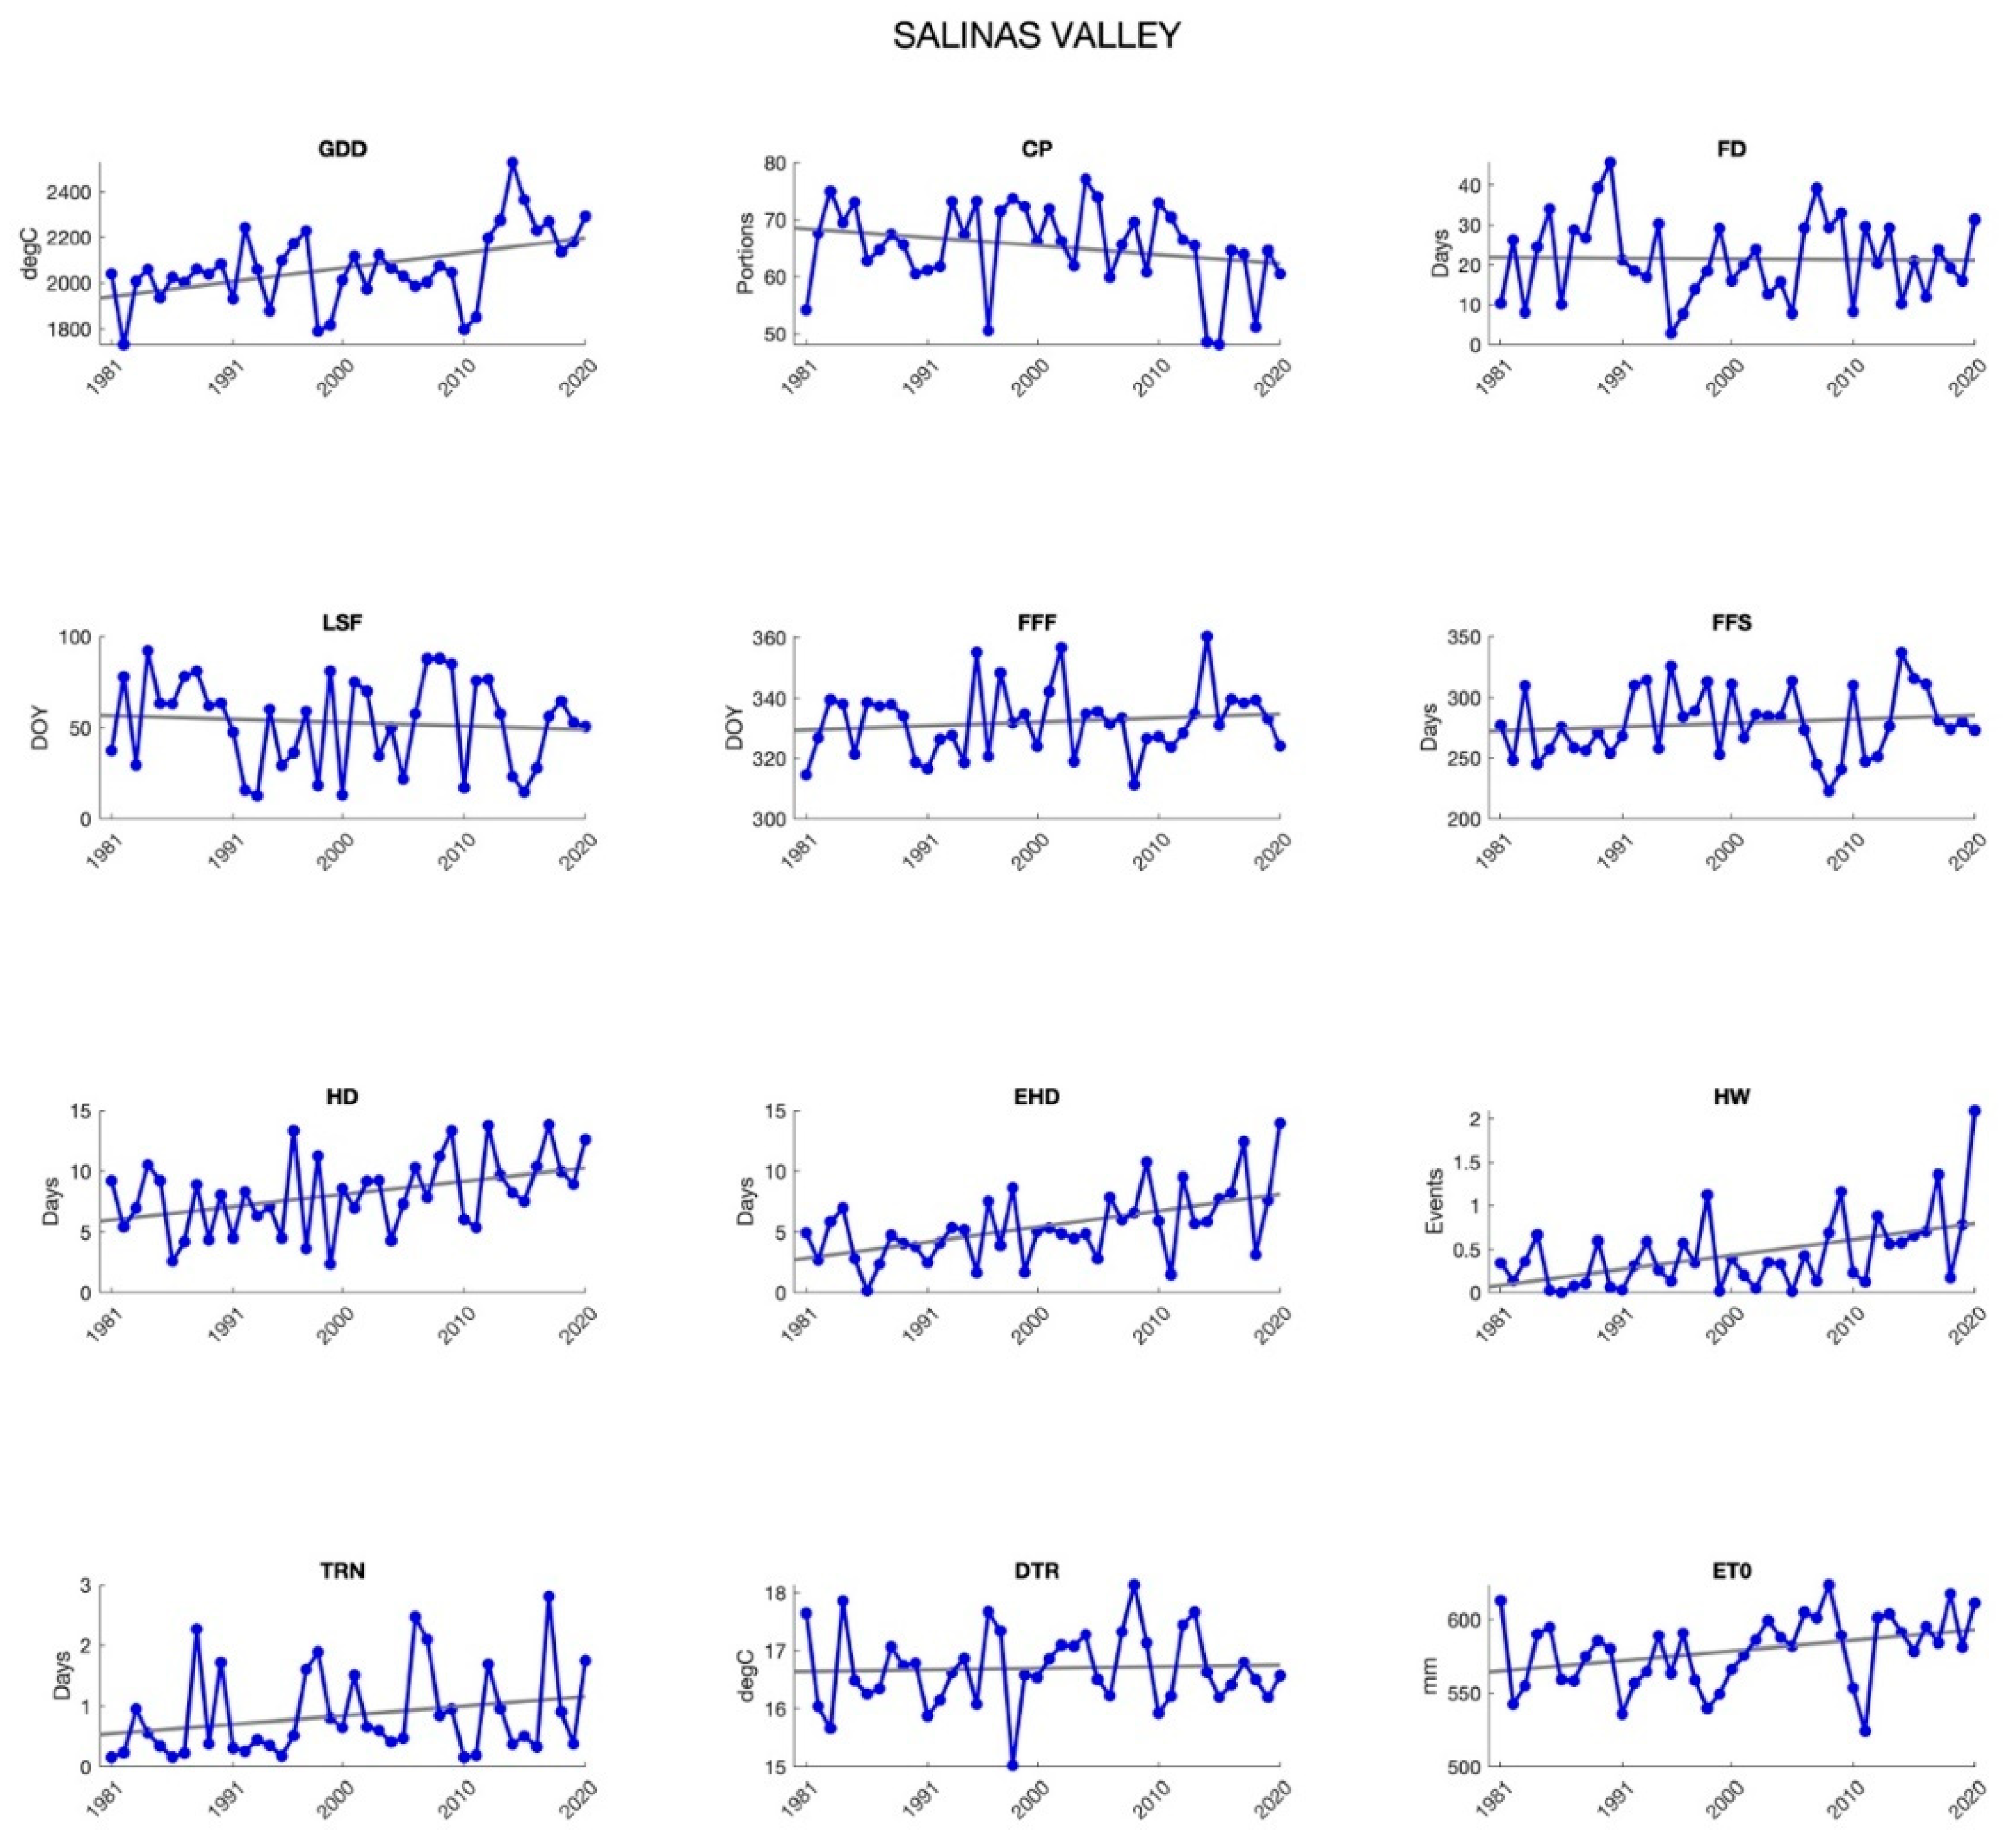
3.1.2. Salinas Valley
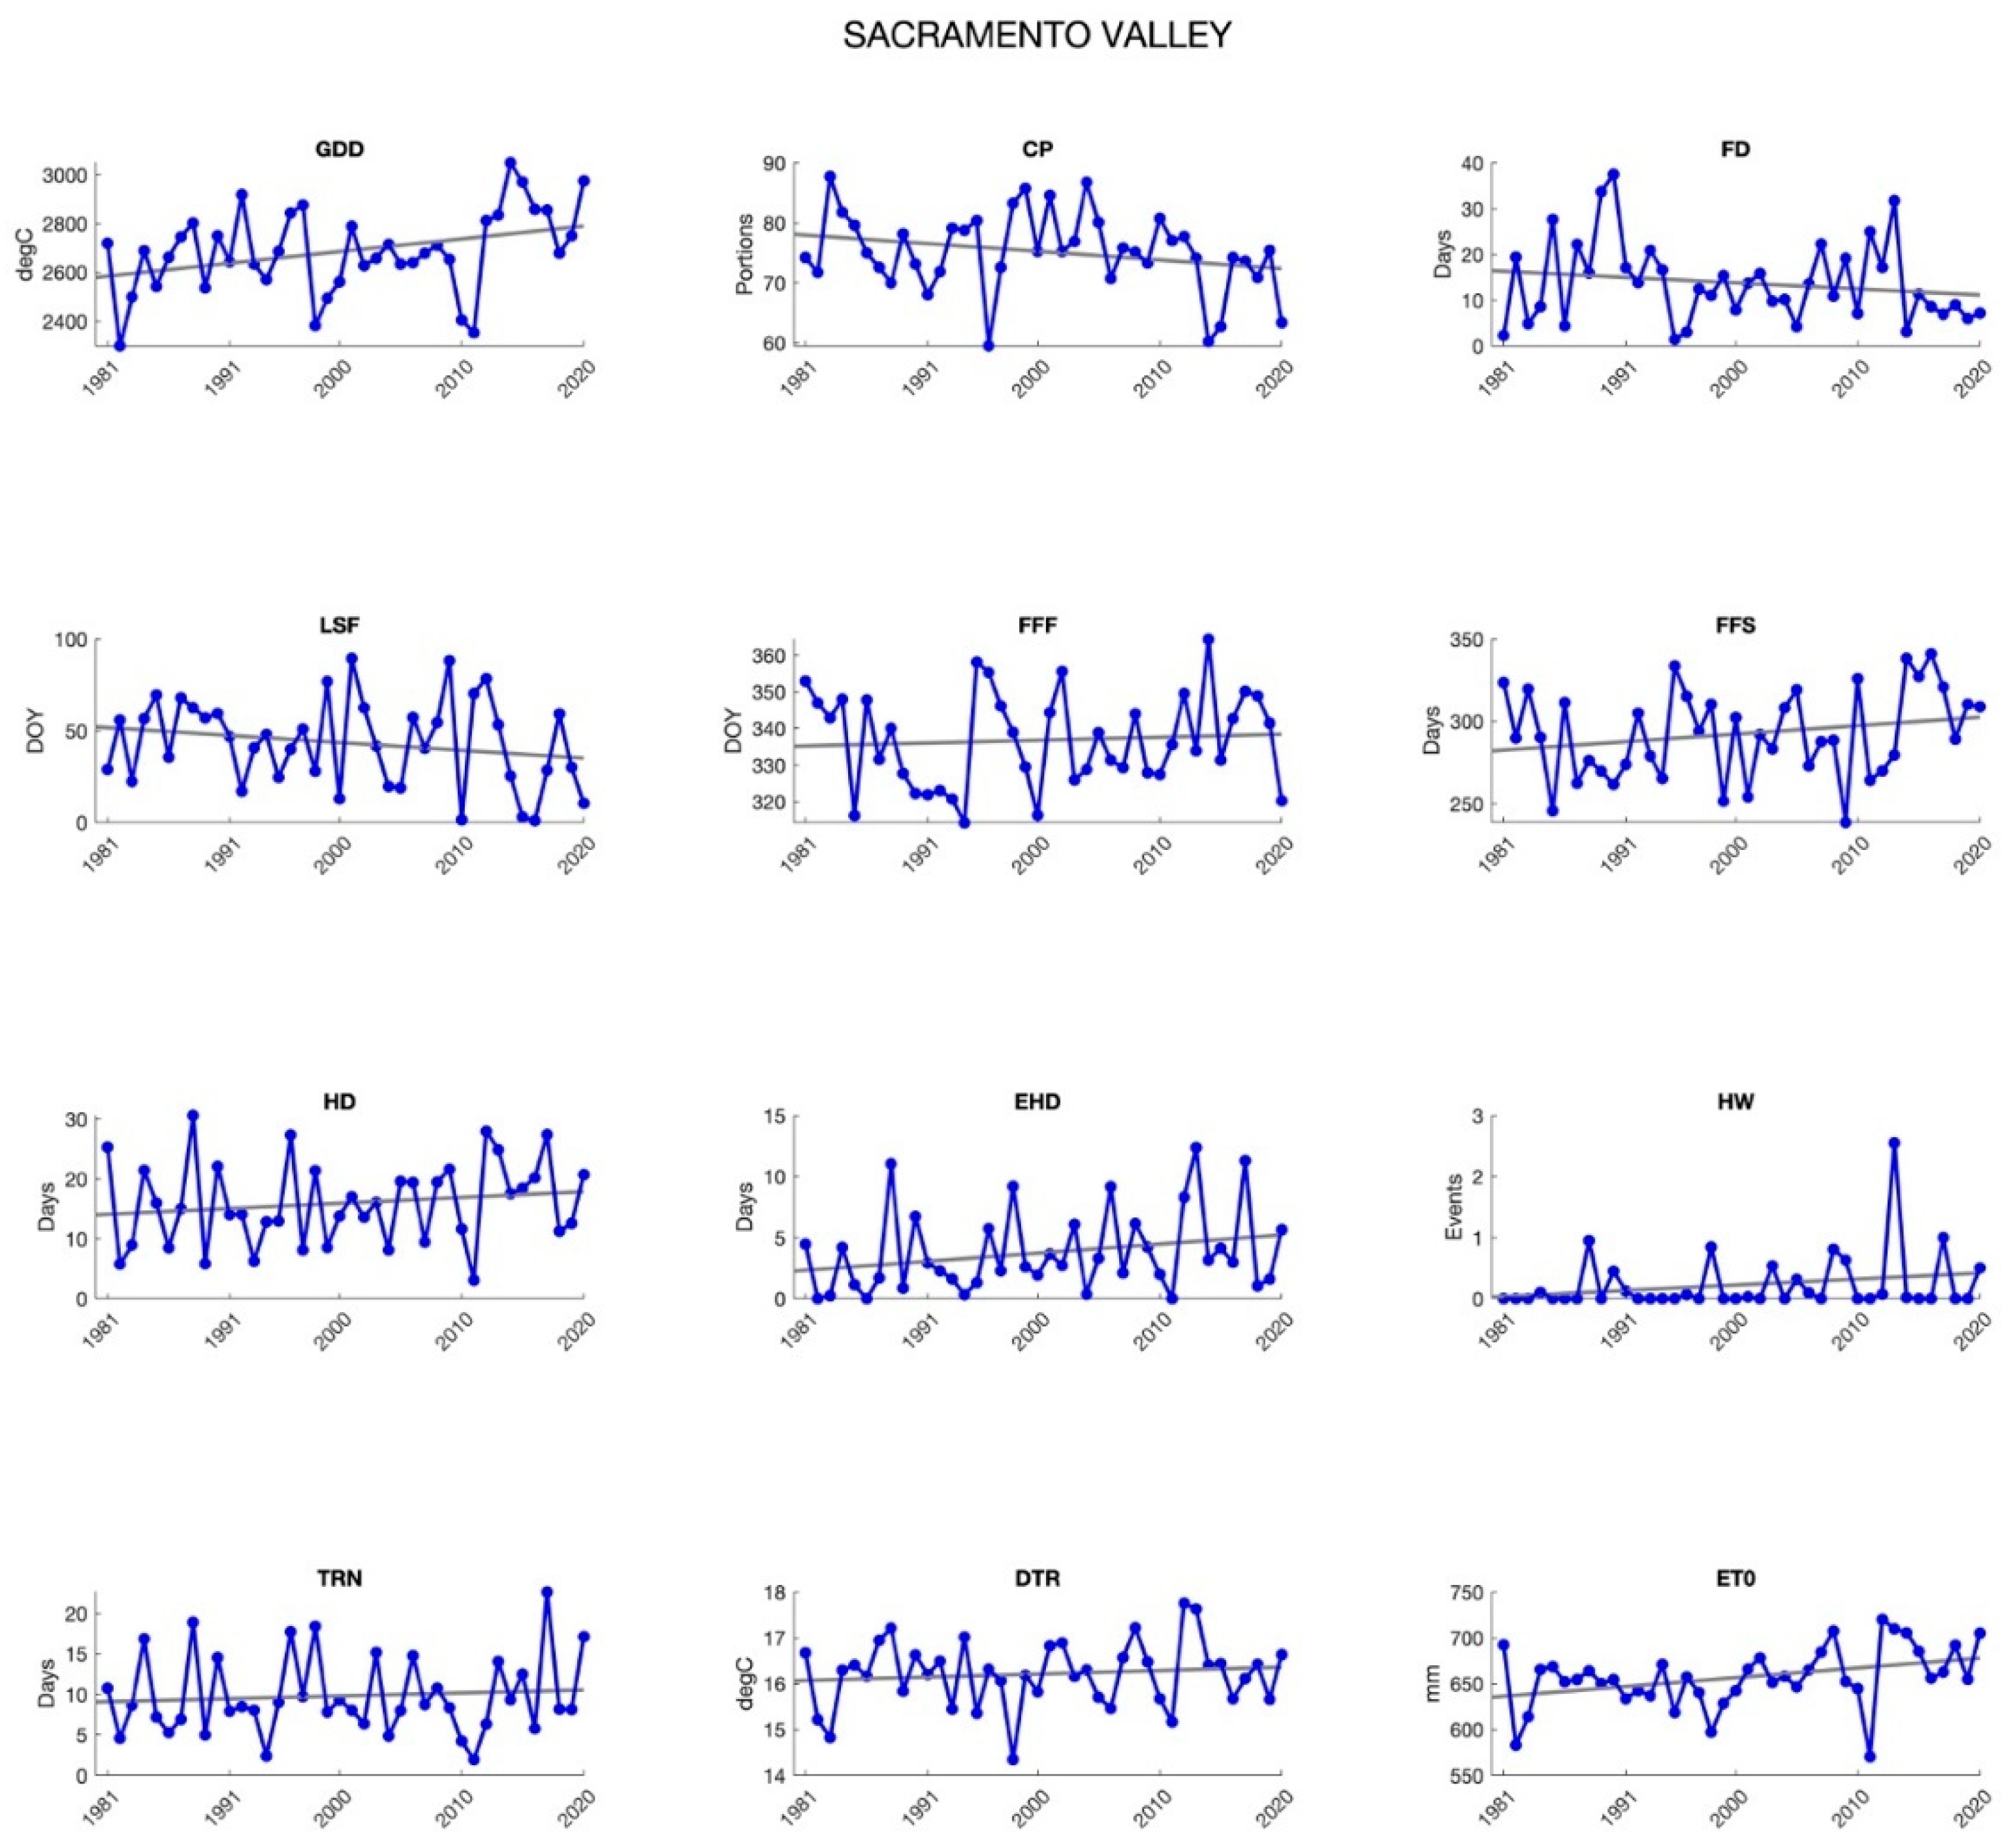
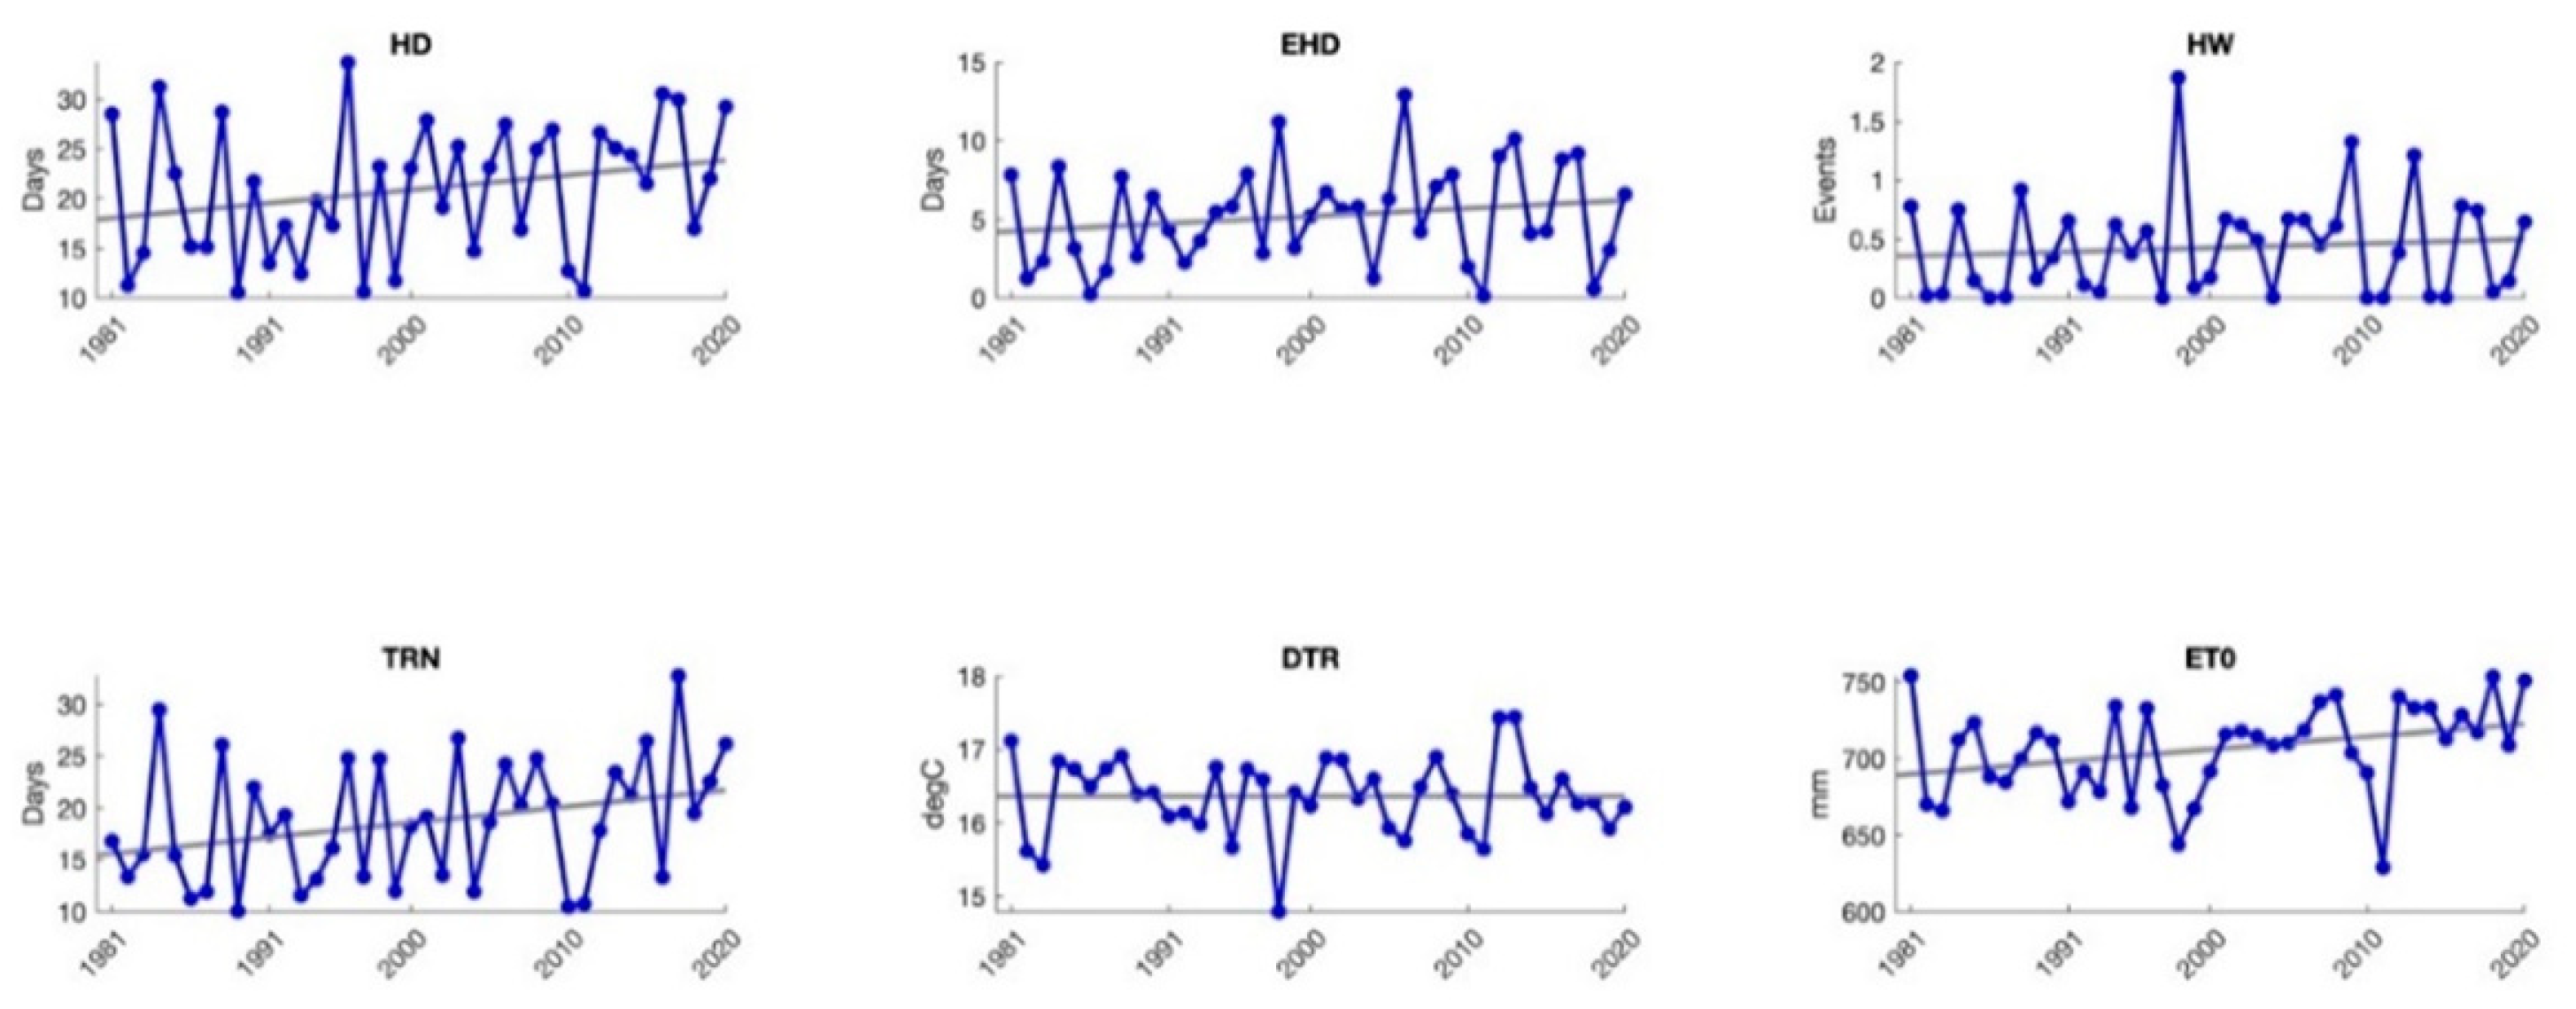
3.1.3. Sacramento and San Joaquin Valleys
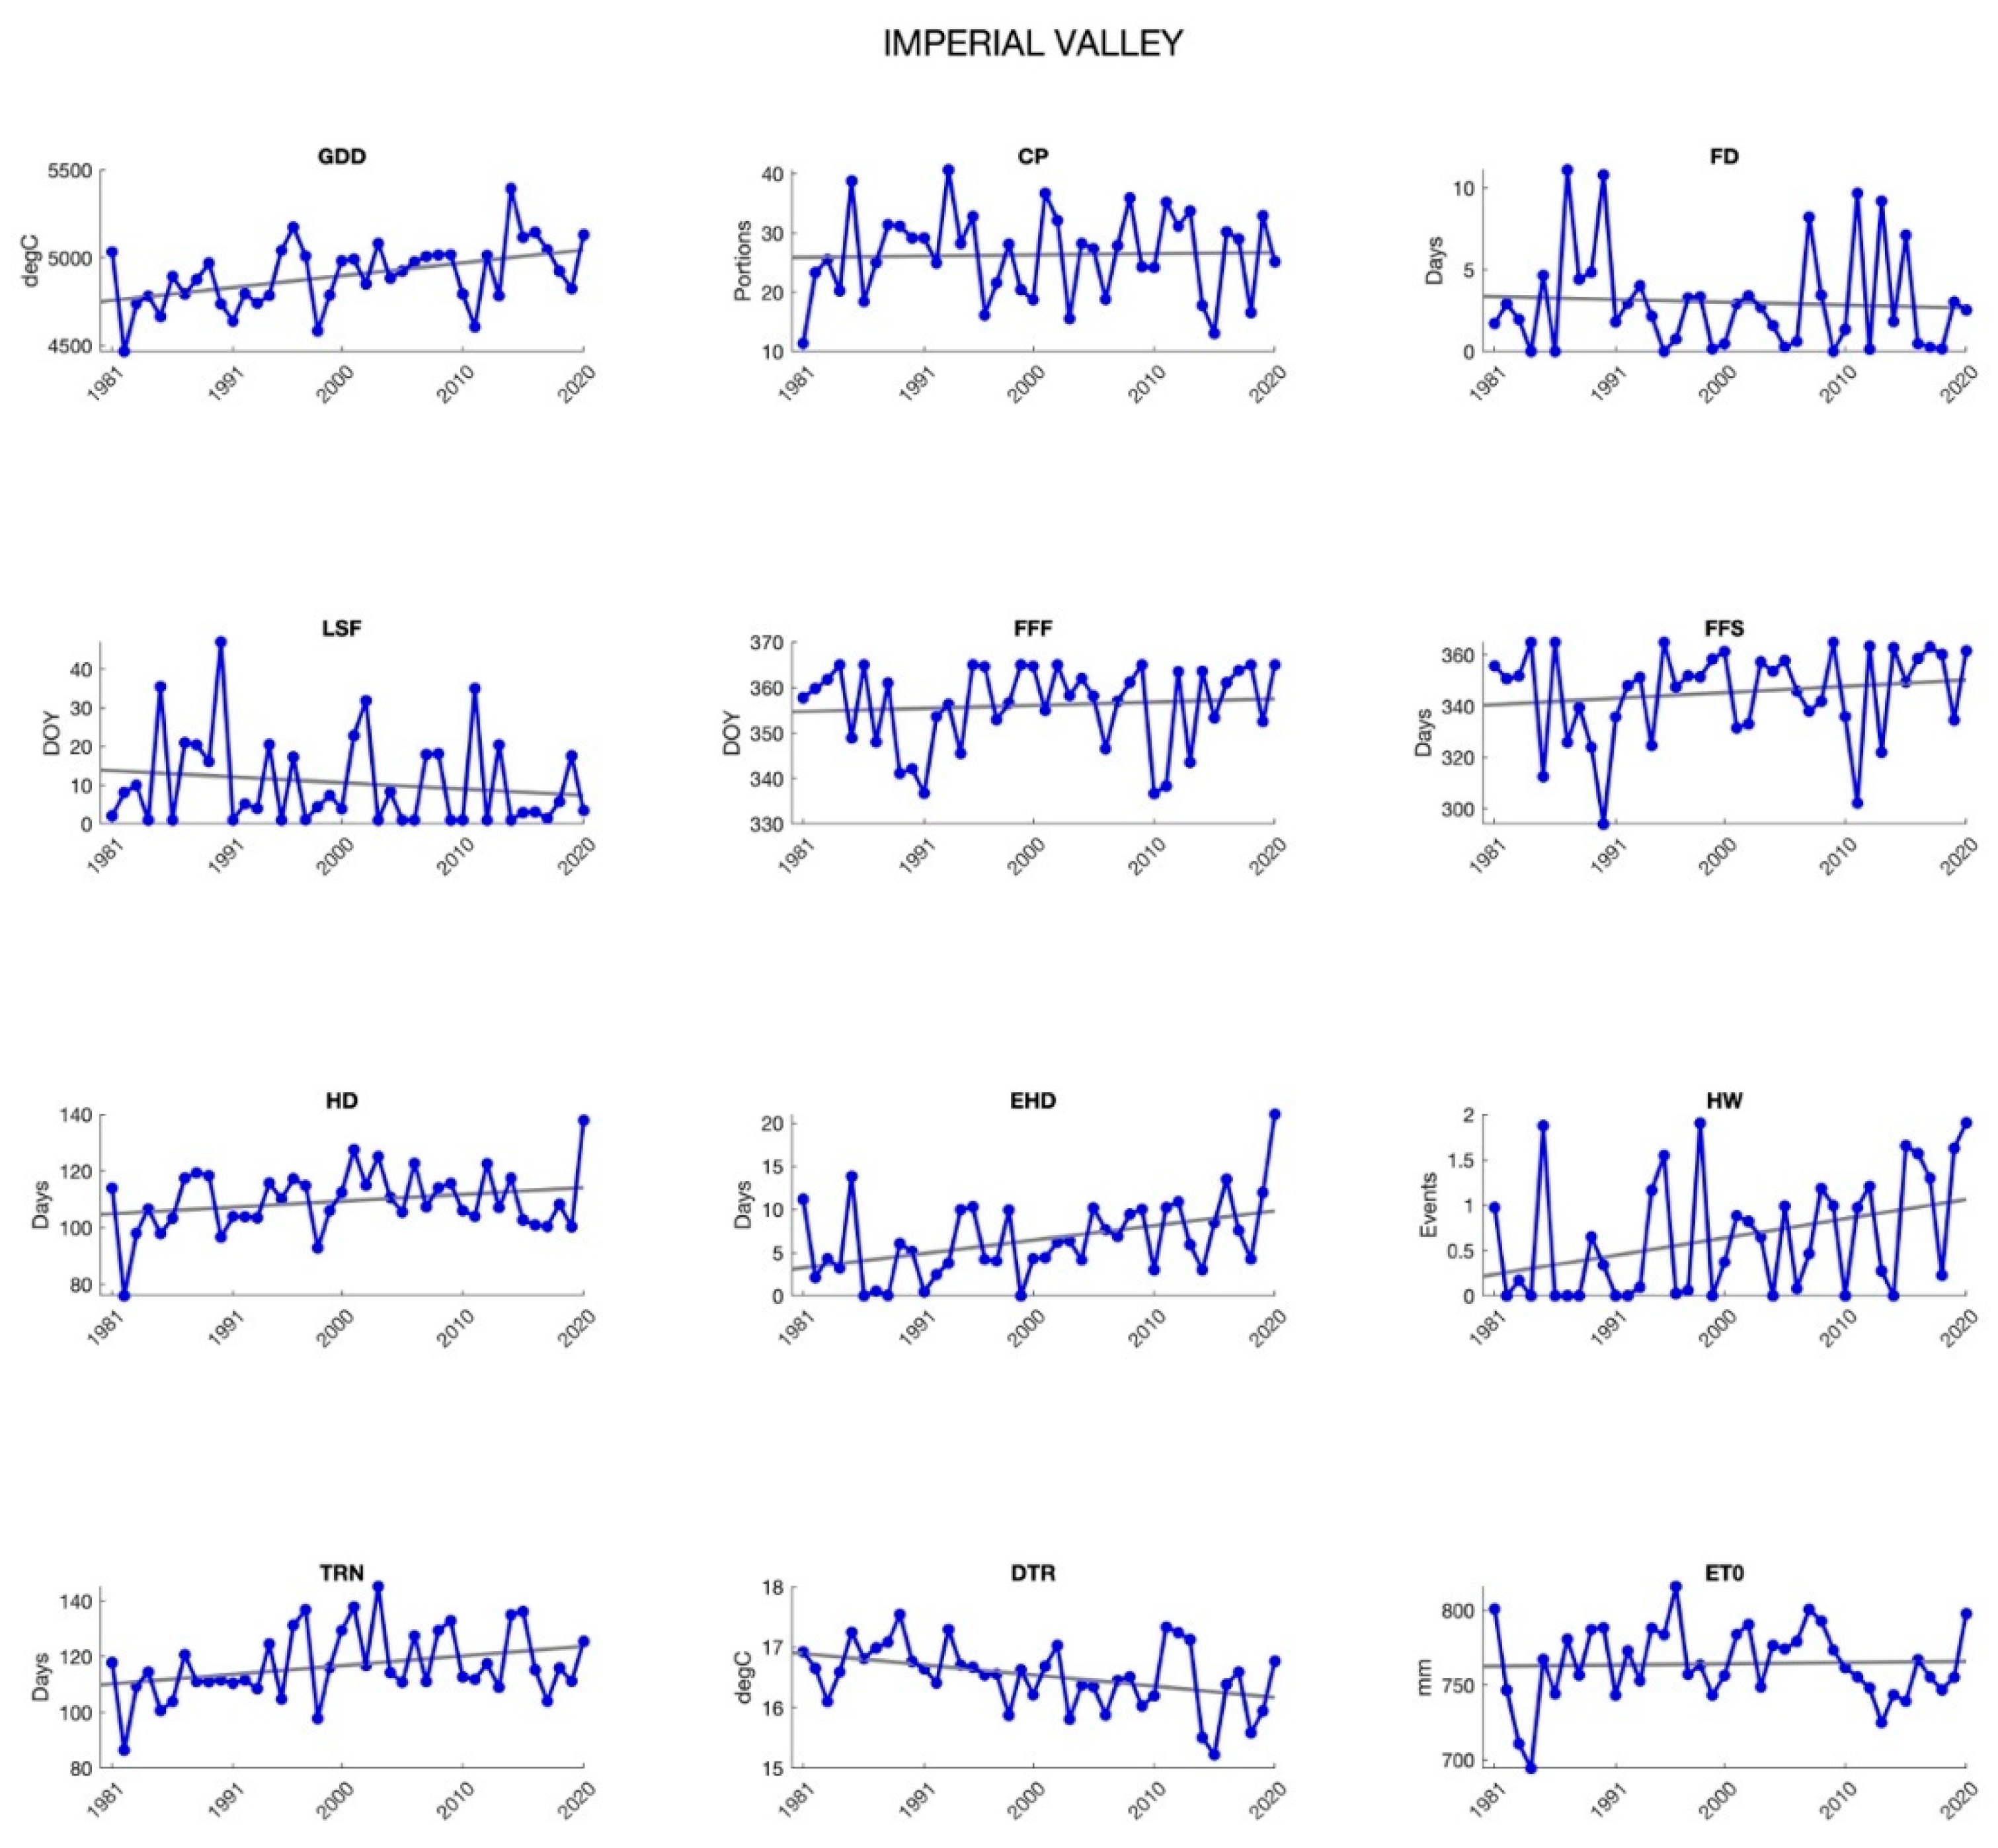
3.1.4. Coachella and Imperial Valleys
3.2. Adapting for the Future
4. Conclusions
Author Contributions
Funding
Data Availability Statement
Conflicts of Interest
Appendix A

| Agroclimate Metric | Calculation |
|---|---|
| Growing Degree Days (GDD) | GDD is calculated following [28]: Where Tbase = 10 °C |
| Chill Accumulation (as Chill Portions, CP) | Chill accumulation is calculated as chill portions (CP) [30] using hourly T calculated following [31]. Annual CP are accumulated 1st Nov–1st Mar [32]. [31] calculates hourly temperature for each day using daily maximum and minimum temperatures, and sunrise and sunset times. Hourly temperatures from sunrise to sunset are calculated as: Where T(t) is the temperature at time t after sunrise, Tx is the daily maximum temperature, Tn is the daily minimum temperature, and DL is the daylength in hours. Hourly temperatures from sunset to sunrise are calculated as: Where T(t) is the temperature at time t > 1 h after sunset, Ts is the temperature at sunset based on the equation above, Tn is the minimum daily temperature, and DL is the daylength in hours. The equations for calculating chill portions at time t (CPt) are: Where hourly temperature is in degrees Kelvin (TK), and the constants are: slp = 1.6 tetmlt = 277 a0 = 139,500 a1 = 2.567 × 10¹⁸ e0 = 4153.5 e1 = 12,888.8 |
| Reference Evapotranspiration (ETo) | ETo is calculated following the FAO Penman–Monteith method [27]. We calculate summer (June–August) average ETo for each year 1981–2020 for our analysis. ETo units are mm. The FAO Penman–Monteith formula for ETo is given in [27] as: where ETo is the reference evapotranspiration in units mm day−1 Rn is the net radiation at the crop surface in units MJ m−2 day−1 G is the soil heat flux density in units MJ m−2 day−1 T is the mean daily air temperature at 2 m height in units °C u2 is the wind speed at 2 m height in units m second−1 es is the mean daily saturation vapor pressure in units kPa ea is the mean daily vapor pressure in units kPa ∆ is the slope vapor pressure curve in units kPa °C−1 γ is the psychrometric constant in units kPa °C−1 |


References
- Lamb, P.J.; Changnon, S.A. On the “Best” Temperature and Precipitation Normals: The Illinois Situation. J. Appl. Meteorol. Climatol. 1981, 20, 1383–1390. [Google Scholar] [CrossRef][Green Version]
- Trewin, B. The Role of Climatological Normals in a Changing Climate; Baddour, O., Kontongomde, H., Eds.; WMO-TD No. 1377; World Meteorological Organization: Geneva, Switzerland, 2007; Available online: https://library.wmo.int/doc_num.php?explnum_id=4546 (accessed on 24 November 2021).
- World Meteorological Organization. WMO Guidelines on the Calculation of Climate Normal; World Meteorological Organization: Geneva, Switzerland, 2017. [Google Scholar]
- Fountain, H.; Kao, J. There’s a New Definition of “Normal” for Weather. (Original Work Published 2021). Available online: https://www.nytimes.com/interactive/2021/05/12/climate/climate-change-weather-noaa.html (accessed on 12 May 2021).
- Henson, B.; Samenow, J. NOAA Unveils New U.S. Climate “Normals” That Are Warmer than Ever. Washington Post. (Original Work Published 2021). Available online: https://www.washingtonpost.com/weather/2021/05/04/noaa-new-climate-normals/ (accessed on 4 May 2021).
- Ludden, J. Your Weather Forecast Update: Warmer Climate Will Be the New “Normal”. (Original Work Published 2021). Available online: https://www.npr.org/2021/04/07/983224262/your-weather-forecast-update-warmer-climate-will-be-the-new-normal (accessed on 7 April 2021).
- Arguez, A.; Durre, I.; Applequist, S.; Vose, R.S.; Squires, M.F.; Yin, X.; Heim, R.R.; Owen, T.W. NOAA’s 1981–2010 U.S. Climate Normals: An Overview. Bull. Am. Meteorol. Soc. 2012, 93, 1687–1697. [Google Scholar] [CrossRef]
- Katz, R.W.; Brown, B.G. Extreme events in a changing climate: Variability is more important than averages. Clim. Chang. 1992, 21, 289–302. [Google Scholar] [CrossRef]
- Román-Palacios, C.; Wiens, J.J. Recent responses to climate change reveal the drivers of species extinction and survival. Proc. Natl. Acad. Sci. USA 2020, 117, 4211–4217. [Google Scholar] [CrossRef]
- Woodward, F.I.; Lomas, M.R.; Kelly, C.K. Global climate and the distribution of plant biomes. Philos. Trans. R. Soc. B Biol. Sci. 2004, 359, 1465–1476. [Google Scholar] [CrossRef] [PubMed]
- California Department of Food and Agriculture. California Agricultural Statistics Review, 2019–2020. 2020; (Original work published 2020). Available online: https://www.cdfa.ca.gov/Statistics/PDFs/2020_Ag_Stats_Review.pdf (accessed on 24 November 2021).
- Macaulay, L.; Butsic, V. Ownership characteristics and crop selection in California cropland. Calif. Agric. 2017, 71, 221–230. [Google Scholar] [CrossRef]
- Lobell, D.; Cahill, K.N.; Field, C.B. Historical effects of temperature and precipitation on California crop yields. Clim. Chang. 2007, 81, 187–203. [Google Scholar] [CrossRef]
- Ortiz-Bobea, A.; Wang, H.; Carrillo, C.M.; Ault, T.R. Unpacking the climatic drivers of US agricultural yields. Environ. Res. Lett. 2019, 14, 064003. [Google Scholar] [CrossRef]
- Lobell, D.B.; Field, C.B.; Cahill, K.N.; Bonfils, C. Impacts of future climate change on California perennial crop yields: Model projections with climate and crop uncertainties. Agric. For. Meteorol. 2006, 141, 208–218. [Google Scholar] [CrossRef]
- Crimmins, T.M. Applying the USA National Phenology Network’s Growing Degree Day Maps in Making Management Decisions. J. Ext. 2018, 56, 2. [Google Scholar]
- Jagannathan, K.A. Ready-to-Use?—Bridging the Climate Science-Usability Gap for Adaptation; UC Berkeley: Berkeley, CA, USA, 2019; Available online: https://escholarship.org/uc/item/3q56j15f (accessed on 24 November 2021).
- Matthews, K.; Rivington, M.; Buchan, K.; Miller, D.; Bellocchi, G. Characterising the agro-meteorological implications of climate change scenarios for land management stakeholders. Clim. Res. 2008, 37, 59–75. [Google Scholar] [CrossRef]
- Zhu, X.; Troy, T.J. Agriculturally Relevant Climate Extremes and Their Trends in the World’s Major Growing Regions. Earth’s Futur. 2018, 6, 656–672. [Google Scholar] [CrossRef]
- Fernández-Long, M.E.; Müller, G.V.; Beltrán-Przekurat, A.; Scarpati, O.E. Long-term and recent changes in temperature-based agroclimatic indices in Argentina. Int. J. Clim. 2013, 33, 1673–1686. [Google Scholar] [CrossRef]
- Lalić, B.; Eitzinger, J.; Thaler, S.; Vučetić, V.; Nejedlik, P.; Eckersten, H.; Jaćimović, G.; Nikolić-Djorić, E. Can Agrometeorological Indices of Adverse Weather Conditions Help to Improve Yield Prediction by Crop Models? Atmosphere 2014, 5, 1020–1041. [Google Scholar] [CrossRef]
- Eitzinger, J.; Thaler, S.; Orlandini, S.; Nejedlik, P.; Kazandjiev, V.; Sivertsen, T.H.; Mihailovic, D. Applications of agroclimatic indices and process oriented crop simulation models in European agriculture. Idojaras 2009, 113, 1–12. [Google Scholar]
- Hatfield, J.L.; Antle, J.; Garrett, K.A.; Izaurralde, R.; Mader, T.; Marshall, E.; Nearing, M.; Robertson, G.P.; Ziska, L. Indicators of climate change in agricultural systems. Clim. Chang. 2020, 163, 1719–1732. [Google Scholar] [CrossRef]
- Tubiello, F.N.; Rosenzweig, C. Developing climate change impact metrics for agriculture. Integr. Assess. 2008, 8. Available online: http://116.203.146.222:8080/index.php/iaj/article/viewArticle/276 (accessed on 24 November 2021).
- Walsh, M.; Backlund, P.; Buja, L.; DeGaetano, A.; Melnick, R.; Prokopy, L.; Takle, E.; Todey, D.; Ziska, L. Climate Indicators for Agriculture; USDA Technical Bulletin 1953: Washington, DC, USA, 2020; pp. 1–70. [Google Scholar] [CrossRef]
- Johnson, R.; Cody, B.A. California Agricultural Production and Irrigated Water Use. 2015. Available online: https://nationalaglawcenter.org/wp-content/uploads/assets/crs/R44093.pdf (accessed on 23 September 2021).
- Allen, R.G.; Pereira, L.S.; Raes, D.; Smith, M. Crop evapotranspiration-Guidelines for computing crop water requirements-FAO Irrigation and drainage paper 56. Fao Rome 1998, 300, D05109. [Google Scholar]
- McMaster, G.S.; Wilhelm, W.W. Growing degree-days: One equation, two interpretations. Agric. For. Meteorol. 1997, 87, 291–300. [Google Scholar] [CrossRef]
- Jones, G.V.; Duff, A.A.; Hall, A. Spatial analysis of climate in winegrape growing regions in the western United States. Am. J. Enol. Vitic. 2010, 61, 313–326. Available online: https://www.ajevonline.org/content/61/3/313.short (accessed on 24 November 2021).
- Luedeling, E.; Brown, P.H. A global analysis of the comparability of winter chill models for fruit and nut trees. Int. J. Biometeorol. 2010, 55, 411–421. [Google Scholar] [CrossRef]
- Linvill, D.E. Calculating Chilling Hours and Chill Units from Daily Maximum and Minimum Temperature Observations. HortScience 1990, 25, 14–16. [Google Scholar] [CrossRef]
- Pope, K.S.; Dose, V.; Da Silva, D.; Brown, P.; DeJong, T.M. Nut crop yield records show that budbreak-based chilling requirements may not reflect yield decline chill thresholds. Int. J. Biometeorol. 2015, 59, 707–715. [Google Scholar] [CrossRef]
- Luedeling, E.; Zhang, M.; Girvetz, E.H. Climatic Changes Lead to Declining Winter Chill for Fruit and Nut Trees in California during 1950–2099. PLoS ONE 2009, 4, e6166. [Google Scholar] [CrossRef]
- Reyes, J.J.; Elias, E. Spatio-temporal variation of crop loss in the United States from 2001 to 2016. Environ. Res. Lett. 2019, 14, 074017. [Google Scholar] [CrossRef]
- Parker, L.; Pathak, T.; Ostoja, S. Climate change reduces frost exposure for high-value California orchard crops. Sci. Total Environ. 2021, 762, 143971. [Google Scholar] [CrossRef] [PubMed]
- Pathak, T.B.; Stoddard, C.S. Climate change effects on the processing tomato growing season in California using growing degree day model. Model. Earth Syst. Environ. 2018, 4, 765–775. [Google Scholar] [CrossRef]
- Trumble, J.T.; Butler, C.D. Climate change will exacerbate California’s insect pest problems. Calif. Agric. 2008, 63, 73–78. [Google Scholar] [CrossRef]
- Gaiotti, F.; Pastore, C.; Filippetti, I.; Lovat, L.; Belfiore, N.; Tomasi, D. Low night temperature at veraison enhances the accumulation of anthocyanins in Corvina grapes (Vitis vinifera L.). Sci. Rep. 2018, 8, 8719. [Google Scholar] [CrossRef] [PubMed]
- Aoki, Y.; Usujima, A.; Suzuki, S. High night temperature promotes downy mildew in grapevine via attenuating plant defence response and enhancing early Plasmopara viticola infection. Plant. Prot. Sci. 2020, 57, 21–30. [Google Scholar] [CrossRef]
- Cahill, K.N.; Lobell, D.B.; Field, C.B.; Bonfils, C.; Hayhoe, K. Modeling climate change impacts on wine grape yields and quality in California. Semin. Réchauffement Clim. Quels Impacts Probables Sur Les Vign. 2007, 28–30. Available online: https://www.researchgate.net/publication/237227560 (accessed on 24 November 2021).
- Greer, D.H.; Weston, C. Heat stress affects flowering, berry growth, sugar accumulation and photosynthesis of Vitis vinifera cv. Semillon grapevines grown in a controlled environment. Funct. Plant. Biol. 2010, 37, 206–214. [Google Scholar] [CrossRef]
- Parker, L.E.; McElrone, A.J.; Ostoja, S.M.; Forrestel, E.J. Extreme heat effects on perennial crops and strategies for sustaining future production. Plant. Sci. 2020, 295, 110397. [Google Scholar] [CrossRef] [PubMed]
- Marklein, A.; Elias, E.; Nico, P.; Steenwerth, K. Projected temperature increases may require shifts in the growing season of cool-season crops and the growing locations of warm-season crops. Sci. Total Environ. 2020, 746, 140918. [Google Scholar] [CrossRef]
- Gershunov, A.; Cayan, D.R.; Iacobellis, S.F. The Great 2006 Heat Wave over California and Nevada: Signal of an Increasing Trend. J. Clim. 2009, 22, 6181–6203. [Google Scholar] [CrossRef]
- Sheridan, S.C.; Lee, C. Temporal Trends in Absolute and Relative Extreme Temperature Events across North America. J. Geophys. Res. Atmos. 2018, 123, 11–889. [Google Scholar] [CrossRef]
- Martínez-Lüscher, J.; Chen, C.C.L.; Brillante, L.; Kurtural, S.K. Mitigating Heat Wave and Exposure Damage to “Cabernet Sauvignon” Wine Grape with Partial Shading under Two Irrigation Amounts. Front. Plant. Sci. 2020, 11, 1760. [Google Scholar] [CrossRef] [PubMed]
- Pathak, T.B.; Maskey, M.L.; Dahlberg, J.A.; Kearns, F.; Bali, K.M.; Zaccaria, D. Climate Change Trends and Impacts on California Agriculture: A Detailed Review. Agronomy 2018, 8, 25. [Google Scholar] [CrossRef]
- Cohen, S.D.; Tarara, J.M.; Kennedy, J.A. Diurnal Temperature Range Compression Hastens Berry Development and Modifies Flavonoid Partitioning in Grapes. Am. J. Enol. Vitic. 2011, 63, 112–120. [Google Scholar] [CrossRef]
- Cohen, S.D.; Tarara, J.M.; Gambetta, G.A.; Matthews, M.A.; Kennedy, J.A. Impact of diurnal temperature variation on grape berry development, proanthocyanidin accumulation, and the expression of flavonoid pathway genes. J. Exp. Bot. 2012, 63, 2655–2665. [Google Scholar] [CrossRef]
- Jones, G.V.; Reid, R.; Vilks, A. Climate, grapes, and wine: Structure and suitability in a variable and changing climate. In The Geography of Wine: Regions, Terroir and Techniques; Springer Press: Amsterdam, The Netherlands, 2012; pp. 109–133. [Google Scholar] [CrossRef]
- Zhang, J.; Guan, K.; Peng, B.; Jiang, C.; Zhou, W.; Yang, Y.; Pan, M.; Franz, T.E.; Heeren, D.M.; Rudnick, D.R.; et al. Challenges and opportunities in precision irrigation decision-support systems for center pivots. Environ. Res. Lett. 2021, 16, 053003. [Google Scholar] [CrossRef]
- Alston, J.M.; Lapsley, J.T.; Sambucci, O. Grape and wine production in California. California Agriculture: Dimensions and Issues. Giannini Found. Agric. Econ. 2018, 8, 1–28. [Google Scholar]
- Yang, L.; Jin, S.; Danielson, P.; Homer, C.; Gass, L.; Bender, S.M.; Case, A.; Costello, C.; Dewitz, J.; Fry, J.; et al. A new generation of the United States National Land Cover Database: Requirements, research priorities, design, and implementation strategies. ISPRS J. Photogramm. Remote. Sens. 2018, 146, 108–123. [Google Scholar] [CrossRef]
- Abatzoglou, J.T. Development of gridded surface meteorological data for ecological applications and modelling. Int. J. Clim. 2013, 33, 121–131. [Google Scholar] [CrossRef]
- Soule, P.T. A Comparison of 30-yr Climatic Temperature Normals for the Southeastern United States. Southeast. Geogr. 2005, 45, 16–24. [Google Scholar] [CrossRef]
- Shea, D. The Climate Data Guide: Trend Analysis. In National Center for Atmospheric Research Staff; NCAR Climate Data Guide; National Center for Atmospheric Research: Boulder, CO, USA, 2014; Available online: https://climatedataguide.ucar.edu/climate-data-tools-and-analysis/trend-analysis (accessed on 24 November 2021).
- California Department of Food and Agriculture. 2019 California Almond Acreage Report. 2020; (Original work published 2020). Available online: https://www.nass.usda.gov/Statistics_by_State/California/Publications/Specialty_and_Other_Releases/Almond/Acreage/202004almac.pdf (accessed on 24 November 2021).
- United States Department of Agriculture National Agricultural Statistics Service (USDA-NASS). 2019 California Walnut Acreage Report. 2020; (Original work published 2020). Available online: https://www.nass.usda.gov/Statistics_by_State/California/Publications/Specialty_and_Other_Releases/Walnut/Acreage/2020walac_revised.pdf (accessed on 24 November 2021).
- Volpe, R.; Green, R.; Helen, D.; Howitt, R. Recent Trends in the California Wine Grape Industry. Calif. Agric. 2010, 64, 42–46. [Google Scholar] [CrossRef][Green Version]
- California Department of Food and Agriculture. California Grape Acreage Report 2019 Crop. 2020. Available online: https://www.nass.usda.gov/Statistics_by_State/California/Publications/Specialty_and_Other_Releases/Grapes/Acreage/2020/202004gabtb00.pdf (accessed on 24 November 2021).
- Buttrose, M.S.; Hale, C.R. Effect of temperature on the composition of’Cabernet Sauvignon’berries. Am. J. Enol. Vitic. 1971, 22, 71–75. Available online: https://www.ajevonline.org/content/22/2/71.short?casa_token=65zS9BAqSyYAAAAA:h6uL_j7CMjoIFq6oV4FKYiwRQ269DAbD-60kETncsnUU35lv3jsCRCS3yVZ20XJ_w1w8oYQ (accessed on 24 November 2021).
- Kukal, M.S.; Irmak, S. U.S. Agro-Climate in 20th Century: Growing Degree Days, First and Last Frost, Growing Season Length, and Impacts on Crop Yields. Sci. Rep. 2018, 8, 6977. [Google Scholar] [CrossRef]
- Cordero, E.C.; Kessomkiat, W.; Abatzoglou, J.; Mauget, S.A. The identification of distinct patterns in California temperature trends. Clim. Chang. 2011, 108, 357–382. [Google Scholar] [CrossRef]
- Easterling, D.R. Recent changes in frost days and the frost-free season in the united states. Bull. Am. Meteorol. Soc. 2002, 83, 1327–1332. [Google Scholar] [CrossRef]
- Zhang, N.; Pathak, T.B.; Parker, L.E.; Ostoja, S.M. Impacts of large-scale teleconnection indices on chill accumulation for specialty crops in California. Sci. Total. Environ. 2021, 791, 148025. [Google Scholar] [CrossRef]
- Baldocchi, D.; Wong, S. Accumulated Winter Chill is Decreasing in the Fruit Growing Regions of California. Clim. Chang. 2008, 87, 153–166. [Google Scholar] [CrossRef]
- Kerr, A.; DiAlesandro, J.; Steenwerth, K.; Lopez-Brody, N.; Elias, E. Vulnerability of California specialty crops to projected mid-century temperature changes. Clim. Chang. 2017, 148, 419–436. [Google Scholar] [CrossRef]
- Sommer, L. As Warm Winters Mess with Nut Trees’ Sex Lives, Farmers Help Them “Netflix and Chill.” NPR. Available online: https://www.npr.org/sections/thesalt/2020/02/17/805688641/warm-winters-threaten-nut-trees-can-science-help-them-chill-out (accessed on 17 February 2020).
- Pathak, T.B.; Maskey, M.L.; Rijal, J.P. Impact of climate change on navel orangeworm, a major pest of tree nuts in California. Sci. Total. Environ. 2021, 755, 142657. [Google Scholar] [CrossRef]
- Ficklin, D.L.; Novick, K.A. Historic and projected changes in vapor pressure deficit suggest a continental-scale drying of the United States atmosphere. J. Geophys. Res. Atmos. 2017, 122, 2061–2079. [Google Scholar] [CrossRef]
- He, M.; Gautam, M. Variability and Trends in Precipitation, Temperature and Drought Indices in the State of California. Hydrology 2016, 3, 14. [Google Scholar] [CrossRef]
- Easterling, D.R.; Horton, B.; Jones, P.D.; Peterson, T.C.; Karl, T.R.; Parker, D.E.; Salinger, M.J.; Razuvayev, V.; Plummer, N.; Jamason, P.; et al. Maximum and minimum temperature trends for the globe. Science 1997, 277, 364–367. [Google Scholar] [CrossRef]
- Chen, S.; Fleischer, S.J.; Saunders, M.C.; Thomas, M.B. The Influence of Diurnal Temperature Variation on Degree-Day Accumulation and Insect Life History. PLoS ONE 2015, 10, e0120772. [Google Scholar] [CrossRef] [PubMed]
- Gambetta, J.M.; Holzapfel, B.P.; Stoll, M.; Friedel, M. Sunburn in Grapes: A Review. Front. Plant. Sci. 2021, 11, 2123. [Google Scholar] [CrossRef]
- Hartz, T.; Cantwell, M.; LeStrange, M.; Smith, R.; Aguiar, J.; Daugovish, O. Bell Pepper Production in California; University of California Agriculture and Natural Resources (UC ANR): Davis, CA, USA, 2008. [Google Scholar]
- Kanamaru, H.; Kanamitsu, M. Model Diagnosis of Nighttime Minimum Temperature Warming during Summer due to Irrigation in the California Central Valley. J. Hydrometeorol. 2008, 9, 1061–1072. [Google Scholar] [CrossRef]
- Gershunov, A.; Guirguis, K. California heat waves in the present and future. Geophys. Res. Lett. 2012, 39. [Google Scholar] [CrossRef]
- Cal-Adapt. Extreme Heat Days & Warm Nights. Cal-Adapt; UC Berkeley, California Energy Commission, California Strategic Growth Council. Available online: https://cal-adapt.org/tools/extreme-heat/ (accessed on 18 May 2021).
- McEvoy, D.J.; Pierce, D.W.; Kalansky, J.F.; Cayan, D.R.; Abatzoglou, J.T. Projected Changes in Reference Evapotranspiration in California and Nevada: Implications for Drought and Wildland Fire Danger. Earth’s Futur. 2020, 8, e2020EF001736. [Google Scholar] [CrossRef]
- Cayan, D.R.; Maurer, E.; Dettinger, M.D.; Tyree, M.; Hayhoe, K. Climate change scenarios for the California region. Clim. Chang. 2008, 87, 21–42. [Google Scholar] [CrossRef]
- Massoud, E.C.; Purdy, A.J.; Miro, M.E.; Famiglietti, J. Projecting groundwater storage changes in California’s Central Valley. Sci. Rep. 2018, 8, 12917. [Google Scholar] [CrossRef] [PubMed]
- Babbitt, C.; Dooley, D.; Hall, M.; Moss, R.; Orth, D.; Sawyers, G. Groundwater Pumping Allocations under California’s Sustainable Groundwater Management Act. Considerations for Groundwater Sustainability Agencies. Environmental Defense Fund and New Current Water and Land LLC. 2018. Available online: https://www.edf.org/sites/default/files/documents/edf_california_sgma_allocations.pdf (accessed on 24 November 2021).
- Dahlke, H.E.; LaHue, G.T.; Mautner, M.R.L.; Murphy, N.P.; Patterson, N.K.; Waterhouse, H.; Yang, F.; Foglia, L. Chapter Eight—Managed Aquifer Recharge as a Tool to Enhance Sustainable Groundwater Management in California: Examples from Field and Modeling Studies. In Advances in Chemical Pollution, Environmental Management and Protection; Friesen, J., Rodríguez-Sinobas, L., Eds.; Elsevier: Amsterdam, The Netherlands, 2018; Volume 3, pp. 215–275. [Google Scholar]
- Scanlon, B.R.; Reedy, R.C.; Faunt, C.C. Enhancing Drought Resilience with Conjunctive Use and Managed Aquifer Recharge in California and Arizona. The Environmentalist. 2016. Available online: https://iopscience.iop.org/article/10.1088/1748-9326/11/3/035013/meta (accessed on 24 November 2021).
- Abel, S.; Peters, A.; Trinks, S.; Schonsky, H.; Facklam, M.; Wessolek, G. Impact of biochar and hydrochar addition on water retention and water repellency of sandy soil. Geoderma 2013, 202–203, 183–191. [Google Scholar] [CrossRef]
- Jahanzad, E.; Holtz, B.A.; Zuber, C.A.; Doll, D.; Brewer, K.M.; Hogan, S.; Gaudin, A.C.M. Orchard recycling improves climate change adaptation and mitigation potential of almond production systems. PLoS ONE 2020, 15, e0229588. [Google Scholar] [CrossRef]
- Martínez-Blanco, J.; Lazcano, C.; Christensen, T.H.; Muñoz, P.; Rieradevall, J.; Møller, J.; Antón, A.; Boldrin, A. Compost benefits for agriculture evaluated by life cycle assessment. A review. Agron. Sustain. Dev. 2013, 33, 721–732. [Google Scholar] [CrossRef]
- Arguez, A.; Vose, R.S. The Definition of the Standard WMO Climate Normal: The Key to Deriving Alternative Climate Normals. Bull. Am. Meteorol. Soc. 2011, 92, 699–704. [Google Scholar] [CrossRef]
- Livezey, R.E.; Vinnikov, K.Y.; Timofeyeva, M.M.; Tinker, R.; Dool, H.M.V.D. Estimation and Extrapolation of Climate Normals and Climatic Trends. J. Appl. Meteorol. Clim. 2007, 46, 1759–1776. [Google Scholar] [CrossRef]
- Hulme, M.; Dessai, S.; Lorenzoni, I.; Nelson, D.R. Unstable climates: Exploring the statistical and social constructions of “normal” climate. Geoforum 2009, 40, 197–206. [Google Scholar] [CrossRef]


| Agroclimate Metric | Calculation | Relevance to Specialty Crop Production |
|---|---|---|
| Growing Degree Days (GDD) | GDD is calculated following [28] using Tbase = 10 °C. |
|
| Chill Accumulation (as Chill Portions, CP) | Chill accumulation is calculated as chill portions (CP) [30] using hourly T calculated following [31]. Annual CP are accumulated 1st Nov–1st Mar [32]. |
|
| Frost Days (FD) | FD are the number of days per year with minimum temperatures (Tn) ≤ 0 °C. |
|
| Last Spring Freeze (LSF) | The LSF is defined as the last day of the calendar year prior to 30 June with a Tn ≤ 0 °C. | |
| First Fall Freeze(FFF) | The FFF is defined as the first day of the calendar year commencing 1 July with Tn ≤ 0 °C. |
|
| Freeze-Free Season (FFS) | The FFS is calculated as the difference between the LSF and FFF (FFF [minus] LSF). |
|
| Tropical Nights (TRN) | TRN are calculated as the number of nights per year with Tn > 20 °C. | |
| Hot Days (HD) | The number of days per year with Tx > 38 °C [41,42]. |
|
| Extreme Heat Days (EHD) | EHD are the number of days per year with Tx >98th percentile of summer (June-August) Tx for the 1981–2010 period [42]. |
|
| Heatwaves (HW) | HW events are defined as 3 + consecutive days [44,45] with Tx > 98th percentile of 1981–2010 summer Tx (as in EHD). | |
| Diurnal Temperature Range (DTR) | DTR is the difference between daily Tx and Tn. We calculate DTR over 1 March to 1 November. | |
| Reference Evapotranspiration (ETo) | ETo is calculated following the FAO Penman–Monteith method [27]. We calculate summer (June-August) average ETo for each year 1981–2020 for our analysis. ETo units are mm. |
|
| Crop | % U.S. Production in California | Value ($1000 USD) | Total California Area (Hectares) |
|---|---|---|---|
| Almonds | >99% [11] | 6,094,440 [11] | 360,642 (hectares bearing and non-bearing; [57]) |
| Walnuts | >99% [11] | 1,286,410 [11] | 178,062 (hectares bearing and non-bearing; [58]) |
| Winegrapes | >90% [59] | 3,806,320 [11] | 193,052 (hectares bearing and non-bearing; [60]) |
| Lettuces | 52% [11] | 1,824,435 [11] | 76,364 (hectares harvested; [11]) |
| Tomatoes | 73% [11] | 1,174,395 [11] | 100,241 (hectares harvested; [11]) |
| Agro-Climate Metric | North Coast | ||||
|---|---|---|---|---|---|
| 1981–2010 | 1991–2020 | (1991–2020)–(1981–2010) | (1991–2020)–(1981–2010) (%) | 40-year (1981–2020) Trend | |
| GDD (°C) | 1927.9 | 1986.5 | 58.6 | 3.0 | 198.2 |
| CP (portions) | 80.0 | 78.0 | −2.0 | −2.5 | −5.6 |
| FD (days) | 16.0 | 14.6 | −1.3 | −6.7 | 0.9 |
| LSF (day of year) | 47.4 | 46.4 | −1.1 | 3.5 | 5.5 |
| FFF (day of year) | 340.2 | 339.3 | −0.9 | −0.2 | −8.7 |
| FFS (days) | 292.3 | 292.4 | 0.1 | 0.4 | −14.7 |
| TRN (days) | 1.5 | 1.8 | 0.3 | 34.0 | 1.2 |
| HD (days) | 3.6 | 4.0 | 0.4 | 38.0 | 2.2 |
| EHD (days) | 2.5 | 2.9 | 0.5 | 35.9 | 2.1 |
| HW (events) | 0.1 | 0.2 | 0 | 48.2 | 0 |
| DTR (°C) | 15.9 | 15.9 | 0 | −0.3 | −0.1 |
| ETo (mm) | 625.1 | 629.9 | 4.8 | 0.7 | 36.4 |
| Central Coast | |||||
| 1981–2010 | 1991–2020 | (1991–2020)–(1981–2010) | (1991–2020)–(1981–2010) (%) | 40-year (1981–2020) Trend | |
| GDD (°C) | 2017.0 | 2094.1 | 77.1 | 3.9 | 244.7 |
| CP (portions) | 66.3 | 64.2 | −2.1 | −3.2 | −4.8 |
| FD (days) | 14.1 | 12.8 | −1.3 | −13.3 | −1.1 |
| LSF (day of yr) | 36.3 | 34 | −2.3 | −1.9 | −1.8 |
| FFF (day of yr) | 343.5 | 344.2 | 0.8 | 0.2 | −0.7 |
| FFS (days) | 306.9 | 310 | 3.0 | 1.5 | 2.2 |
| TRN (days) | 1.5 | 1.9 | 0.4 | 43.1 | 1 |
| HD (days) | 3.2 | 3.8 | 0.6 | 56.1 | 2.6 |
| EHD (days) | 3.6 | 4.9 | 1.3 | 47.2 | 4.7 |
| HW (events) | 0.2 | 0.4 | 0.2 | 70.9 | 0.4 |
| DTR (°C) | 14.9 | 14.9 | −0.1 | −0.5 | −0.4 |
| ETo (mm) | 555.6 | 558.6 | 2.9 | 0.5 | 26.3 |
| Salinas Valley | |||||
| 1981–2010 | 1991–2020 | (1991–2020)–(1981–2010) | (1991–2020)–(1981–2010) (%) | 40-year (1981–2020) Trend | |
| GDD (°C) | 2013.4 | 2088.5 | 75.1 | 3.8 | 230.4 |
| CP (portions) | 67.2 | 65.4 | −1.8 | −2.7 | −4.7 |
| FD (days) | 22.7 | 21.5 | −1.2 | −2.8 | 0.6 |
| LSF (day of yr) | 54.7 | 49.9 | −4.8 | −2.3 | −10.3 |
| FFF (day of yr) | 330.1 | 331.5 | 1.4 | 0.4 | 2.9 |
| FFS (days) | 274.8 | 281.0 | 6.2 | 2.7 | 8.4 |
| TRN (days) | 0.6 | 0.7 | 0.1 | 22.4 | 0.2 |
| HD (days) | 8.0 | 9.3 | 1.2 | 46.4 | 5.2 |
| EHD (days) | 4.5 | 5.8 | 1.3 | 40.8 | 4.9 |
| HW (events) | 0.3 | 0.5 | 0.2 | 64.4 | 0.6 |
| DTR (°C) | 17.0 | 17.0 | 0.0 | 0.1 | 0.1 |
| ETo (mm) | 576.7 | 580.6 | 4 | 0.7 | 31.7 |
| Sacramento Valley | |||||
| 1981–2010 | 1991–2020 | (1991–2020)–(1981–2010) | (1991–2020)–(1981–2010) (%) | 40-year (1981–2020) Trend | |
| GDD (°C) | 2642.3 | 2707.3 | 65.0 | 2.5 | 221.3 |
| CP (portions) | 76.4 | 74.5 | −1.9 | −2.5 | −5.3 |
| FD (days) | 14.2 | 12.4 | −1.8 | −12.3 | −7.3 |
| LSF (day of yr) | 45.1 | 39.9 | −5.2 | −11.4 | −22.4 |
| FFF (day of yr) | 335.6 | 336.8 | 1.3 | 0.4 | 1.3 |
| FFS (days) | 289.7 | 296.2 | 6.5 | 2.3 | 21.9 |
| TRN (days) | 8.2 | 8.2 | 0.0 | −2.3 | 0.2 |
| HD (days) | 15.1 | 15.8 | 0.7 | 5.2 | 5.2 |
| EHD (days) | 3.4 | 4.0 | 0.6 | 20.9 | 2.5 |
| HW (events) | 0.2 | 0.3 | 0.1 | 66.2 | 0.0 |
| DTR (°C) | 16.4 | 16.5 | 0.0 | 0.2 | 0.0 |
| ETo (mm) | 650.6 | 659.4 | 8.8 | 1.4 | 37.4 |
| San Joaquin Valley | |||||
| 1981–2010 | 1991–2020 | (1991–2020)–(1981–2010) | (1991–2020)–(1981–2010) (%) | 40-year (1981–2020) Trend | |
| GDD (°C) | 2878.8 | 2947.3 | 68.5 | 2.4 | 237.4 |
| CP (portions) | 73.3 | 71.5 | −1.8 | −2.5 | −5.7 |
| FD (days) | 15.6 | 14.4 | −1.2 | −8.4 | −0.6 |
| LSF (day of yr) | 41.2 | 37.9 | −3.3 | −7.2 | −10.4 |
| FFF (day of yr) | 334.6 | 336.4 | 1.8 | 0.5 | 6.0 |
| FFS (days) | 292.6 | 297.7 | 5.1 | 1.8 | 12.4 |
| TRN (days) | 18.1 | 19.5 | 1.4 | 5.4 | 7.5 |
| HD (days) | 21.8 | 23.2 | 1.4 | 6.1 | 8.0 |
| EHD (days) | 5.7 | 6.1 | 0.5 | 9.6 | 2.7 |
| HW (events) | 0.5 | 0.5 | 0.0 | 9.5 | 0.1 |
| DTR (°C) | 16.5 | 16.5 | 0.0 | 0.0 | −0.2 |
| ETo (mm) | 702.7 | 708.7 | 6.0 | 0.8 | 40.5 |
| Coachella Valley | |||||
| 1981–2010 | 1991–2020 | (1991–2020)–(1981–2010) | (1991–2020)–(1981–2010) (%) | 40-year (1981–2020) Trend | |
| GDD (°C) | 4720.4 | 4820.8 | 100.4 | 2.1 | 415.4 |
| CP (portions) | 30.4 | 30.1 | −0.4 | −1.2 | 0.6 |
| FD (days) | 6.0 | 5.5 | −0.5 | −8.6 | −1.3 |
| LSF (day of yr) | 17.8 | 13.9 | −3.9 | −22.7 | −13.2 |
| FFF (day of yr) | 348.4 | 348.6 | 0.2 | 0 | 3.2 |
| FFS (days) | 330.2 | 334.3 | 4.1 | 1.3 | 21.7 |
| TRN (days) | 106 | 112.4 | 6.4 | 6.0 | 26.6 |
| HD (days) | 111.9 | 113.5 | 1.6 | 1.4 | 2.7 |
| EHD (days) | 11.0 | 12.3 | 1.3 | 12.0 | 5.2 |
| HW (events) | 1.3 | 1.5 | 0.2 | 13.3 | 0.2 |
| DTR (°C) | 17.6 | 17.3 | −0.3 | −1.9 | −1.6 |
| ETo (mm) | 826.7 | 828.4 | 1.7 | 0.2 | 4.2 |
| Imperial Valley | |||||
| 1981–2010 | 1991–2020 | (1991–2020)–(1981–2010) | (1991–2020)–(1981–2010) (%) | 40-year (1981–2020) Trend | |
| GDD (°C) | 4848.2 | 4913 | 64.7 | 1.3 | 292.8 |
| CP (portions) | 26.5 | 26.9 | 0.3 | 1.3 | 0.7 |
| FD (days) | 3.2 | 2.9 | −0.2 | −8.2 | −1.0 |
| LSF (day of yr) | 11.9 | 9.7 | −2.2 | −19.4 | −0.2 |
| FFF (day of yr) | 354.8 | 355.6 | 0.8 | 0.2 | 2.9 |
| FFS (days) | 342.7 | 345.7 | 3.1 | 0.9 | 10.3 |
| TRN (days) | 115.3 | 118.4 | 3.1 | 2.7 | 11.7 |
| HD (days) | 109.4 | 111.1 | 1.7 | 1.5 | 4.4 |
| EHD (days) | 5.2 | 6.8 | 1.6 | 31.9 | 7.1 |
| HW (events) | 0.5 | 0.7 | 0.2 | 48.1 | 0.6 |
| DTR (°C) | 16.7 | 16.5 | −0.2 | −1.0 | −0.8 |
| ETo (mm) | 759.7 | 758.1 | −1.6 | −0.2 | −5.4 |
Publisher’s Note: MDPI stays neutral with regard to jurisdictional claims in published maps and institutional affiliations. |
© 2022 by the authors. Licensee MDPI, Basel, Switzerland. This article is an open access article distributed under the terms and conditions of the Creative Commons Attribution (CC BY) license (https://creativecommons.org/licenses/by/4.0/).
Share and Cite
Parker, L.E.; Zhang, N.; Abatzoglou, J.T.; Ostoja, S.M.; Pathak, T.B. Observed Changes in Agroclimate Metrics Relevant for Specialty Crop Production in California. Agronomy 2022, 12, 205. https://doi.org/10.3390/agronomy12010205
Parker LE, Zhang N, Abatzoglou JT, Ostoja SM, Pathak TB. Observed Changes in Agroclimate Metrics Relevant for Specialty Crop Production in California. Agronomy. 2022; 12(1):205. https://doi.org/10.3390/agronomy12010205
Chicago/Turabian StyleParker, Lauren E., Ning Zhang, John T. Abatzoglou, Steven M. Ostoja, and Tapan B. Pathak. 2022. "Observed Changes in Agroclimate Metrics Relevant for Specialty Crop Production in California" Agronomy 12, no. 1: 205. https://doi.org/10.3390/agronomy12010205
APA StyleParker, L. E., Zhang, N., Abatzoglou, J. T., Ostoja, S. M., & Pathak, T. B. (2022). Observed Changes in Agroclimate Metrics Relevant for Specialty Crop Production in California. Agronomy, 12(1), 205. https://doi.org/10.3390/agronomy12010205