Article

Evaluating the Effect of Cover Materials on Greenhouse Microclimates and Thermal Performance

1
Department of Agricultural Engineering, National Institute of Agricultural Sciences, RDA, Jeonju 54875, Korea
2
Department of Bio-Industrial Machinery Engineering, Jeonbuk National University, Jeonju 54896, Korea
*
Author to whom correspondence should be addressed.
Agronomy 2022, 12(1), 143; https://doi.org/10.3390/agronomy12010143
Submission received: 7 December 2021 / Revised: 4 January 2022 / Accepted: 5 January 2022 / Published: 7 January 2022
(This article belongs to the Section Agricultural Biosystem and Biological Engineering)

Abstract

:
This study compared and analyzed changes in the microclimate and thermal environment inside single-span greenhouses covered with a single layer of plastic film, polycarbonate (PC), and glass. The results of the experiment show that the PC-covered greenhouse was the most favorable for managing the nighttime heating effect during the cold season. However, the glass-covered greenhouse was found to be the most favorable for managing the cooling effect during the hot season. Although the plastic-covered greenhouse was inexpensive and easy to install, the air temperature inside varied significantly, and it was difficult to control its indoor environment. The thermal load leveling values showed that the PC-covered greenhouse had the lowest variation, confirming its superiority in terms of environmental control and energy savings. In terms of the overall heat transfer, heat was generally transferred from the interior to the exterior of the greenhouses. In the plastic-covered greenhouse, however, heat was transferred in the opposite direction at night due to the influence of radiant cooling. The occurrence of the minimum and maximum heat transfer values had a tendency similar to that of the occurrence of the minimum and maximum air temperatures inside the greenhouses.

1. Introduction

Various crops can be grown in a stable manner in greenhouses, despite any harsh outdoor conditions in cold and hot seasons. The microclimate suitable for crop growth inside greenhouses must be maintained throughout the year [1]. The need for cooling and heating in greenhouses is steadily increasing; however, greenhouse cultivation involves high energy consumption [2,3,4,5,6]. In South Korea, the cost of heating greenhouses is a burden because it accounts for 30–40% of the cost of managing greenhouse horticulture [7,8,9]. However, the cooling load is known to consume much more energy than heating; thus, greenhouse crop cultivation is generally not performed during the hot season (July to August) in South Korea [10].
Greenhouse covering materials are used to maintain the microclimate inside greenhouses at a level suitable for the cultivation of crops; thus, they can be considered very important determinants of the cooling and heating energy load [11,12]. Baneshi et al. [13] reported that the use of appropriate greenhouse covering materials can reduce the annual cooling and heating loads by 9.8% and 6.3%, respectively. These energy loads can be classified into heat loss from transmission and infiltration, and ground heat exchange [14,15]. Among these, the heat lost via transmission is associated with convection, conduction, and radiation transfer through greenhouse covering materials; it accounts for the majority of the total heat loss [11,15,16,17,18]. Shin and Nam [15] reported that the heat lost from transmission through greenhouse covering materials accounts for 84.7–95.4% of the total greenhouse heating load. Therefore, it is necessary to improve the heat resistance of greenhouse covering materials, as they are currently insufficient at ensuring that the energy load management requirements for greenhouses are met [1].
In Europe, greenhouse cultivation is expanding from the temperate zone to warmer locations such as the Northern and Southern Mediterranean Basins. The area under cultivation using plastic greenhouses amounts to 1 MMha not only in Europe, but also in North Africa, South America, and China [19]. Thus, horticultural facilities are being used for the cultivation of various crops in many countries, and the types of greenhouse covering materials are as diverse as the climate environments in different areas worldwide. Ideal greenhouse covering materials that can be used worldwide do not exist [20]. A covering material that works well in South Korea, for example, may not be useful in other countries. The local climate, cover material production and management capabilities, and crop cultivation methods are critical considerations in the selection of greenhouse covering materials [21].
Greenhouse covering materials influence microclimates inside the greenhouse, such as temperature and humidity. Selecting scientifically proven greenhouse covering materials for a particular climate can contribute greatly to the stability of internal environmental conditions [22,23]. Furthermore, Statuto et al. [24] used plastic nets in different climate conditions to compare and analyze microclimate changes inside greenhouses, especially temperature reduction effects. Selecting greenhouse covering materials appropriate for the climate environment in various regions is a crucial consideration for horticulture facilities.
In South Korea, greenhouse cultivation is a very important part of agricultural production; greenhouses cover an area of approximately 51,226 ha. Plastic-covered greenhouses make up the majority of this area (50,876 ha), followed by glass- and polycarbonate (PC)-covered greenhouses (285 ha and 65 ha, respectively) [25]. Plastic film has, thus far, been the covering customarily used in greenhouse farms in the country. Recently installed modern greenhouses tend to use PC or glass as a covering material. The selection of covering materials, however, mainly depends on farmer experience, and studies that investigated the thermal properties of covering materials in an actual greenhouse environment are lacking. Therefore, it is very important to identify the overall thermal environment of greenhouses based on the materials used to cover them to ensure economical and stable agricultural production year-round in Korean greenhouses.
Thus, this study compared and analyzed changes in the microclimate and thermal environment inside greenhouses in South Korea based on the materials used to cover them. To this end, changes in temperature, humidity, and surface temperature in the interior of single-span greenhouses covered with a single layer of plastic film, PC, and glass were compared and analyzed, as were changes in thermal load leveling (TLL) and heat flux.

2. Materials and Methods

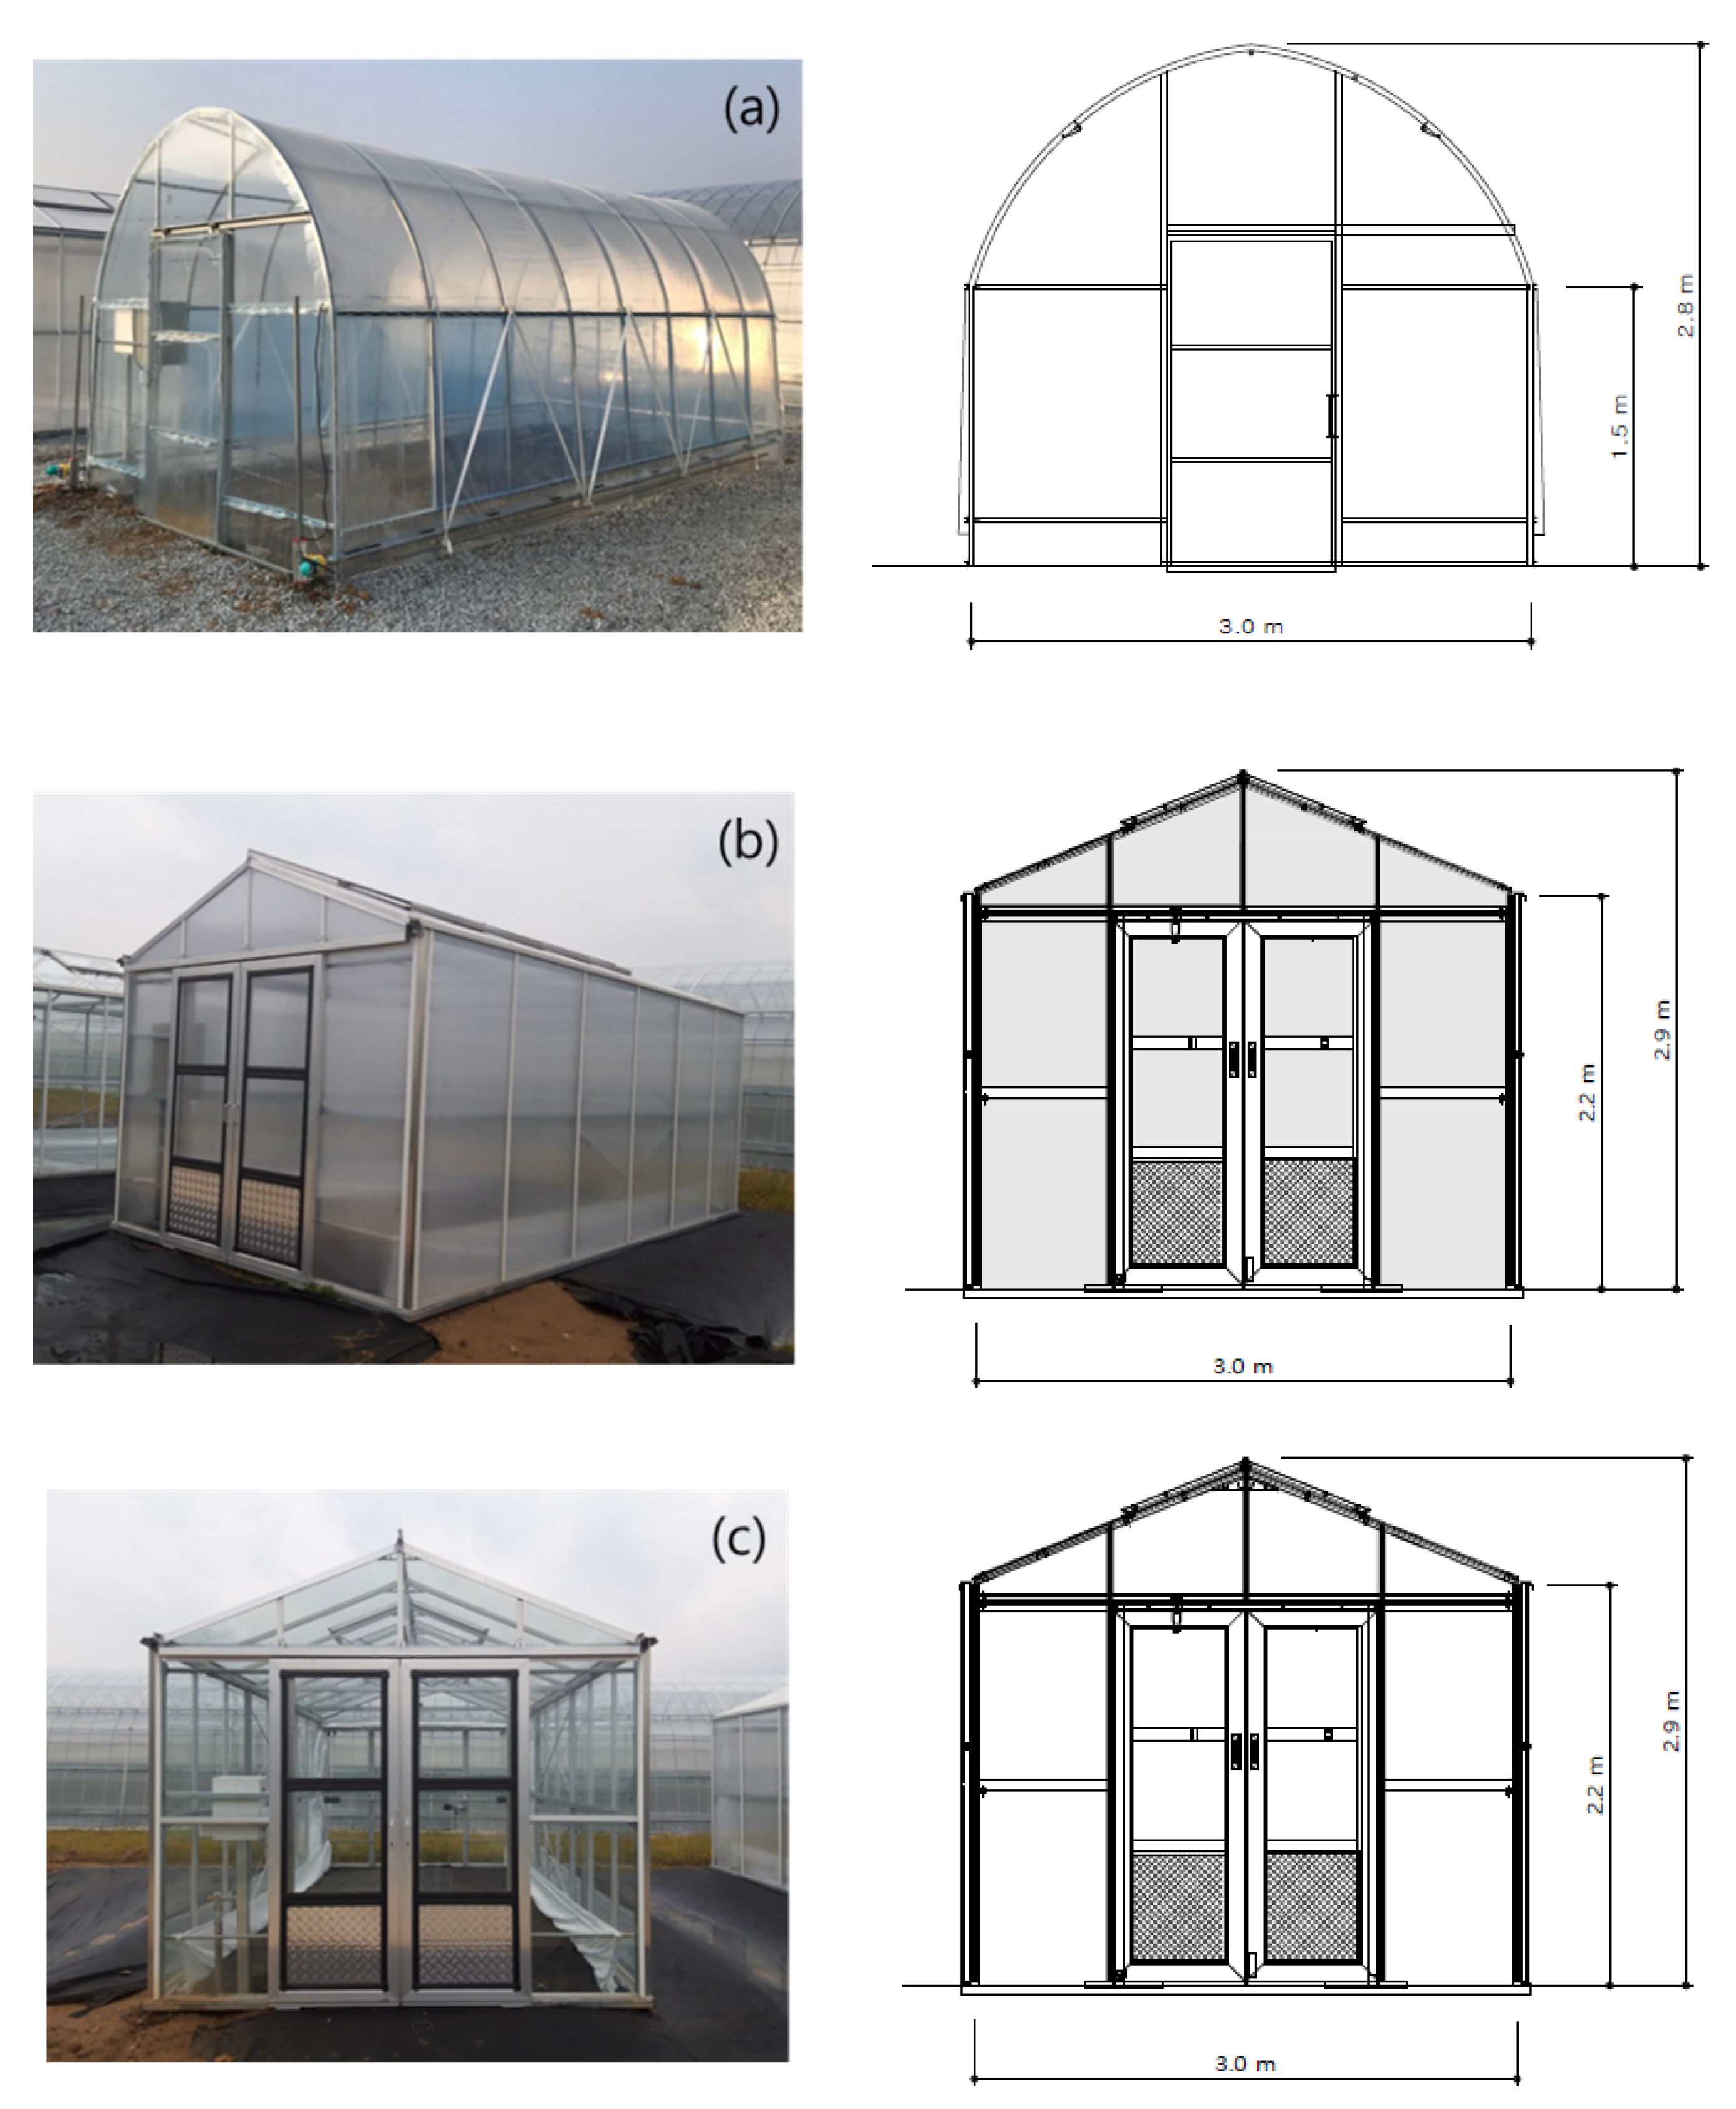
2.1. Experimental Greenhouses

Experiments were performed in three single-span greenhouses at the Department of Agricultural Engineering of the South Korean Rural Development Administration (35°82′ N, 127°05′ E); each greenhouse was covered with a single layer of covering material. They were installed adjacent to each other, at 6.4 m intervals, and oriented east to west. Each had a floor area of 18 m2 (3 × 6 m). One greenhouse had a plastic-covered arch shape with eaves 1.5 m high and ridges 2.8 m high. It was covered with 0.15 mm polyolefin (PO) film. The other two greenhouses were even-span types and covered with glass and PC that were 4.0 mm and 6.0 mm thick, respectively. Both of these had eaves 2.2 m high and ridges 2.9 m high. Figure 1 shows the experimental greenhouses, and the thickness and thermal properties of the greenhouse covering materials are presented in Table 1.

2.2. Measurements

Experiments were performed on clear days when no cultivation was occurring (12–13, 19–20, and 26–27 October 2019). All greenhouses were closed during the experimental periods, and no ventilation devices such as side and roof openings were used. The experiments were performed in the non-heating and cooling states without additional insulation and shading materials. To analyze changes in the microclimate and thermal load inside the greenhouses based on the materials they were covered with, the temperature, relative humidity, solar radiation, and wind speed outside the greenhouses and the temperature, relative humidity, and temperature of the cover surface inside them were measured.
The temperature and humidity inside and outside each of the covered greenhouses were measured at two points 1.5 m from the ground using a KCC 320 data logger (Kimo Instruments, Montpon, France), and the values were averaged for later use. The accuracy of this data logger is ± 0.5 °C within a range of 0–50 °C, and with a measurement resolution of 0.1 °C.
The solar radiation outside the greenhouses was measured using a thermal sensor (SR05–A1, Hukseflux, The Netherlands) located 4.0 m above the ground. The sensitivity of this sensor is 10 × 10−6 V/W m−2 within a related operating temperature of −40–80 °C and a spectral range of 285–3000 × 10−9 m. The solar radiation data were stored using an LI–19 data logger (Hukseflux, The Netherlands) with a related operating temperature of −10–40 °C.
The outdoor wind speed was measured approximately 4.0 m above the ground using a wind sensor (7911, Davis Instruments, Hayward, CA, USA) with an accuracy of 1.0 m s−1 over a range of 0.5–89 m s−1, with a measurement resolution of 0.1 m s−1, and recorded with a wind speed data logger (CR 1000, Campbell Scientific, Logan, Utah, USA).
The surface temperature inside the greenhouse was measured using two TR-0206 screw-down sensors (T&D Corporation, Matsumoto, Japan) and stored using a data logger (TR-71wf, T&D Corporation, Matsumoto, Japan). The accuracy of the data sensor is ± 0.3 °C within a range of −20–80 °C, with a resolution of 0.1 °C. The inner cover surface temperature was averaged based on two loggers installed at a height of 1 m on both the southern and northern interior walls of the greenhouse.
All measurement data were recorded at 5 min intervals. There were no significant changes in the clear weather conditions during the experimental periods. Therefore, all experimental data were averaged and presented as a one-day result.

2.3. TLL and Overall Heat Transfer Determination

The indoor air temperature of greenhouses fluctuates due to variation in solar radiation and the outdoor air temperature, which are both time dependent. Likewise, fluctuations are observed in the greenhouse microclimates. Therefore, thermal load leveling (TLL) is needed to compare the indoor air temperature change and thermal performance according to the greenhouse covering material. TLL should be close to zero to attain low fluctuations in the indoor air temperature and thermal stability inside the greenhouse. TLL is defined as [30,31,32,33,34]
TLL = T i n ,   max   T i n ,     m i n T i n ,   max   + T i n ,     m i n
where Tin, max is the maximum air temperature in the greenhouse (°C), and Tin, min is the minimum air temperature in the greenhouse (°C).
The heat flux in each greenhouse, assuming steady-state conditions, was calculated using the following equation [15,16,17,29,35,36,37]:
Q   = U   A c   ( T i n T o u t )
where Q is the overall heat transfer (W); Ac is the area of the greenhouse covered with the covering material (m2); Tin and Tout are the average interior and exterior temperatures, respectively; and U is the overall heat transfer coefficient (W m−2 °C−1). The U values of the greenhouses covered with a single layer of plastic film, PC, and glass were 6.4, 5.8, and 5.8 W m−2 °C−1, respectively [14].

3. Results and Discussion

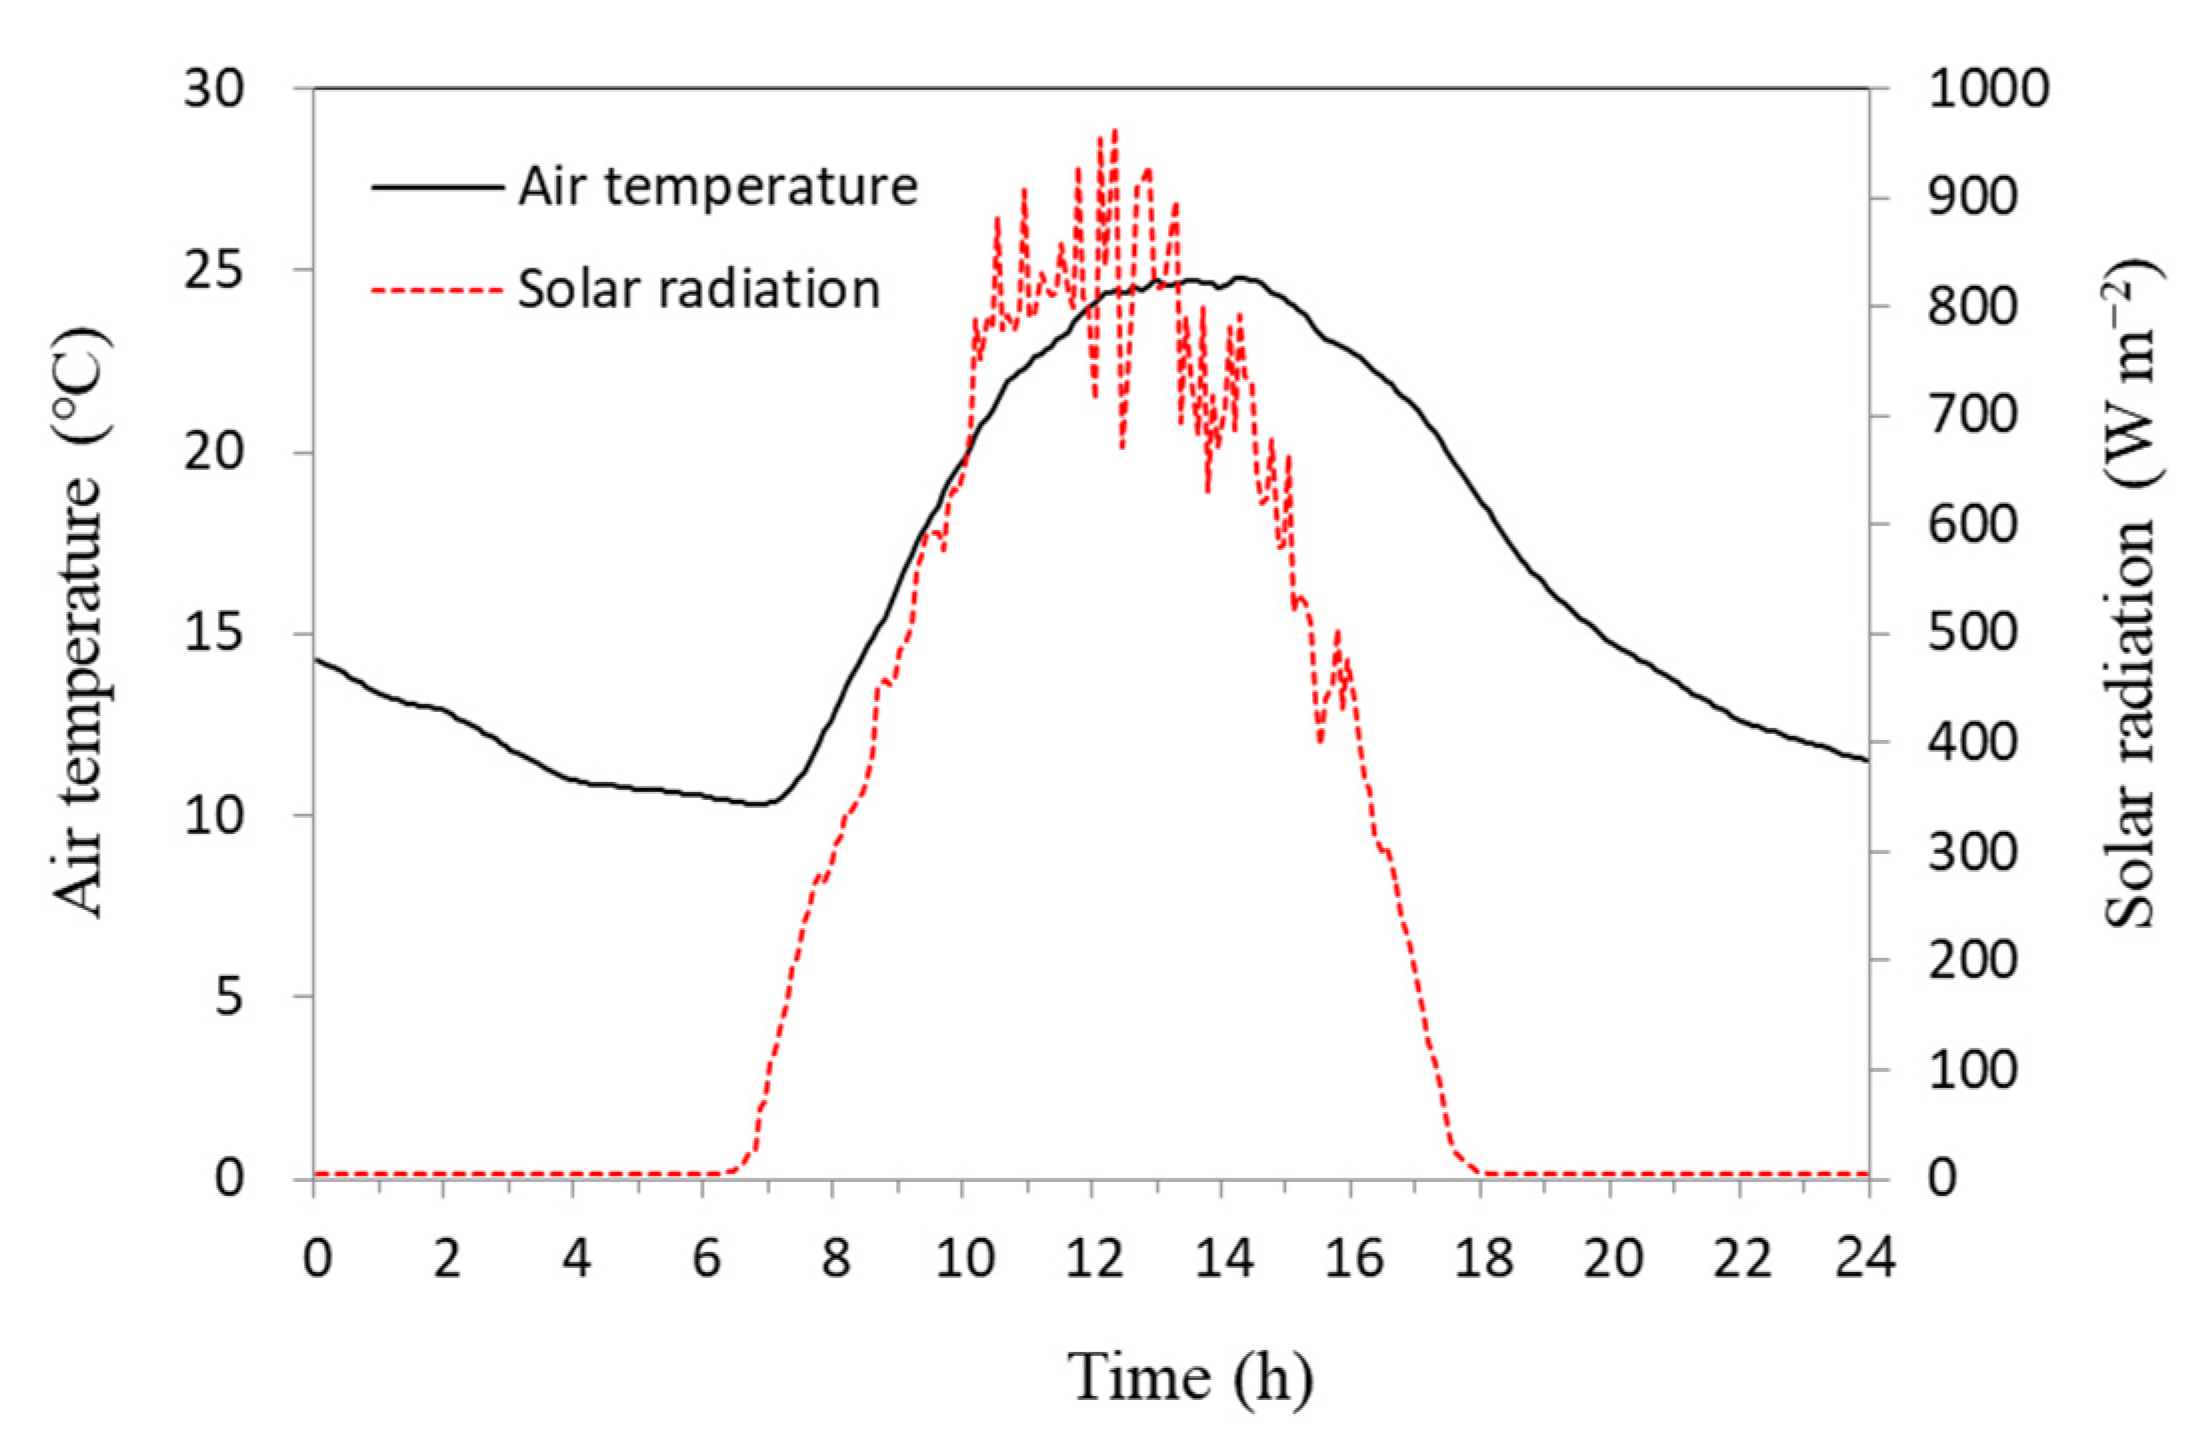
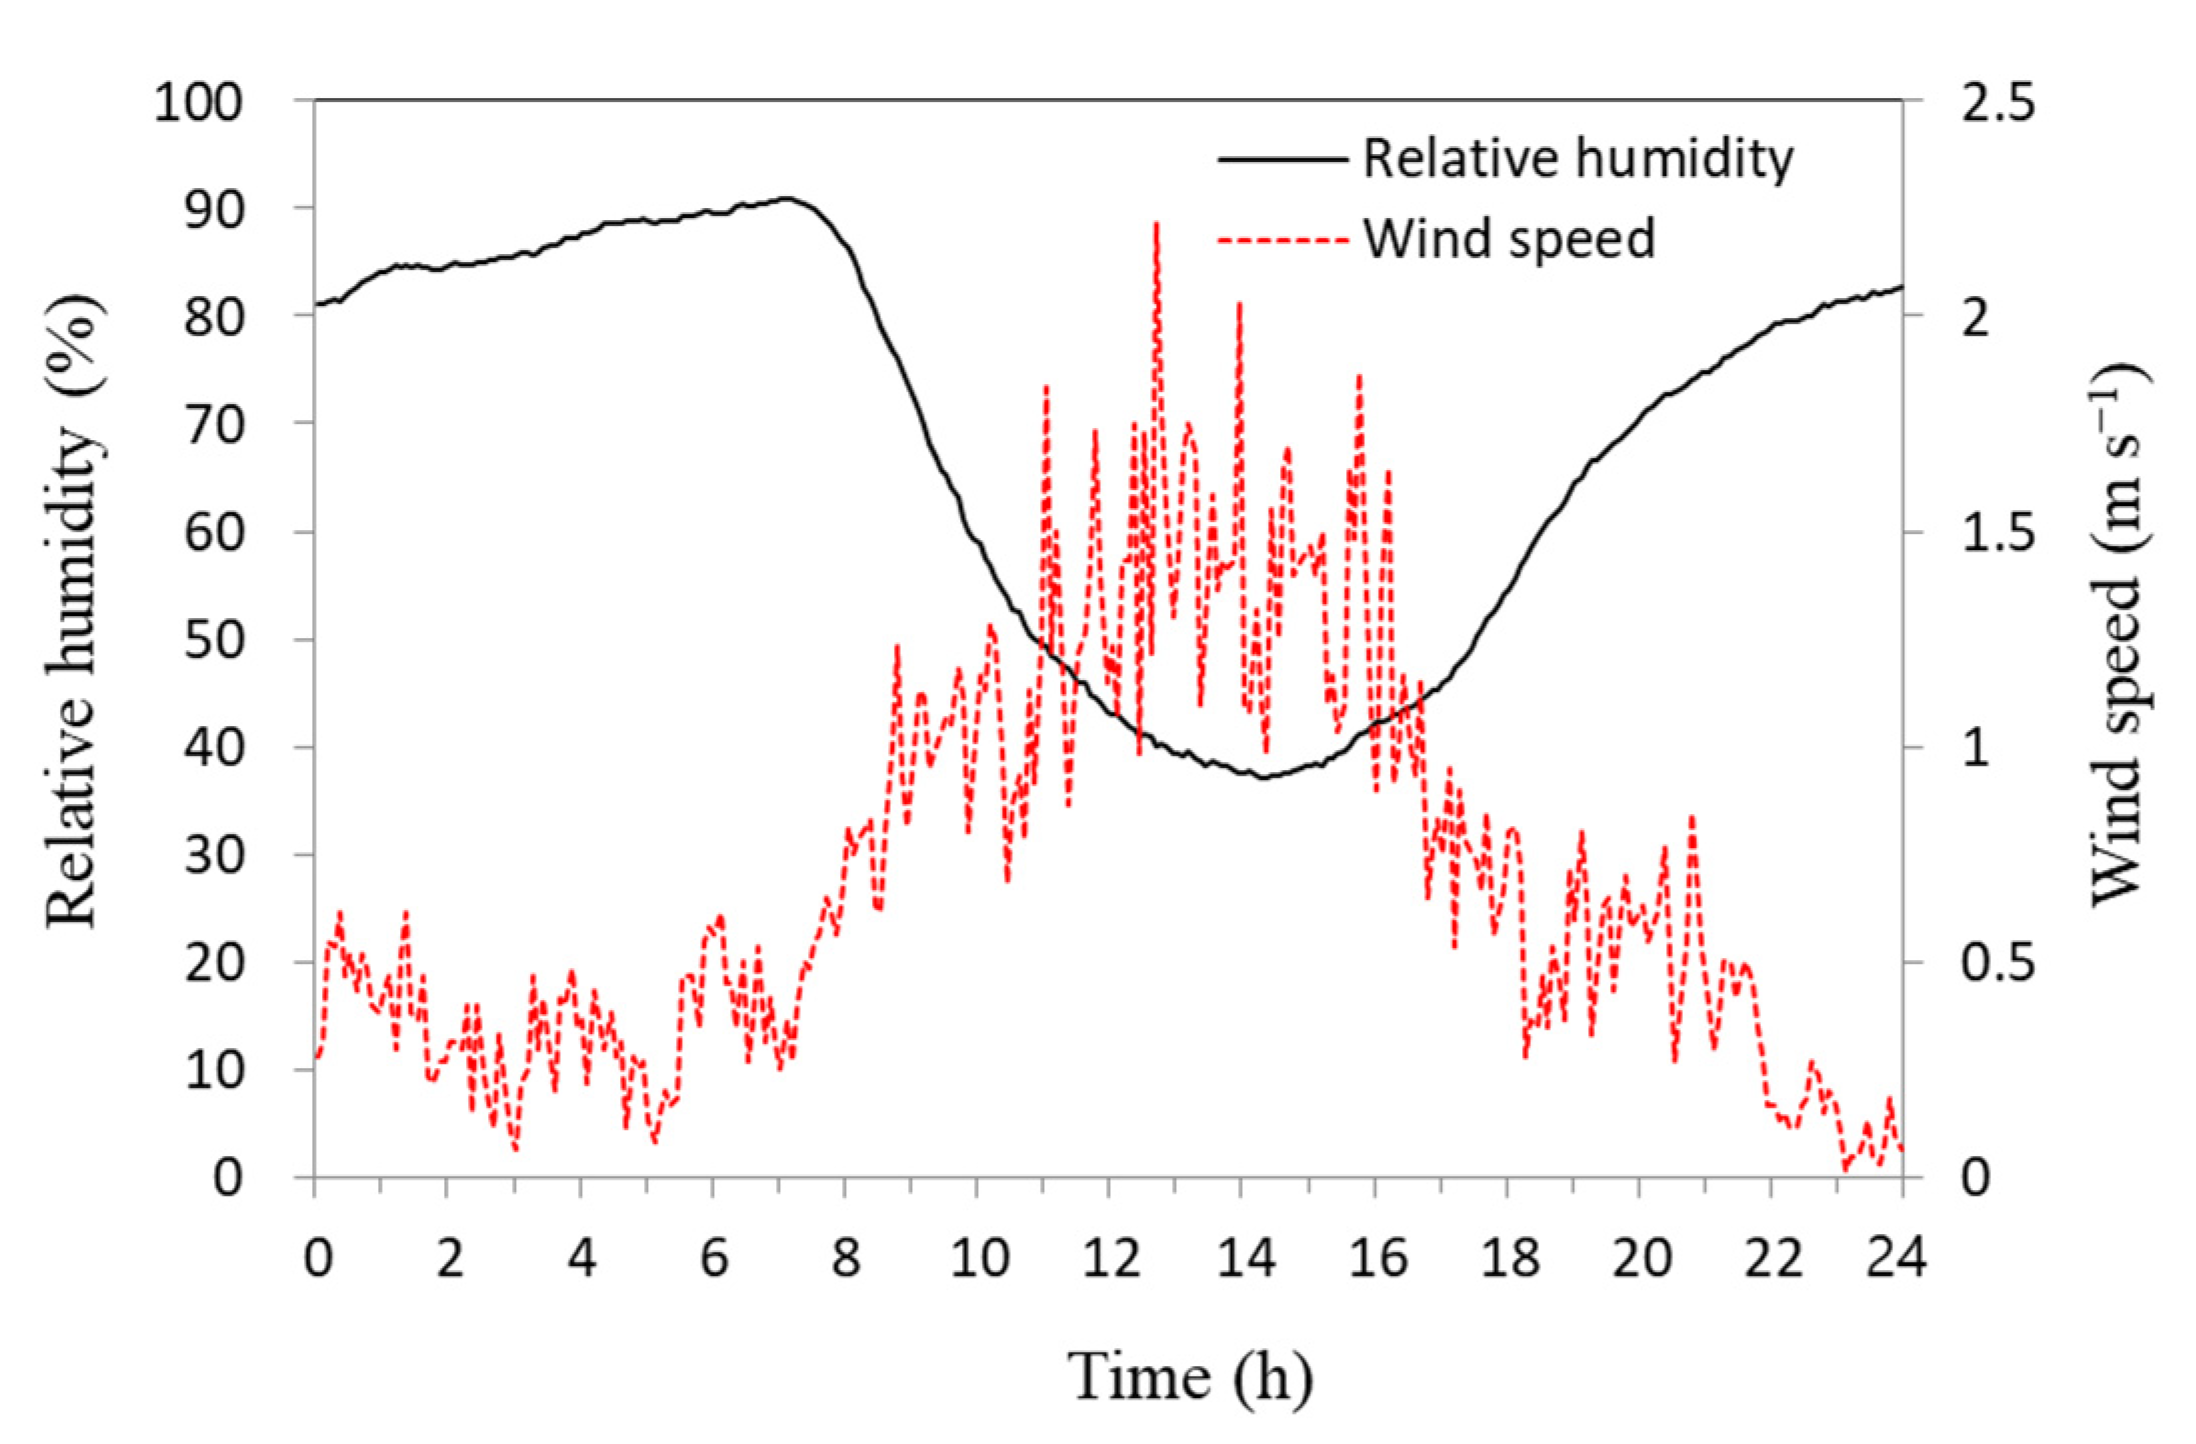
3.1. Climate Conditions

Figure 2 shows the temperature and solar radiation outside the greenhouses over time during the experimental periods; Figure 3 shows the relative humidity and wind speed for the same period. The outside temperature ranged from 10.3 to 24.8 °C, with an average value of 16.5 °C. The average solar radiation during the daytime (07:00 to 18:00) was 535.0 W m−2, with a maximum value of 965.2 W m−2. The relative humidity ranged from 37.0 to 90.9%, with an average value of 67.8%. The wind speed ranged from 0 to 2.2 m s−1, with an average value of 0.7 m s−1.

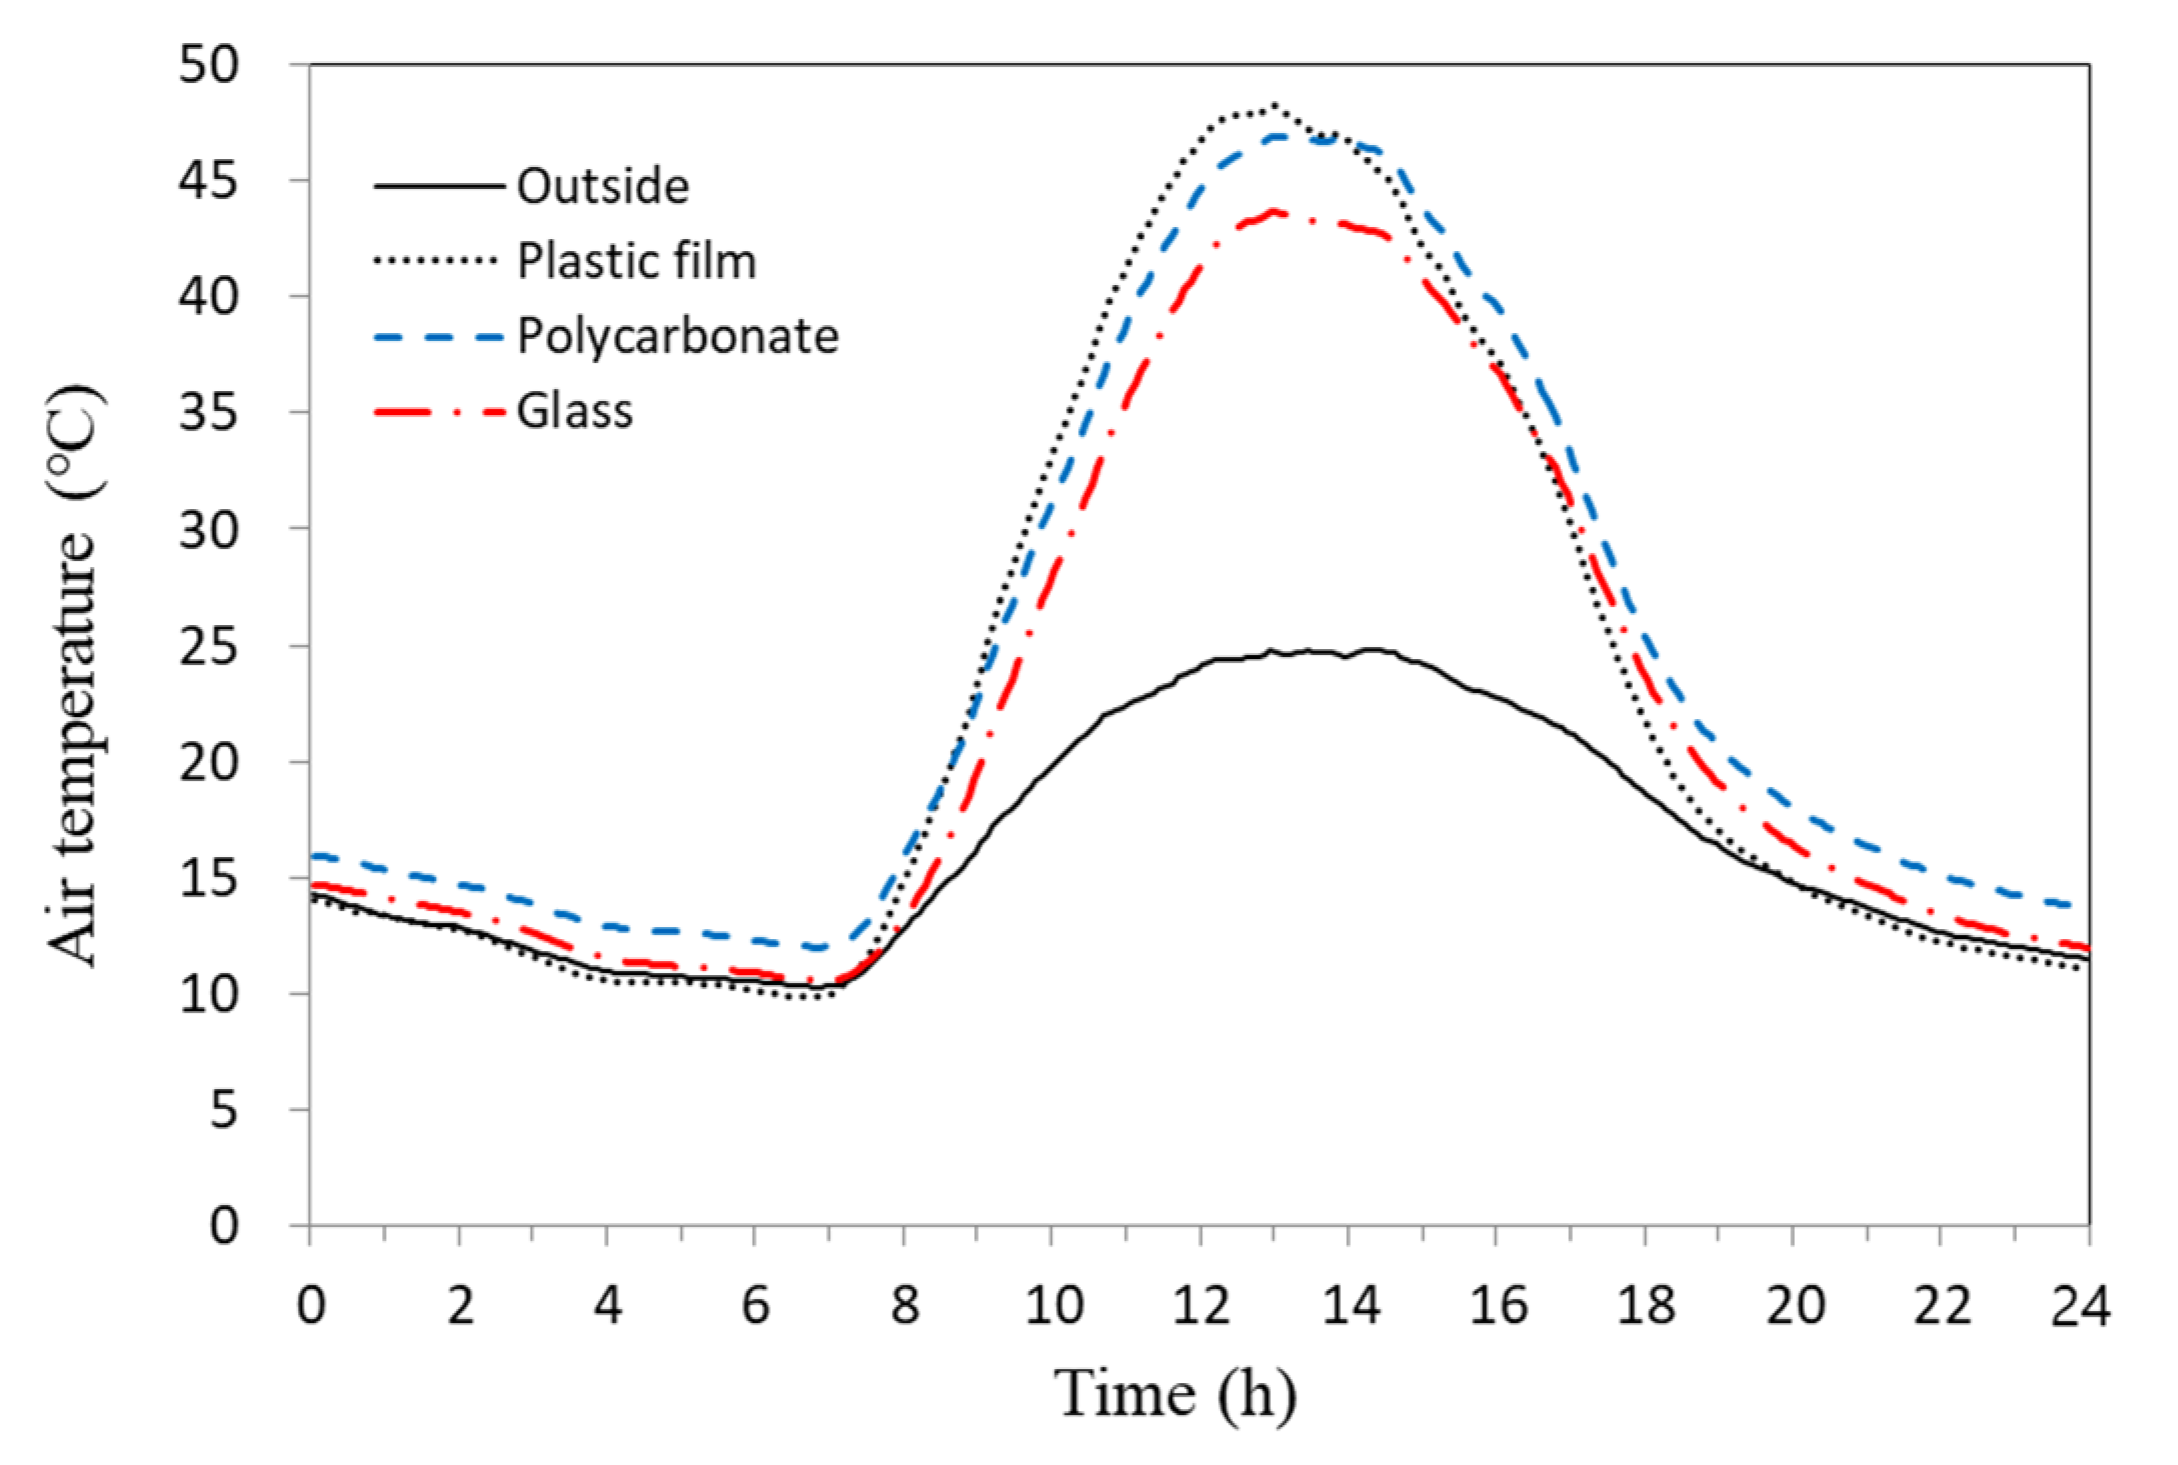
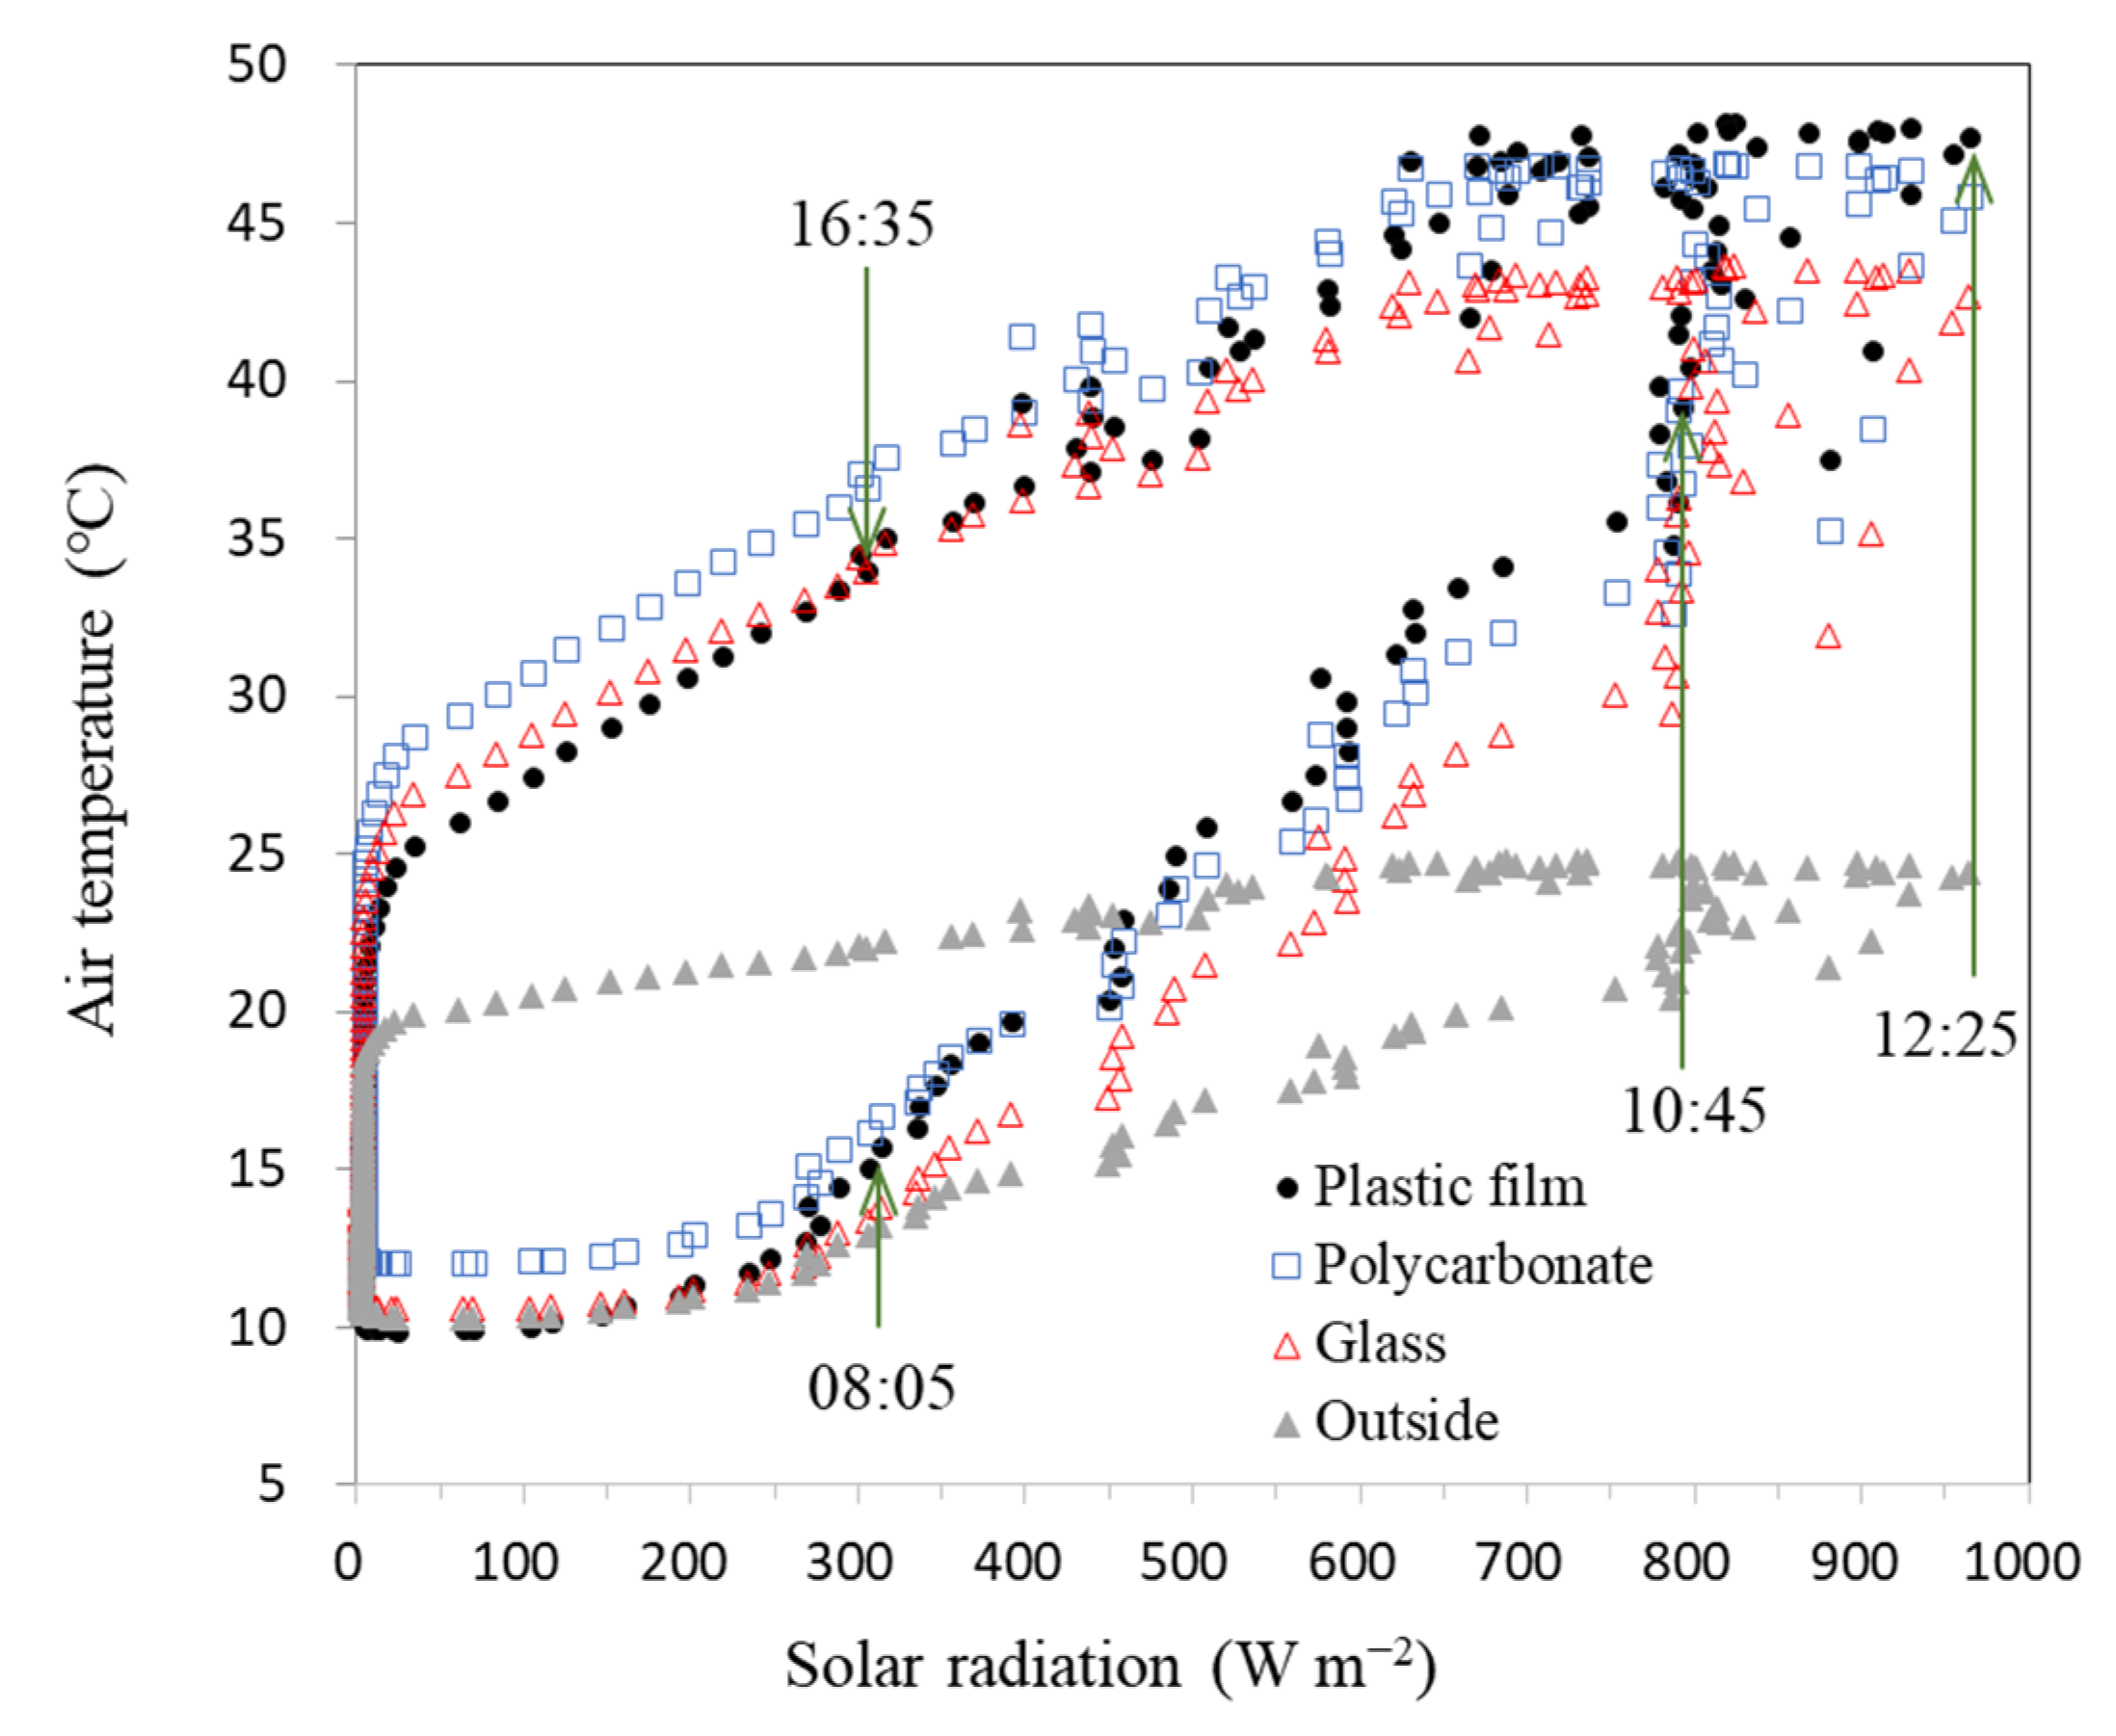
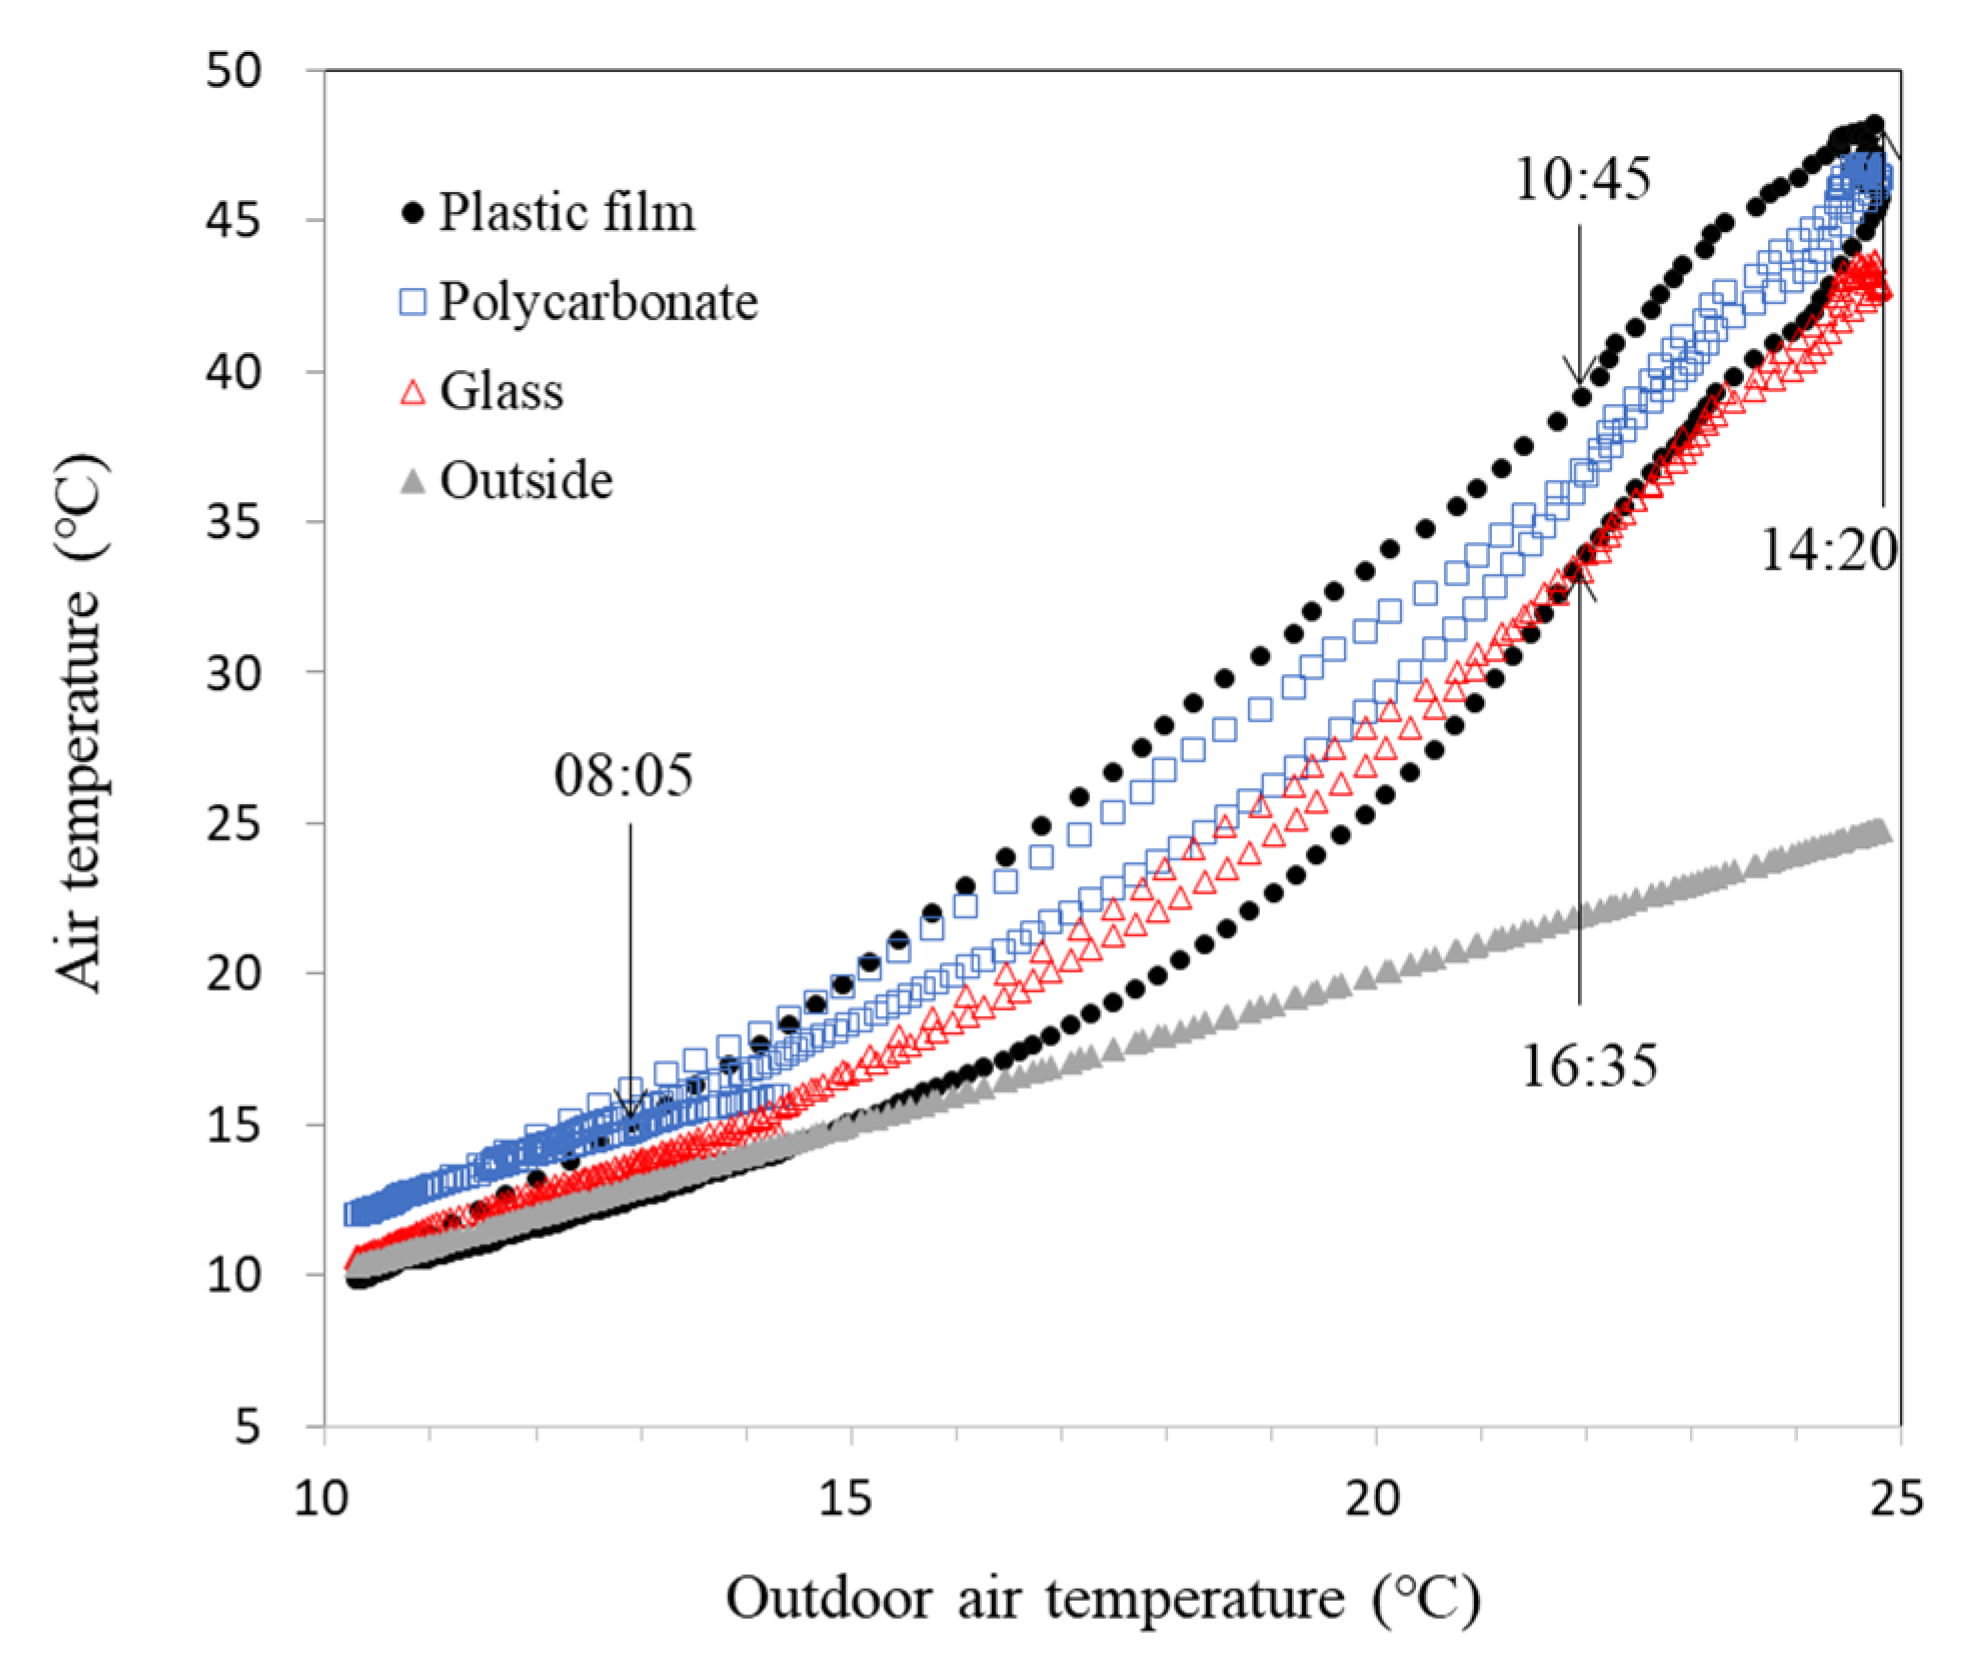
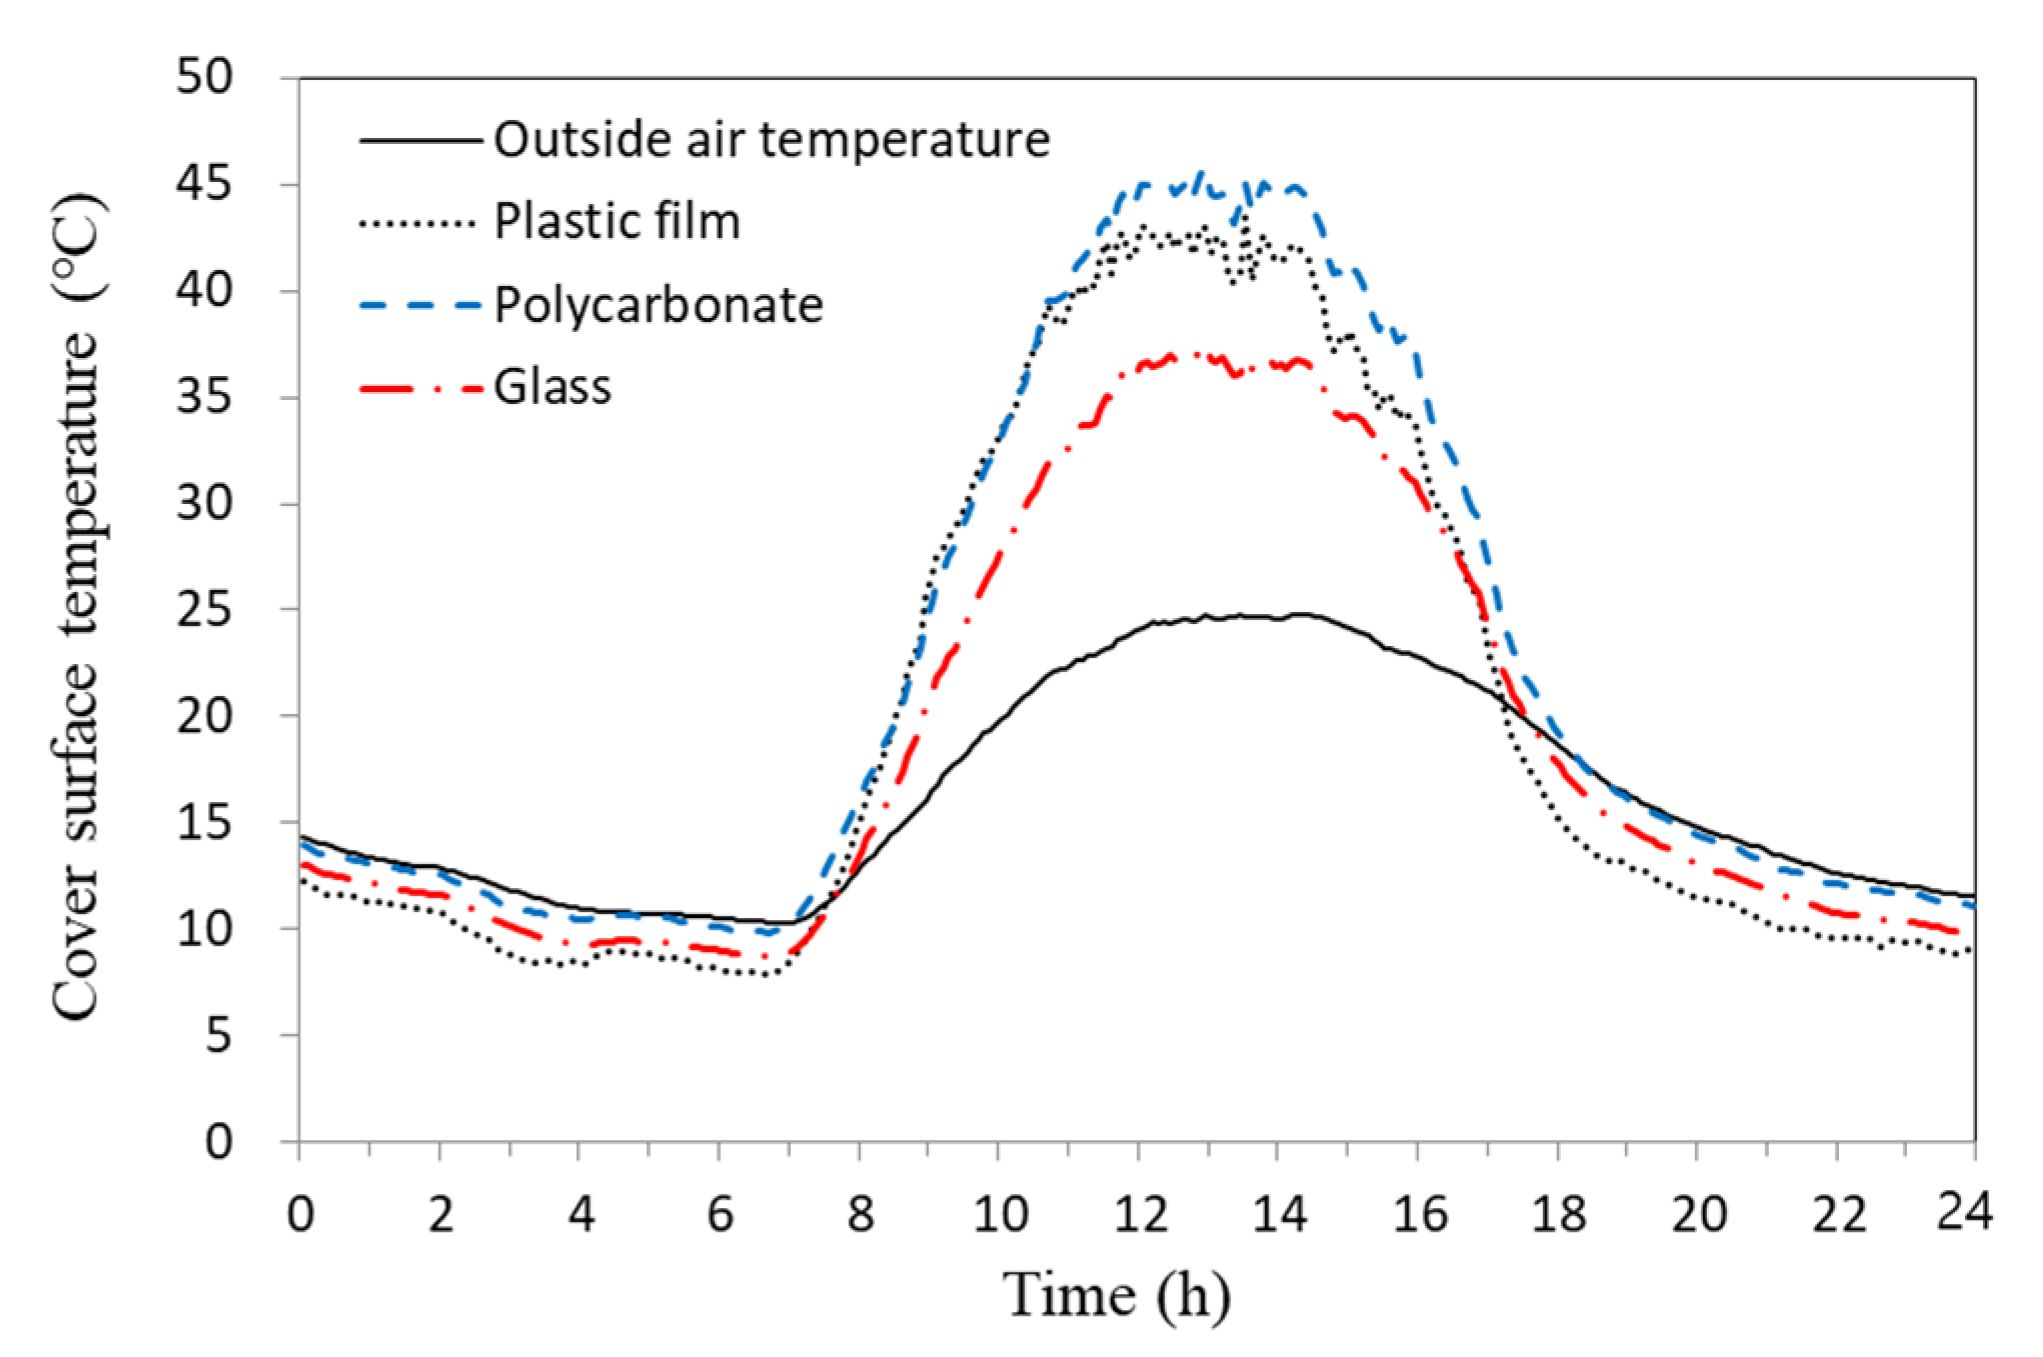
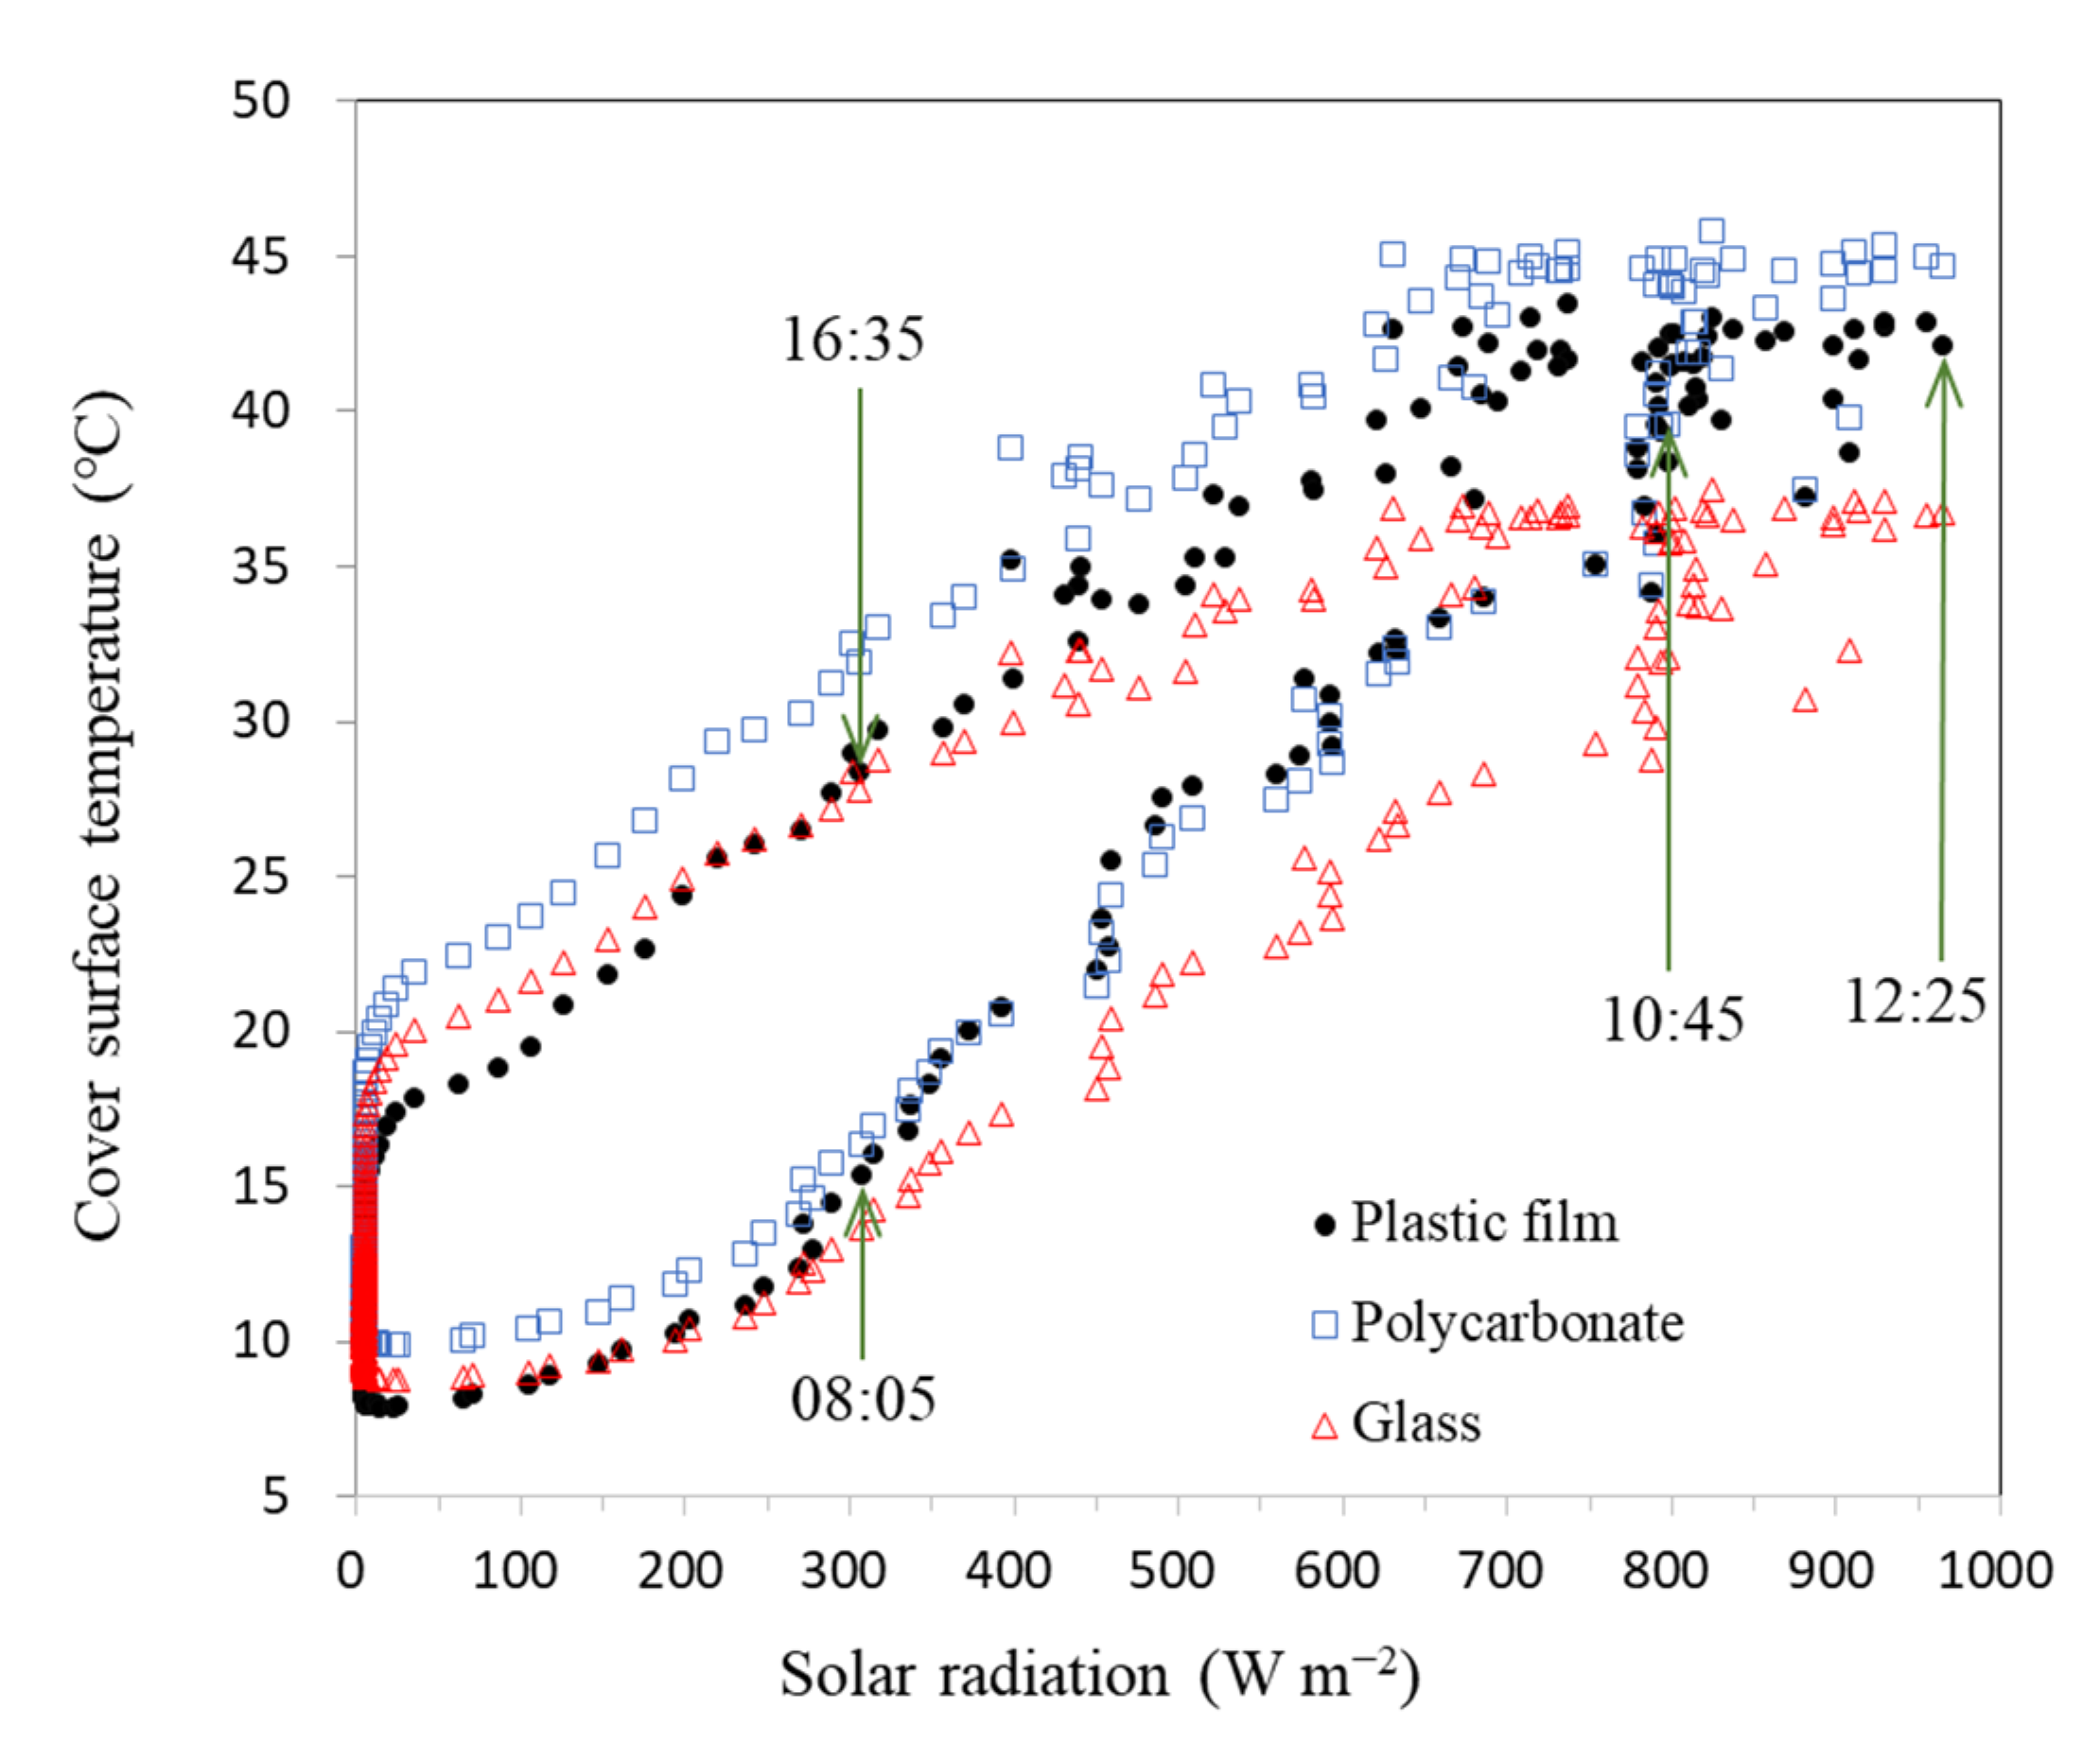
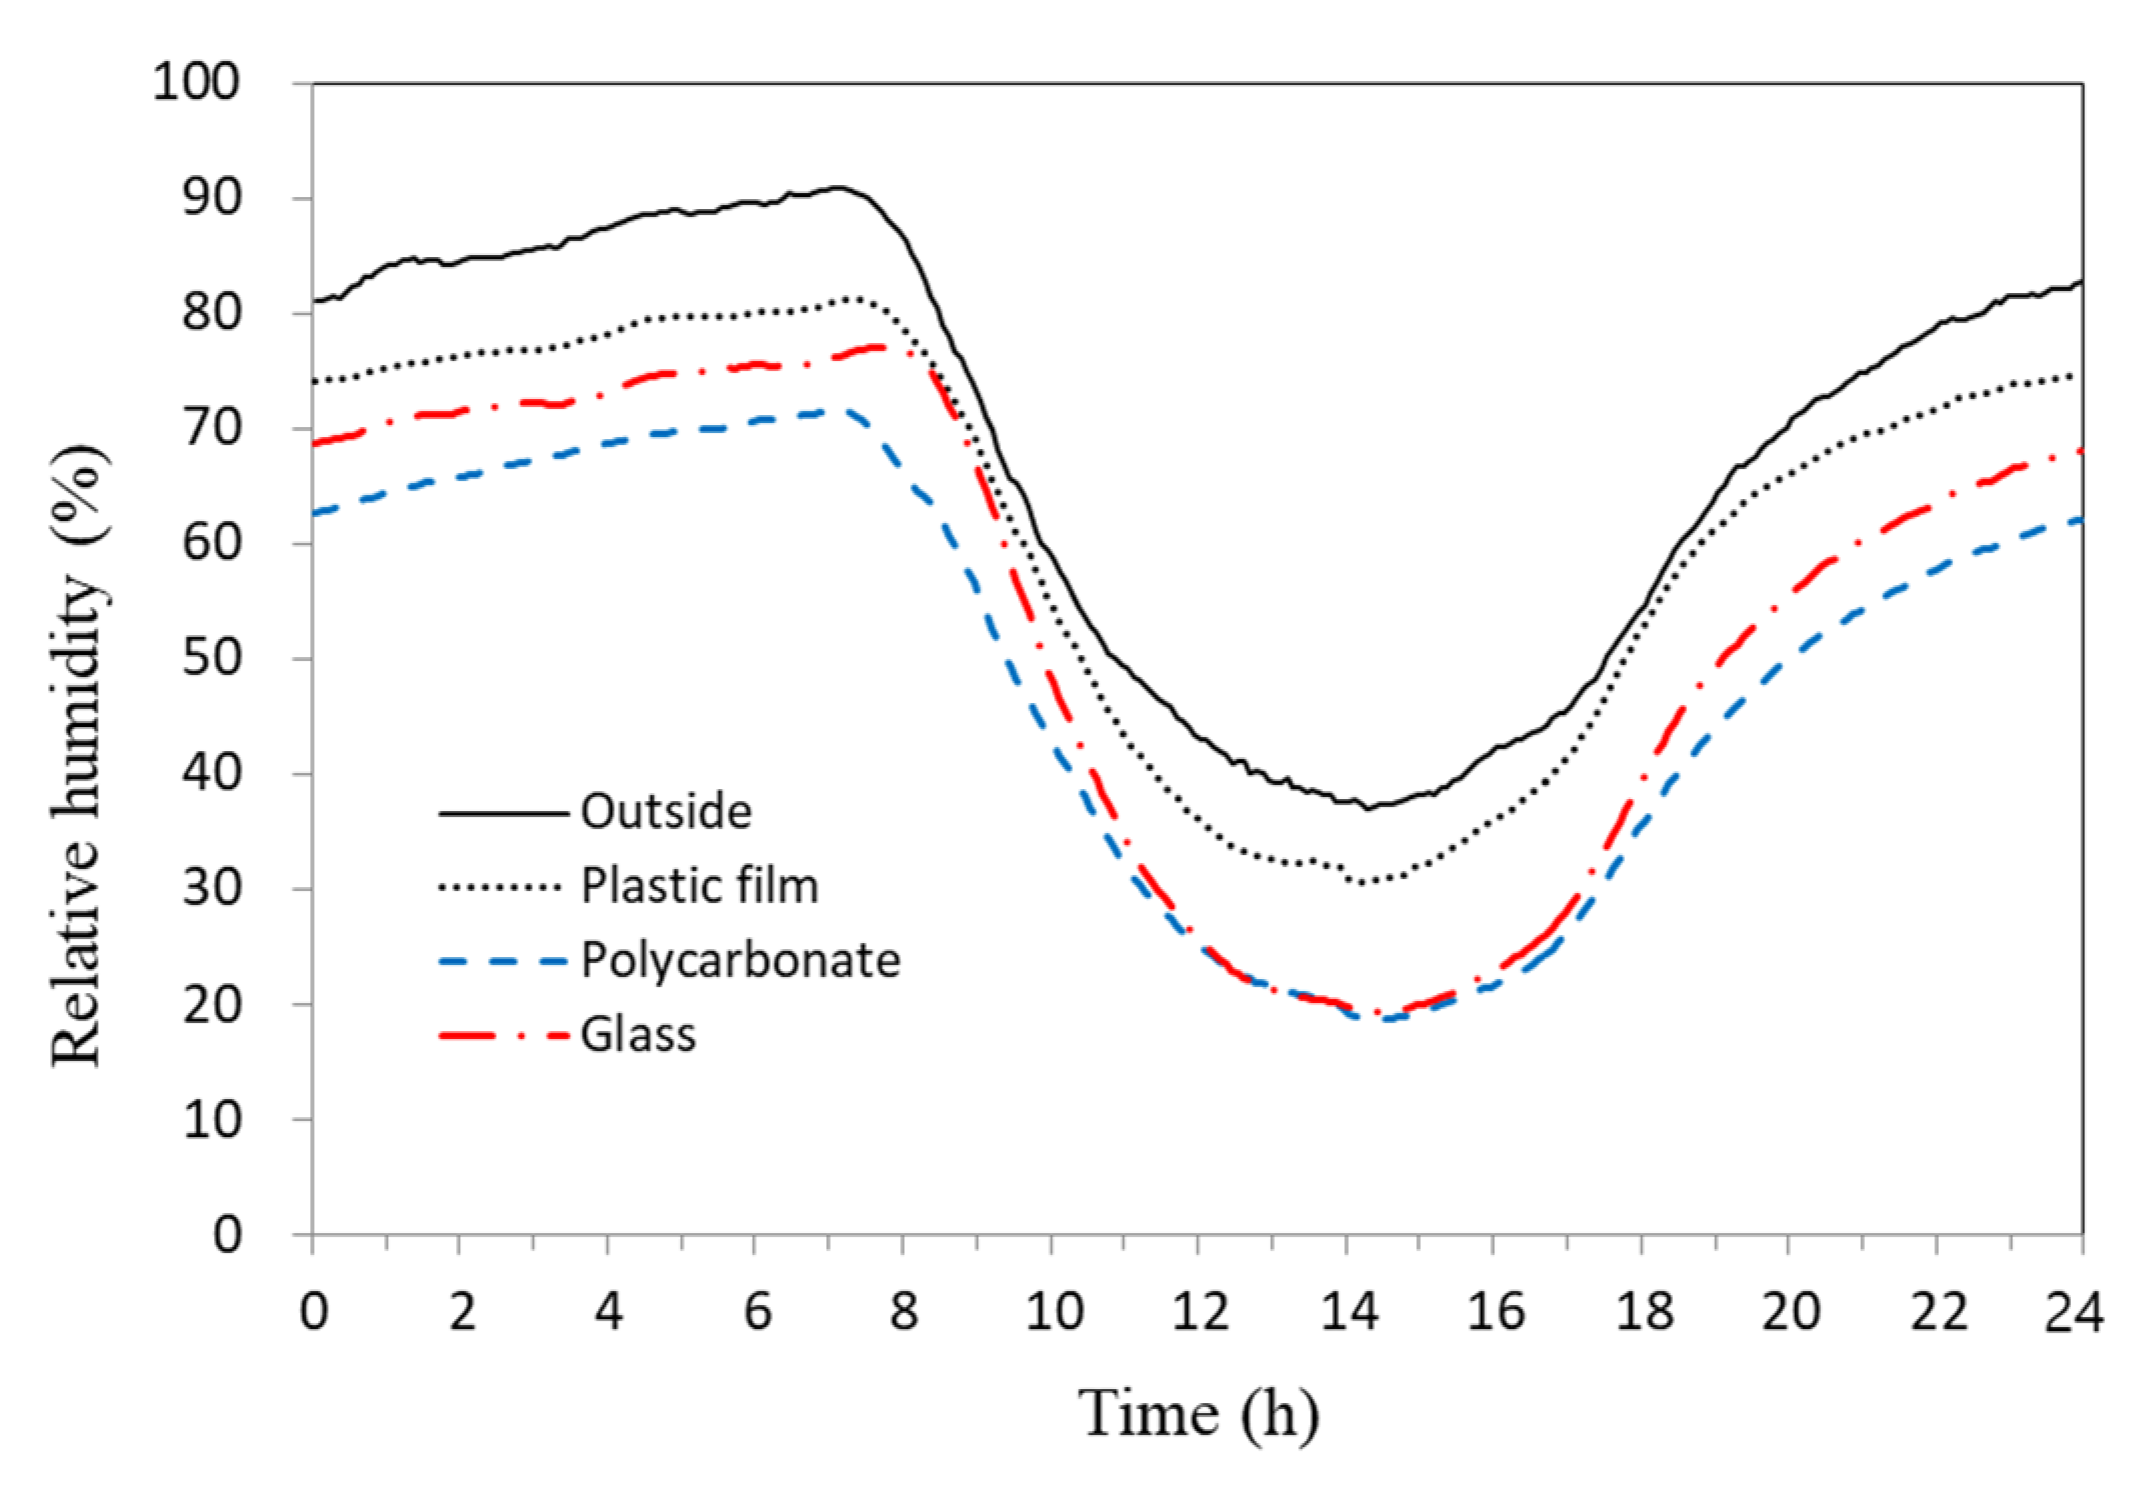
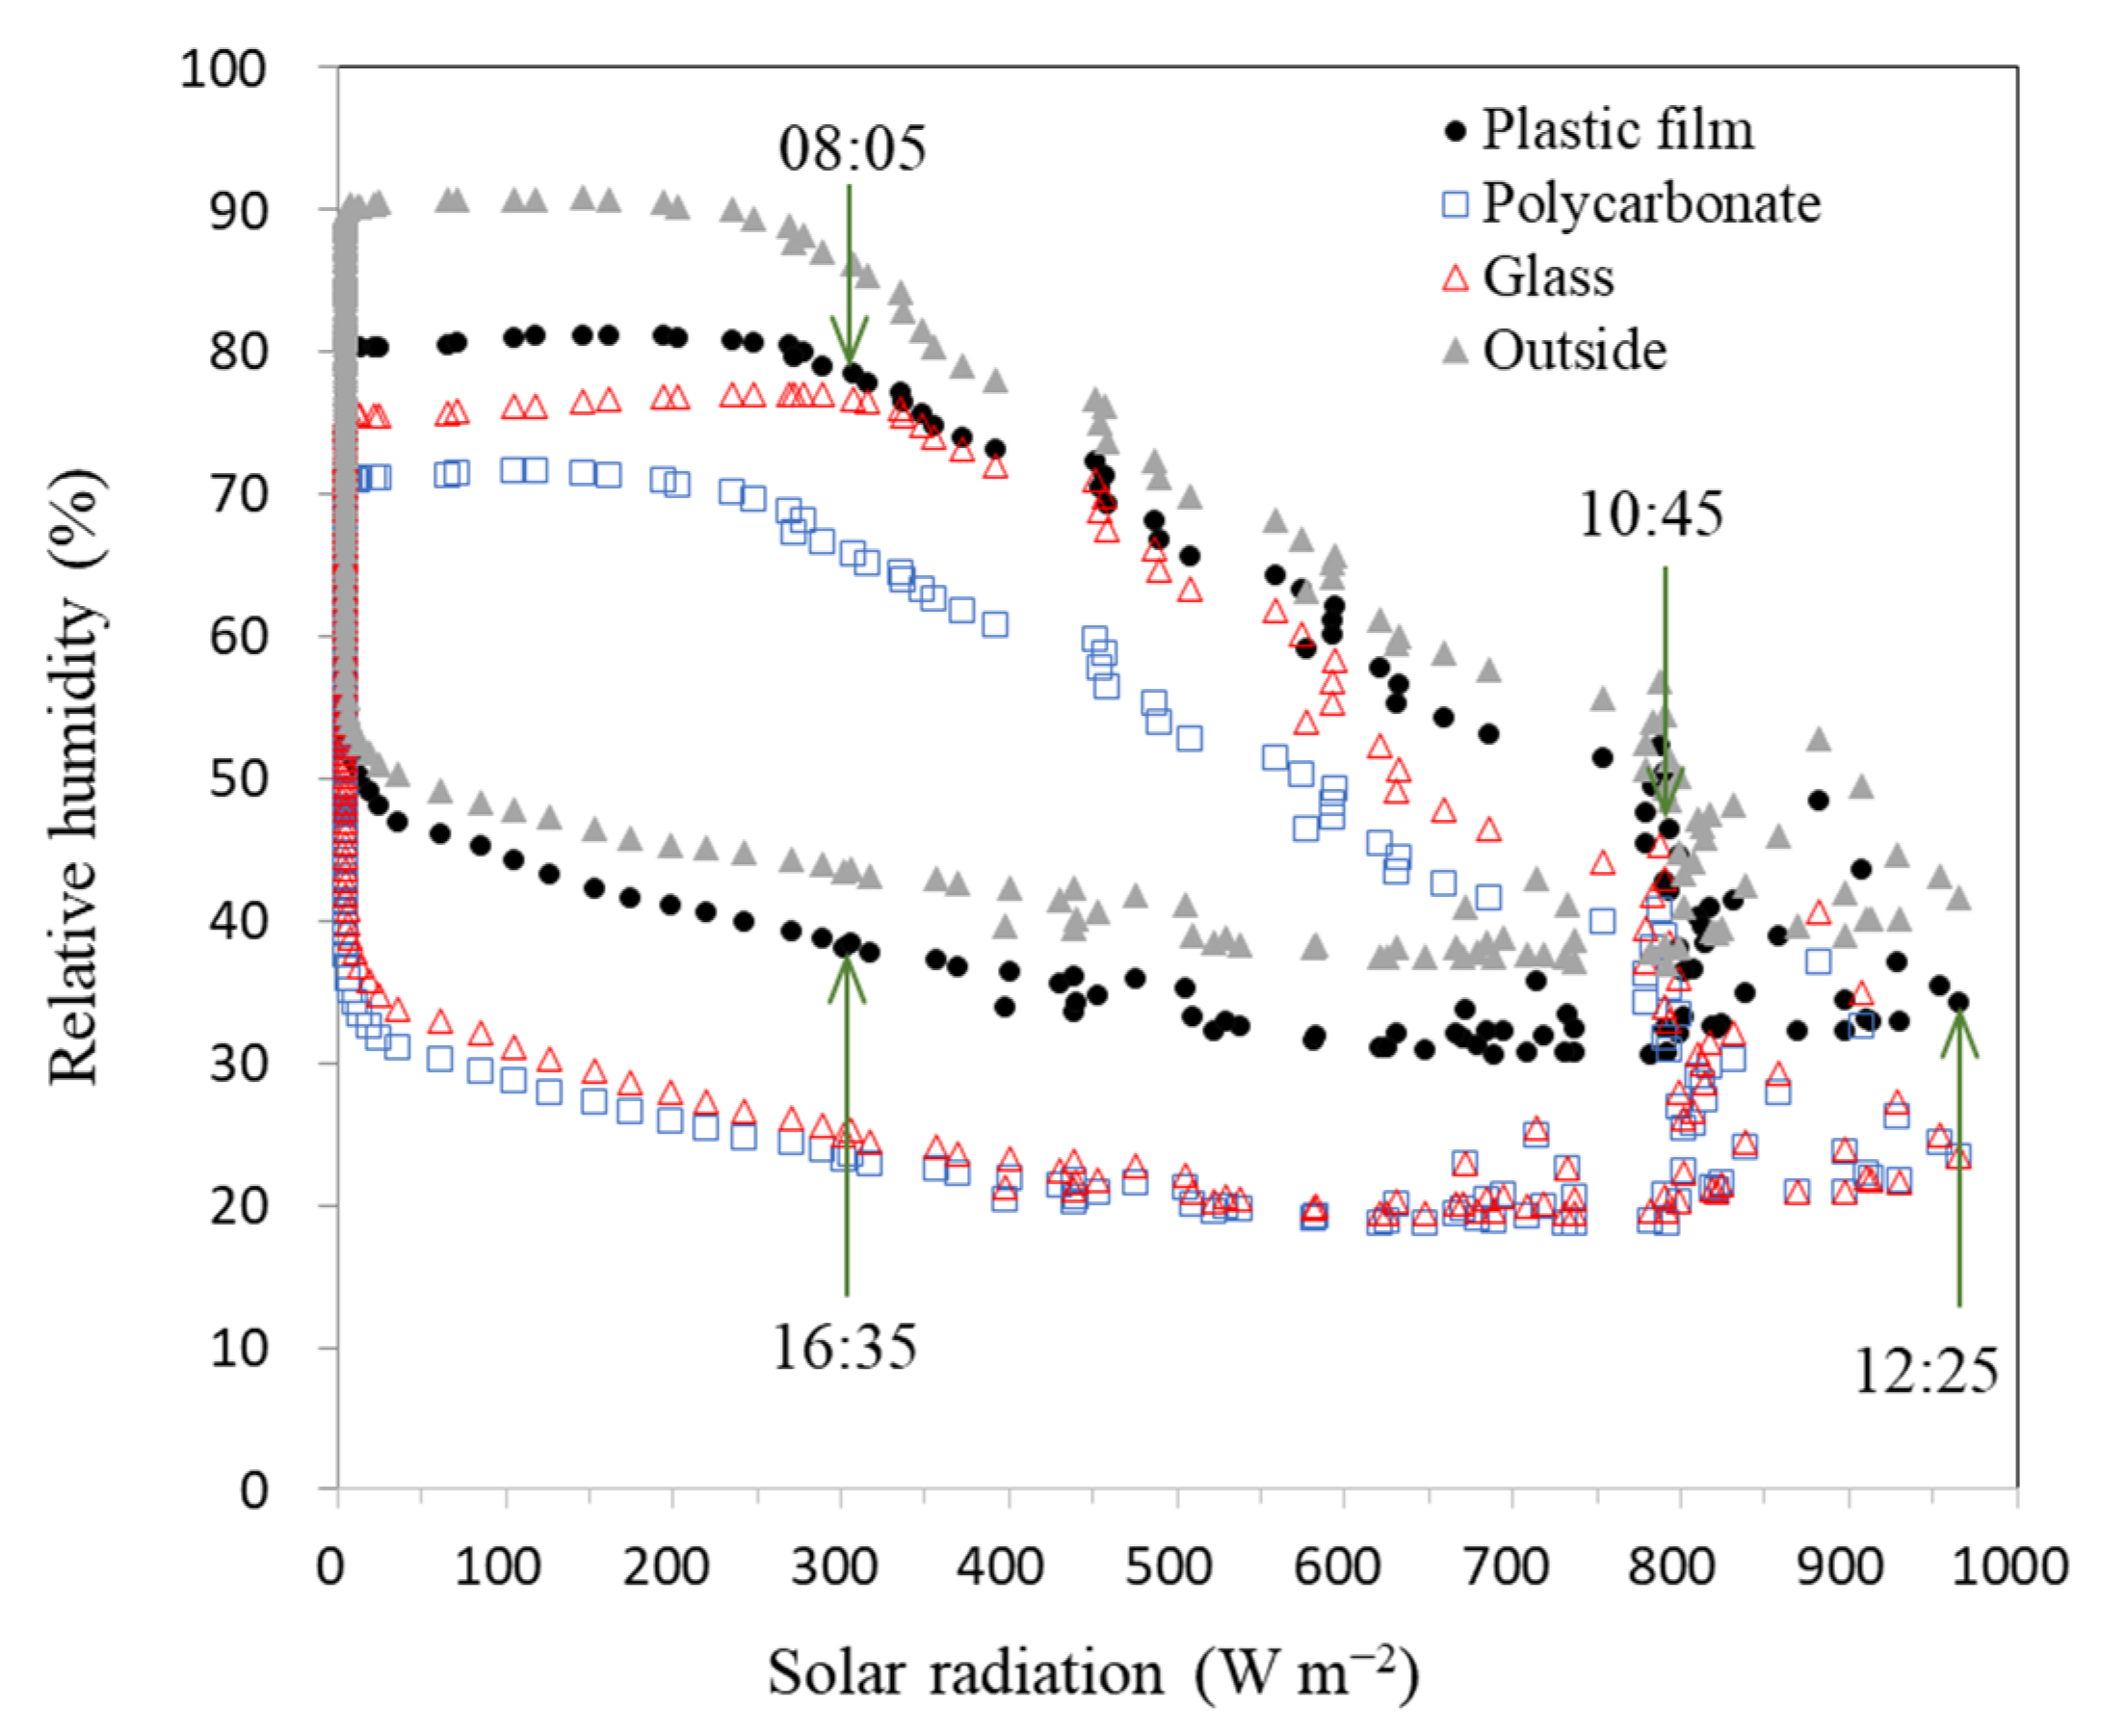
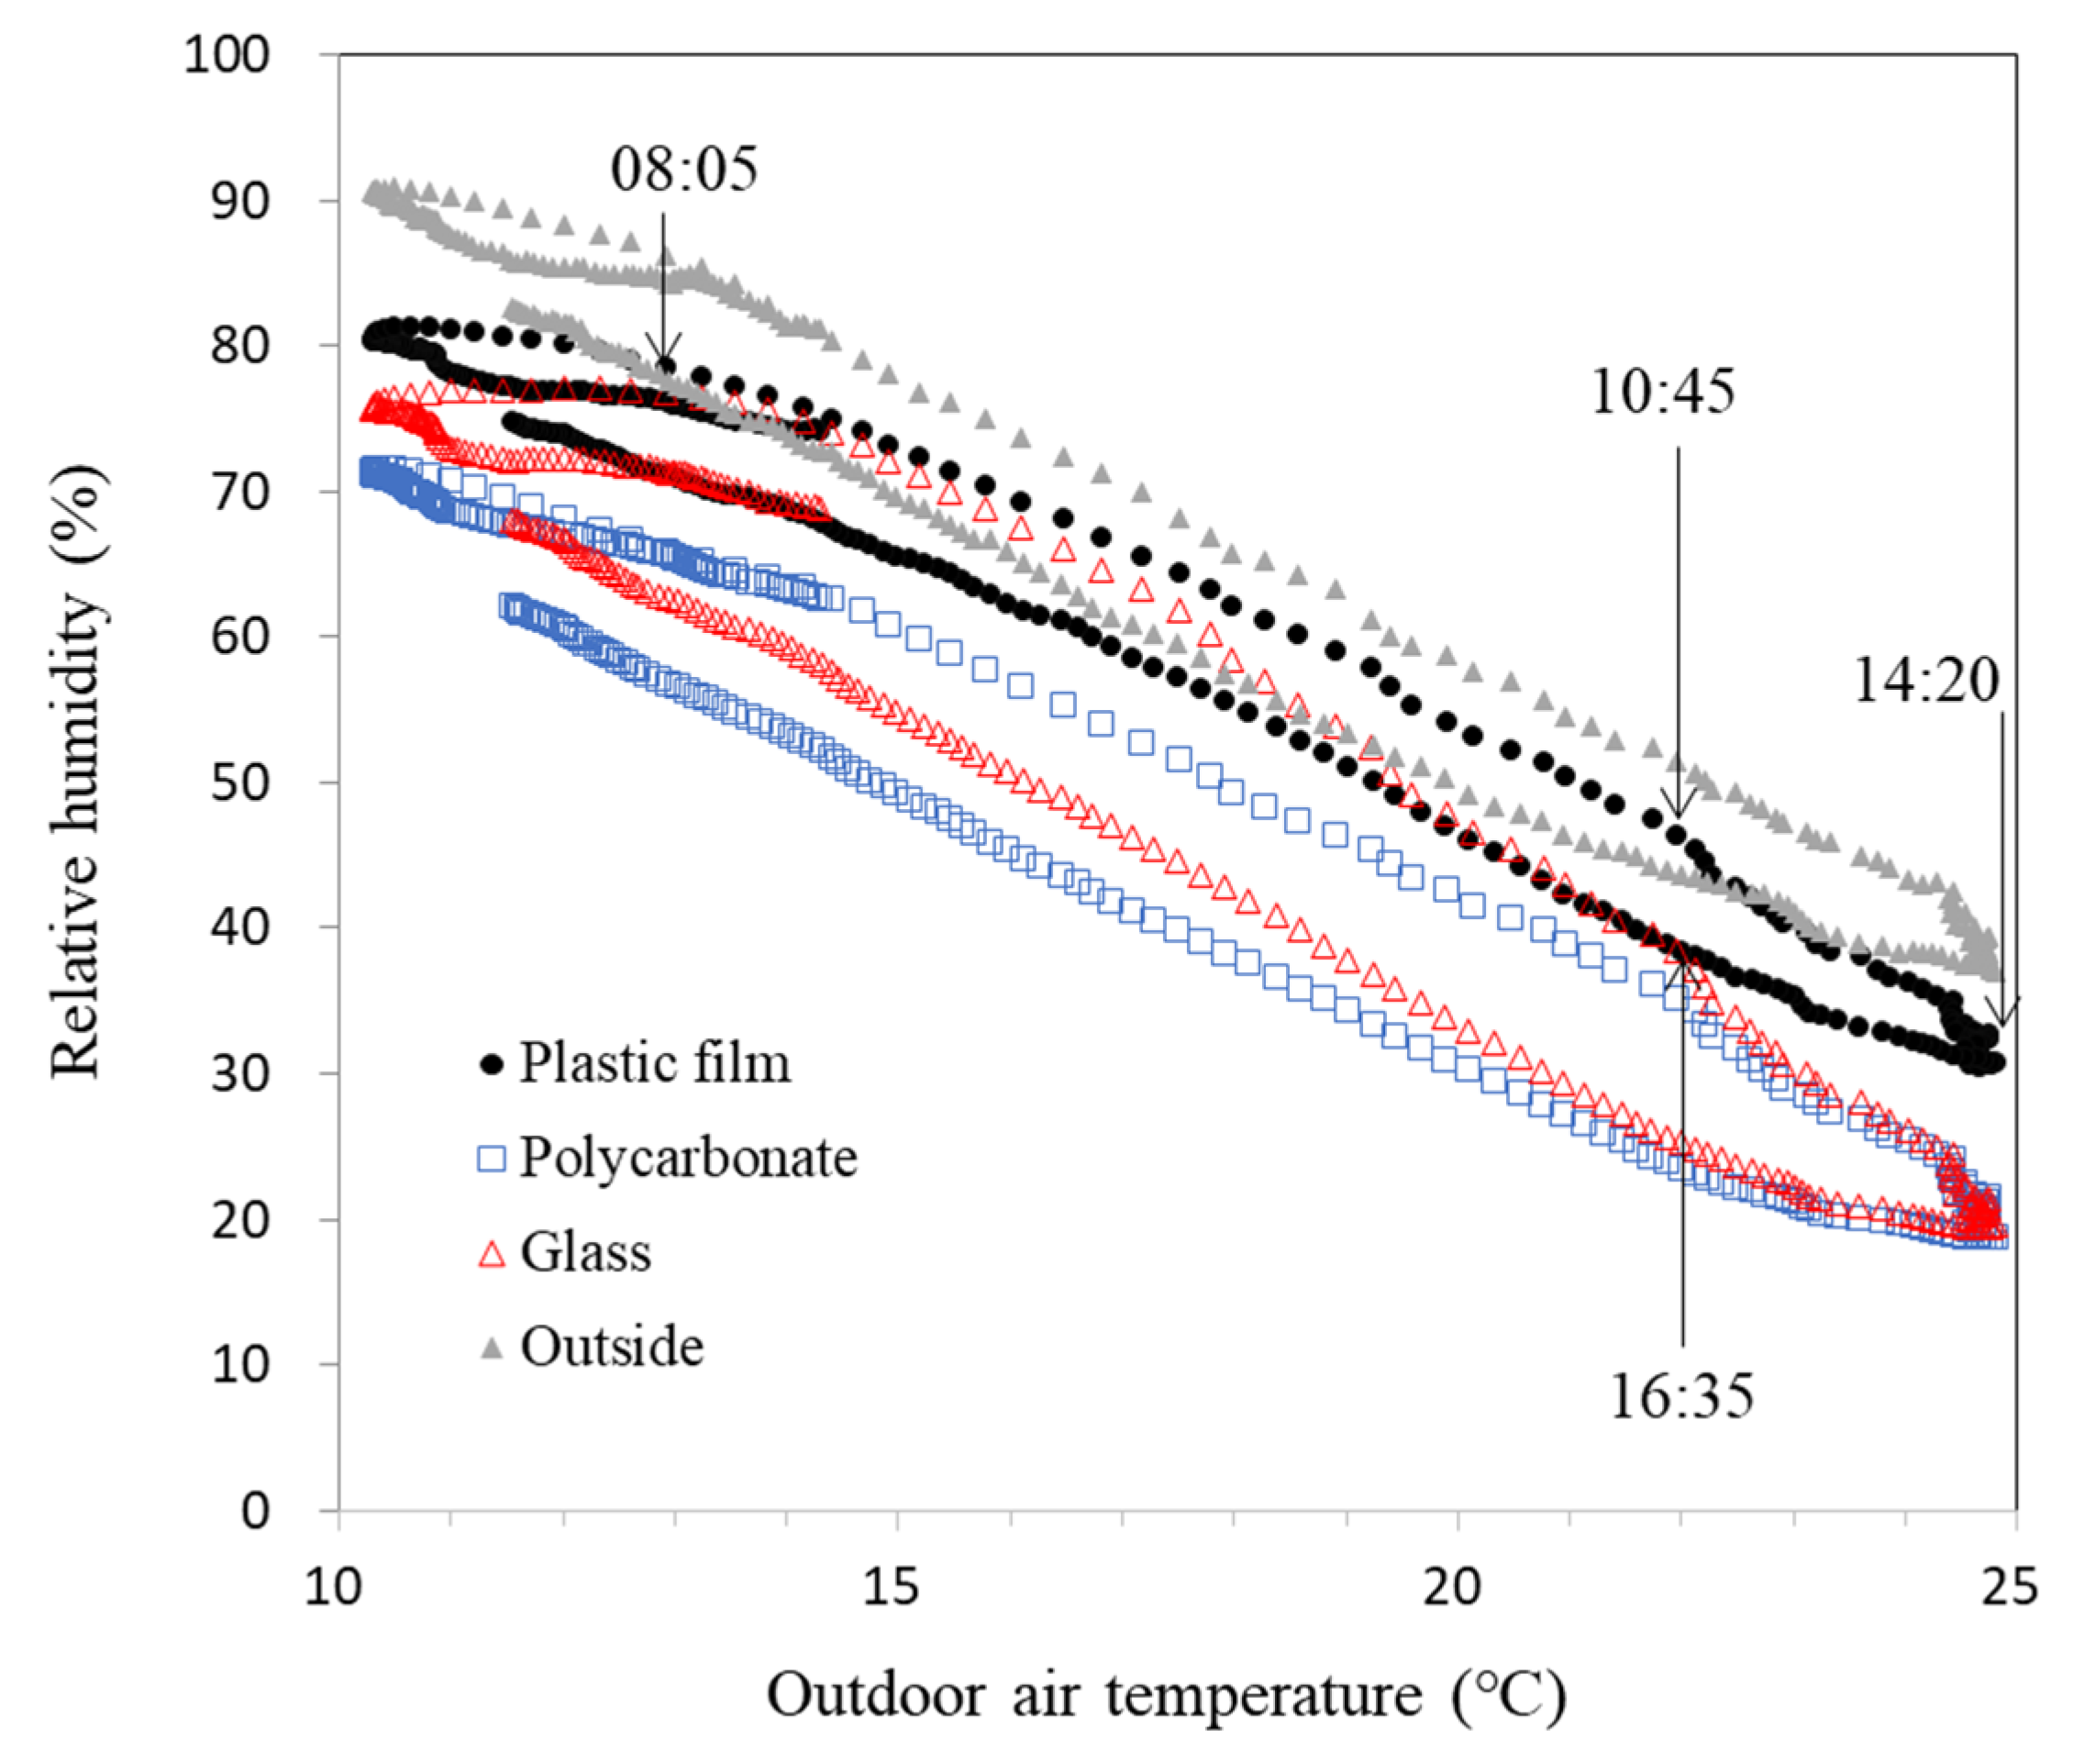
3.2. Analysis of the Microclimate of Greenhouses with Different Covering Materials

Figure 4 shows the variations in the exterior and interior air temperatures around and in the greenhouses. These variations were similar at night but significantly different during the day. This appears to be due to the influence of solar radiation introduced to the interior of the greenhouses during the day. The indoor air temperatures ranged from 9.9 to 48.2 °C for the plastic-covered greenhouse, 12.0 to 46.9 °C for the PC-covered greenhouse, and 10.6 to 43.7 °C for the glass-covered greenhouse. The variable breadths were 38.3, 34.9, and 33.1 °C, respectively, for the plastic-, PC-, and glass-covered greenhouses. The average indoor air temperatures were 22.8, 24.3, and 22.2 °C for the plastic-, PC-, and glass-covered greenhouses, respectively. The maximum air temperatures were found to be 23.4, 22.1, and 18.9 °C higher than the outdoor air temperatures of the plastic-, PC-, and glass-covered greenhouses, respectively. Compared to the outdoor air temperature, the minimum air temperature was 0.4 °C lower for the plastic-covered greenhouse, 1.7 °C higher for the PC-covered greenhouse, and 0.3 °C higher for the glass-covered greenhouse.
The indoor air temperature of the plastic-covered greenhouse was likely lower than the outdoor air temperature due to the influence of radiant cooling. Radiant cooling has been reported to occur frequently when there is no heating in a greenhouse covered with thin plastic films during cold, calm, cloudless nights [3,19,38,39]. It has been found that under this condition, the temperature inside the greenhouse becomes lower than the outside temperature. The lowest temperature inside the greenhouse appeared at 06:30–06:55 in the plastic-covered greenhouse, at 06:45–07:00 in the PC-covered greenhouse, and at 06:40–07:00 in the glass-covered greenhouse. The peak temperature appeared at 12:55–13:05, 13:05, and 13:05, respectively. The plastic-covered greenhouse showed a rapid temperature change because the plastic film (0.15 mm) is thinner than the PC (6 mm) and glass (4 mm), and it is affected more directly and quickly by the external environment. These results are similar to findings of previous studies, which showed that the minimum temperatures occur immediately before sunrise, and the maximum temperatures occur immediately after noon [3,40,41].
The plastic-covered greenhouse exhibited the greatest variable breadth of the indoor air temperature. The variable breadth of the indoor air temperature of the PC-covered greenhouse was 3.4 °C lower than that of the plastic-covered greenhouse and 1.8 °C higher than that of the glass-covered greenhouse. The PC-covered greenhouse also had the highest minimum and average air temperatures overall. This is likely because the air layer between the PC plates stores heat from solar radiation during the day and acts as a heat transfer resistance layer at night. These results indicate that PC is the greenhouse covering material most favorable for managing the heating load at night during the cold season. However, the variable breadth of the temperature was the lowest (33.1 °C) in the glass-covered greenhouse; its maximum air temperature was 4.5 °C lower than that of the plastic-covered greenhouse and 3.2 °C lower than that of the PC-covered greenhouse. This indicates that glass is the most favorable covering material for managing the cooling load during the hot season.
Figure 5 shows the indoor and outdoor air temperatures of the experimental greenhouses based on solar radiation. Both sets of temperatures showed a tendency to increase as the solar radiation increased. However, the increments in the increases in the indoor air temperatures of the greenhouses were significantly higher than those of the outdoor air temperature. The regression models for solar radiation were y = 0.013x + 13.140 (coefficient of determination R2 = 0.696) for the outdoor air temperature, y = 0.039x + 13.005 (R2 = 0.846) for the plastic-covered greenhouse, y = 0.034x + 15.751 (R2 = 0.768) for the PC-covered greenhouse, and y = 0.032x + 14.236 (R2 = 0.744) for the glass-covered greenhouse. The slopes and coefficients of determination of the regression models for the plastic-, PC-, and glass-covered greenhouses were likely higher than those of the regression model for the outdoor air temperature because the closed experimental greenhouses were uninfluenced by outdoor conditions such as the wind speed. Among the regression models, the regression model for the PC-covered greenhouse had the highest intercept (15.751) and that for the plastic-covered greenhouse the highest slope (0.039). These results confirm that the PC- and plastic-covered greenhouses, respectively, maintained the highest minimum air temperature and largest variable breadth of the indoor air temperature.
However, there were significant differences between indoor air temperatures in the morning and afternoon under the same solar radiation conditions, as shown in Figure 5. For example, at 08:05 and 16:35—which had similar solar radiation values of 307.5 W m−2 and 305.5 W m−2, respectively—the temperatures for the plastic-, PC-, and glass-covered greenhouses were 18.9, 20.4, and 20.6 °C higher, respectively, in the afternoon than in the morning. This indicates that devices controlling the ventilation and shading in the greenhouses must be used differently at different times of day and night, even under the same solar radiation conditions.
Figure 6 shows the indoor air temperatures of the experimental greenhouses based on the outdoor air temperature. The regression models for outdoor air temperature were y = 2.604x − 20.092 (R2 = 0.952) for the plastic-covered greenhouse, y = 2.411x − 15.414 (R2 = 0.975) for the PC-covered greenhouse, and y = 2.276x − 15.315 (R2 = 0.976) for the glass-covered greenhouse. The indoor air temperature was highly positively correlated with the outdoor air temperature, based on the coefficients of determination. It was possible to quantify the direct impact of the outdoor air temperature on the temperature inside the greenhouses because the explanatory power of the outdoor air temperature regression model was much higher than that of the solar radiation regression model. The slopes of the regression models were in the following order: glass-covered greenhouse (2.276), PC-covered greenhouse (2.411), and plastic-covered greenhouse (2.604).
Moreover, the indoor air temperature in the plastic-covered greenhouse had the largest variation due to changes in the outdoor air temperature, as shown in Figure 6, while that of the PC-covered greenhouse was high when the outside air temperature was low. The indoor air temperature of the glass-covered greenhouse was low when the outdoor air temperature was high. The difference between the indoor air temperature at 10:45 (outside air temperature 22.0 °C) and 16:35 (outside air temperature 22.0 °C) at the same outside air temperature was 5.2 °C for the plastic-covered greenhouse, 0.2 °C for the PC-covered greenhouse, and −0.6 °C for the glass-covered greenhouse. At the same outside air temperature, the air temperature inside the plastic-covered greenhouse showed somewhat high values in the morning, while that inside the PC-covered and glass-covered greenhouses was similar. In Figure 5, the time for the maximum solar radiation (965.2 W m−2) was 12:25, and in Figure 6, the maximum outdoor air temperature (24.8 °C) occurred at 14:20, showing a difference of about two hours. This difference is consistent with that reported in previous studies [41].
Figure 7 shows the temperatures of the inner cover surface of each material over time. During the day, these temperatures were higher than the outdoor air temperature. At night, however, the temperatures of the inner cover surfaces were lower than the outdoor air temperature due to radiant cooling in the unheated greenhouse during calm, cold, and cloudless nights [3,19,38,39].
The temperatures of the inner cover surfaces ranged from 7.9 to 43.5 °C for the plastic-covered greenhouse, 9.9 to 45.8 °C for the PC-covered greenhouse, and 8.7 to 37.5 °C for the glass-covered greenhouse. The variable breadths of these temperatures were 35.6, 35.9, and 28.8 °C for the plastic-, PC-, and glass-covered greenhouses, respectively, and the average temperatures of the inner cover surfaces were 20.0, 22.2, and 19.0 °C. The minimum inner surface temperatures were 2.4, 0.4, and 1.6 °C lower than the outdoor air temperature in the plastic-, PC-, and glass-covered greenhouses, respectively. The temperature of the inner cover surfaces of the PC-covered greenhouse was higher, in the night, than that of the plastic- and glass-covered greenhouses. The results obtained in our survey indicate that the heating effect of the PC-covered greenhouses was markedly better. Kim et al. [3] also noted that the heat insulation effect of a covering material improves the higher its inner cover surface temperature is. In the case of the glass-covered greenhouse, however, the maximum inner cover surface temperature in the daytime was up to 6.0 and 8.3 °C lower than that of the plastic- and PC-covered greenhouses. This tendency is similar to the change in the indoor air temperature shown in Figure 4, which confirms that glass is the most favorable greenhouse covering material for managing the cooling load during noon. It is, therefore, inferred that the cooling effect of the glass-covered greenhouse is markedly superior to that of the other greenhouses.
Figure 8 shows the outdoor air temperature and temperatures of the inner cover surfaces based on solar radiation. There was a positive correlation between solar radiation and the indoor cover surface temperature, and the models of the relationship for the greenhouses covered with plastic, polycarbonate, and glass were y = 0.038x + 10.292 (R2 = 0.922), y = 0.038x + 12.691 (R2 = 0.880), and y = 0.029x + 11.566 (R2 = 0.851), respectively. The coefficients of determination of these regression models confirmed that there is a high correlation between the temperatures of the indoor cover surfaces and solar radiation. However, there were differences in the former based on the time of day they were recorded, even at the same solar radiation, as shown in Figure 8. For example, the inner cover temperatures in the plastic-, PC-, and glass-covered greenhouses were 13.0, 15.5, and 14.1 °C higher, respectively, in the afternoon than at 08:05 (solar radiation level: 307.5 W m−2) and 16:35 (305.5 W m−2).
Figure 9 shows the temperatures of the inner cover surfaces based on the outdoor air temperature. The inner cover surface temperatures were highly positively correlated with the outdoor air temperature. The models of the relationship for the greenhouses covered with plastic, PC, and glass were y = 2.387x − 19.352 (R2 = 0.894), y = 2.437x − 17.998 (R2 = 0.932), and y = 1.964x − 13.387 (R2 = 0.955), respectively. In addition, when the outdoor air temperature was the same at 10:45 and 16:35, the values were higher in the morning (10:45), with 11.0 °C for the plastic-covered greenhouse, 7.6 °C for the PC-covered greenhouse, and 4.1 °C for the glass-covered greenhouse. Moreover, the temperature difference of the inner cover surface according to the outdoor air temperature was greater than the indoor air temperature, as compared to Figure 6, which is believed to be due to the fact that the cover surface was directly exposed to outdoor temperatures and served as the primary insulation.
Figure 10 shows variations in the relative humidity of the greenhouses with their different covering materials. The former showed a trend similar to that of the outdoor humidity; when the outdoor humidity ranged from 37.0 to 90.9% (average: 67.8%), the relative humidity ranged from 30.6 to 81.3% (average: 61.2%) for the plastic-covered greenhouse, 18.7 to 71.6% (average: 48.8%) for the PC-covered greenhouse, and 19.4 to 77.1% (average: 53.2%) for the glass-covered greenhouse. Overall, the humidity of the interior of the experimental greenhouses was lower than their exterior. Furthermore, the minimum relative humidity ranged from 18.7 to 30.6% around noon, when the solar radiation was at its highest; this is particularly unfavorable for crop cultivation [10]. These results confirm that greenhouse agriculture requires particular attention toward greenhouse ventilation to manage stress from high temperatures and ensure that the appropriate humidity value is maintained.
However, the results also show that the plastic-covered greenhouse had a humidity that was, on average, 12.4% and 8.0% higher than that of the PC- and glass-covered greenhouses, respectively. This was particularly true in the afternoon, apparently due to the evaporation (via solar energy) of condensation produced during the night, when the plastic-covered greenhouse had the lowest indoor air temperature among all the greenhouses.
Figure 11 shows the relative humidity in the greenhouses according to the solar radiation. There was a negative correlation between solar radiation and relative humidity, and the regression models were y = −0.044x + 79.044 (R2 = 0.566) for outdoor humidity, y = −0.043x + 72.123 (R2 = 0.601) for the plastic-covered greenhouse, y = −0.042x + 59.406 (R2 = 0.522) for the PC-covered greenhouse, and y = −0.046x + 64.948 (R2 = 0.509) for the glass-covered greenhouse. The slopes of the regression models were similar at −0.044, −0.043, −0.042, and −0.046, respectively, confirming that there was no significant difference in relative humidity depending on the solar radiation. In addition, the indoor and outdoor relative humidity exhibited very similar change patterns. The intercept values were slightly different, with the highest value of 72.123 being that of the plastic-covered greenhouse; those of the PC- and glass-covered greenhouses were 59.406 and 64.948, respectively. The relatively high intercept of the plastic-covered greenhouse confirmed its relatively high relative humidity level. Finally, these relative humidity values were 40.0, 42.4, and 51.5% lower in the afternoon than in the morning for the plastic-, PC-, and glass-covered greenhouses, respectively, given a solar radiation value in the 305–307 W m−2 range.
Figure 12 shows the relative humidity in the experimental greenhouses according to the outdoor air temperatures. The relative humidity decreased as the outdoor air temperature increased, showing a negative correlation. The regression models were y = −3.464x + 118.293 (R2 = 0.973) for the plastic-covered greenhouse, y = −3.577x + 107.719 (R2 = 0.951) for the PC-covered greenhouse, and y = −3.959x + 118.494 (R2 = 0.938) for the glass-covered greenhouse. The slopes of the regression models for the plastic-covered greenhouse, PC-covered greenhouse, and glass-covered greenhouse were −3.464, −3.577, and −3.959, respectively, with the absolute value of the glass-covered greenhouse being somewhat higher. With regard to the relative humidity at the same outdoor air temperature for 10:45 and 16:35, where the outdoor air temperature was the same, the value was 7.9% for the plastic-covered greenhouse, 11.7% for the PC-covered greenhouse, and 13.2% for the glass-covered greenhouse, with higher values in the morning.

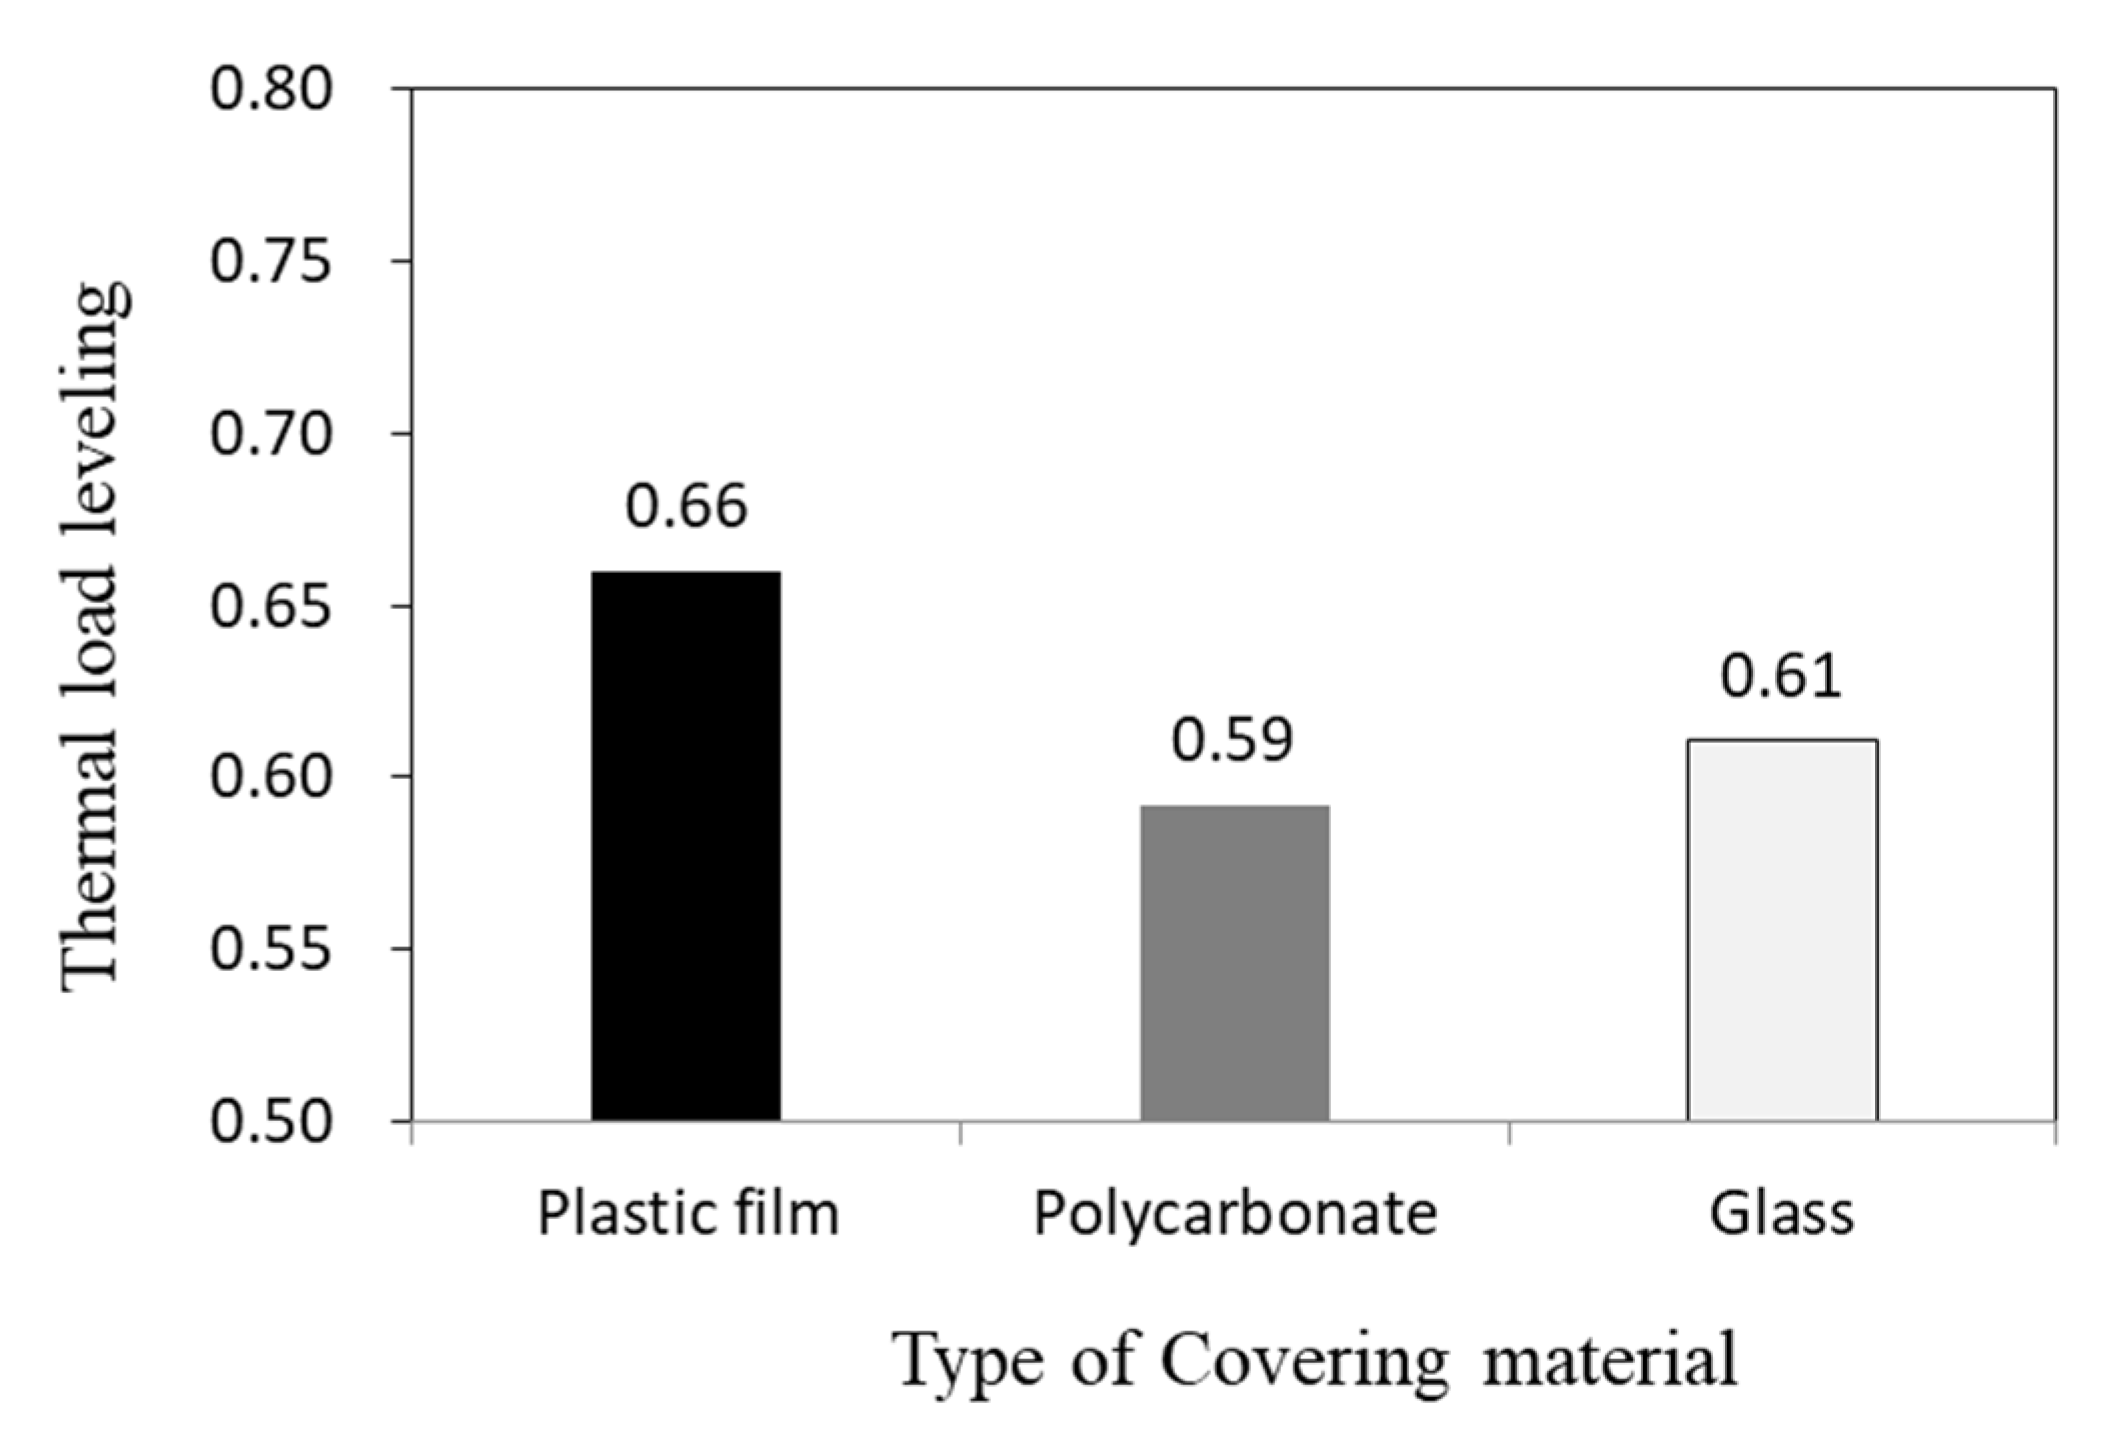
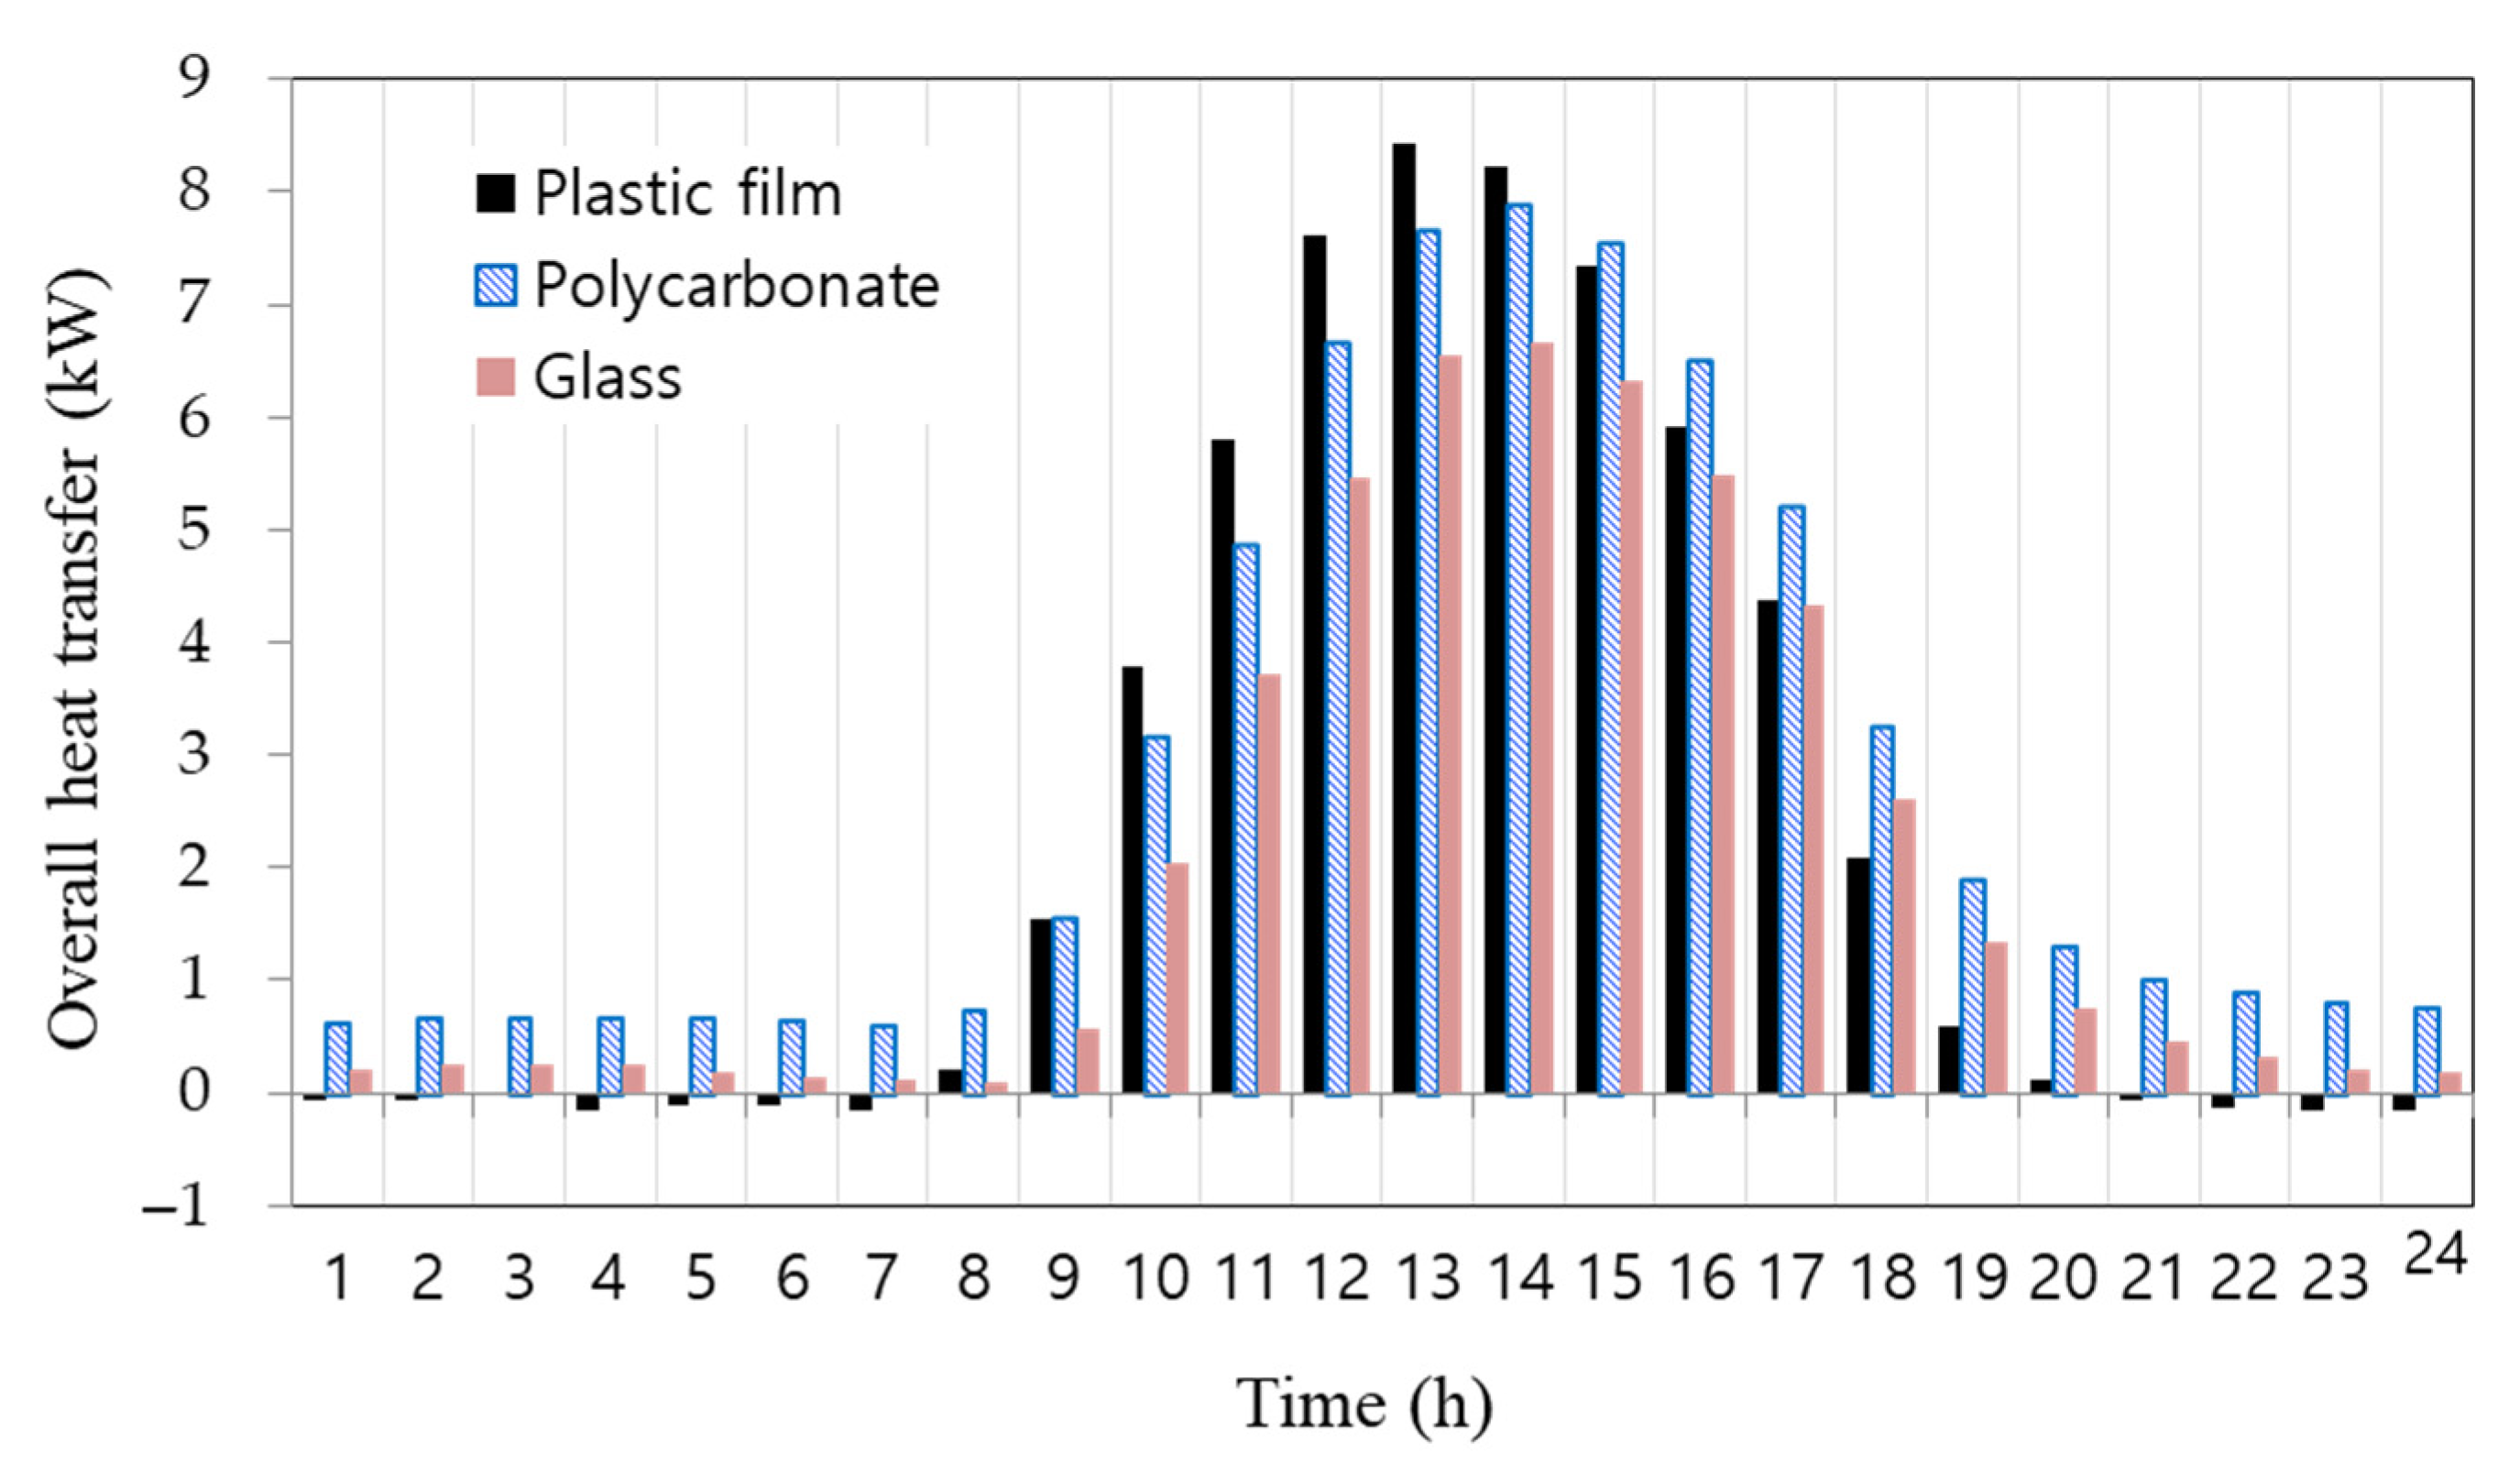
3.3. Thermal Load Leveling and Energy Exchange

Figure 13 shows the variations in the TLL of the greenhouses covered with different covering materials. Lower values represent small fluctuations in temperature inside the greenhouses, which are beneficial for energy savings and the environment for plants inside the greenhouse [16,30,31,32,33,34]. The TLL was 0.66 for the plastic-covered greenhouse, 0.59 for the PC-covered greenhouse, and 0.61 for the glass-covered greenhouse, which corresponds to the value of the PC-covered greenhouse being 10.3% and 3.0% lower, respectively, than that of the plastic- and glass-covered greenhouses. These results show that the PC-covered greenhouse performed fairly well in terms of controlling the environment and energy load of the greenhouse throughout the year; the glass-covered greenhouse had the second best performance.
Figure 14 shows the variations in the hourly overall heat transfer through the greenhouse covering materials. Both the PC- and glass-covered greenhouses exhibited a positive heat transfer throughout the day. In contrast, heat in the plastic-covered greenhouse moved from its interior to its exterior (a positive heat transfer) during the day but in the opposite direction (exterior to interior, a negative heat transfer) at night. This appears to be due to the cooling of the radiation trapped by the thin plastic film [3,19,38,39]. In the plastic-covered greenhouse, the heat transfer rate ranged from −0.16 to −0.01 kW between 21:00 and 07:00 the next day; it was particularly low at 24:00 and 07:00, with values of −0.16 and −0.15 kW, respectively. The heat transfer rate ranged from 0.11 to 8.44 kW between 08:00 and 20:00, exhibiting positive values of 0.59 and 0.11 kW at 19:00 and 20:00, respectively; this was likely because the heat stored inside the greenhouse via solar radiation during the day was released to its exterior after sunset.
The minimum heat transfer values were 0.61 kW at 07:00 for the PC-covered greenhouse and 0.09 kW at 08:00 for the glass-covered greenhouse; however, their maximum values were 8.44 kW at 13:00 and 7.88 and 6.66 kW at 14:00, respectively. These minimum and maximum heat transfer values show a trend similar to that of the minimum and maximum air temperatures inside the greenhouses.

4. Conclusions

This study examined the air temperature, humidity, surface temperature, thermal load leveling (TLL), and heat flux of different greenhouse covering materials. The results indicate that polycarbonate (PC) is the material most suitable for saving heat at night during the cold season, and glass is the most suitable for savings in cooling energy during the hot season.
The plastic-covered greenhouse exhibited the greatest variable breadth of changes in the indoor air temperature of the greenhouses, whereas the PC-covered greenhouse tended to maintain a high indoor air temperature overall. The glass-covered greenhouse had the lowest variable breadth in terms of the indoor air temperature. The indoor cover surface temperature exhibited a trend similar to that of the indoor air temperature. The relative humidity was very low at noon, ranging from 18.7 to 30.6%, indicating that it is necessary to manage the humidity of greenhouses via ventilation. We also observed that the indoor air temperature in the greenhouses and the temperatures of the indoor cover surfaces had a positive correlation with solar radiation. The relative humidity and solar radiation had a negative radiation. The coefficient of determination and slope of the plastic-covered greenhouse were relatively higher than those of the other greenhouses. Regarding the changes in the environment according to the outdoor air temperature, the indoor air and inner cover surface temperatures were positively correlated with the outdoor air temperature and the relative humidity were negatively correlated.
The TLL values of the plastic-, PC-, and glass-covered greenhouses were 0.66, 0.59, and 0.61, respectively. These results indicate that the PC-covered greenhouses had the lowest imbalance in the indoor air temperature distribution, confirming their superiority for micro-environmental control and energy savings. Finally, the overall heat transfer in the greenhouses exhibited a trend similar to that of their indoor air temperatures.
Greenhouse farms in South Korea have customarily used plastic film as a covering material. In addition, the environmental control of greenhouses is based on the experience of farmers. However, this study demonstrated that it is necessary to select greenhouse covering materials based on their economic feasibility, the microclimate environment, and relevant thermal load data. The results presented here will serve as an important basis for precise environmental control via greenhouse covering materials 24 h a day. Further research is recommended to examine the aging effects of each covering material and economic analysis that considers energy consumption, installation costs, and crop yields.

Author Contributions

Conceptualization, H.-K.K. and Y.-H.K.; methodology, S.-Y.L.; software, J.-K.K.; writing—original draft preparation, H.-K.K.; writing—review and editing, Y.-H.K.; supervision, H.-K.K. and Y.-H.K. All authors have read and agreed to the published version of the manuscript.

Funding

This research received no external funding.

Data Availability Statement

Not applicable.

Acknowledgments

This work was supported by the Cooperative Research Program for Agriculture Science and Technology Development (Project No. PJ01425701; Project No. PJ01353001) at the Rural Development Administration, Republic of Korea.

Conflicts of Interest

The authors declare no conflict of interest.

References

  1. Xu, J.; Li, Y.; Wang, R.Z.; Liu, W. Performance investigation of a solar heating system with underground seasonal energy storage for greenhouse application. Energy 2014, 67, 63–73. [Google Scholar] [CrossRef]
  2. Iddio, E.; Wang, L.; Thomas, Y.; McMorrow, G.; Denzer, A. Energy efficient operation and modeling for greenhouses: A literature review. Renew. Sustain. Energy Rev. 2020, 117, 109480. [Google Scholar] [CrossRef]
  3. Kim, H.K.; Kang, G.C.; Moon, J.P.; Lee, T.S.; Oh, S.S. Estimation of thermal performance and heat loss in plastic greenhouses with and without thermal curtains. Energies 2018, 11, 578. [Google Scholar] [CrossRef] [Green Version]
  4. Bouadila, S.; Kooli, S.; Skouri, S.; Lazaar, M.; Farhat, A. Improvement of the greenhouse climate using a solar air heater with latent storage energy. Energy 2014, 64, 663–672. [Google Scholar] [CrossRef]
  5. Yang, S.H.; Rhee, J.Y. Utilization and performance evaluation of a surplus air heat pump system for greenhouse cooling and heating. Appl. Energy 2013, 105, 244–251. [Google Scholar] [CrossRef]
  6. Nayak, S.; Tiwari, G.N. Theoretical performance assessment of an integrated photovoltaic and earth air heat exchanger greenhouse using energy and exergy analysis methods. Energy Build. 2009, 41, 888–896. [Google Scholar] [CrossRef]
  7. Kim, H.K.; Kim, Y.S.; Jeon, J.G.; Paek, Y.; Lee, J.H.; Khoshimkhujaev, B.; Kim, Y.C. Evaluation of optimal water flow and temperature in response to outdoor air temperature in plastic greenhouse with recirculated water curtain system. J. Mech. Sci. Technol. 2017, 31, 3043–3051. [Google Scholar] [CrossRef]
  8. Rural Development Administration (RDA). Energy Saving Technology for Protected Horticulture (Guide for Agricultural Techniques); RDA: Jeonju, Korea, 2014.
  9. Rural Development Administration (RDA). Guidebook of Energy Saving for Overcoming High Oil Price in Protected Horticulture; RDA: Suwon, Korea, 2008.
  10. Nam, S.W.; Yoon, Y.C.; Lee, H.W.; Lee, I.B.; Kim, H.T.; Lee, J.W.; Suh, I.H. Agricultural Facility Engineering, 2nd ed.; Hyangmunsa: Seoul, Korea, 2018. [Google Scholar]
  11. Teitel, M.; Barak, M.; Antler, A. Effect of cyclic heating and a thermal screen on the nocturnal heat loss and microclimate of a greenhouse. Biosyst. Eng. 2009, 102, 162–170. [Google Scholar] [CrossRef]
  12. Papadakis, G.; Briassoulis, D.; Scarascia Mungnozza, G.; Vox, G.; Feuilloley, P.; Stoffers, J.A. Review Paper (SE—Structures and Environment): Radiometric and thermal properties of, and testing methods for, greenhouse covering materials. J. Agric. Eng. Res. 2000, 77, 7–38. [Google Scholar] [CrossRef]
  13. Baneshi, M.; Gonome, H.; Maruyama, S. Wide-range spectral measurement of radiative properties of commercial greenhouse covering plastics and their impacts into the energy management in a greenhouse. Energy 2020, 210, 118535. [Google Scholar] [CrossRef]
  14. Japan Greenhouse Horticulture Association (JGHA). Handbook of Protected Horticulture, 5th ed.; JGHA: Tokyo, Japan, 2015.
  15. Shin, H.H.; Nam, S.W. Validation of load calculation method for greenhouse heating design and analysis of the influence of infiltration loss and ground heat exchange. Korean J. Hortic. Sci. Technol. 2015, 33, 647–657. [Google Scholar] [CrossRef]
  16. Perdigones, A.; García, J.L.; Pastor, M.; Benavente, R.M.; Luna, L.; Chaya, C.; de la Plaza, S. Effect of heating control strategies on greenhouse energy efficiency: Experimental results and modeling. Trans. ASABE 2006, 49, 143–155. [Google Scholar]
  17. American Society of Agricultural Engineers (ASAE). ASAE Standards 2003: ANSI/ASAE EP406.4 JAN03 Heating, Ventilating and Cooling Greenhouses. Available online: http://ceac.arizona.edu/sites/default/files/asae_-_heating_ventilating_and_cooling_greenhouses.pdf (accessed on 7 May 2020).
  18. Arinze, E.A.; Schoenau, G.J.; Besant, R.W. Experimental and computer performance evaluation of a movable thermal insulation for energy conservation in greenhouses. J. Agric. Eng. Res. 1986, 34, 97–113. [Google Scholar] [CrossRef]
  19. Baille, A.; López, J.C.; Bonachela, S.; González-Real, M.M.; Montero, J.I. Night energy balance in a heated low-cost plastic greenhouse. Agric. For. Meteorol. 2006, 137, 107–118. [Google Scholar]
  20. Baeza, E.; Hemming, S.; Stanghellini, C. Materials with switchable radiometric properties: Could they become the perfect greenhouse cover? Biosyst. Eng. 2020, 193, 157–173. [Google Scholar] [CrossRef]
  21. Papadopoulos, A.P.; Hao, X. Effects of greenhouse covers on seedless cucumber growth, productivity, and energy use. Sci. Hortic. 1997, 68, 113–123. [Google Scholar] [CrossRef]
  22. Alsadon, A.; Al-Helal, I.; Ibrahim, A.; Abdel-Ghany, A.; Al-Zaharani, S.; Ashour, T. The effects of plastic greenhouse covering on cucumber (Cucumis sativus L.) growth. Ecol. Eng. 2016, 87, 305–312. [Google Scholar] [CrossRef]
  23. Subin, M.C.; Karthikeyan, R.; Periasamy, C.; Sozharajan, B. Verification of the greenhouse roof-covering-material selection using the finite element method. Mater. Today Proc. 2020, 21, 357–366. [Google Scholar] [CrossRef]
  24. Statuto, D.; Abdel-Ghany, A.M.; Starace, G.; Arrigoni, P.; Picuno, P. Comparison of the efficiency of plastic nets for shading greenhouse in different climates. In Proceedings of the International Mid-Term Conference of the Italian Association of Agricultural Engineering, Matera, Italy, 12–13 September; Springer: Cham, Switzerland, 2019; pp. 287–294. [Google Scholar]
  25. Ministry of Agriculture, Food and Rural Affairs (MAFRA). The Status of Vegetable Greenhouse Facilities and Vegetables Production in 2018; MAFRA: Sejong, Korea, 2019. Available online: http://library.mafra.go.kr/skyblueimage/12716.pdf (accessed on 7 May 2020).
  26. Ahamed, M.S.; Guo, H.; Tanino, K. Energy saving techniques for reducing the heating cost of conventional greenhouses. Biosyst. Eng. 2019, 178, 9–33. [Google Scholar] [CrossRef]
  27. Fabrizio, E. Energy reduction measures in agricultural greenhouses heating: Envelope, systems and solar energy collection. Energy Build. 2012, 53, 57–63. [Google Scholar] [CrossRef]
  28. Fadel, M.A.; Hammad, B.; Faisal, A.H.; Iwaimer, O. Greenhouses covering materials: A comparative study. Agric. Eng. Int. CIGR J. 2016, 18, 48–57. [Google Scholar]
  29. Mills, A.F. Heat Transfer, International, Student ed.; Richard, D., Ed.; Irwin: Homewood, IL, USA, 1992. [Google Scholar]
  30. Ghosal, M.K.; Tiwari, G.N.; Das, D.K.; Pandey, K.P. Modeling and comparative thermal performance of ground air collectorand earth air heat exchanger for heating of greenhouse. Energy Build. 2005, 37, 613–621. [Google Scholar] [CrossRef]
  31. Rajoria, C.S.; Agrawal, S.; Chandra, S.; Tiwari, G.N.; Chauhan, D.S. A novel investigation of building integrated photovoltaic thermal (BiPVT) system: A comparative study. Sol. Energy 2016, 131, 107–118. [Google Scholar] [CrossRef]
  32. Tiwari, S.; Bhatti, J.; Tiwari, G.N.; Al-Helal, I.M. Thermal modelling of photovoltaic thermal (PVT) integrated greenhouse system for biogas heating. Sol. Energy 2016, 136, 639–649. [Google Scholar] [CrossRef]
  33. Tiwari, G.N.; Akhtar, M.A.; Shukla, A.; Emran Khan, M. Annual thermal performance of greenhouse with anearth–air heat exchanger: An experimental validation. Renew. Energy 2006, 31, 2432–2446. [Google Scholar] [CrossRef]
  34. Tomar, V.; Norton, B.; Tiwari, G.N. A novel approach towards investigating the performance of different PVT configurations integrated on test cells: An experimental study. Renew. Energy 2019, 137, 93–108. [Google Scholar] [CrossRef]
  35. Fokaides, P.A.; Kalogirou, S.A. Application of infrared thermography for the determination of the overall heat transfer coefficient (U-Value) in building envelopes. Appl. Energy 2011, 88, 4358–4365. [Google Scholar] [CrossRef]
  36. Suleiman, B.M. Estimation of U-value of traditional North African houses. Appl Therm. Eng. 2011, 31, 1923–1928. [Google Scholar] [CrossRef]
  37. Ozturk, H.H. Experimental determination of the overall heat loss coefficient for energy requirement of greenhouse heating. Int. J. Energy Res. 2005, 29, 937–944. [Google Scholar] [CrossRef]
  38. Papadakis, G.; Frangoudakis, A.; Kyritsis, S. Theoretical and experimental investigation of thermal radiation transfer in polyethylene covered greenhouses. J. Agric. Eng. Res. 1989, 44, 97–111. [Google Scholar]
  39. Montero, J.I.; Castilla, N.; Gutiérrez de Ravé, E.; Bretones, F. Climate under plastic in the Almería area. Acta Hortic. 1985, 170, 227–234. [Google Scholar] [CrossRef]
  40. Al-Helal, I.M.; Waheeb, S.A.; Ibrahim, A.A.; Shady, M.R.; Abdel-Ghany, A.M. Modified thermal model to predict the natural ventilation of greenhouses. Energy Build. 2015, 99, 1–8. [Google Scholar] [CrossRef]
  41. García, J.L.; De la Plaza, S.; Navas, L.M.; Benavente, R.M.; Luna, L. Evaluation of the feasibility of alternative energy sources for greenhouse heating. J. Agric. Eng. Res. 1998, 69, 107–114. [Google Scholar] [CrossRef]
Figure 1. External views and schematics of the three experimental greenhouses used in this study: (a) arch-shaped greenhouse covered with plastic (PO) film, (b) even-span type greenhouse covered with polycarbonate material, and (c) even-span type greenhouse covered with glass.
Agronomy 12 00143 g001
Figure 2. Variations in outside temperature and solar radiation over time (12–13, 19–20, and 26–27 October 2019).
Agronomy 12 00143 g002
Figure 3. Variations in outside relative humidity and wind speed over time (12–13, 19–20, and 26–27 October 2019).
Agronomy 12 00143 g003
Figure 4. Variations in the outdoor and indoor air temperatures of greenhouses covered with different covering materials (12–13, 19–20, and 26–27 October 2019).
Agronomy 12 00143 g004
Figure 5. Comparison of indoor and outdoor air temperatures as a function of solar radiation in greenhouses covered with different covering materials (12–13, 19–20, and 26–27 October 2019).
Agronomy 12 00143 g005
Figure 6. Comparison of indoor and outdoor air temperatures as a function of outdoor air temperature in greenhouses covered with different covering materials (12–13, 19–20, and 26–27 October 2019).
Agronomy 12 00143 g006
Figure 7. Variations in the outdoor air temperature and inner cover surface temperatures of greenhouses covered with different covering materials (12–13, 19–20, and 26–27 October 2019).
Agronomy 12 00143 g007
Figure 8. Comparison of inner cover surface temperatures as a function of solar radiation in greenhouses covered with different covering materials (12–13, 19–20, and 26–27 October 2019).
Agronomy 12 00143 g008
Figure 9. Comparison of inner cover surface temperatures as a function of outdoor air temperatures in greenhouses covered with different covering materials (12–13, 19–20, and 26–27 October 2019).
Agronomy 12 00143 g009
Figure 10. Variations in the outdoor and indoor relative humidity of greenhouses covered with different covering materials (12–13, 19–20, and 26–27 October 2019).
Agronomy 12 00143 g010
Figure 11. Comparison of relative humidity as a function of solar radiation in greenhouses covered with different covering materials (12–13, 19–20, and 26–27 October 2019).
Agronomy 12 00143 g011
Figure 12. Comparison of relative humidity as a function of outdoor air temperatures in greenhouses covered with different covering materials (12–13, 19–20, and 26–27 October 2019).
Agronomy 12 00143 g012
Figure 13. Variations in the thermal load level of greenhouses with different covering materials (12–13, 19–20, and 26–27 October 2019).
Agronomy 12 00143 g013
Figure 14. Hourly variations in heat flux in greenhouses covered with different covering materials (12–13, 19–20, and 26–27 October 2019).
Agronomy 12 00143 g014
Table 1. Thickness and thermal properties of plastic (PO) film, polycarbonate, and glass.
ConditionThickness
(mm)
Thermal Conductivity
(W m1 K−1)
Specific Heat
(J kg1 K−1)
EmissivitySolar Transmittance
(%)
Plastic film0.150.33
[26]
0.2
[26]
87
[26]
Polycarbonate6.00.06
[27]
1220
[27]
0.9
[27]
86–86.8
[27,28]
Glass4.00.76
[26]
840
[29]
0.9
[26]
88–93
[26]
Publisher’s Note: MDPI stays neutral with regard to jurisdictional claims in published maps and institutional affiliations.

