Article

Efficiency of Methodologies Used in the Evaluation of the Weed Seed Bank under Mediterranean Conditions

by
María Luisa Gandía
1,2,
Juan Pablo Del Monte
2 and
María Inés Santín-Montanyá
1,*
1
Environment and Agronomy Department, National Institute for Agricultural and Food Research and Technology (INIA-CSIC), 28040 Madrid, Spain
2
School of Agricultural, Food and Biosystems Engineering (ETSIAAB-UPM), Universidad Politécnica de Madrid, 28040 Madrid, Spain
*
Author to whom correspondence should be addressed.
Agronomy 2022, 12(1), 138; https://doi.org/10.3390/agronomy12010138
Submission received: 29 November 2021 / Revised: 29 December 2021 / Accepted: 31 December 2021 / Published: 6 January 2022

Abstract

:
The objective of this study was to compare the efficiency of two methodologies, seed germination (SG) and seed physical extraction SPE), to assess the weed community from two locations with different soil and climatic conditions: M, with dry and low soil fertility, and S with high soil humidity and fertility. Over three years of study, the analysis of both methodologies confirmed differences in seed bank composition. In M, fewer seeds were recorded by SG than SPE (13.5% and 86.5% respectively), while in S, the difference between percentages was less (31.58% by SG and 68.41% by SPE). Our findings confirmed that Portulaca oleracea L., Amaranthus blitoides S. Watson and Chenopodium album L. were abundantly found in M. Anacyclus clavatus (Def.) Res. seeds were also found, mainly detected by SG. In S, Stellaria media (L.) Vill. was widely found. All species found in S were similarly detected by SG and SPE. The results confirmed that climatic and soil conditions influenced the efficiency of the methodology used to assess the seed bank. M conditions led to an increased seed reservoir, and both methodologies were necessary to obtain the seed bank composition. In S conditions, the seed bank was continuously renewed, and either one of methodologies defined the seed bank composition equally well.

1. Introduction

The soil seed bank consists of a mix of mature viable seeds in various states of dormancy which have the potential to restock the weed population and these plants may constitute species that are targeted by weed control [1,2,3]. The seed banks, which contain seeds of multiple generations, are a potential source of diversity and contribute to the dynamics and persistence of the weed community [4,5]. The composition of the soil seed bank reflects the different strategies used by the species in the production, dispersal and survival of their seeds [6]. These survival strategies, such as the size and number of seeds or seed dormancy, affect how the soil seed bank is replenished.
There is a continuous flow of seed input and output in the soil, which gives the soil seed bank a spatial and temporal distribution. Seed bank spatial distributions can have a strong effect on the subsequent plants [7]. The spatial heterogeneity of the seed bank depends on the spatial distribution of adult plants and, consequently, the area where their seeds fall [8]. Regarding the temporal composition of the soil seed banks, some species produce large quantities of seeds capable of remaining viable in the soil for more than a year. Edapho-climatic conditions affect some seeds and can lead either to death or dormancy if germination does not occur quickly; in response to these conditions some species resort to strategies, such as the production of non-dormant seeds that can germinate quickly [9,10]. Seed predation, for example by insects or birds, will affect both the spatial and temporal distribution [11,12].
In arable fields, there is evidence that management practices and environmental changes affect the germination pattern of seeds in the seed bank [13,14,15,16]. In general, seeds from annual weeds germinate in spring or autumn, some plants produce viable seeds that germinate opportunistically, and others produce dormant seeds which lie in wait for a period of time. Under stressful climatic conditions, plants which normally produce viable seeds may also produce seeds which enter a state of induced dormancy; this is termed secondary dormancy [17,18]. Increased levels of seed dormancy seeds lead to a longer lasting weed seed bank which, in turn, will make weed infestation of the crop more likely [19].
Research has increased our understanding of the influence of management practices on the composition of soil seed banks [20,21,22,23,24,25,26]. Such management practices include tillage, crop rotation, and weed control [27,28,29,30]. In previous studies our research group has concluded that changes in tillage or land management lead to changes in the weeds, and land managers need to have a reliable way to evaluate the weed seed bank in order to predict changes in weed populations and prevent dominant species [31].
The soil seed bank of a field provides a retrospective view of the historical soil management and cultivation in previous years and, at the same time, a predictive insight into possible future management problems [32]. This two-faced vision qualifies the seed bank as a key element to understanding the dynamics of weed flora in agroecosystems [33]. Some authors [34,35] have pointed out that the need for precision levels of seed bank studies depend on the focus of the study. For example, when studying weed flora changes over time a general overview is important, however if there is a specific weed that may be problematic and we want to assess its persistence, we need to increase the precision of the test used [34]. The seed bank can therefore be considered as an essential part of any weed population, and its study and analysis can be useful for a variety of purposes.
Seed bank characterization has traditionally been reported using two methodologies: (1) the seedling germination test (SG) and (2) the seed physical extraction test (SPE). These methodologies have been well described and sometimes modified to improve the information that is provided. SG is an effective indirect method to count viable seeds [36,37]; however, it has a drawback, being that seeds in dormancy are difficult to germinate. As such, the methodology of this test needs to be extended to ensure that the conditions are optimized so that all viable seeds germinate and are counted. On the other hand, SPE is a direct method [38] that can efficiently detect viable and dormant seeds. It has been considered by some studies to be the methodology that best describes the whole weed seed bank [39,40]. However, it is a more time-consuming method and is not effective for monitoring wind-blown species (with achenes structures or propagules) that are not always detected because they can be easily confused with straw residues and make for difficult species identification [41,42]. Some studies have suggested that both seed bank methods are used together, as they are complementary [43,44,45,46].
We know that the survival strategies of arable weeds, such as the seed dormancy state, change in response to land-use and edaphic and climatic conditions. The focus of our study is to evaluate the efficiency of these methodologies in the field, taking into account local conditions. Our working hypothesis is that by a careful analysis of the results of these two methodologies under the contrasting edapho-climatic conditions of two different locations, we can propose terms for using SG and SPE in the most efficient way (either one or the other or in combination) to obtain reliable results about the structure and composition of seed banks.

2. Materials and Methods

Field studies were conducted at two INIA experimental farms located in central Spain “La Canaleja” (Madrid: 40°32′ N, 3°20′ W; 600 m), and southern Spain, “El Majano” (Seville: 37°24′ N, 6°05′ W; 3 m). According to Köppen-Geiger climate classification, the Madrid experimental site (M) corresponds to a semiarid cold Mediterranean climate (BSk) with average annual temperature ranging from 4.4 °C to 21.5 °C, and an historical mean (1967–2019) annual precipitation of 372 mm. The soil is a Typic Calcixerept, Inceptisol [47], pH of 8 and a low inherent fertility. The Seville experimental farm (S) can be classified as a hot-summer Mediterranean climate (Csa) with an annual thermal regime average value between 14 and 19 °C, and an historical average (1967–2019) annual precipitation of 534 mm. The soil was Typic Haploxerert, Vertisol [47], pH of 7.5 and high fertility. Figure 1 reports the average monthly precipitation and temperature recorded during the period of study, from 2017 to 2019, and the historical mean precipitation in both locations.
Both field sites were in fallow the year previous to the start of the study. During this period, the field labors were made in order to ensure that the data reflected treatment responses and not experimental start-up anomalies. A crop rotation system consisting of wheat (Triticum aestivum L.), barley (Hordeum vulgare L.), pea (Pisum sativum L.) and rape (Brassica napus L.) was established. All phases of the rotation were present each year. The trials were managed with minimum tillage (land was chisel ploughed at 15 cm and then a field cultivator sweep was used) at seed-bed preparation between October and November. The sowing was performed with a conventional drill with a line spacing of 13 cm. Both fields were farmer-managed with the typical agronomic practices of the region; harrowing with long-flex spring tines was employed to control weeds in plots from March to April according to necessity.
Each cereal and rape plot were fertilized yearly with a mineral fertilizer 8–24–8 (N, P, K) at 200 kg/ha, which was applied at sowing time. In addition, at the end of the wheat tillering phase (stage 31 on the Zadoks scale), NO3 NH4 (27–0–0) at 200 kg/ha was applied in all plots.
Data were recorded for the purpose of soil seed bank dynamic analysis from the two locations during the crop years of 2017–2018, 2018–2019 and 2019–2020. The experimental design was established in four replications, and each plot (15 m × 30 m) was assorted in a randomized complete block design (RCBD) with 16 plots, giving a total experimental area in each location of 4.800 m2. The seed banks’ composition in both locations are shown in Table 1.

2.1. Soil Seed Bank Sampling, Experimental Design and Methods of Quantification

The experimental design was arranged as a randomized complete block layout with three factors (year, location and methods of quantification) and four replicates. Seed bank sampling was carried out at both locations at the beginning of each season, the first week of November, and after the pre-sowing labor work but before sowing. In each location, M (dryland and low soil fertility) and S (high soil humidity and fertility), 144 reference points were fixed using a 3 × 7 m grid, with 9-point samples in each plot. These georeferenced points remained fixed for the three years of the trial.
At each sample point, two soil cores (5 cm of diameter and 12 cm depth) with a soil bulk density ranging between 1.4 and 1.6 g cm−3, were taken from each, therefore 288 soil samples per year were collected in each experiment. The soil samples were transported to the laboratory, air-dried and stored in cold storage at 2 °C. Each of the two soil samples taken at the points were handled according to the test to which they were to be submitted, used either for the seed germination test or the seed physical extraction test.

2.2. Seed Germination Test (SG)

The germination trial was initiated each year after a period of three months in cold storage. Cold, dry conditions have been shown to improve the germination of many species in the soil seed bank [49]. Each soil sample (400 g) was spread in aluminum trays (20 × 8 × 5 cm) over sterilized vermiculite. The trays were kept in a greenhouse with controlled temperature (30 °C max, 5 °C min) and were watered regularly by an automatic irrigation system. Soil samples were in the greenhouse for 12 months, starting from February, followed by a summer break from June to August, and then resumed in September. Subsequently, a winter break was carried out in December and January and finally, in February, watering was resumed and the trays were removed to be replaced by new samples.
In order to break dormancy periods, the trays were regularly stirred to mix the soil and, when the rate of seedling emergence slowed down, irrigation was suspended for 15 days [50]. On a weekly basis, as seedlings emerged, they were identified, counted and removed. Species that could not be identified were transplanted and grown until they could be identified.

2.3. Seed Physical Extraction Test (SPE)

Soil samples of 200 g (dried and without stones) were placed in plastic tubes (235 cc) and immersed in a flotation solution (potassium hexa-metaphosphate at 200 g/L) according to Malone methodology [38]. The mixture (soil and solution) was subjected to several periods of agitation, and the contents retained by each tube were air-dried for 48 h. Seeds were then extracted by separating them from the residues and identified using a magnifying glass on the basis of their physical characteristics through identification guidelines and websites [51,52]. Seeds that withstood the application of gentle pressure with fine forceps were considered viable.
Each test methodology calls for different weights of soil per sample, and we used the standard quantities according to the methodologies. In order to transfer the weights to comparable data we adjusted using the coefficient Ć [53,54]. This gives us data for the number of seeds per 1 m2:
Ć = 10,000 × h × BD/g
where h = depth of sample (cm); BD = bulk density (g cm−3) and g = weight of an average sample (g).

2.4. Statistical Analysis

Correspondence analysis (CA) was carried out to correlate the relationship between the sampling sites and the variables object of study: (1) location, (2) year seasonality (climatic conditions) and, (3) methodologies of seed bank study. The relationships between the density of weed seed communities were analyzed in order to define tendencies. The next step was to undertake hierarchical clustering, used for identifying groups of similar observations in a data set. The HCPC (hierarchical clustering on principal components) analysis allows us to combine the multivariate data analyses. In this study the principal component method used was CA. Then, in each location, to complement this information, we incorporated an analysis of variance of the common species with high incidence in the seed bank data, carried out using cluster characterization for each location using year and methodology as categorical variables. Data from seed density was sqrt transformed to ensure constant variance over the treatments and a normal distribution for the residuals thus indicating conformation to the assumptions of the analysis. The means were separated using Fisher’s protected least significance difference test at the 0.05 probability level (p < 0.05). The R-Project software (Vegan, Ade4 and FactoMinerR) packages were used for data processing [55,56,57].

3. Results

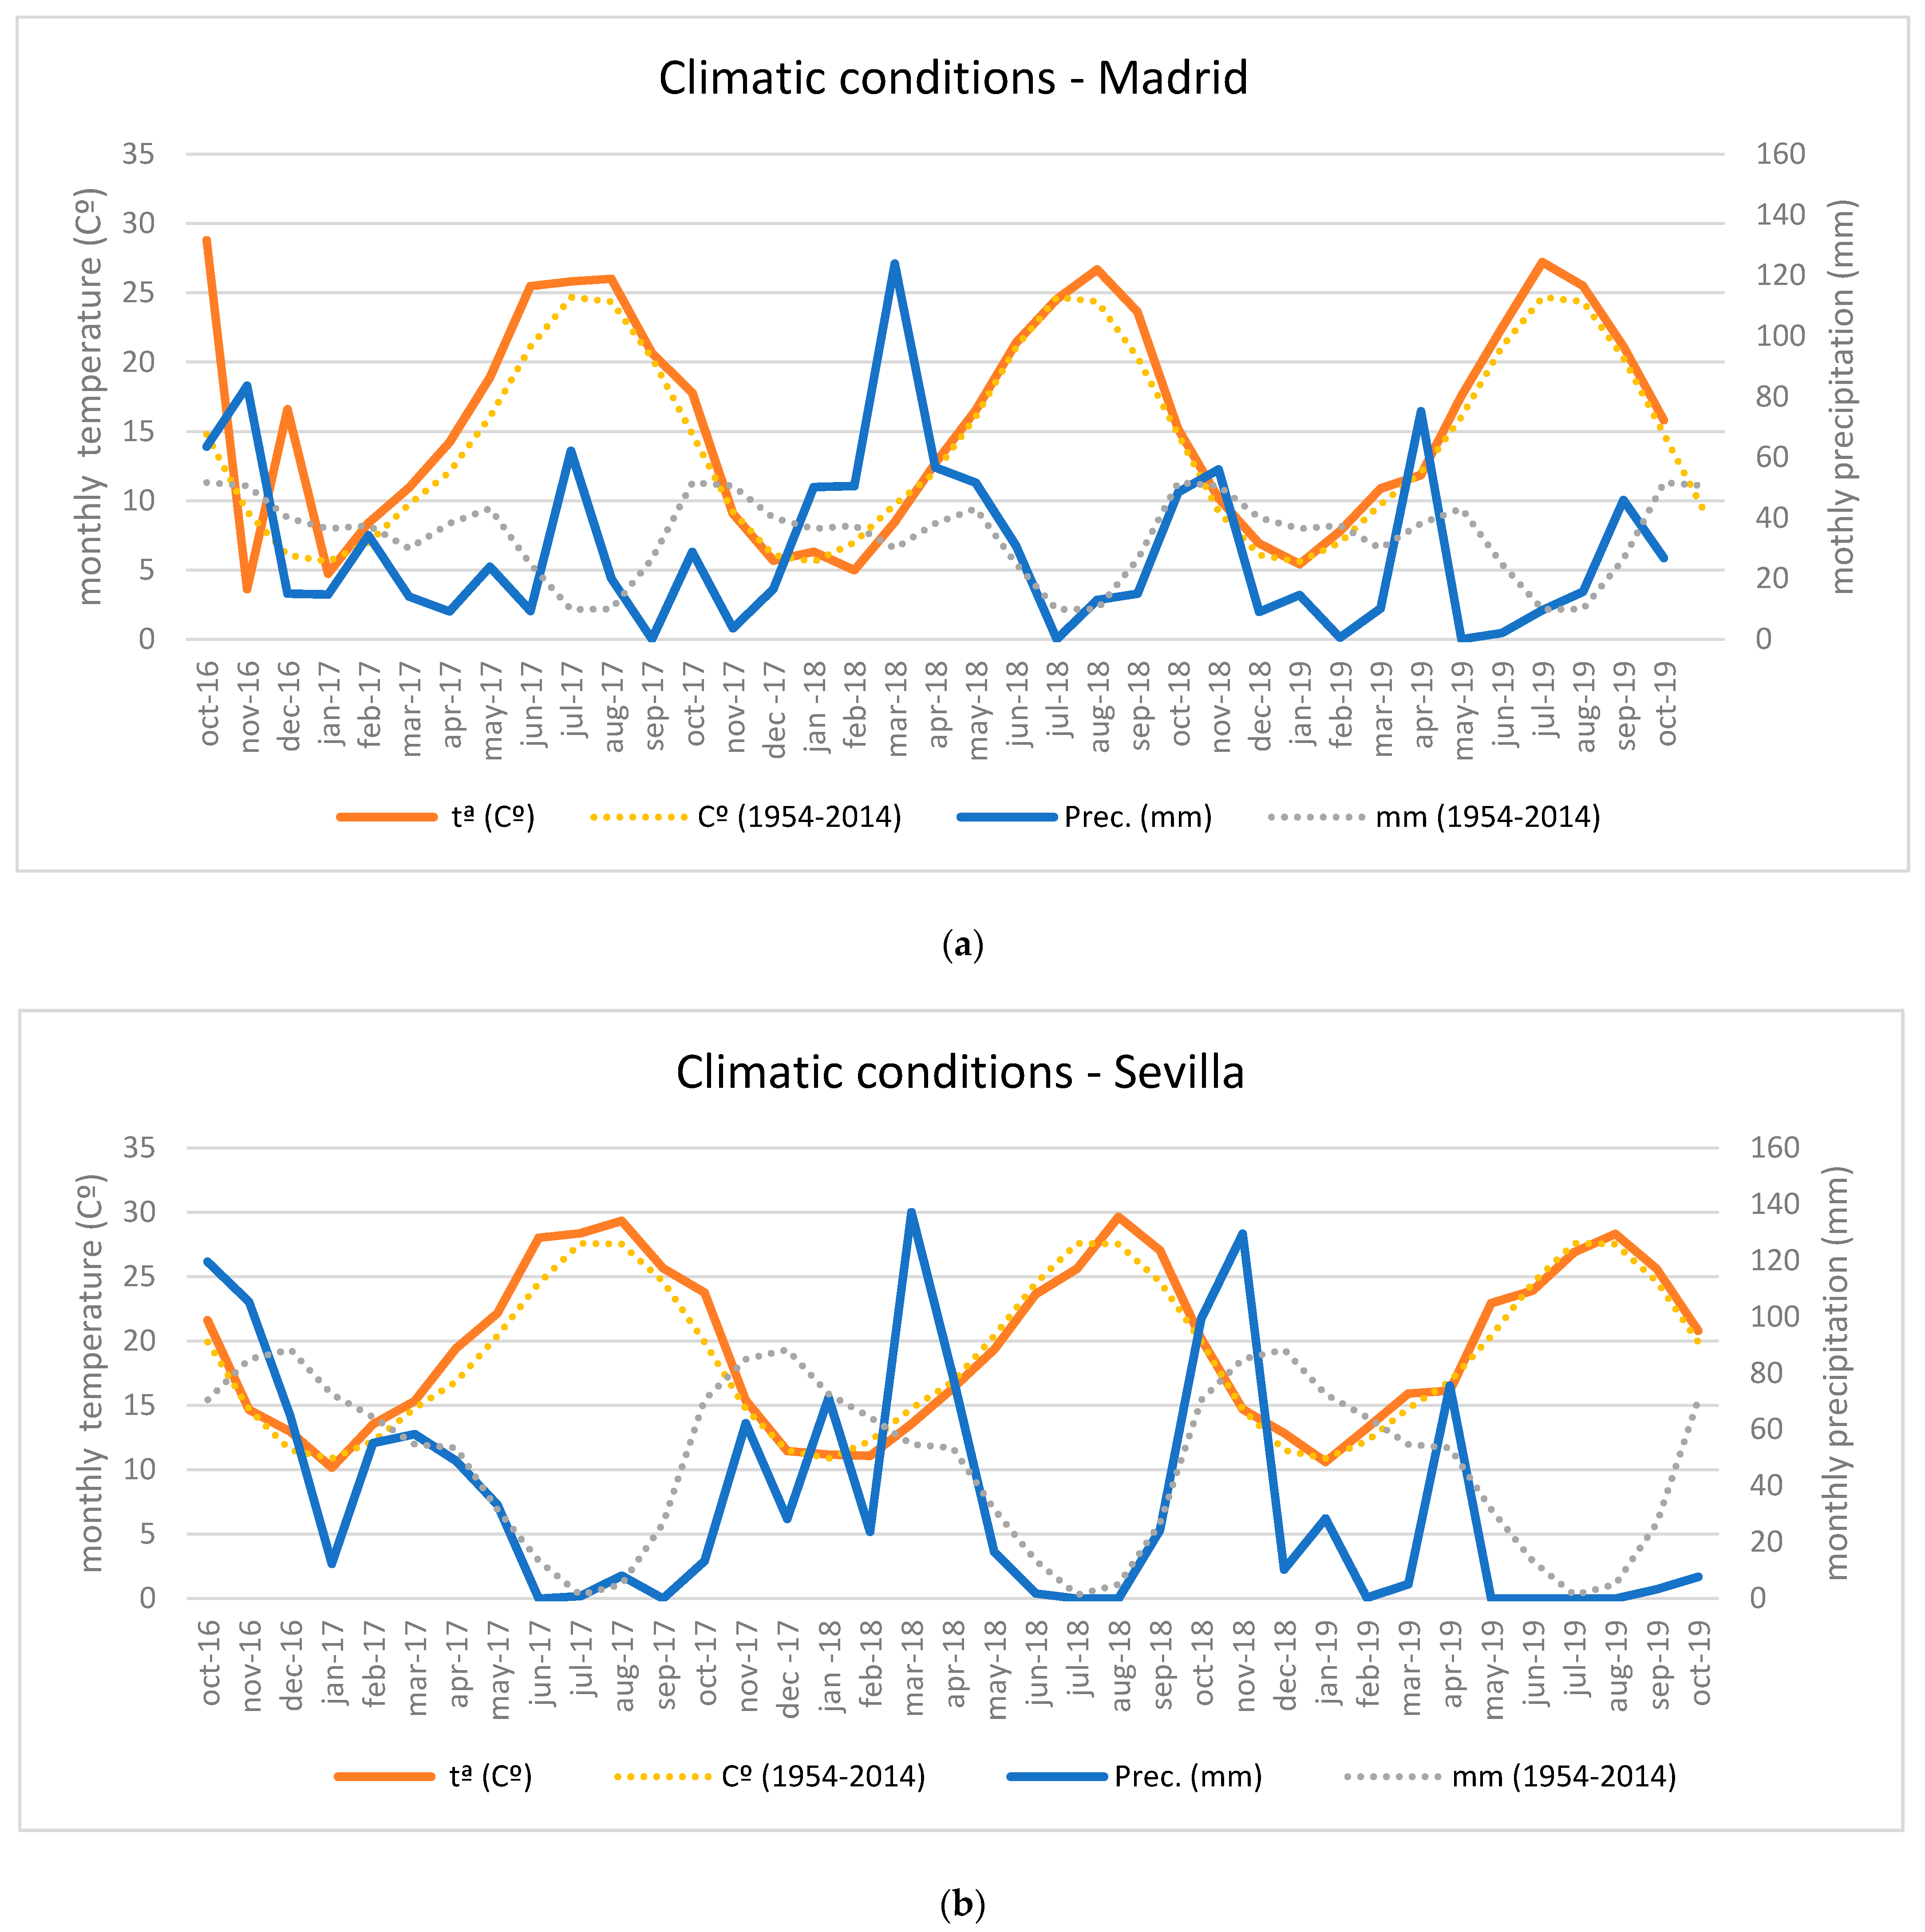
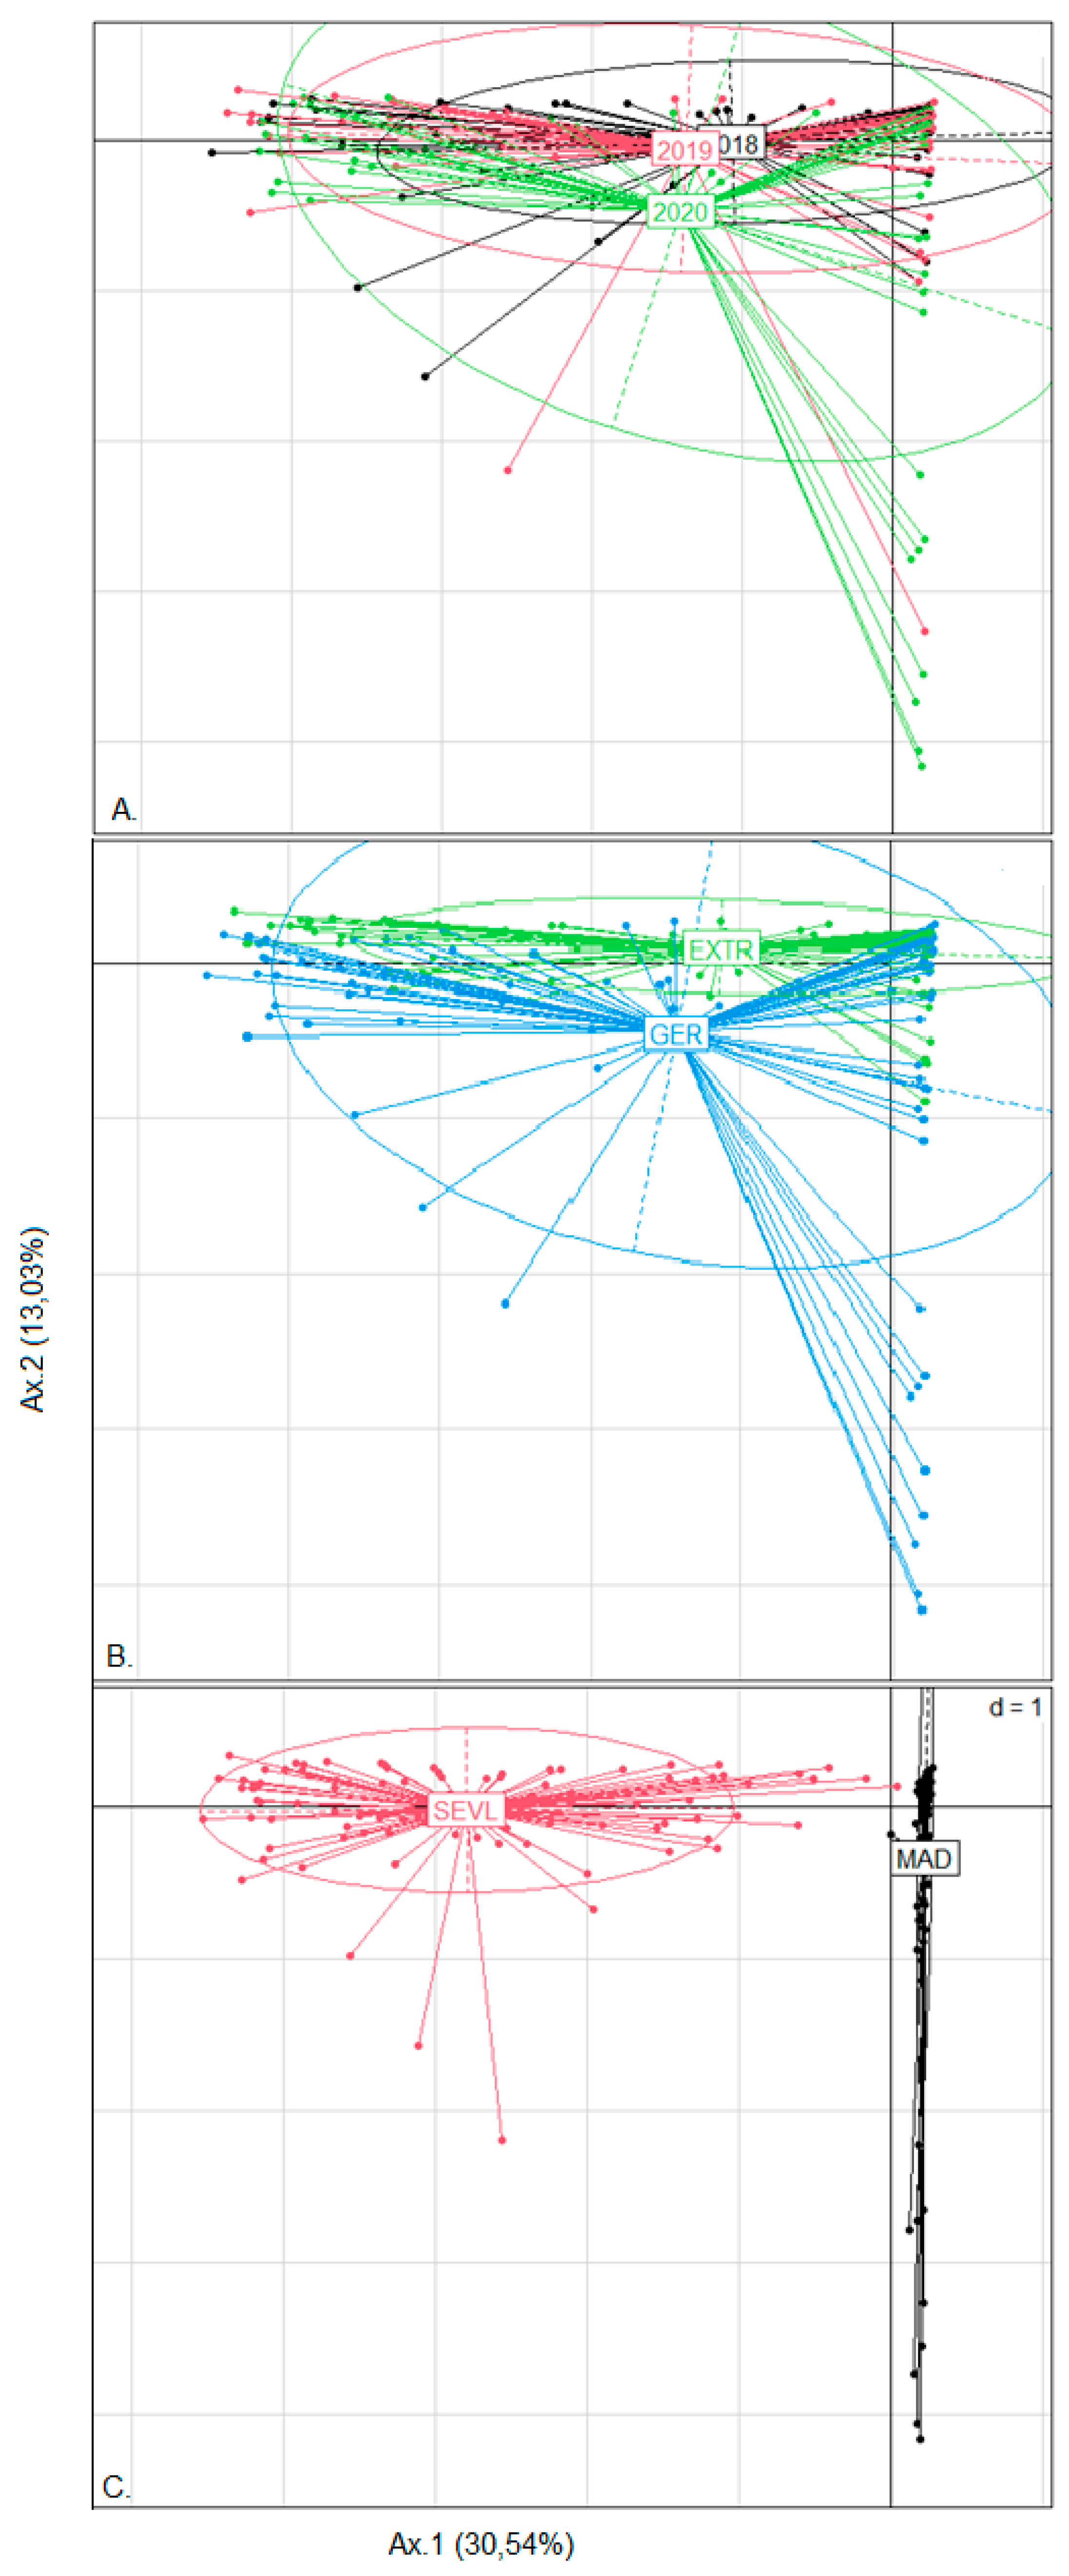
3.1. Climatic Conditions during the Study Period

Total and seasonal rainfall in both locations varied markedly from year to year during the experimental period, which is typical of Mediterranean conditions (Figure 1). During the first year of study (2017–2018), both locations were rainy (349.9 mm and 506.9 mm in M and S places respectively), although at lower levels than the historical means (<5%). In the second year of study, 2018–2019, in M site the precipitation deviated from its historical mean rainfall by >18% and the opposite occurred in S, with lower rainfall (<13%) than the mean. In 2019–2020 it was particularly dry (22.43% and 34.11% less rainfall than the historical mean in M and S locations, respectively). During the years of the study, the annual mean temperature in the M site was 15.6 °C and 19.5 °C in S site.
Both locations can be described as representative of a Mediterranean climate with irregularly distributed rainfall. During the period of study, in the M site, the rainfall was concentrated in autumn-winter (64% and 62%) in 2017–2018 and 2018–2019, and the last year was characterized by well-distributed rainfall (48% in autumn-winter and 52% in spring-summer). Whereas in the S site, the rainfall was heavily concentrated in the autumn-winter season (82%, 73% and 78%) during the three years of study.

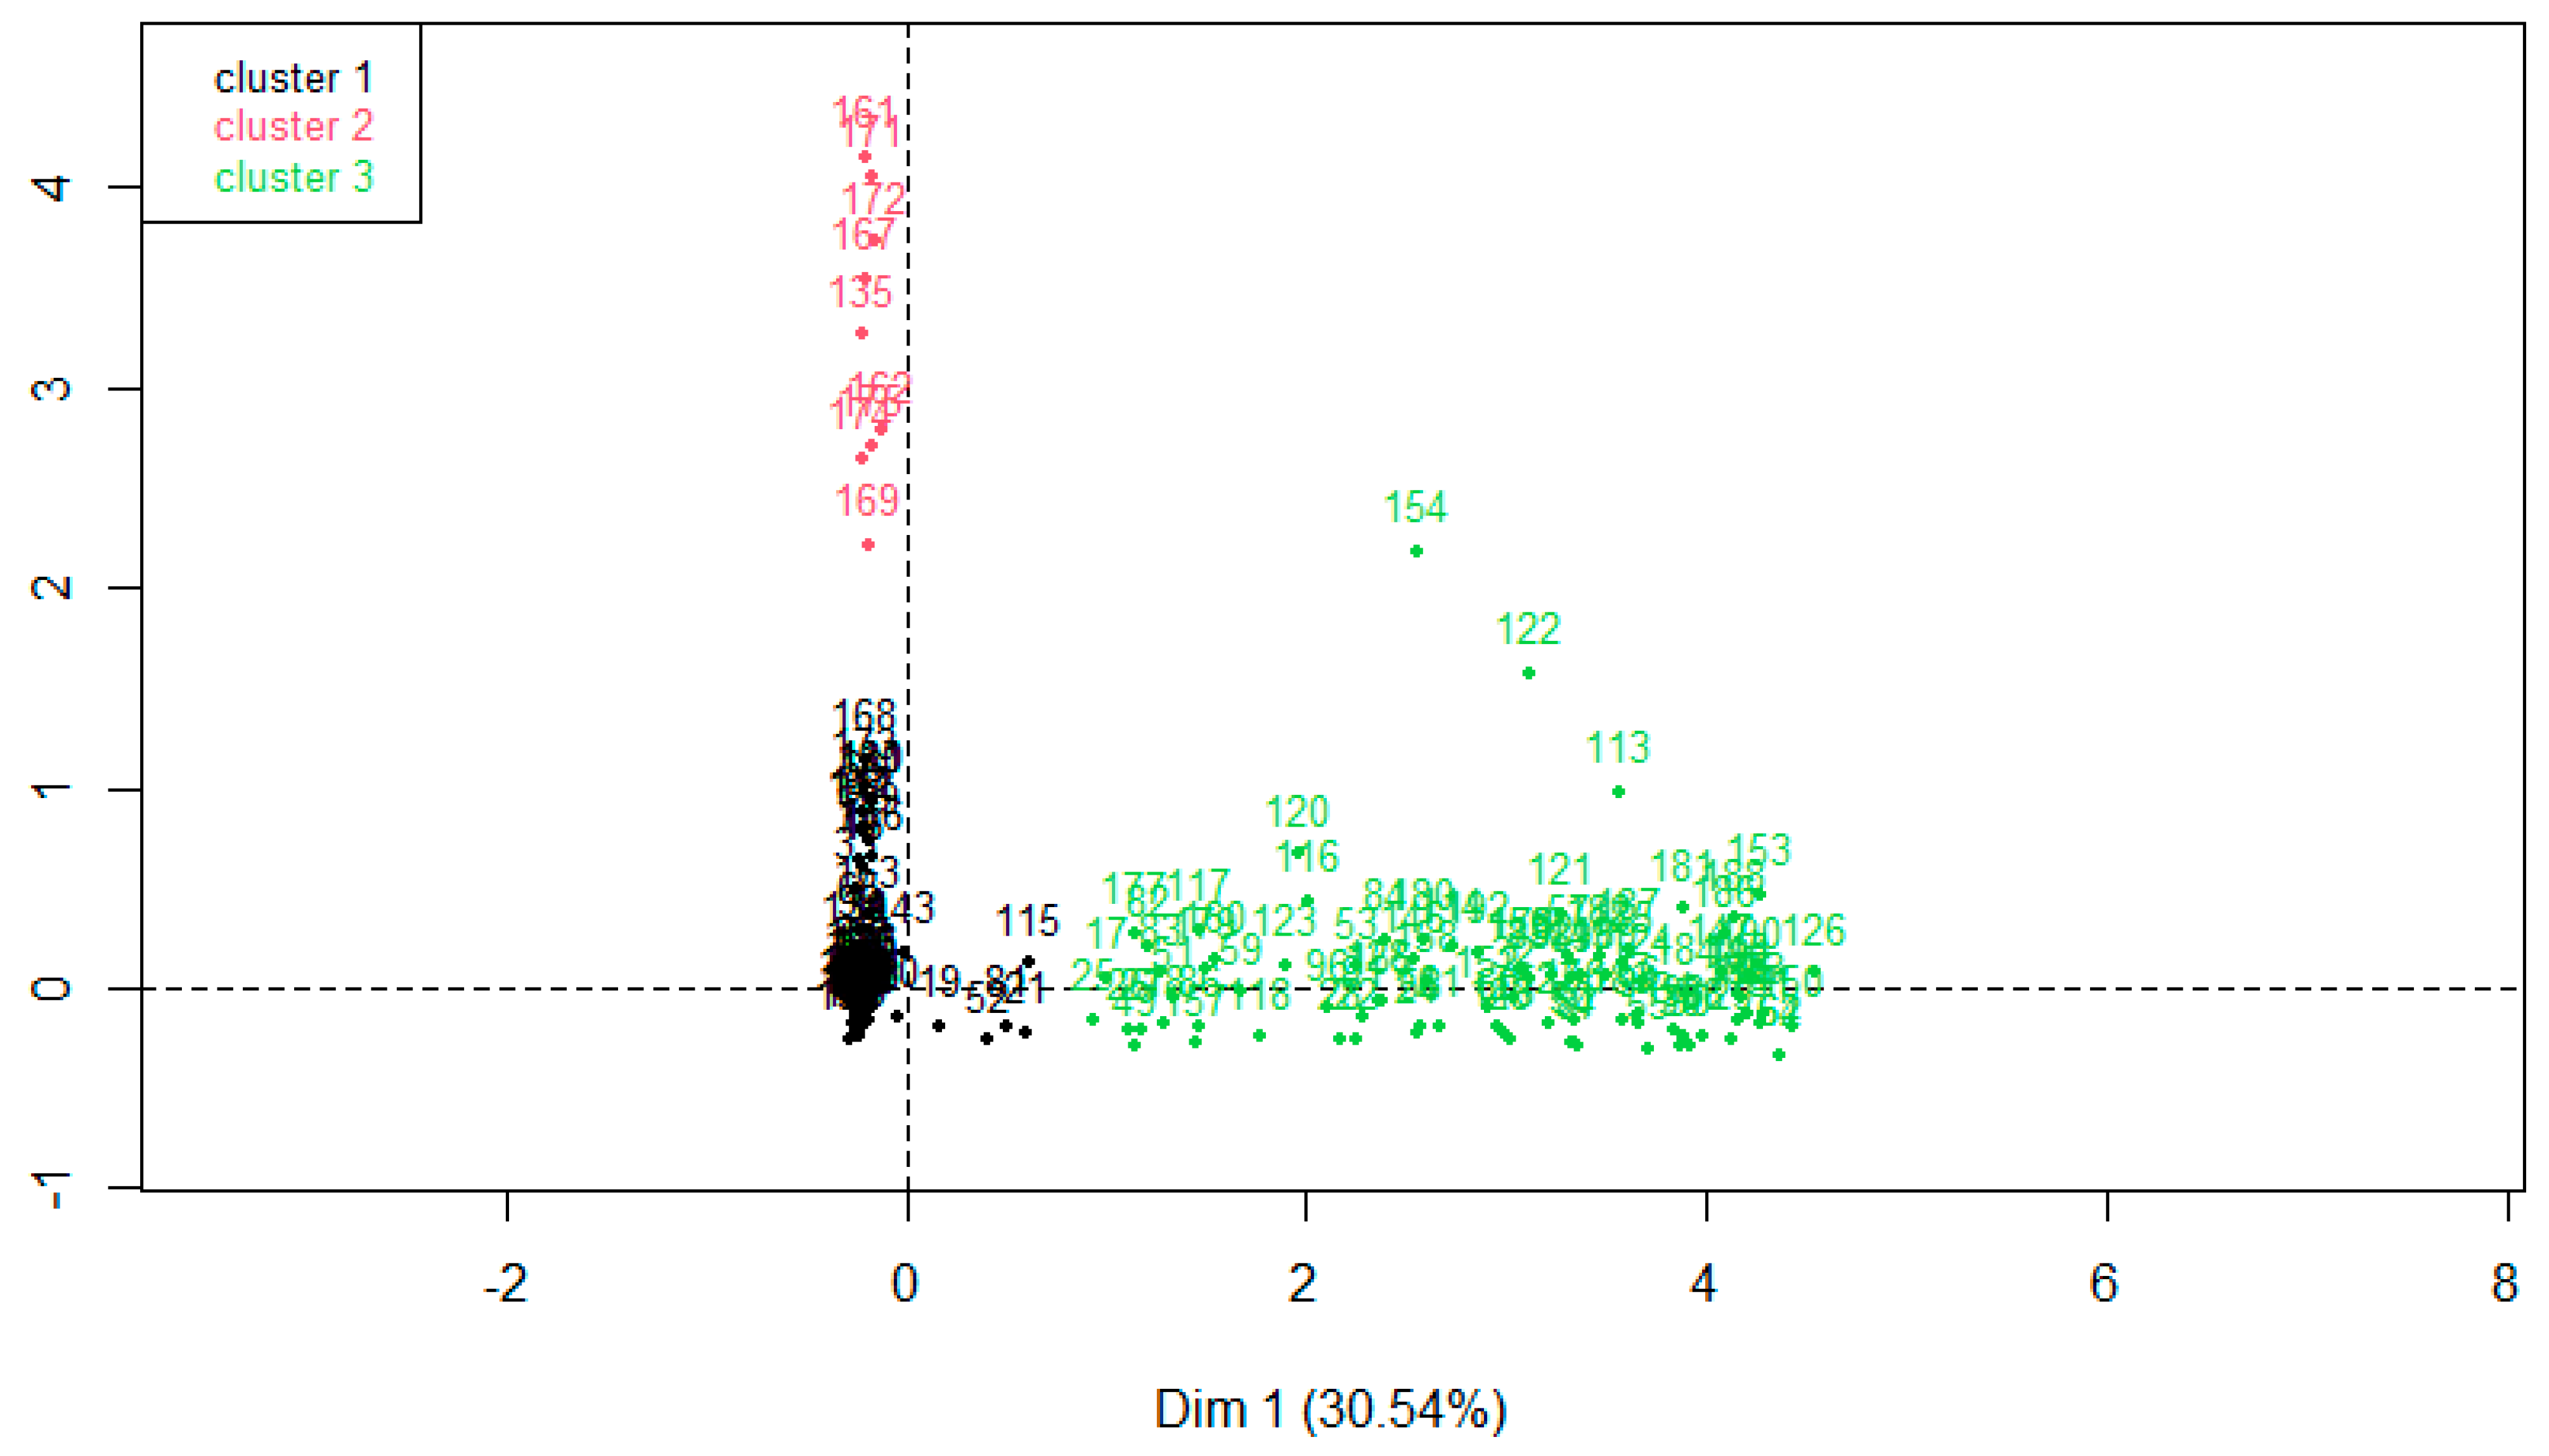
3.2. Correspondence Analysis (CA) Hierarchical Clustering on Principal Components (HCPC) of Weed Seed Banks

Figure 2 shows the correspondence analysis (CA) expressed as ordiplots (A. B. C.). This dataset contains 4608 sample points categorized by three variables: year, methodology and location, and are considered qualitative and illustrative of the behavior of the seed bank. Each ordiplot, which shows centroids for each variant of the studied variable (year, methodology and location), represents the association between the spatial arrangement of the weed seeds in the field and the weight of the effects of the variables. The projected inertia for the two main axes was 30.54% and 13.03% in the ordiplot. The accumulative inertia value for the first two dimensions of this analysis was close to 43.58%, meaning that the total variability is well described with this correspondence analysis. This percentage value (validity) was strong and allows us to explain the weight of the categorical variables (year, methodology and location) and the weight or dependence of the sample points on these variables.
A (CA) projection on the sampling points dataset shows that, based on the weed characteristics contained in each sampling point, points tend to cluster in agreement with the factor classification studied: year; location; method.
Ordiplot (A) represents the spatial arrangement of weed species in a sample point over the three years of study. The points are in different colors according to the year of study. The weight of the effect of the variable is represented by the distance of the point from the centroid. The further away a point is from the centroid or point of gravity reflects greater variability with respect to that categorical variable. In this ordiplot, we can see that the first two years (2018 and 2019) overlapped, meaning that the behavior of the weed seed banks was similar with respect to the categorical variable year. However, we can see that 2020 was set apart from the other two centroids; we observed that the sample points were more dispersed and the distance to the centroid was also greater, meaning that this year had a great influence on the weed seed bank variability, especially in terms of the seed germination ability.
Ordiplot (B) represents the relationship between the spatial arrangement of the weed seeds in a sample point and the two methodologies used to describe the whole weed seed bank: seed germination method and seed physical extraction method. Each method is represented in a different color. In this ordiplot, the points corresponding to the germination method mainly overlapped with the physical extraction method because the centroids of both methodologies were close. However, the graphical representation of sample points for the germination method showed a group of points which were more deviated from its centroid, meaning that the methodology categorical variable had a great influence on the particular weed species group which were best detected by the germination methodology.
In ordiplot (C), we obtain a comparison between seed banks and the variable location, either in M or S places. We can observe a great difference in the two locations immediately: appreciable differences were confirmed as the centroids corresponding to Mad (M) and Sevl (S) did not overlap. We can see that the conditions created in each location have led to different weed seed bank behavior in each place. Therefore, we will study the seed bank data separately for each location in this paper.
The Figure 3 shows the next step, a hierarchical clustering on principal components (HCPC) approach that allowed us to combine correspondence analysis (CA) with cluster analysis of the three categorical variables (year, method and location) into a single qualitative variable possessing all three designations. The factor map resulting from this analysis with the species data supported the formation of three clusters: cluster 1 (in green) corresponds to S seed bank data over the three years of study and two methodologies studied; cluster 2 (in red) corresponds to the behavior of the M seed bank for the year 2020, reported with the germination method; and cluster 3 (in black) corresponded to M data from 2018, 2019 and 2020-extraction method.
Figure 4 reflects the HCPC tree classification with seed bank data and disclosed three clusters (Cluster Dendrogram). The cluster 1 (in green) was mainly formed by Picris echioides L. (PICEC), Poa annua L. (POAAN), Sonchus oleraceous (L.) L. (SONOL) and Stellaria media (L.) Vill. (STEME). Cluster 2 (red) included mostly Anacyclus clavatus (Desf.) Pers. (ANACL), and cluster 3 (black) comprised of several species, including Descurainia sophia (L.) Webb ex Prantl. (DESSO), Papaver rhoeas L. (PAPRH) and Portulaca oleracea L. (POROL). In all cases, the clusters were characterized by variables whose values did not differ significantly from the mean.
After analyzing Figure 3 and Figure 4, we have seen that a further analysis separating the locations was necessary (high distance between green cluster and other two), considering only the categorical variable method in each location.

3.3. The HCPC from Weed Seed Bank in M Experiment

The contingency table (Table 2) describes for each cluster the relationship between the quantitative weight of data species and the categorical variable method in the M site. We observed that both methods, germination and extraction, contributed with the same weight (+/−5.51) to the values for each species studied, indicating that both study methods are viable ways to describe seed bank composition. Portulaca oleracea, Amaranthus blitoides and Chenopodium album were the most abundant species found in the soil seed bank from the M site. All three species were detected with germination and physical extraction methodologies and represented a high percentage of the total seeds in the bank (weights of 8.37, 4.78 and 4.16).
Anacyclus clavatus had low weight (+/−1.96) in the results of the categorical variable (Table 2 despite that this species would have represented a greater weight if we considered the year as an explanatory variable.
The remaining species found in the M site were not significantly better detected depending on the method, either germination or extraction, and did not have a high specific weight in relation to the whole soil seed bank.

3.4. The HCPC from Weed Seed Bank in S Experiment

The contingency table (Table 3) shows that both methods, germination and extraction, contributed with a low weight value (+/−1.91). This fact indicated that the combination of the two methods struggled to further explain the variability occurring in the soil seed bank in the S site. Only one species, Stellaria media, was found in the seed bank with a notable high weight value (+/−8.22) on the categorical variable method. This species was abundantly detected by germination and physical seed extraction tests. The detection of other species in this location, such as Poa annua, Chenopodium album and Amarantus blitoides was affected significantly by the method, but to a much lesser extent than Stellaria media.
In light of these results, the combination of these two methodologies employed to study the seed bank were useful to discover the complete information about the seed bank. Particularly in M site, we could see the difference between the results of these two methodologies, meaning that extra information was gleaned by using both methods. In S, the weight of the value of the methods was not so different, and they both provided very similar information.

4. Discussion

Our short-term study focused on environmental conditions, comparing two locations (M and S) under similar soil management programs but different soil properties: the dryland soils of M showed low fertility, and the S location was characterized by high soil humidity and organic matter. We identified 24 plant species in the soil seed banks and it was observed that seed bank dynamics were significantly affected by environmental conditions.
Previous studies have also found differences in the species composition of seed banks and have suggested that they were correlated to soil management and/or environmental conditions [58,59,60]. It has been observed that changes in management practices and climatic conditions affect the weed communities, provoking changes in seed bank behavior and affecting the capacity of plants to replenish the seeds in the soil [61,62,63,64].
There was a clear difference in the composition of the weed seed bank in the first two years compared to the last year of the study 2019–2020, which was classified as drought conditions. In this drought year, there was a significantly higher relative abundance of seeds, such as Amaranthus blitoides, Chenopodium album, Portulaca oleracea and Anacyclus clavatus, facilitated by the growth of these plants once crop competition was eliminated, and allowed to replenish the soil seed bank. It has been demonstrated that in adverse climatic conditions some weed species produce two or more clearly differentiated types of seeds in size, mode of dispersal and germination requirements [6,65]. This seed polymorphism occurs frequently in the families Compositae, Gramineae, Chenopodiaceae and Cruciferae, all of which are colonizing and arid-dwelling herbaceous plants [6,65,66,67].
We used two methodologies, SPE and SG, to quantify the seed banks in two geographical locations with different environment conditions and soil properties. It was seen that the composition of the seed banks in these two locations were different, and these differences were detected regardless of the methodology (Table 1). Because the seed banks are so different in the two locations, it has been concluded that the most efficient methodology to estimate the seed bank depends on the local soil and environmental conditions.
In general, our seed bank studies revealed that SG methodology recorded less seeds than SPE (although this difference was less in S, with high soil humidity and organic content, than in M, with dryland and low soil fertility). These results were in line with other published studies that have found many more seeds with seed separation methods than with seedling emergence methods [45,68,69,70]. The reason for the difference in these methods is that with SG, the germination and therefore the quantification of the seeds depends on the state of dormancy and the ability of the seed to break dormancy and to germinate. On the other hand, with SPE, although more seeds in total are recorded, some small seeds may be washed away with the soil in the sample processing [71,72]. Therefore, although SPE quantifies more seeds, the quality of the results may be inaccurate, and it additionally has the disadvantage that you may be counting nonviable seeds.
Seed characteristics, such as seed weight, seed size, seed features, etc., have been studied as a functional trait [73,74], and these characteristics are likely to affect the effectiveness of the seed quantification methodology. For example, the structure of the seed: Anacyclus clavatus which presents seed-aquenes, typical for wind-propagated plants, was observed more in SG procedures. This was consistent with the findings of Grime [75]. Seed-aquenes are rarely found in the soil seed bank, because they propagate by blowing in the wind across the top of the soil, in the SPE processes these structures may be mistaken for or hidden in crop residues and are discarded. The results therefore highlight that, if we are looking for seed-aquenes in the soil, SG methodology is more appropriate.
The clear differences between both seed banks allowed us to observe that the methodologies are more accurate to quantify the seed bank when we know the qualitative features of the weeds and their seeds and the properties of the soil.
In the M site, from the total number of seeds quantified, there were much fewer from SG methodology than SPE (13.5% and 86.5% respectively). Some seed species were detected differently by the methodologies over the three years of study. Portulaca oleracea, Amaranthus blitoides and Chenopodium album were abundantly found in the M seed bank. All of these species are summer annual species, with a small size of seed and a consistent coating. The seed coat thickness has been observed by Gardarin [76] and is considered a promising seed trait in terms of soil seed longevity. These seeds were in secondary dormancy because the environmental conditions were not favorable for their germination in the field. Normally we would expect the germination of these species after harvest during the summer, but in such dry-land conditions they are not common. However, when conditions are favorable the seeds germinate, and they finish their cycle and are able to replenish the seeds soil bank, although they will remain in a dormant state. These species have a strategy such that a single plant is capable of creating a large number of small seeds which can remain dormant in the seed bank until conditions are again favorable for germination. This is why we have seen so many seeds from these species in the dry-land conditions of the M site. Although they are abundantly found with both methodologies, SPE was more representative because a great part of these seeds was in a dormant state, making the SG methodology less accurate.
Anacyclus clavatus seeds in M experiment were mainly detected by SG methodology due to the aquenes structures characteristic of this species. The increase in abundance was seen in the last year of study and was probably, in part, due to supportive environmental conditions, such as the wind and temperatures.
These results, taking into account the type of weeds and the environmental conditions in the M site, highlighted the importance of using both methodologies in combination in order to get the full picture regarding the composition of the weed seed bank.
In the S site, from the total number of seeds quantified, there were much fewer from SG methodology than SPE (31.58% and 68.41% respectively). The difference between these percentages was less significant than in the M seed bank. The SG test was therefore more accurate for the total number of seeds in the S than in the M site.
The S soil seed bank is continuously being renewed; seeds which germinate quickly cannot prosper due to the soil and environmental conditions (high soil humidity and organic matter). Dorado [77] reported that soil organic residues have driven an increase in biological activity leading to high levels of bacteria, fungi, soil enzymes, insects and earthworms. This high level of biological activity in the soil can decrease the weed seed viability [78]. Therefore, we can understand why the S seed bank is more transient, and our results support the idea that the viable seeds do not go into a dormant state because if they do not germinate immediately, they are lost. This state of the S seed bank allowed us to quantify the seeds with more accuracy using only the SG methodology.
In the S seed bank, Stellaria media was the most abundant species. It was similarly detected by SG and SPE, leading us to the conclusion that the dormancy state is easily broken, and local environmental conditions allow for its quick germination. Poa annua and Chenopodium album were also found in the seed bank similarly either by SG or SPE methodologies, although in smaller quantities.
The results confirmed that climatic and soil conditions influenced the efficiency of the methodology used to assess the weed seed bank in each location. Dryland soil with low organic matter content (as in M) leads to an increasing seed reservoir mainly composed of dormant seeds. It was necessary to use both methodologies in combination to get the full picture regarding the composition of the weed seed bank. High humidity and temperature, and also a high soil organic matter (in the case of S site), leads to a soil seed bank that is continuously renewed, with seeds germinating quickly. Under these conditions either one of the methodologies was enough to define the whole seed bank composition. The weed populations react to local conditions and our management practices and methodologies for the evaluation of the weed flora need to be flexible and take into account these factors. In light of these findings, we highlight the importance of understanding soil and environmental conditions and the effects they have on the composition of local weed populations, coinciding with other studies [27,79,80].
When land managers implement weed control practices based on the emerged weed data only, there is the risk that species in the seed bank could become prolific and difficult to control. Shiferaw [81] observed that information about the seed bank is important in establishing recommendations and integrated weed control programs. Therefore, we think that land management researchers need to be aware of the seed reserves in the seed bank. We want to highlight the need for guidelines and protocols based on research that can help agronomists make the best choice for analysis.

5. Conclusions

Our study concluded that edapho-climatic conditions affect the characteristics of seeds in soil which, in turn, affects the efficiency of the methodology used to evaluate the seed bank. In areas with high humidity and soil organic content (S site), seeds cannot survive very long in the soil before they decompose. A strategy to overcome this potential loss is to produce seeds which germinate rapidly, avoiding a dormant state. In order to evaluate the seed bank with these conditions, either the germination or the seed physical extraction methodologies can be conclusive. On the other hand, in dryland conditions with low soil fertility conditions (such as the M site), seeds do not have the required conditions to germinate straight away and are more successful if they are in a dormant state until conditions that are more suitable. Because of the dormant state of many seeds, the combination of both germination and seed physical extraction methodologies is needed to accurately define the seed bank.
Functional traits of weeds sometimes mean that either SG or SPE is more effective in the seed count. For example, wind propagation mechanisms such as aquenes may mean that seeds remain on the surface mixed with crop residues and they may be discarded and not counted in seed physical extraction methodologies, whereas in germination tests they would be detected. In this regard we highlight the need to take into account the edaphoclimatic conditions as well as the expected weed species and their functional traits when selecting a method for the analysis of the weed seed bank.
There is a need for more research on this topic in order to allow us to improve integrated weed management programs taking into account the description of the soil seed bank.

Author Contributions

Conceptualization, M.I.S.-M. and M.L.G.; methodology, J.P.D.M., M.I.S.-M. and M.L.G.; formal analysis, M.I.S.-M.; data curator, M.L.G.; writing–original draft preparation, M.I.S.-M.; writing–review and editing, M.I.S.-M. and M.L.G.; supervision, M.I.S.-M. and J.P.D.M.; funding acquisition, M.I.S.-M. All authors have read and agreed to the published version of the manuscript.

Funding

The Spanish Ministry of Science and Innovation (Projects AT2017-003 and RTA 2017-00006-C03-01) funded this work. M.L.G. was supported by an FPI-INIA scholarship (Spanish Ministry of Science and Innovation).

Data Availability Statement

The datasets analyzed during the current study is available from the corresponding author on reasonable request.

Acknowledgments

We are grateful to Jose Silveria and David San Martin, from “La Canaleja” Experimental Station, for helping to manage the experiment. We are grateful to Carlos Casanova for the help with the statistical analysis. We are grateful to Charlotte Harvey for the help with the English revision of the manuscript.

Conflicts of Interest

The authors declare no conflict of interest.

References

  1. Kigel, J. Seed Development and Germination; CRC Press: New York, NY, USA, 1995; ISBN 978-0-8247-9229-9. [Google Scholar]
  2. Taiwo, D.M.; Oyelowo, O.J.; Ogedengbe, T.C.; Woghiren, A.I. The Role of Soil Seed Bank in Forest Regeneration. Asian J. Res. Agric. For. 2018, 1, 1–10. [Google Scholar] [CrossRef]
  3. Feledyn-Szewczyk, B.; Smagacz, J.; Kwiatkowski, C.A.; Harasim, E.; Woźniak, A. Weed Flora and Soil Seed Bank Composition as Affected by Tillage System in Three-Year Crop Rotation. Agriculture 2020, 10, 186. [Google Scholar] [CrossRef]
  4. Hopfensperger, K.N. A Review of Similarity between Seed Bank and Standing Vegetation across Ecosystems. Oikos 2007, 116, 1438–1448. [Google Scholar] [CrossRef]
  5. Fisher, B.; Turner, R.K.; Morling, P. Defining and Classifying Ecosystem Services for Decision Making. Ecol. Econ. 2009, 68, 643–653. [Google Scholar] [CrossRef] [Green Version]
  6. Harper, J.L. Population Biology of Plants; Academic Press: London, UK, 1977; ISBN 0-12-325850-2. [Google Scholar]
  7. Laskurain, N.A.; Escudero, A.; Olano, J.M.; Loidi, J. Seedling Dynamics of Shrubs in a Fully Closed Temperate Forest: Greater than Expected. Ecography 2004, 27, 650–658. [Google Scholar] [CrossRef]
  8. Olano, J.M.; Caballero, I.; Laskurain, N.A.; Loidi, J.; Escudero, A. Seed Bank Spatial Pattern in a Temperate Secondary Forest. J. Veg. Sci. 2002, 13, 775–784. [Google Scholar] [CrossRef]
  9. Radosevich, S.R.; Holt, J.S.; Ghersa, C. Weed Ecology: Implications for Management; John Wiley & Sons: New York, NY, USA, 1997; ISBN 978-0-471-11606-6. [Google Scholar]
  10. A Hierarchical Consideration of Causes and Mechanisms of Succession, SpringerLink. Available online: https://link.springer.com/chapter/10.1007/978-94-009-4061-1_10 (accessed on 19 November 2021).
  11. Baraibar, B.; Canadell, C.; Torra, J.; Royo-Esnal, A.; Recasens, J. Weed Seed Fate during Summer Fallow: The Importance of Seed Predation and Seed Burial. Weed Sci. 2017, 65, 515–524. [Google Scholar] [CrossRef] [Green Version]
  12. Hyatt, L.A.; Casper, B.B. Seed Bank Formation during Early Secondary Succession in a Temperate Deciduous Forest. J. Ecol. 2000, 88, 516–527. [Google Scholar] [CrossRef]
  13. Menalled, F.D.; Gross, K.L.; Hammond, M. Weed Aboveground and Seedbank Community Responses to Agricultural Management Systems. Ecol. Appl. 2001, 11, 1586–1601. [Google Scholar] [CrossRef]
  14. Murphy, S.D.; Clements, D.R.; Belaoussoff, S.; Kevan, P.G.; Swanton, C.J. Promotion of Weed Species Diversity and Reduction of Weed Seedbanks with Conservation Tillage and Crop Rotation. Weed Sci. 2006, 54, 69–77. [Google Scholar] [CrossRef]
  15. Albrecht, H.; Auerswald, K. Seed Traits in Arable Weed Seed Banks and Their Relationship to Land-Use Changes. Basic Appl. Ecol. 2009, 10, 516–524. [Google Scholar] [CrossRef] [Green Version]
  16. Pallavicini, Y.; Hernandez Plaza, E.; Bastida, F.; Izquierdo, J.; Gallart, M.; Gonzalez-Andujar, J.L. Weed Seed Bank Diversity in Dryland Cereal Fields: Does It Differ Along the Field and Between Fields with Different Landscape Structure? Agronomy 2020, 10, 575. [Google Scholar] [CrossRef] [Green Version]
  17. Pritchard, H.W. Seeds. Ecology, biogeography, and evolution of dormancy and germination. Ann. Bot. 2000, 86, 705–707. [Google Scholar] [CrossRef] [Green Version]
  18. Murdoch, A.J. Longevity, Viability and Dormancy. Seeds Ecol. Regen. Plant Communities 1992, 2, 193–229. [Google Scholar]
  19. De Souza Maia, M.; Maia, F.C.; Pérez, M.A. Bancos de semillas en el suelo. Agriscientia 2006, 23, 33–44. [Google Scholar]
  20. McCloskey, M.; Firbank, L.G.; Watkinson, A.R.; Webb, D.J. The Dynamics of Experimental Arable Weed Communities under Different Management Practices. J. Veg. Sci. 1996, 7, 799–808. [Google Scholar] [CrossRef]
  21. Effects of Crop and Weed Management on Density and Vertical Distribution of Weed Seeds in Soil Agronomy Journal. Available online: https://acsess.onlinelibrary.wiley.com/doi/abs/10.2134/agronj1998.00021962009000060013xa (accessed on 19 November 2021).
  22. Dessaint, F.; Barralis, G.; Beuret, E.; Caixinhas, M.L.; Post, B.J.; Zanin, G. Etude coopérative EWRS: La détermination du potentiel semencier. Weed Res. 1990, 30, 421–429. [Google Scholar] [CrossRef]
  23. Bàrberi, P.; Lo Cascio, B. Long-Term Tillage and Crop Rotation Effects on Weed Seedbank Size and Composition. Weed Res. 2001, 41, 325–340. [Google Scholar] [CrossRef]
  24. Rao, N.; Dong, L.; Li, J.; Zhang, H. Influence of Environmental Factors on Seed Germination and Seedling Emergence of American Sloughgrass (Beckmannia Syzigachne). Weed Sci. 2008, 56, 529–533. [Google Scholar] [CrossRef]
  25. Lal, B.; Gautam, P.; Raja, R.; Tripathi, R.; Shahid, M.; Mohanty, S.; Panda, B.B.; Bhattacharyya, P.; Nayak, A.K. Weed Seed Bank Diversity and Community Shift in a Four-Decade-Old Fertilization Experiment in Rice–Rice System. Ecol. Eng. 2016, 86, 135–145. [Google Scholar] [CrossRef]
  26. Buhler, D.D.; Stoltenberg, D.E.; Becker, R.L.; Gunsolus, J.L. Perennial Weed Populations After 14 Years of Variable Tillage and Cropping Practices. Weed Sci. 1994, 42, 205–209. [Google Scholar] [CrossRef]
  27. Cardina, J.; Regnier, E.; Harrison, K. Long-Term Tillage Effects on Seed Banks in Three Ohio Soils. Weed Sci. 1991, 39, 186–194. [Google Scholar] [CrossRef]
  28. Ball, D.A. Weed Seedbank Response to Tillage, Herbicides, and Crop Rotation Sequence. Weed Sci. 1992, 40, 654–659. [Google Scholar] [CrossRef]
  29. Auškalnienė, O.; Auškalnis, A. The Influence of Tillage System on Diversities of Soil Weed Seed Bank. Agron. Res. 2009, 7, 156–161. [Google Scholar]
  30. Skuodienė, R. Assessment of the Weed Incidence and Weed Seed Bank of Crops under Different Pedological Traits. Appl. Ecol. Environ. Res. 2018, 16, 1131–1142. [Google Scholar] [CrossRef]
  31. Santín-Montanyá, M.I.; Martín-Lammerding, D.; Zambrana, E.; Tenorio, J.L. Management of Weed Emergence and Weed Seed Bank in Response to Different Tillage, Cropping Systems and Selected Soil Properties. Soil Tillage Res. 2016, 161, 38–46. [Google Scholar] [CrossRef]
  32. Auffret, A.G.; Cousins, S.A.O. Past and Present Management Influences the Seed Bank and Seed Rain in a Rural Landscape Mosaic: Seed Bank and Seed Rain in the Rural Landscape. J. Appl. Ecol. 2011, 48, 1278–1285. [Google Scholar] [CrossRef] [Green Version]
  33. Forcella, F.; Fao, R.; Webster, T.; Cardina, J.; Labrada, R. Protocolos Para La Determinacion de Bancos de Semillas de Malezas En Los Agrosistemas; FAO: Rome, Italy, 2004. [Google Scholar]
  34. Recasens, J.; Riba, F.; Izquierdo, J.; Taberner, A.L. analisis del banc de llavors de males herbes de sòls agrícoles. Aspectes metodològics. Ilerda. Ciències 1991, 49, 83–102. [Google Scholar]
  35. Jastrzebska, M.; Jastrzebski, W.P.; Holdynski, C.; Kostrzewska, M.K. Weed Species Diversity in Organic and Integrated Farming Systems. Acta Agrobot. 2013, 66, 113–124. [Google Scholar] [CrossRef] [Green Version]
  36. Gross, K.L. A Comparison of Methods for Estimating Seed Numbers in the Soil. J. Ecol. 1990, 78, 1079–1093. [Google Scholar] [CrossRef]
  37. CardiNa, J.; Sparrow, D.H.; McCoy, E.L. Spatial Relationships between Seedbank and Seedling Populations of Common Lambsquarters (Chenopodium album) and Annual Grasses. Weed Sci. 1996, 44, 298–308. [Google Scholar] [CrossRef]
  38. Malone, C.R. A Rapid Method for Enumeration of Viable Seeds in Soil. Weeds 1967, 15, 381–382. [Google Scholar] [CrossRef]
  39. Tsuyuzaki, S. Rapid Seed Extraction from Soils by a Flotation Method. Weed Res. 1994, 34, 433–436. [Google Scholar] [CrossRef]
  40. Gonzalez, S.; Ghermandi, L. Comparison of Methods to Estimate Soil Seed Banks: The Role of Seed Size and Mass. Community Ecol. 2012, 13, 238–242. [Google Scholar] [CrossRef]
  41. Mesgaran, M.B.; Mashhadi, H.R.; Zand, E.; Alizadeh, H.M. Comparison of Three Methodologies for Efficient Seed Extraction in Studies of Soil Weed Seedbanks. Weed Res. 2007, 47, 472–478. [Google Scholar] [CrossRef]
  42. Auškalnienė, O.; Kadžienė, G.; Janušauskaitė, D.; Supronienė, S. Changes in Weed Seed Bank and Flora as Affected by Soil Tillage Systems. Zemdirb. Agric. 2018, 105, 221–226. [Google Scholar] [CrossRef] [Green Version]
  43. Ball, D.A.; Miller, S.D. A Comparison of Techniques for Estimation of Arable Soil Seedbanks and Their Relationship to Weed Flora. Weed Res. 1989, 29, 365–373. [Google Scholar] [CrossRef]
  44. Espeland, E.K.; Perkins, L.B.; Leger, E.A. Comparison of Seed Bank Estimation Techniques Using Six Weed Species in Two Soil Types. Rangel. Ecol. Manag. 2010, 63, 243–247. [Google Scholar] [CrossRef]
  45. Brown, D. Estimating the Composition of a Forest Seed Bank: A Comparison of the Seed Extraction and Seedling Emergence Methods. Can. J. Bot. 1992, 70, 1603–1612. [Google Scholar] [CrossRef]
  46. Reinhardt, T.; Leon, R.G. Extractable and Germinable Seedbank Methods Provide Different Quantifications of Weed Communities. Weed Sci. 2018, 66, 715–720. [Google Scholar] [CrossRef]
  47. Soil Survey Staff. Keys to Soil Taxonomy, 12th ed.; USDA-Natural Resources Conservation Service: Washington, DC, USA, 2014.
  48. Flora Iberica. Plantas Vasculares de la Península Ibérica e Islas Baleares. Real Jardín Botánico CSIC. 2020. [Date Accessed: 2018–2020]. Available online: http://www.floraiberica.org/ (accessed on 28 November 2021).
  49. Thompson, K.; Bakker, J.P.; Bekker, R.M. The Soil Seed Banks of North West Europe: Methodology, Density and Longevity; University Press: Cambridge, UK, 1997; ISBN 978-0-521-49519-6. [Google Scholar]
  50. Zanin, G.; Otto, S.; Riello, L.; Borin, M. Ecological Interpretation of Weed Flora Dynamics under Different Tillage Systems. Agric. Ecosyst. Environ. 1997, 66, 177–188. [Google Scholar] [CrossRef]
  51. Seed Identification Guide. 2018. [Date Accessed: 2018–2020]. Available online: https://www.idseed.org (accessed on 19 November 2021).
  52. Arable Seed Identification System. The James Hutton Institute. 2020. [Date Accessed: 2018–2020]. Available online: https://Asis.Hutton.Ac.Uk (accessed on 19 November 2021).
  53. Smutný, V.; Křen, J. Improvement of an Elutriation Method for Estimation of Weed Seedbank in the Soil. Plant Soil Environ. 2011, 48, 271–278. [Google Scholar] [CrossRef] [Green Version]
  54. Porčová, L.; Smutný, V. The Impact of Under-Vine Management on the Weed Seedbank in the Soil. Acta Univ. Agric. Silvic. Mendel. Brun. 2018, 66, 1165–1170. [Google Scholar] [CrossRef] [Green Version]
  55. Dray, S.; Dufour, A.-B. The Ade4 Package: Implementing the Duality Diagram for Ecologists. J. Stat. Soft. 2007, 22. [Google Scholar] [CrossRef] [Green Version]
  56. Oksanen, J.; Blanchet, F.G.; Kindt, R.; Legendre, P.; Minchin, P.R.; O’hara, R.B.; Simpson, G.L.; Solymos, P.; Stevens, M.H.H.; Wagner, H. Package ‘Vegan’. Community Ecol. Package Version 2013, 2, 1–295. [Google Scholar]
  57. Husson, F.; Josse, J.; Le, S.; Mazet, J.; Husson, M.F. Package ‘FactoMineR’. R Package 2016, 96, 698. [Google Scholar]
  58. Dorado, J.; López-Fando, C. The Effect of Tillage System and Use of a Paraplow on Weed Flora in a Semiarid Soil from Central Spain. Weed Res. 2006, 46, 424–431. [Google Scholar] [CrossRef]
  59. Chauhan, B.S.; Singh, R.G.; Mahajan, G. Ecology and Management of Weeds under Conservation Agriculture: A Review. Crop Prot. 2012, 38, 57–65. [Google Scholar] [CrossRef]
  60. Trichard, A.; Alignier, A.; Chauvel, B.; Petit, S. Identification of Weed Community Traits Response to Conservation Agriculture. Agric. Ecosyst. Environ. 2013, 179, 179–186. [Google Scholar] [CrossRef]
  61. Marshall, E.J.P.; Brown, V.K.; Boatman, N.D.; Lutman, P.J.W.; Squire, G.R.; Ward, L.K. The Role of Weeds in Supporting Biological Diversity within Crop Fields*: Weeds and Biodiversity. Weed Res. 2003, 43, 77–89. [Google Scholar] [CrossRef] [Green Version]
  62. Smith, R.G. Timing of Tillage Is an Important Filter on the Assembly of Weed Communities. Weed Sci. 2006, 54, 705–712. [Google Scholar] [CrossRef]
  63. Ryan, M.R.; Smith, R.G.; Mirsky, S.B.; Mortensen, D.A.; Seidel, R. Management Filters and Species Traits: Weed Community Assembly in Long-Term Organic and Conventional Systems. Weed Sci. 2010, 58, 265–277. [Google Scholar] [CrossRef]
  64. Smith, R.G.; Atwood, L.W.; Morris, M.B.; Mortensen, D.A.; Koide, R.T. Evidence for Indirect Effects of Pesticide Seed Treatments on Weed Seed Banks in Maize and Soybean. Agric. Ecosyst. Environ. 2016, 216, 269–273. [Google Scholar] [CrossRef]
  65. PUL, L.V. Principies of Dispersal Inhigherplants, 3rd ed.; Springer: Berlin, Germany, 1982. [Google Scholar]
  66. Zohary, M. Plant Life of Palestine: Israel and Jordan, 6th ed.; The Ronald Press: New York, NY, USA, 1962. [Google Scholar]
  67. Hughes, P.W. Minimal-Risk Seed Heteromorphism: Proportions of Seed Morphs for Optimal Risk-Averse Heteromorphic Strategies. Front. Plant Sci. 2018, 9, 1412. [Google Scholar] [CrossRef]
  68. Hopkins, D.R.; Parker, V.T. A study of the seed bank of a salt marsh in northern San Francisco Bay. Am. J. Bot. 1984, 71, 348–355. [Google Scholar] [CrossRef]
  69. Poiani, K.A.; Johnson, W.C. Evaluation of the Emergence Method in Estimating Seed Bank Composition of Prairie Wetlands. Aquat. Bot. 1988, 32, 91–97. [Google Scholar] [CrossRef]
  70. Ter Heerdt, G.N.J.; Verweij, G.L.; Bekker, R.M.; Bakker, J.P. An Improved Method for Seed-Bank Analysis: Seedling Emergence after Removing the Soil by Sieving. Funct. Ecol. 1996, 144–151. [Google Scholar] [CrossRef]
  71. Moles, A.T.; Westoby, M. Seed Size and Plant Strategy across the Whole Life Cycle. Oikos 2006, 113, 91–105. [Google Scholar] [CrossRef]
  72. Saatkamp, A.; Affre, L.; Dutoit, T.; Poschlod, P. The Seed Bank Longevity Index Revisited: Limited Reliability Evident from a Burial Experiment and Database Analyses. Ann. Bot. 2009, 104, 715–724. [Google Scholar] [CrossRef] [Green Version]
  73. Gunton, R.M.; Petit, S.; Gaba, S. Functional Traits Relating Arable Weed Communities to Crop Characteristics: Traits Relating Weed Communities to Crops. J. Veg. Sci. 2011, 22, 541–550. [Google Scholar] [CrossRef]
  74. Saatkamp, A.; Affre, L.; Dutoit, T.; Poschlod, P. Germination Traits Explain Soil Seed Persistence across Species: The Case of Mediterranean Annual Plants in Cereal Fields. Ann. Bot. 2011, 107, 415–426. [Google Scholar] [CrossRef]
  75. Grime, J.P. Plant Strategies and Vegetation Processes, 2nd ed.; John Wiley & Sons: Chichester, UK, 2001. [Google Scholar]
  76. Gardarin, A.; Dürr, C.; Mannino, M.R.; Busset, H.; Colbach, N. Seed Mortality in the Soil Is Related to Seed Coat Thickness. Seed Sci. Res. 2010, 20, 243–256. [Google Scholar] [CrossRef]
  77. Dorado, J.; Monte, J.P.D.; López-Fando, C. Weed Seedbank Response to Crop Rotation and Tillage in Semiarid Agroecosystems. Weed Sci. 1999, 47, 67–73. [Google Scholar] [CrossRef]
  78. Dick, W.A.; Daniel, T.C. Soil Chemical and Biological Properties as Affected by Conservation Tillage: Environmental Implications. In Effects Conservation Tillage on Ground Water Quality: Nitrates and Pesticides; Logan, T.J., Ed.; CRC Press: Chelsea, MI, USA, 1987; pp. 125–147. [Google Scholar]
  79. Pareja, M.R.; Staniforth, D.W.; Pareja, G.P. Distribution of Weed Seed among Soil Structural Units. Weed Sci. 1985, 33, 182–189. [Google Scholar] [CrossRef]
  80. Andreasen, C.; Streibig, J.C.; Haas, H. Soil Properties Affecting the Distribution of 37 Weed Species in Danish Fields. Weed Res. 1991, 31, 181–187. [Google Scholar] [CrossRef]
  81. Shiferaw, W.; Lemenih, M.; Gole, T.W.M. Analysis of Plant Species Diversity and Forest Structure in Arero Dry Afromontane Forest of Borena Zone, South Ethiopia. Trop. Plant Res. 2018, 5, 129–140. [Google Scholar] [CrossRef]
Figure 1. Climatic conditions 2017–2019 (average monthly precipitation and temperature and historical mean in: (a) Madrid; M and (b) Sevilla; S. Average monthly temperature (tª—in orange) and precipitation (Prec.—in blue) during 2017–2019 in M and S sites. In point lines, the historical mean of temperature (C°—in yellow) and precipitation (mm-in grey) for both locations.
Agronomy 12 00138 g001
Figure 2. Correspondence analysis (CA) represented in ordiplots A, B and C, factorial maps with representation of point classes, arranged by groups of individuals s.class (ade4) function. Ordiplot (A) “year” factor used to draw the groups on the factor map. Ordiplot (B) “method” factor used to draw the groups on the factor map. Ordiplot (C) “location” factor used to draw the groups on the factor map. A x.1 (30.54%): Projected inertia Dimension 1; Ax.2 (13.03%): Projected inertia Dimension 2.
Agronomy 12 00138 g002
Figure 3. Hierarchical clustering on principal components (HCPC) on disclosed three variables (year, method and location) by factor map and cluster dendrogram. The figure shows the plot graph from a HCPC result: factor map in two dimensions: Dim1 (30.54%): Dimension 1 with 30.54% inertia; Dim2 13.03%: Dimension 2 with 13.03% inertia. Performs an agglomerative hierarchical clustering on results from a factor analysis (CA) with three clusters. Hierarchical clustering, used for identifying groups of similar observations in a data set. Cluster 1 (black): group of soil seed bank samples that correspond to M seed bank extraction method and year 2020. Cluster 2 (red): group of soil seed bank samples that correspond to M seed bank germination method and three years. Cluster 3 (green): group of soil seed bank samples that correspond to S seed bank (extraction and germination methods) and three years.
Agronomy 12 00138 g003
Figure 4. Plots graphs from a HCPC result: hierarchical tree. The dendrogram suggests a three clusters solution. In this tree visualize individuals (weed species) on the principal component map and to color individuals according to the cluster they belong to: Black: M site-extraction-2018, 2019, 2020; Red: M site-germination-2020 and Green: S site-extraction and germination-2018, 2019, 2020.
Agronomy 12 00138 g004
Table 1. Weed seed bank composition in each location object of study (Madrid and Seville). * A, annual; WA, winter annual; SA, summer annual; P, perennial; A/B, annual or biennial. Flora Ibérica determined life histories of species.
Latin NameEPPO CodeLife History *Relative Abundance MADRelative Abundance SEV
Amaranthus blitoides S. WatsonAMABLSA0.3000.024
Anacyclus clavatus (Desf.) Pers.ANACLWA0.0210.005
Anagallis arvensis L.ANGARSA0.0000.008
Capsella bursa-pastoris (L.) MedicusCAPBPWA0.0010.000
Chenopodium album L.CHEALSA0.0450.012
Convolvulus arvensis L.CONARP0.0050.019
Descurainia sophia (L.) Webb ex Prantl in Engler & PrantlDESSOWA0.0080.000
Fumaria officinalis L.FUMOFWA0.0080.031
Galium tricornutum L.GALAPWA0.0010.001
Heliotropium europaeum L.HEOEUWA0.0010.000
Lactuca serriola L.LACSEA0.0000.018
Lamium amplexicaule L.LAMAMWA0.0390.001
Buglossoides arvensis (L.) I.M. Johnst.LITARWA0.0210.001
Lolium perenne L.LOLPEP0.0150.001
Papaver rhoeas L.PAPRHWA0.0220.002
Picris echioides L.PICECA/B0.0000.041
Poa annua L.POAANWA0.0000.131
Polygonum aviculare L.POLAVP0.0030.000
Portulaca oleracea L.POROLSA0.5020.212
Salsola kali L.SALKASA0.0020.000
Sonchus oleraceus L.SONOLA0.0000.119
Stellaria media (L.) Vill.STEMESA0.0000.375
Tribulus terrestris L.TRBTEWA0.0020.000
Veronica hederifolia L.VERHEWA0.0050.000
Weed seed bank composition in each location object of study (M and S). * A, annual; WA, winter annual; SA, summer annual; P, perennial; A/B, annual or biennial. Life histories were determined by Flora Ibérica [48].
Table 2. Description of the relationship between the quantitative weight of data species and the categorical variable method in M experiment.
M Experiment
Cluster 1Cluster 2
METHOD = EXTR−5.515.51
METHOD = GER5.51−5.51
AMABL−4.784.78
ANACL1.96−1.96
CHEAL−4.164.16
POROL−8.378.37
SALKA−2.752.75
TRBTE−2.192.19
Categorical variables: GER: Germination methodology; EXTR: Extraction methodology. Species: EPPO Codes (EPPO Global Database 2021). AMABLE: Amaranthus blitoides; ANACL: Anacyclus clavatus; CHEAL: Chenopodium album; POROL: Portulaca oleracea; SALKA: Salsola kali; TRBTE: Tribulus terrestres. Variables or categories characterize at least one cluster at the chosen threshold (p-value = 0.05). Extraction method: cluster 2. Germination method: cluster 1. Red color: high ratio; Blue color: low ratio.
Table 3. Description of the relationship between the quantitative weight of data species and the categorical variable method in S experiment.
S Experiment
Cluster 1Cluster 2
METHOD = EXTR−1.91.9
METHOD = GER1.9−1.9
AMABL1.64−1.64
CHEAL−2.422.42
POAAN−2.212.21
STEME−8.228.22
Categorical variables: GER: Germination methodology; EXTR: Extraction methodology. Species: EPPO Codes (EPPO Global Database 2021). AMABLE: Amaranthus blitoides; CHEAL: Chenopodium album; POAAN: Poa annua; STEME: Stelaria media. Variables or categories characterize at least one cluster at the chosen threshold (p-value = 0.05). Extraction method: cluster 2. Germination method: cluster 1. Red color: high ratio; Blue color: low ratio.
Publisher’s Note: MDPI stays neutral with regard to jurisdictional claims in published maps and institutional affiliations.

