Abstract
This paper aims to evaluate the ability of VNIR proximal soil spectroscopy to determine post-fire soil chemical properties and discriminate fire severity based on soil spectra. A total of 120 topsoil samples (0–3 cm) were taken from 6 ha of unburned (control (CON)) and burned areas (moderate fire severity (MS) and high fire severity (HS)) in Mediterranean Croatia within one year after the wildfire. Partial least squares regression (PLSR) and an artificial neural network (ANN) were used to build calibration models of soil pH, electrical conductivity (EC), CaCO3, plant-available phosphorus (P2O5) and potassium (K2O), soil organic carbon (SOC), exchangeable calcium (exCa), magnesium (exMg), potassium (exK), sodium (exNa), and cation exchange capacity (CEC), based on soil reflectance data. In terms of fire severity, CON samples exhibited higher average reflectance than MS and HS samples due to their lower SOC content. The PCA results pointed to the significance of the NIR part of the spectrum for extracting the variance in reflectance data and differentiation between the CON and burned area (MS and HS). DA generated 74.2% correctly classified soil spectral samples according to the fire severity. Both PLSR and ANN calibration techniques showed sensitivity to extract information from soil features based on hyperspectral reflectance, most successfully for the prediction of SOC, P2O5, exCa, exK, and CEC. This study confirms the usefulness of soil spectroscopy for fast screening and a better understanding of soil chemical properties in post-fire periods.
1. Introduction
Fire is a global phenomenon with positive and negative impacts on ecosystems [1]. Although fire can be beneficial to some ecosystems, high severity summer wildfires are responsible for land degradation [2] and socio-economic [3] and life losses [4]. Examples of this are the wildfire season in Portugal in 2017 (Pedrógão Grande), Greece in 2018 (Attica region), and Australia and California in 2020. The increasing frequency of megafires is a complex phenomenon that links climate change, socio-economical aspects (e.g., land abandonment), and forest management practices (e.g., monocultures and fire suppression) [5,6,7]. Mediterranean environments are vulnerable to wildfire, which can have short or long impacts on soil properties depending on severity. Many investigations have studied fire’s effect on physical, chemical, mineralogical, and biological soil properties [8,9,10,11]. For example, high severity fires consume large amounts of organic matter [12,13], destroy soil structure [14,15], change aggregate stability and water repellence [16,17,18], and increase nutrient losses by volatilisation and sediment transport [19,20].
Moreover, wildfire impacts on soil are highly variable in space and time [21]. Therefore, studies with good spatial and temporal resolution are needed. Fire induces changes in soil spectral properties [22]. Remote and proximal soil sensing methods ensure the possibility of rapidly collecting large volumes of data that can be used for post-wildfire management [23]. So far, soil visible and near-infrared (VNIR) calibrations in soil surveys showed well-recognised absorption features for total and organic carbon (C), clay content, and total soil nitrogen (N) [24,25,26,27]. However, the results for their covariates such as soil pH, extractable phosphorous, potassium, calcium, sodium, magnesium, and cation exchange capacity (CEC) are moderate and highly variable [28]. Previous soil spectroscopy works were applied to detect the impacts of fire on ground cover and soil properties [29,30,31]. Attention was mostly given to soil organic matter (SOM) and soil organic carbon (SOC) with good predictions. Peon et al. [32] and Rosero-Vlasova et al. [33] combine satellite spectral data and soil reflectance spectra and reveal SOM prediction models with a good fit (Rcal2 and Rval2 = 0.9).
Soil properties’ quantification using a reflectance spectroscopy technique is assessed with multivariate statistical methods. These methods allow calibrating the models and the spectral signal related to the analysis obtained using conventional laboratory methods. The most common chemometric models used are (1) principal component analysis (PCA), (2) stepwise multiple linear regression (SMLR), (3) partial least squares regression (PLSR), (4) multivariate adaptive regression splines (MARS), (5) principal component regression (PCR), and (6) artificial neural networks (ANN) [34]. Previous works applied PCA to identify and assess fire severity [35] or PLSR to estimate soil organic matter (SOM) and soil organic carbon (SOC) in burned areas [31,32]. Montorio Llovería et al. [30] used the VNIR region and SMLR model to assess fire severity on burned Mediterranean shrublands, while Guerrero et al. [29] developed PLSR models to relate soil NIR spectra and the maximum temperatures reached on burned soils. According to Zhao et al. [36], topsoil exchangeable Ca and Mg were successfully predicted by PLSR based on VNIR spectra, and these calibrations could be used for building a multi-depth spectral library as well, but coupled with spiking with a new dataset into a general calibration dataset, which increased soil variability.
There are few works focused on predicting soil properties after wildfires based on soil spectroscopy, mainly oriented only on SOC [31,32,33,35]. Although in a similar environment, this study aims to develop calibration models for many soil chemical properties in burned Cambisol Rhodic of the Mediterranean climate region. Remote soil monitoring within burned areas is still not a sufficiently explored subject, particularly regarding upscaling the spectral data and determining wavelengths important for prediction.
We hypothesise that fire severity will affect soil organic matter consumption and induce changes in soil chemical properties and soil reflectance. The main objectives of this paper are a) the discrimination of different fire severities using soil-based proximal VNIR spectra; b) model development and calibration for 11 soil chemical properties of fire-affected soil: SOC, pH, available K (K2O), available P (P2O5), electrical conductivity (EC), calcium carbonate content (CaCO3), exchangeable calcium (exCa), magnesium (exMg), potassium (exK) and sodium (exNa), and CEC using soil reflectance; and c) a comparison of model performance obtained by linear calibration and data mining techniques.
2. Materials and Methods
2.1. Study Area
The study was carried out in Šibenik Knin County, Croatia (43°32′ N; 16°00′ E, 103 m a.s.l.) (Figure 1). The wildfire occurred at the end of August 2018, affecting an area of 6.3 ha. The parent material is composed of carbonate rocks. The soil has clay to clay-loam texture and is classified as Chromic Luvisols or Cambisol Rhodic [37] (local classification is Terra Rossa). The general soil properties are presented in Table 1. The climate is Cfa-hot-summer Mediterranean, which was determined according to the Köppen climate classification [38]. The average annual precipitation (1981–2014) is 770.1 mm. The rainfall is mainly concentrated in September to April, with large inter-annual variability. The annual mean air temperature in the same period was 15.4 °C.
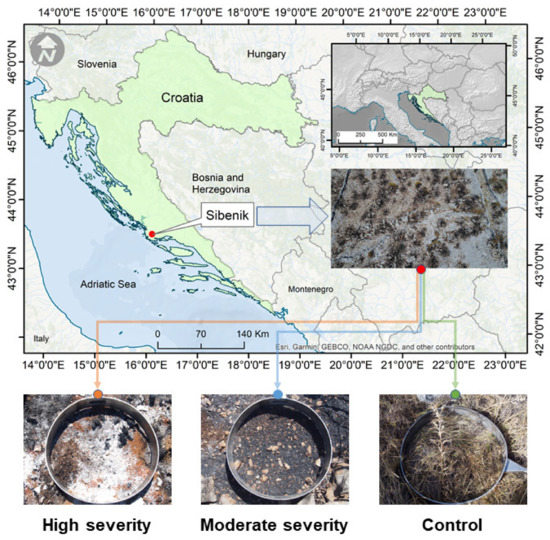
Figure 1.
Study area in coastal region of Croatia with fire-affected abandoned olive orchard and three fire severity treatments established: high severity, moderate severity, and unburned control.

Table 1.
General soil properties of investigated area.
2.2. Experimental Design and Laboratory Analyses
The wildfire-affected, abandoned olive orchards were colonised with grasses and maquis. The burned area has a southwest exposition and a slope inclination of approximately 4°. Three treatments were established: high severity (HS), moderate severity (MS), and unburned control (CON). Fire severity was assessed using ash colour as a proxy [39]. On each sampling date, ten soil samples (0–3 cm) were collected for the different treatments: 5 days, 3 months, 6 months, and 1 year after the wildfire (120 samples in total). Prior to sampling, the ash layer was removed. Samples were placed in plastic bags, taken to the laboratory, air-dried in three days, then milled and sieved to a 2 mm mesh. Soil pH was measured using the electrometric method in a 1:5 (w/v) ratio with the Beckman pH-meter Φ72 in a KCl suspension. Soil EC was calculated at 25 °C on soil water (1:5) extract. P2O5 and K2O were extracted by ammonium lactate solution [40] and detected by spectrophotometry and flame photometry, respectively. SOM was determined by a wet combustion procedure [41] and multiplying by 0.58 to obtain the SOC content. CaCO3 content was analysed with a calcimeter calibrated with 0.2 g of pure CaCO3 using a 1:2 hydrochloric acid solution (50% HCl and 50% deionised water). Subsamples of soil weighing 0.2 g were mixed with the 1:2 solution. The CaCO3 was estimated by calculations following the method developed by Úbeda et al. [39]. exCa and exMg were determined in 0.4 N NaOAc-0.1 M NaCl, pH 8.2 extracts by an ICP analyser; exNa+ and exK+ were determined in 1 N, pH 7 ammonium acetate extracts by flame spectrophotometry. CEC was considered as the sum of all exchangeable cations.
2.3. Spectral Measurements
Soil reflectance measurements were performed in laboratory conditions to avoid the interference of soil moisture with spectral features of the investigated soil properties, using a portable field spectroradiometer FieldSpec®3 (Analytical Spectral Devices, Inc., Boulder, CO, USA) with a wavelength range from 350 to 1050 nm (VNIR region), a sampling interval of 1.4 nm, and a spectral resolution of 3 nm at 700 nm. Milled and sieved soil was placed on 9-cm diameter Petri dishes (borosilicate glass), forming a 1.5-cm soil layer, and reflectance was measured at a fixed distance of 0.5 cm using a vertically positioned, hand-held fibre-optic probe with artificial illumination. Calibration panel (Spectralon®, Labsphere, Inc., North Sutton, NH, USA) measurements were taken before initial soil readings and repeated approximately every 15 min. Five scans of each sample were recorded at each position at an optimised integration time, with a dark current correction at every spectral measurement to minimise instrument noise and obtain an average spectrum, used for further analysis and comparisons within and between the treatments [42]. Spectral reflectance of the sample was represented as a reflectance factor calculated as the ratio of radiation reflected from the sample to that reflected from the calibration panel.
2.4. Statistical Analysis
Soil reflectance of all the samples was used as a continuous independent dataset. The eleven soil chemical properties were used as continuous target data to develop the prediction models. Multivariate analyses were applied for data analysis. Spectral bands below 430 nm were removed due to the large noise effect. Original spectra were smoothed using a Savitzky-Golay algorithm [43] with a window size of three to avoid signal noise disturbance. All data were mean centred by subtracting the average from each variable before being included in multivariate calibrations. This step ensures that all results will be interpretable in terms of variation around the mean. Internal structure and significant variability in the data were explored using a PCA based on original soil reflectance and the first derivative of reflectance. Moreover, PCA reduced data dimensionality and collinearity. Factor scores acquired from the calculated principal components (PC) were used as predictor variables in selected calibration methods. Discriminant analysis as a supervised classification method was applied with a subset of the selected PCs to classify samples by fire severity treatments. PLSR and an ANN were used to build general soil properties prediction models based on original soil reflectance data and the first derivative of reflectance (n = 120). The PLSR model was calibrated using full cross-validation (each observation is used as a test set to validate the predictive model). In ANN regression analysis, spectra were randomly divided into training (50%) and testing (50%) sets, while independent input data consisted of PCs representing the total variation of the soil spectra and corresponding to the number of input neurons. The neural network was supervised back-propagation with a structure consisting of one input layer, one output layer, and one hidden layer. A multi-layer perceptron (MLP) network with a prevailing exponential activation function and BFGS training algorithm was applied for all investigated soil properties. Models were validated for accuracy evaluation and predictive capability based on the coefficient of determination (R2), root mean squared error (RMSE), and residual prediction deviation (RPD) (confidence limits of 95%).
To compare the R2, the classification of Moore and Kirkland [44] was considered, whereby R2 is strong (> 0.70), moderate (0.5 < R2 < 0.7), weak (0.3 < R2 < 0.5), and very weak (< 0.3). RPD is used to investigate the prediction error with variation in the data (Jiang et al., 2016). The model with the highest RPD is considered the most accurate. According to Viscarra Rossel et al. [45], RPD was interpreted as excellent predictions (RPD > 2.5), good (RPD between 2.0 to 2.5), approximate quantitative predictions (RPD between 1.8 to 2.0), possibility to distinguish high and low values (RPD between 1.4 to 1.8), and unsuccessful (RPD < 1.40). The RPD is calculated by the following equation:
where SD is the standard deviation of the observed data; RMSEP is the root mean squared error of prediction.
Descriptive statistics and ANOVA were computed for soil chemical properties. Data normality was assessed using the Shapiro–Wilk test. A two-way ANOVA was applied to test the effects of treatment, time, and treatment × time, based on reflectance data. If significant differences were observed at a p < 0.05, a Tukey or multiple comparisons of the mean rank test were applied. The Pearson correlation coefficient was used to assess the correlation among all the variables. Significant correlations were considered at a p < 0.05. Data analysis was carried out using the spectroscopy software Unscrambler 9.7 [46] and STATISTICA 12 [47]. Spectra were evaluated and preprocessed using ViewSpec Pro 6.2.0. [48].
3. Results
3.1. Soil Chemical Properties
Descriptive statistics of the investigated soil properties are presented in Table 2. The Shapiro–Wilk test determined non-normal distribution for SOC, K2O, P2O5, EC, CaCO3, exCa, exMg, exK, exNa, and CEC, and normal distribution only for soil pH. Accordingly, a one-way ANOVA test was applied for soil pH and Kruskal–Wallis for the rest of the soil parameters. The skewness results imply that the distribution of soil properties varied from fairly negatively symmetrical (skewness: −0.002, e.g., SOC in HS treatment) to highly positive skewness (skewness: 2.77, e.g., exNa in CON treatment). For all three treatments, soil pH, SOC, P2O5, exCa, exMg, and exK had low negative kurtosis values, indicating a platykurtic distribution. Leptokurtic distribution prevailed on all treatments for EC and exNa (kurtosis > 3), indicating outliers. Results showed significant differences in all investigated soil properties among the treatments. Soil pH, EC, CaCO3, K2O, exCa, exMg, exK, and CEC in MS and HS were significantly higher than in the CON. SOC was significantly different among treatments as follows: MS (17.8%) > HS (11.8%) > CON (7.23%). P2O5 and exNa values were significantly higher in the CON than in HS and MS treatments. The CV value of EC, CaCO3, P2O5, K2O, and exNa was higher than 35% in all the treatments showing a high heterogeneity in the values observed.
Table 2.
Descriptive statistics of soil properties within one year after the wildfire. Abbreviations: unburned control (CON); moderate fire severity (MS); high fire severity (HS). Different letters represent significant differences at a p < 0.05. (n = 120).
The correlation coefficients between the studied soil chemical properties are shown in Table 3. They indicate relations in prediction accuracy of certain soil properties obtained later by PLSR and an ANN based on spectral data. As expected, significant correlations were calculated between CEC and all properties except exK and K2O in the following order of strength: exCa > exMg > SOC > P2O5 > EC > CaCO3 > exNa. P2O5 was significantly correlated with all investigated soil properties. A strong, significant relation was found between SOC and exCa and CEC. EC significantly correlated with P2O5 and CEC. A negative significant relation was obtained between exNa and most of the analyzed properties.
Table 3.
Correlation coefficients among eleven soil chemical properties (n = 120).
3.2. Qualitative Evaluation of Soil Reflectance
Most of the variability between different treatments was identified in the visible and NIR spectrum (reflectance peak from 550–570 and 650–700 nm) (Figure A1 in Appendix A). As seen in Table 4, significant differences in soil reflectance were observed for time and fire severity factors. However, they were not identified in the interaction between time x fire severity, which justified using a multi-temporal dataset in PLSR (n = 120; larger dataset and higher soil variability). Reflectance was significantly higher in the unburned plot than in all the plots in all sampling periods. Regarding the sampling periods, in HS the reflectance of the samples obtained immediately after the wildfire was significantly higher than in the samples observed three months after (Figure 2).
Table 4.
Two-way ANOVA results. Significant differences at p < 0.05 *, and p < 0.001 ***. Abbreviation: not significant at a p < 0.05 (n.s.).
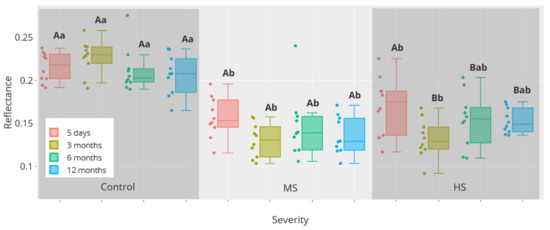
Figure 2.
Two-way ANOVA results for soil reflectance. Box plot of soil reflectance from four sampling dates grouped by fire severity. Hanging bars (upper and lower fence), upper box line (quartile 3), line inside the box (median), and lower box line (quartile 1). Different letters represent significant (p < 0.05) differences between sampling periods (upper-case letters) and fire severity (lower-case letters). Abbreviations: moderate fire severity (MS); high fire severity (HS).
3.3. Principal Component Analysis and Discriminant Function Analysis
The PCA of VNIR spectra for the whole dataset is presented in Figure 3. The first factor accounted for 98% of the total spectral variance. As seen on the score plot, differences were observed especially between the unburned and the burned plots (Figure 3A). The variability was higher in HS and MS than in the CON. Two HS and one MS samples were marked as outliers according to Hotelling’s T2 test. The spectra loadings (x—loadings) were comparable to the score plot, showing the relationship between the PC1 and the soil spectral variables and indicating the importance of spectral features for differing fire severities (Figure 3B). All loadings on PC1 are positive. Red to red-edge and the NIR part of the spectrum were significant for extracting most of the variance in reflectance data due to its strong relationship with the organic composition of the soil samples [29]. Figure 3C identifies some outliers, especially in HS.
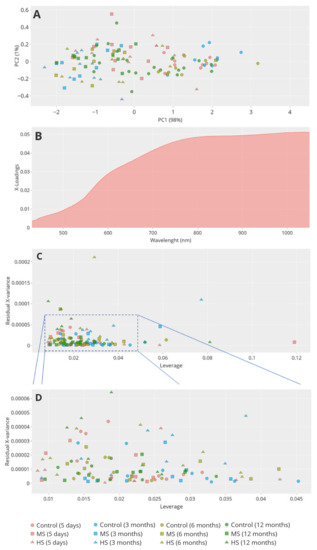
Figure 3.
The PCA results overview for soil reflectance of 120 samples with wavelength range 430–1050 nm. (A) PC1 and PC2 score plot, (B) spectral loadings plot, (C) residual spectral variance, and (D) Figure 3C zoomed area. Abbreviations: unburned control (CON); moderate fire severity (MS); high fire severity (HS).
The DA generated discriminant functions based on linear combinations of the spectral variables that provided the best discrimination between fire severity treatments (Figure 4). Five PCs were found to provide significant contributions to fire severity discrimination (p < 0.05). Table 5 shows parameters that explain the significance of the two selected discriminant functions (roots). The first function accounted for 86% of the explained variance, while the second was not significant. Figure 4 represents a scatterplot of canonical scores for the two discriminant functions. Soil samples from the unburned area (CON) are plotted right in the scatterplot with positive values for the first discriminant function. MS and HS treatments were mostly mixed, showing negative values. The second canonical function was not significant and did not differ among fire severities. This result is in accordance with the classification matrix presented in Table 6, where the CON treatment achieved 98% of successful classifications, MS 70%, and HS only 55% of successful predictions. For example, 17 samples from HS treatment were misclassified as MS, and only 22 samples were correctly classified.
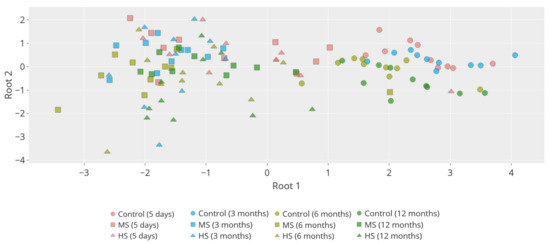
Figure 4.
Sampled soil spectra represented as a function of discriminant factors (roots) 1 and 2. Samples are labeled according to the fire severity treatments. Abbreviations: moderate fire severity (MS); high fire severity (HS).
Table 5.
Chi-Square Tests with Successive Roots Removed.
Table 6.
Classification Matrix. Rows: observed classifications. Columns: predicted classifications.
3.4. Multivariate Modelling Based on Soil Spectra—PLSR and ANN
Table 7 summarizes the multivariate calibration model results based on VNIR soil reflectance. PLSR and ANN models were built based on raw reflectance and first derivative spectra. They were chosen based on the best predictive ability for each soil attribute (raw reflectance: SOC, pH, K2O, CaCO3, exCa, exK, exNa, and CEC; first derivative: EC, P2O5, and exMg). Scatter plots of observed vs. predicted values of investigated soil chemical properties are shown in Figure A2. The results show a very high relation between VNIR spectra and most soil properties for calibration and validation datasets. With respect to the PLSR model calibrations, R2 was strong for SOC (0.76), P2O5 (0.76), K2O (0.8), exCa (0.9), exK (0.73), and CEC (0.9); moderate for pH (0.54), CaCO3 (0.51), and exMg (0.69); weak for EC (0.35); and very weak for exNa (0.29). In PLSR model validations, R2 was strong for exCa (0.8) and CEC (0.82); moderate for SOC (0.64), P2O5 (0.63), K2O (0.61), exMg (0.61), and exK (0.53); weak for pH (0.31) and CaCO3 (0.48); and very weak for EC (0.18) and exNa (0.26). In ANN model calibrations, R2 was strong for SOC (0.77), P2O5 (0.79), exCa (0.94), exK (0.81), and CEC (0.96); moderate for pH (0.55), K2O (0.65), CaCO3 (0.59), and exMg (0.68); and weak for EC (0.31) and exNa (0.43). In ANN model validations, R2 was strong for SOC (0.74), P2O5 (0.74), exCa (0.78), exK (0.73), and CEC (0.79); moderate for K2O (0.54) and exMg (0.66); weak for CaCO3 (0.38); and very weak for pH (0.29), EC (0.2), and exNa (0.27).
Table 7.
Summary of calibration and validation results of PLSR and ANN models for soil chemical properties (n = 120).
Overall, exchangeable Ca and CEC showed the highest R2 in the PLSR model, while SOC and P2O5 showed the highest R2 in the ANN model. The prediction of K2O, CaCO3, exCa, and CEC was more accurate using PLSR, while the ANN model’s SOC, P2O5, exMg, and exK were better estimated. RPD values for exCa and CEC had a good quantitative prediction power in the PLSR model. Unlike PLSR, RPD showed approximate quantitative prediction power for SOC and P2O5 in the ANN. Soil pH, EC, CaCO3, and exNa showed low predictability in both models.
As a product of PLSR, the regression coefficient plot shows how much each wavelength contributed to the prediction of investigated soil chemical properties (Figure A3). The highest significant adsorption peaks were found for SOC, P2O5, K2O, CaCO3, exCa, and CEC. Peaks from 450–600 nm and 900–1050 were identified as zones of major importance for the PLSR model of SOC content. Significant wavelengths were distributed throughout the VNIR spectrum with positive and negative peaks for the other soil mentioned above.
4. Discussion
The results of this study show an increase in SOC in MS and HS treatments, which contrasts with some previous works [49,50] where the SOM decreases after moderate-to-high-severity wildfires. Moreover, some research did not even identify significant differences [51]. The SOM/SOC content usually decreases after high severity fire [52,53], while low-to-moderate-severity fires induce SOM increase due to the incorporation of burned vegetation necromass into the soil [54,55]. In our case, ash was very likely incorporated in the topsoil. However, this increase was more pronounced in MS treatment, indicating that high temperature had affected the degree of SOC combustion in HS treatment. The highest pH in HS was confirmed in previous works [56,57]. Typically, soil pH increases due to organic matter combustion and the incorporation of ash into the soil profile [53]. Usually, ash pH increases with the time and temperature of contact [58]. Moreover, fire increases nutrient availability, which may persist over a year, depending on the post-fire weather conditions [57]. The observed increase of exchangeable cations agrees with several other studies, and this is attributed to the organic matter mineralisation imposed by fire temperatures and the pH increase [52]. Moreover, the high pH in the ash produced at moderate-to-high-intensity fires facilitates the solubility of major cations [53]. EC values were the highest in HS treatment, corresponding with the major cation peak in the same treatment. These results agree with previous works, which identified an EC increase after moderate-to-high-severity fires [52,57]. Similar to pH, this was due to the organic matter combustion and incorporation of ash, rich in base cations, into the soil profile.
The higher reflectance of the CON soil samples was attributed to the lower SOC, affecting the soil colour. The higher the SOC, the lower the reflectance of the soil samples. PCA scores discriminated unburned and burned samples (Figure 3). Using the 350–1050 nm spectral range, we observed that MS and HS were mixed. Both were similar in colour, and, therefore, in reflectance intensity. These results are confirmed by Vergnoux et al. [35] and Zornoza et al. [59]. Discriminant analysis was employed as supervised classification based on soil reflectance with the overall success of fire severity prediction of 74.2%. The first discriminant function discriminated between the CON and two burned treatments (MS and HS). For example, Arcenegui et al. [60] obtained successful classification (>97%) of soil samples using DA, according to the maximum temperature reached using NIR reflectance spectroscopy.
According to RPD values, CEC and exCa had a good prediction, and SOC, P2O5, and exK had an approximate quantitative prediction (Table 7). As seen in Table 3, a strong correlation (r > 0.60; p < 0.05) was observed between these soil properties. The high ability of VNIR and PLSR to predict CEC and exCa is attributed to the fact that these properties are strongly linked with SOM. A limited prediction was identified for pH, EC, and exNa, which was previously reported in the literature [61,62,63]. Despite this, the coefficient of determination between most soil parameters and soil reflectance was high. Rosero-Vlasova et al. [31] developed SOM predictions of good quality and acceptable accuracy levels (R2 = 0.75) using laboratory VIS-NIR-SWIR spectra. Moreover, the moderately useful calibration acceptable for a rapid sample screening for large area soil survey (R2 = 0.73 and RPD = 1.76) was achieved for SOC model prediction by Miloš and Bensa [64], which is similar to the prediction obtained in the present study. Overall absorption due to SOM in the visible region is broad but clear and, therefore, recognizable and useful in soil spectral sensing. SOM contains spectrally active groups like chlorophyll, oil, cellulose, pectin, starch, lignin, and humic acid in the VNIR and NIR region [65]. VNIR reflectance provides information about soil colour, which is directly influenced by fire severity through changes in SOC content. Reflectance decreases with increasing SOM content [66]. In our case, SOC content, exCa, and CEC were highest in the burned plots (Table 2). Regarding the predictions of soil properties based on utilising different spectral regions, comparable findings were reported by Viscarra Rossel et al. [24]. In their study, the PLSR cross-validation predictions based on VIS revealed RMSE and R2 values of 0.21 and 0.36 for pH, 0.18 and 0.60 for SOC, 6.70 and 0.31 for exCa, 2.02 and 0.29 for exK, and 0.01 and 0.05 for EC, respectively. PLSR loading weight vectors determined moderate positive peaks important for SOC prediction (570 and 660 nm). Using NIR, exK and pH predictions improved slightly, while SOC, CEC, exCa, available P2O5, and EC were better predicted in the VIS region. Similar results have been reported in previous studies. Stevens et al. [67] applied PLSR on airborne hyperspectral data and achieved the highest correlations between SOC content and reflectance in the VIS ranges (600–750 nm). The CEC using VNIR was successfully predicted by Chang et al. [61] and Islam et al. [63] (R2 of 0.81 and 0.64, respectively). They found R2 values for exCa of 0.75 and 0.67, respectively, but poor prediction of EC and exNa, R2 of 0.10 and 0.34, respectively. The reduced prediction of exNa, EC, pH, and exK indicates that these properties do not have a response in the VNIR region and were not correlated with SOM [59]. The soils sampled in the studied area have a high CEC saturation with exCa and exMg (above 80%) [68]. Zornoza et al. [59] stated that exCa and exMg concentrations highly depend on SOM functional groups and are well predicted using VNIR spectroscopy. Daniel et al. [69] applied an ANN with the same spectral range (400–1100 nm) as our study and achieved the following predictions: K2O-R2 of 0.80, plant-available P-R2 of 0.81, and SOM-R2 of 0.86. Also, Chang et al. [61] reported 55% and 57% of exK and soil pH variability explained by spectral data, respectively. Mouazen et al. [70] obtained comparable results using the spectral range between 306–1710 nm and PLSR for on-the-go measurement of some soil properties and achieved a quantitative approximation for soil total C, pH, and P2O5 (R2 between 0.66 and 0.81). One potential reason for moderate SOC prediction in our work can be the transition of clay particles to sand-sized particles under the influence of fire [71]. They induced light scattering, masked the absorption of SOC, and lowered reflection [28], as can be seen in Figure A1. Nevertheless, this needs to be confirmed in future works.
As observed in the regression coefficients for the best-predicted soil properties (SOC, P2O5, exK, CaCO3, exCa, and CEC) (Figure A3), the peaks in the visible part of the spectrum indicated a colour effect (SOM and Fe oxides), while adsorption in NIR wavelengths was probably associated with N-H, O-H, and C-H bonds [64,70]. Viscarra Rossel et al. [45] recorded moderate positive peaks in the VIS region, important for the SOC prediction at 410, 570, and 660 nm, which is supported by our research. They also analysed factor loading weights for soil pH and found negative contributions for bands between 470 and 670 nm and positive contributions for bands > 670. Similar results were obtained by Šestak et al. [72], emphasising the red part of the spectrum (670–710 nm) as the zone of major importance for the PLSR model of SOM content. Nanni and Demattê [73] recorded spectral ranges of 480–600 nm and 720–820 nm as key SOM prediction model development regions. The VIS region was responsible for the determination of soil C content (peaks at 439, 490, and 661 nm) [70].
However, despite moderately accurate prediction models, the general calibration approach was helpful for rapid soil assessment. Therefore, it can serve as a good reference for remote data identification. In this study, soil pH, EC, CaCO3, and exNa predicted with low accuracy need further investigation to identify their spectrally active fractions within the infrared range. When evaluating variability among the data (Table 2), we can state that CV from 10–35% representing moderate variability in the reference dataset induced good prediction as developed for SOC, P2O5, exK, exCa, and CEC. Zornoza et al. [59] observed that to ensure the VNIR spectroscopy results reliability, it is important to include a large number of samples. Additionally, Kuang et al. [74] reported that many authors support a general rule that soil variation can influence prediction performance. According to Stenberg et al. [28], Viscarra Rossel and Behrens [75], and Viscarra Rossel et al. [24], ANN models seem to perform better when dealing with non-linear relationships between soil spectral signatures and soil properties of interest, as was observed in this study, especially in the case of SOC and P2O5. However, it remains unclear why the also highly variable CaCO3 did not benefit from the ANN model in the same way. In order to tackle the problem of the high variability of soil properties, specific studies need to be conducted with a large number of samples of soils burned at the same severity on the same sampling date. Future studies need to address this question.
5. Conclusions
Soil properties’ variability among different fire severities was identified in the VIS and NIR spectrum. The average reflectance was significantly higher five days after the fire than on the other sampling dates. CON soil exhibited a higher reflectance than MS and HS soil due to low SOC concentrations. The PCA results highlighted the importance of the NIR spectrum to extract most of the variance in reflectance and identify the differences between unburned and burned soils. DA discriminated between the CON and two burned treatments (MS and HS) with an overall fire severity classification success of 74.2%. PLSR and ANN calibration techniques based on hyperspectral reflectance successfully predicted SOC, P2O5, exCa, exK, and CEC. According to RPD values, a good prediction was obtained for CEC and exCa, and an approximate quantitative prediction was observed in SOC, P2O5, and exK. Soil pH, EC, CaCO3, and exNa were poorly predicted in both models. Future research should focus on two main aspects: (1) work with a large number of samples and (2) work with the short and mid-infrared part of the spectrum. However, we consider that as an additional tool to standard laboratory analysis, soil spectroscopy in the VNIR region proved to be a reliable method for rapid, low-cost, and non-destructive screening of soil properties in areas affected by fire.
Author Contributions
Conceptualization, I.B. and P.P.; methodology, P.P. and I.Š.; software, I.Š.; validation, P.P., I.H. and I.Š.; formal analysis, I.Š. and A.P.; investigation, I.B., L.J.T. and P.P.; resources, I.B.; writing—original draft preparation, I.Š.; writing—review and editing, I.B., I.Š., I.H. and P.P.; visualization, I.Š., I.H. and P.P.; supervision, I.B., P.P. and I.Š.; project administration, I.B.; funding acquisition, I.B. and I.Š. All authors have read and agreed to the published version of the manuscript.
Funding
This work was supported by the Croatian Science Foundation through the project “Soil erosion and degradation in Croatia” (UIP-2017-05-7834) (SEDCRO).
Data Availability Statement
The data presented in this study are available on request from the corresponding author. The data are not publicly available due to their current usage for the preparation of another draft for publication.
Acknowledgments
Ivica Kisić is acknowledged for his cooperation during the field research.
Conflicts of Interest
The authors declare no conflict of interest. The funders had no role in the design of the study; in the collection, analyses, or interpretation of data; in the writing of the manuscript; or in the decision to publish the results.
Appendix A
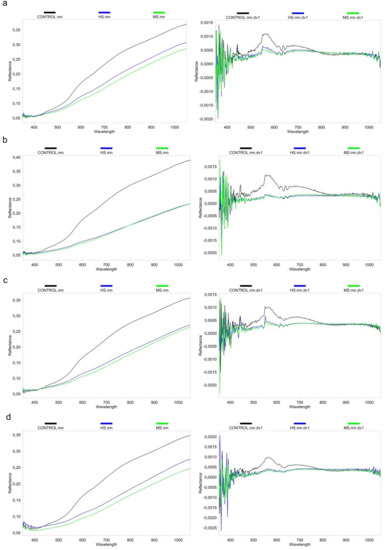
Figure A1.
Difference in mean soil reflectance (left) and average first derivative of soil reflectance (right) according to treatments and sampling time: (a) 5 days, (b) 3 months, (c) 6 months, and (d) 12 months after the fire.
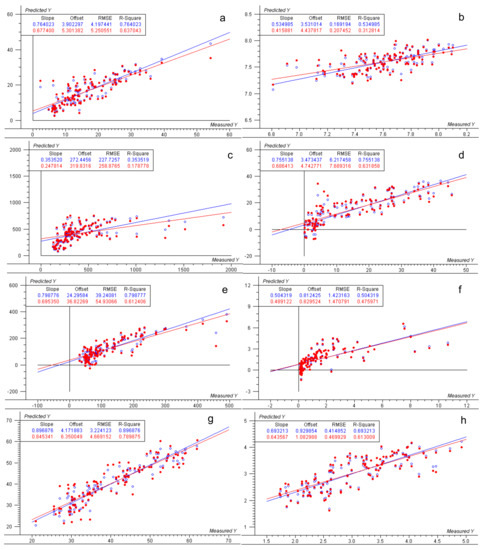
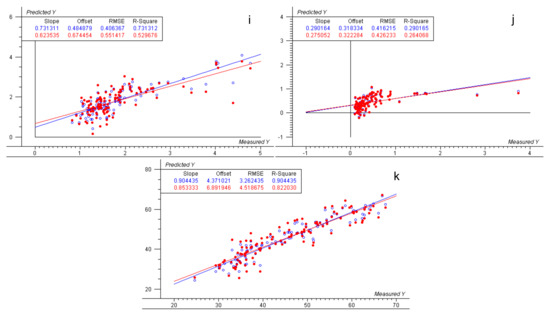
Figure A2.
Scatter plots of observed vs. predicted values for (a) OC (%); (b) pH; (c) EC (µS cm−1); (d) P2O5 (g kg−1); (e) K2O (g kg−1); (f) CaCO3 (%); (g) exCa (cmol(+)kg); (h) exMg (cmol(+)kg); (i) exK (cmol(+)kg); (j) exNa (cmol(+)kg); (k) CEC (cmol(+)kg); (n = 120); blue—calibration, red—validation.
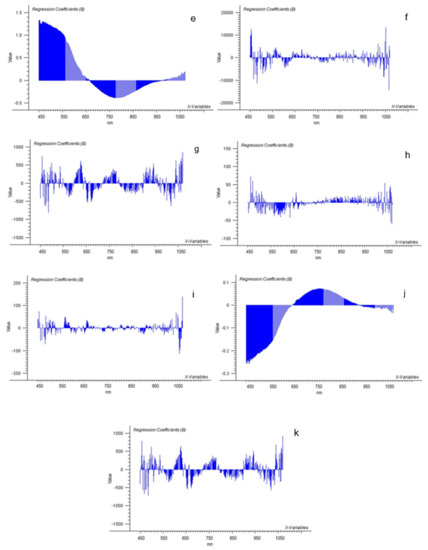
Figure A3.
Regression coefficients as a result of PLSR model for 11 chemical soil properties from control (CON), medium severity (MS), and high severity (HS) treatment: (a) OC; (b) pH; (c) EC; (d) P2O5; (e) K2O; (f) CaCO3; (g) exCa; (h) exMg; (i) exK; (j) exNa; (k) CEC; (n = 120). Significant wavelengths are marked as dark blue at a p < 0.05.
References
- Pereira, P.; Francos, M.; Brevik, E.; Ubeda, X.; Bogunovic, I. Post-fire soil management. Curr. Opin. Environ. Sci. Health 2018, 5, 26–32. [Google Scholar] [CrossRef]
- Nunes, J.P.; Bernard-Jannin, L.; Rodríguez-Blanco, M.L.; Boulet, A.K.; Marisa Santos, J.; Keizer, J.J. Impacts of wildfire and post-fire land management on hydrological and sediment processes in a humid Mediterranean headwater catchment. Hydrol. Process. 2020, 34, 5210–5228. [Google Scholar] [CrossRef]
- Molina, J.R.; González-Cabán, A.; Rodríguez y Silva, F. Wildfires impact on the economic susceptibility of recreation activities: Application in a Mediterranean protected area. J. Environ. Manag. 2019, 245, 454–463. [Google Scholar] [CrossRef]
- Wigtil, G.; Hammer, R.B.; Kline, J.D.; Mockrin, M.H.; Stewart, S.I.; Roper, D.; Radeloff, V.C. Places where wildfire potential and social vulnerability coincide in the coterminous United States. Int. J. Wildland Fire 2016, 25, 896–908. [Google Scholar] [CrossRef] [Green Version]
- Cohen, J.L.; Stravos, E.N.; Fites-Kaufman, J.A. Deconstructing the King megafire. Ecol. Appl. 2018, 28, 1565–1580. [Google Scholar] [CrossRef] [PubMed]
- Nolan, R.H.; Boer, M.M.; Collins, L.; Resco de Rios, V.; Clarke, H.; Jenkins, M.; Kenny, B.; Bradstock, R.A. Causes and consequences of eastern Australia’s 2019–20 season of mega-fires. Glob. Chang. Biol. 2020, 26, 1039–1041. [Google Scholar] [CrossRef] [Green Version]
- Moreira, F.; Ascoli, D.; Safford, H.; Adams, M.A.; Moreno, J.S.; Pereira, J.C.; Catry, F.X.; Armesto, J.; Bond, W.; Gonzalez, M.; et al. Wildfire management in Mediterranean-type regions: Paradigm change needed. Environ. Res. Lett. 2020, 15, 011001. [Google Scholar] [CrossRef]
- Bento-Gonçalves, A.; Vieira, A.; Úbeda, X.; Martin, D. Fire and soils: Key concepts and recent advances. Geoderma 2012, 191, 3–13. [Google Scholar] [CrossRef]
- Zavala, L.M.M.; de Celis Silvia, R.; López, A.J. How wildfires affect soil properties. A brief review. Cuad. Investig. Geogr. 2014, 40, 311–331. [Google Scholar] [CrossRef] [Green Version]
- Pereira, P.; Cerda, A.; Martin, D.; Úbeda, X.; Depellegrin, D.; Novara, A.; Miesel, J. Short-term low-severity spring grassland fire impacts on soil extractable elements and soil ratios in Lithuania. Sci. Total Environ. 2017, 578, 469–475. [Google Scholar] [CrossRef] [Green Version]
- Alcañiz, M.; Outeiro, L.; Francos, M.; Úbeda, X. Effects of prescribed fires on soil properties: A review. Sci. Total Environ. 2018, 613, 944–957. [Google Scholar] [CrossRef]
- Certini, G.; Nocentini, C.; Knicker, H.; Arfaioli, P.; Rumpel, C. Wildfire effects on soil organic matter quantity and quality in two fire-prone Mediterranean pine forests. Geoderma 2011, 167, 148–155. [Google Scholar] [CrossRef]
- Jiménez-Pinilla, P.; Mataix-Solera, J.; Arcenegui, V.; Delgado, R.; Martín-García, J.M.; Lozano, E.; Zavala, L.M.; Jordán, A. Advances in the knowledge of how heating can affect aggregate stability in Mediterranean soils: A XDR and SEM-EDX approach. Catena 2016, 147, 315–324. [Google Scholar] [CrossRef]
- Badía, D.; Martí, C. Plant ash and heat intensity effects on chemical and physical properties of two contrasting soils. Arid Land Res. Manag. 2003, 17, 23–41. [Google Scholar] [CrossRef]
- Badía-Villas, D.; González-Pérez, J.A.; Aznar, J.M.; Arjona-Gracia, B.; Martí-Dalmau, C. Changes in water repellency, aggregation and organic matter of a mollic horizon burned in laboratory: Soil depth affected by fire. Geoderma 2014, 213, 400–407. [Google Scholar] [CrossRef]
- Doerr, S.H.; Shakesby, R.A.; Walsh, R. Soil water repellency: Its causes, characteristics and hydro-geomorphological significance. Earth-Sci. Rev. 2000, 51, 33–65. [Google Scholar] [CrossRef]
- Dlapa, P.; Simković, I.; Doerr, S.H.; Kanka, R.; Mataix-Solera, J. Application of thermal analysis to elucidate water-repellency changes in heated soils. Soil Sci. Soc. Am. J. 2008, 72, 1–10. [Google Scholar] [CrossRef]
- Mataix-Solera, J.; Cerdà, A.; Arcenegui, V.; Jordán, A.; Zavala, L.M. Fire effects on soil aggregation: A review. Earth-Sci. Rev. 2011, 109, 44–60. [Google Scholar] [CrossRef]
- Binkley, D.; Fisher, R.F. Ecology and Management of Forest Soils; Wiley-Blackwell: Oxford, UK, 2013. [Google Scholar]
- Serpa, D.; Ferreira, R.V.; Machado, A.I.; Cerqueira, M.A.; Keizer, J.J. Mid-term post-fire losses of nitrogen and phosphorus by overland flow in two contrasting eucalypt stands in north-central Portugal. Sci. Total Environ. 2020, 705, 135843. [Google Scholar] [CrossRef]
- Lombao, A.; Barreiro, A.; Carballas, T.; Fontúrbel, M.T.; Martín, A.; Vega, J.A.; Díaz-Raviña, M. Changes in soil properties after a wildfire in Fragas do Eume Natural Park (Galicia, NW Spain). Catena 2015, 135, 409–418. [Google Scholar] [CrossRef]
- Martinez-Murillo, J.F.; Montorio Lloveria, R.; Perez-Cabello, F. Techniques for mapping the effects of fire on soil. In Fire Effects on Soil Properties; Pereira, P., Mataix-Solera, J., Ubeda, X., Rein, G., Cerda, A., Eds.; CSIRO Publishing: Clayton, Australia, 2019; pp. 329–345. [Google Scholar]
- Mahmood, H.S.; Hoogmoed, W.B.; van Henten, E.J. Sensor data fusion to predict multiple soil properties. Prec. Agric. 2012, 13, 628–645. [Google Scholar] [CrossRef]
- Viscarra Rossel, R.A.; Walvoort, D.J.J.; McBratney, A.B.; Janik, L.J.; Skjemstad, J.O. Visible, near infrared, mid infrared or combined diffuse reflectance spectroscopy for simultaneous assessment of various soil properties. Geoderma 2006, 131, 59–75. [Google Scholar] [CrossRef]
- Wetterlind, J.; Stenberg, B.; Söderström, M. Increased sample point density in farm soil mapping by local calibration of visible and near infrared prediction models. Geoderma 2010, 156, 152–160. [Google Scholar] [CrossRef] [Green Version]
- Sorenson, P.T.; Small, C.; Tappert, M.C.; Quideau, S.A.; Drozdowski, B.; Underwood, A.; Janz, A. Monitoring organic carbon, total nitrogen, and pH for reclaimed soils using field reflectance spectroscopy. Can. J. Soil Sci. 2017, 97, 241–248. [Google Scholar] [CrossRef]
- Conforti, M.; Matteucci, G.; Buttafuoco, G. Using laboratory Vis-NIR spectroscopy for monitoring some forest soil properties. J. Soils Sediments 2018, 18, 1009–1019. [Google Scholar] [CrossRef]
- Stenberg, B.; Viscarra Rossel, R.A.; Mouazen, A.M.; Wetterlind, J. Visible and near infrared spectroscopy in soil science. Adv. Agron. 2010, 107, 163–215. [Google Scholar]
- Guerrero, C.; Mataix-Solera, J.; Arcenegui, V.; Mataix-Beneyto, J.; Gómez, I. Near-infrared spectroscopy to estimate the maximum temperatures reached on burned soils. Soil Sci. Soc. Am. J. 2007, 71, 1029–1037. [Google Scholar] [CrossRef]
- Montorio Llovería, R.; Pérez-Cabello, F.; García-Martín, A. Assessing post-fire ground cover in Mediterranean shrublands with field spectrometry and digital photography. ISPRS J. Photogramm. Remote Sens. 2016, 119, 187–197. [Google Scholar] [CrossRef]
- Rosero-Vlasova, O.A.; Pérez-Cabello, F.; Llovería, R.M.; Vlassova, L. Assessment of laboratory VIS-NIR-SWIR setups with different spectroscopy accessories for characterisation of soils from wildfire burns. Biosyst. Eng. 2016, 152, 51–67. [Google Scholar] [CrossRef]
- Peón, J.; Fernández, S.; Recondo, C.; Calleja, J.F. Evaluation of the spectral characteristics of five hyperspectral and multispectral sensors for soil organic carbon estimation in burned areas. Int. J. Wildland Fire 2017, 26, 230–239. [Google Scholar] [CrossRef]
- Rosero-Vlasova, O.A.; Vlassova, L.; Pérez-Cabello, F.; Montorio, R.; Nadal-Romero, E. Modeling soil organic matter and texture from satellite data in areas affected by wildfires and cropland abandonment in Aragón, Northern Spain. J. Appl. Remote Sens. 2018, 12, 042803. [Google Scholar] [CrossRef]
- Mohamed, E.S.; Saleh, A.M.; Belal, A.B.; Gad, A. Application of near-infrared reflectance for quantitative assessment of soil properties. Egypt J. Remote Sens. Space Sci. 2008, 21, 1–14. [Google Scholar] [CrossRef]
- Vergnoux, A.; Dupuy, N.; Guiliano, M.; Vennetier, M.; Théraulaz, F.; Doumenq, P. Fire impact on forest soils evaluated using near-infrared spectroscopy and multivariate calibration. Talanta 2009, 80, 39–47. [Google Scholar] [CrossRef] [PubMed] [Green Version]
- Zhao, D.; Arshad, M.; Wang, J.; Triantafilis, J. Soil exchangeable cations estimation using Vis-NIR spectroscopy in different depths: Effects of multiple calibration models and spiking. Comput. Electron. Agric. 2021, 182, 105990. [Google Scholar] [CrossRef]
- IUSS Working Group WRB. World Reference Base for Soil Resources 2014, Update 2015: International Soil Classification System for Naming Soils and Creating Legends for Soil Maps; World Soil Resources Reports No. 106; FAO: Rome, Italy, 2015; p. 192. [Google Scholar]
- Kottek, M.; Grieser, J.; Beck, C.; Rudolf, B.; Rubel, F. World map of the Köppen-Geiger climate classification updated. Meteorol. Z. 2006, 15, 259–263. [Google Scholar] [CrossRef]
- Úbeda, X.; Pereira, P.; Outeiro, L.; Martin, D.A. Effects of fire temperature on the physical and chemical characteristics of the ash from two plots of cork oak (Quercus suber). Land Degrad. Dev. 2009, 20, 589–608. [Google Scholar] [CrossRef] [Green Version]
- Egnér, H.; Riehm, H.; Domingo, W.R. Untersuchungen über die chemische Bodenanalyse als Grundlage für die Beurteilung des Nährsto zustandes der Böden. II. Chemische Extraktionsmethoden zur Phosphor-und Kaliumbestimmung. K. Lantbr. Ann. 1960, 26, 199–215. [Google Scholar]
- Walkley, A.; Black, I.A. An examination of the Degtjareff method for determining soil organic matter, and a proposed modification of the chromic acid titration method. Soil Sci. 1934, 37, 29–38. [Google Scholar] [CrossRef]
- Šestak, I.; Mihaljevski Boltek, L.; Mesić, M.; Zgorelec, Ž.; Perčin, A. Hyperspectral sensing of soil pH, total carbon and total nitrogen content based on linear and non-linear calibration methods. J. Cent. Eur. Agric. 2019, 20, 504–523. [Google Scholar] [CrossRef]
- Savitzky, A.; Golay, M.J.E. Smoothing and differentiation of data by simplified least squares procedures. Anal. Chem. 1964, 36, 1627–1639. [Google Scholar]
- Moore, D.S.; Kirkland, S. The Basic Practice of Statistics; WH Freeman: New York, NY, USA, 2007; Volume 2. [Google Scholar]
- Viscarra Rossel, R.A.; McGlynn, R.N.; McBratney, A.B. Determining the composition of mineral-organic mixes using UV–VIS–NIR diffuse reflectance spectroscopy. Geoderma 2006, 137, 70–82. [Google Scholar] [CrossRef]
- CAMO Analytics. UNSCRAMBLER 9.7. Spectroscopy Software Suite; CAMO: Oslo, Norway, 2007. [Google Scholar]
- StatSoft, Inc. STATISTICA Data Analysis Software System, version 12; StatSoft Inc: Tulsa, OK, USA, 2014. [Google Scholar]
- Analytical Spectral Devices Inc. ViewSpec Pro 6.2.0 Software; Analytical Spectral Devices: Boulder, CO, USA, 2009. [Google Scholar]
- Fernández, I.; Cabaneiro, A.; Carballas, T. Organic matter changes immediately after a wildfire in an Atlantic forest soil and comparison with laboratory soil heating. Soil Biol. Biochem. 1997, 29, 1–11. [Google Scholar] [CrossRef]
- Knicker, H.; González-Vila, F.J.; González-Vázquez, R. Biodegradability of organic matter in fire-affected mineral soils of Southern Spain. Soil Biol. Biochem. 2013, 56, 31–39. [Google Scholar] [CrossRef]
- Jordán, A.; Zavala, L.M.; Mataix-Solera, J.; Nava, A.L.; Alanís, N. Effect of fire severity on water repellency and aggregate stability on Mexican volcanic soils. Catena 2011, 84, 136–147. [Google Scholar] [CrossRef]
- Francos, M.; Úbeda, X.; Pereira, P.; Alcañiz, M. Long-term impact of wildfire on soils exposed to different fire severities. A case study in Cadiretes Massif (NE Iberian Peninsula). Sci. Total Environ. 2018, 615, 664–671. [Google Scholar] [CrossRef] [PubMed]
- Pereira, P.; Brevik, E.C.; Bogunovic, I.; Estebaranz-Sánchez, F. Ash and soils. A twin relationship in fire-affected areas. In Fire Effects on Soil Properties; Pereira, P., Cerdà, A., Úbeda, X., Mataix-Solera, J., Rein, G., Eds.; CSIRO Publishing: Clayton, Australia, 2018. [Google Scholar]
- Knicker, H.; Almendros, G.; González-Vila, F.J.; González-Pérez, J.A.; Polvillo, O. Characteristic alterations of quantity and quality of soil organic matter caused by forest fires in continental Mediterranean ecosystems: A solid-state 13C NMR study. Eur. J. Soil Sci. 2006, 57, 558–569. [Google Scholar] [CrossRef] [Green Version]
- Merino, A.; Fonturbel, M.T.; Fernández, C.; Chávez-Vergara, B.; GarcíaOliva, F.; Vega, J.A. Inferring changes in soil organic matter in post-wildfire soil burn severity levels in a temperate climate. Sci. Total Environ. 2018, 627, 622–632. [Google Scholar] [CrossRef]
- Pardini, G.; Gispert, M.; Dunjó, G. Relative influence of wildfire on soil properties and erosion processes in different Mediterranean environments in NE Spain. Sci. Total Environ. 2004, 328, 237–246. [Google Scholar] [CrossRef] [PubMed]
- Francos, M.; Úbeda, X.; Pereira, P. Impact of torrential rainfall and salvage logging on post-wildfire soil properties in NE Iberian Peninsula. Catena 2019, 177, 210–218. [Google Scholar] [CrossRef]
- Henig-Sever, N.; Eshel, A.; Ne’eman, G. pH and osmotic potential of pine ash as post-fire germination inhibitors. Physiol. Plant 1996, 96, 71–76. [Google Scholar] [CrossRef]
- Zornoza, R.; Guerrero, C.; Mataix-Solera, J.; Scow, K.M.; Arcenegui, V.; Mataix Beneyto, J. Near infrared spectroscopy for determination of various physical, chemical and biochemical properties in Mediterranean soils. Soil Biol. Biochem. 2008, 40, 1923–1930. [Google Scholar] [CrossRef] [Green Version]
- Arcenegui, V.; Guerrero, C.; Mataix-Solera, J.; Mataix-Beneyto, J.; Zornoza, R.; Morales, J.; Mayoral, A.M. The presence of ash as an interference factor in the estimation of the maximum temperature reached in burned soils using near-infrared spectroscopy (NIR). Catena 2008, 74, 177–184. [Google Scholar] [CrossRef]
- Chang, C.; Laird, D.A.; Mausbach, M.J.; Hurburgh, C.R., Jr. Near-infrared reflectance spectroscopy—Principal components regression analyses of soil properties. Soil Sci. Soc. Am. J. 2001, 65, 480–490. [Google Scholar] [CrossRef] [Green Version]
- Shepherd, K.D.; Walsh, M.G. Development of reflectance spectral libraries for characterisation of soil properties. Soil Sci. Soc. Am. J. 2002, 66, 988–998. [Google Scholar] [CrossRef]
- Islam, K.; Stingh, B.; McBratney, A. Simultaneous estimation of several soil properties by ultra-violet, visible, and near-infrared reflectance spectroscopy. Aust. J. Soil Res. 2003, 41, 1101–1114. [Google Scholar] [CrossRef]
- Miloš, B.; Bensa, A. Estimation of SOC content in anthropogenic soils from Flysch deposits using Vis-NIR spectroscopy. Agric. Conspec. Sci. 2018, 83, 149–153. [Google Scholar]
- Ben-Dor, E.; Inbar, Y.; Chen, Y. The reflectance spectra of organic matter in the visible near-infrared and short wave infrared region (400–2500 nm) during controlled decomposition process. Remote Sens. Environ. 1997, 61, 1–15. [Google Scholar] [CrossRef]
- McCoy, R.M. Field Methods in Remote Sensing; The Guilford Press: New York, NY, USA, 2005. [Google Scholar]
- Stevens, A.; Udelhoven, T.; Denis, A.; Tychon, B.; Lioy, R.; Hoffmann, L.; van Wesemael, B. Measuring soil organic carbon in croplands at regional scale using airborne imaging spectroscopy. Geoderma 2010, 158, 32–45. [Google Scholar] [CrossRef]
- Bašić, F. The Soils of Croatia; Springer: Dordrecht, The Netherlands, 2013. [Google Scholar]
- Daniel, K.W.; Tripathi, N.K.; Honda, K. Artificial neural network analysis of laboratory and in situ spectra for the estimation of macronutrients in soils of Lop Buri (Thailand). Aust. J. Soil Res. 2003, 41, 47–59. [Google Scholar] [CrossRef]
- Mouazen, A.M.; Maleki, M.R.; De Baerdemaeker, J.; Ramon, H. On-line measurement of some selected soil properties using a VIS–NIR sensor. Soil Till. Res. 2007, 93, 13–27. [Google Scholar] [CrossRef]
- Heydari, M.; Rostamy, A.; Najafi, F.; Dey, D.C. Effect of fire severity on physical and biochemical soil properties in Zagros oak (Quercus brantii Lindl.) forests in Iran. J. For. Res. 2017, 28, 95–104. [Google Scholar] [CrossRef]
- Šestak, I.; Mesić, M.; Zgorelec, Ž.; Perčin, A.; Stupnišek, I. Visible and near infrared reflectance spectroscopy for field-scale assessment of Stagnosols properties. Plant Soil Environ. 2018, 64, 276–282. [Google Scholar]
- Nanni, M.R.; Demattê, J.A.M. Spectral reflectance methodology in comparison to traditional soil analysis. Soil Sci. Soc. Am. J. 2006, 70, 393–407. [Google Scholar] [CrossRef]
- Kuang, B.; Tekin, Y.; Mouazen, A.M. Comparison between artificial neural network and partial least squares for on-line visible and near infrared spectroscopy measurement of soil organic carbon, pH and clay content. Soil Till. Res. 2015, 146, 243–252. [Google Scholar] [CrossRef]
- Viscarra Rossel, R.V.; Behrens, T. Using data mining to model and interpret soil diffuse reflectance spectra. Geoderma 2010, 158, 46–54. [Google Scholar] [CrossRef]
Publisher’s Note: MDPI stays neutral with regard to jurisdictional claims in published maps and institutional affiliations. |
© 2022 by the authors. Licensee MDPI, Basel, Switzerland. This article is an open access article distributed under the terms and conditions of the Creative Commons Attribution (CC BY) license (https://creativecommons.org/licenses/by/4.0/).