Abstract
The goal of viticulture in Greece, where it is one of the country’s briskest economic activities, is satisfying grape yields. Nevertheless, owing to the ongoing climate change, that goal is impeded by a major obstacle in the form of an insufficient period of chilling temperatures which are becoming briefer. Consequently, the shorter period of cold leads to poor budbreak which, in turn, results in reduced yields. In order to meet the chilling requirements that several plants (including the grapevine) require for bud dormancy release, agronomists have resorted to treatments with chemical regulators. This study aimed at identifying and quantifying during eco-dormancy the individual phenolic compounds, together with their possible variations, in the latent buds of the ‘Prime©’ and ‘Ralli’ table grape cultivars. The study induced chemical stress by means of four different solutions, at three discrete dates per year, for three consecutive years. Phenolics were analyzed via HPLC. Their quantitative analysis showed variations both between the varieties and between the samples of those varieties. The analysis indicated that the phenolic content continued progressing during the annual growth cycle. Higher rates of increase in the phenolic content were observed in the first three days following each application, which implies an immediate stress response mechanism. Strong positive correlations were detected between several polyphenols. Luteolin, despite registering a positive correlation with quercetin, resveratrol, o-coumaric, did not do so with the remaining polyphenols. The results confirmed that chemically-induced stress conditions affect the phenolics content. Moreover, depending on the date of application, significant changes appear in the variations of those phenolics.
1. Introduction
Polyphenols, a group of substances with a broad spectrum of physiological activities, are widespread in plants and are also known for their use in traditional medicine and contemporary medical systems [1]. Phenolic acids and their derivatives are carbon-based compounds and have been shown to play a role in the derived products’ tissue browning, flavor, and color traits [2]. An understanding of phenolic composition in fresh fruit; and of the factors that affect phenolic compounds are both critical in the design of products and conditions under which such products should be stored [3]. In view of the significance of the phenolic compounds, there have been many studies which undertook in the past the investigation into the phenolic acid compositions of various fruits, such as apples and pears [4,5]; Pyrus [6]; other pome and stone fruits [7]; Diospyros [8]; carrots [9]; and Prunus [10].
Phenolic compounds are active biological molecules which have one (or more) benzene rings with one (or more) hydroxyl functions [11]. At plant level, phenolic compounds contribute to development, cell multiplication, reproduction, differentiation, flowering, and lignification of a plant. Their concentration in plants depends on a number of genetic, physiological and environmental factors [12]. Phenolic compounds accumulate mainly in the cell membrane (lignin and some flavonoids) and in vacuoles where soluble phenolic compounds such as chlorogenic acid, anthocyanins, flavonols, and tannins are stored [13]. At the same time, substances such as phenolic compounds, amino acids (namely prolin), and the group of polyamins (PAs) group are known to be involved in the resistance response that many plant species, including the grapevine, exhibit against stress. Moreover, they all act as free radical scavengers [14].
The most important stage of a grapevine’s growth cycle is dormancy, whether in terms of endo-dormancy (dormancy of the latent buds), which is triggered endogenously; or eco-dormancy, which entails the dormancy of the vine itself [15]. In order for eco-dormancy to be triggered in the vineyard, a sharp drop in temperature is necessary. When cold and low temperatures give rise to challenging environmental conditions for vines during their annual cycle, plant growth slows down, followed by total arrest in autumn and winter. The vines then become dormant, a particular physiological condition that allows them to withstand climate adversities. However, regarding the installation of bud dormancy that takes place earlier during the growth cycle, the decreases in the photoperiod are considered one of the most significant factors among those that can induce that installation [16,17,18].
The removal of dormancy is also controlled by environmental conditions. With regard to grapevines, the latent buds acquire the ability to clog under the effect of low temperatures (0–10 °C). Thus, in temperate climates, cold remains the most effective way to break dormancy in woody species [19,20]. Due to climate change, the current duration of chilling temperatures requisite for bud dormancy release of several fruit plants, grapevines included, suffices no longer. Worse, the brevity of that requisite chilling period appears to be intensifying [21]. As a result, growers and agronomists have been increasingly resorting to treatments of such fruit plants with chemical and growth regulators in order to break the dormancy. Examples include chemicals, used commercially by many wine-producing countries, such as mineral oil, dinitro-O-cresol (DNOC), thiourea, calcium cyanamide, potassium cyanamide, hydrogen cyanamide, and garlic paste [22,23,24,25,26]. Additionally, calcium cyanamide and hydrogen cyanamide have been documented as being quite effective on grape bud dormancy release [22,27,28,29,30]. Hydrogen cyanamide is another chemical that has been used successfully to supplement the chilling requirement, significantly improving budbreak [31,32].
To try to comprehend this resting phase of the grapevine, several authors have studied the main biochemical changes the latent buds undergo. In this phenomenon of dormancy, some researchers have made special mention of the involvement of hydrogen peroxide (H2O2) [33]; and of phenolic compounds [34,35,36]. The evolution of levels in phenolic compounds of latent buds during their annual growth cycle seems to be related to that of hydrogen peroxide (H2O2). This hypothesis suggests that the cold treatment leads to higher CAT (catalase) and APX (ascorbate peroxidase) activities in the leaves, since phenolic compounds are essentially an anti-stress mechanism [37].
However, so far, no studies have been carried out on the individual phenolic compounds in the latent buds of the grapevine during eco-dormancy and, more importantly, under chemically-induced stress conditions.
Thus, the purpose of the present study was (a) to examine the premise that oxidative stress is caused by applications with hydrogen cyanamide which advance budbreak; and (b) to monitor, for the first time during such experiments and during the annual vegetative cycle, the variations in the levels of 13 individual phenolic compounds of the latent buds in 2 grapevine varieties ‘Prime©’ and ‘Ralli’ (Vitis vinifera L.), also in relation to the different time of applications and the two different chemical substances used (Theocopper & Erger), for three consecutive years.
2. Results and Discussion
There were 13 phenolic compounds that were identified according to their respective retention time: (1) procyanidin B1; (2) procyanidin B2; (3) catechin; (4) chlorogenic acid; (5) vanillic acid; (6) epicatechin; (7) piceid; (8) rutin; (9) o-coumaric; (10) resveratrol; (11) ε-viniferin; (12) quercetin; and (13) luteolin. Note: the phenolic content is expressed as μg equivalent per g of dry weight (μg g−1 dw).
The content of phenolic compounds in ‘Prime©’ and ‘Ralli’, in tandem with (i) the year of the experiment took place; and (ii) the month during which the applications were performed, is presented in Table 1. The content of all individual phenolic compounds in both varieties under study registered its highest point after the February application, the only exception being vanillic acid and epicatechin whose content peaked in January (Table 1). With regard to the year during which the experiment took place (2016–2018), the results showed that it was in 2016, the first year of the experiment, that the phenolics procyanidin B1, catechin, vanillic acid, epicatechin, piceid, rutin, and ε-viniferin exhibited their highest concentration (Table 1).

Table 1.
Variation of individual phenolic compounds in the latent buds at eco-dormancy in relation to the year and month the applications were carried out.
Year 2016 was characterized as the one with the lowest winter temperatures compared to years 2017 and 2018, as it can be seen in Figure 1. As a result, the level of phenolic compounds was higher which can be associated with the environmental stress that the latent buds underwent because of low temperatures. Among the three months in which data was collected, the highest phenolic content is found in the month of February, which can be explained by the longer exposure of the buds to the low winter temperatures (Table 1).
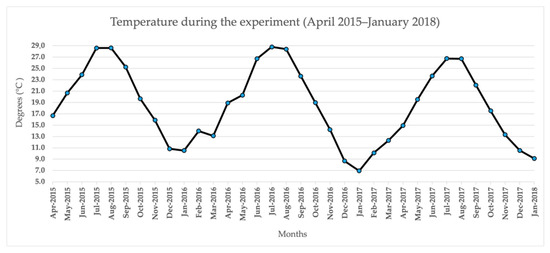
Figure 1.
Climatic parameter of temperature during the experiment (April 2015 to January 2018).
As to the phenolic content in ‘Prime©’ and ‘Ralli’ in relation to (i) each studied variety; and (ii) the lapse of days between applications and cane sampling, it is presented in Table 2.
Table 2.
Variation of individual phenolic content in relation to the variety under study and the lapse of days between applications and cane sampling.
When compared to ‘Ralli’, ‘Prime©’ is characterized by a greater concentration in almost all of its phenolics, with the exception of resveratrol and luteolin. Both ‘Prime©’ and ‘Ralli’ are early maturation varieties, but ‘Prime©’ does sprout even earlier than ‘Ralli’. Thus, it can be surmised that ‘Prime©’ is more sensitive to stress than ‘Ralli’ (Table 2), and this could be the reason why there is an even earlier budbreak in ‘Prime©’ compared to ‘Ralli’.
The distribution (%) of analyzed phenolic compounds within the studied varieties in relation to the lapse of days between applications and cane sampling is presented in Table 2. The results showed that the highest concentrations were observed in the samplings that took place on the 15-day and 30-day mark following the applications. The higher rate of increase in the phenolic compounds under study is observed between 0 and 3 days, which suggests that a quick stress response mechanism takes place.
Usually, the total amounts of phenolic compounds increase in early July and, by the end of that phase (pre-dormancy), those amounts start decreasing, coinciding with the start of the endo-dormancy phase [38]. During that phase, the amounts of phenolic compounds gradually decrease, while the amount of phenolic compounds in latent buds dramatically decreases within a short period of time which coincides with the end of the endo-dormancy phase when temperatures remain below 10 °C for at least 7 successive days. From that point on and until budburst, their total amounts undergo a moderate increase which corresponds to the buds’ dehydration phase [38].
The phenolic content, in relation to the treatments applied to the ‘Prime©’ variety, is presented in Table 3, while that of the ‘Ralli’ variety, again in relation to the treatments applied, is presented in Table 4. Treatments with higher concentrations of the chemical substances which were used in the experiment brought about a greater increase in phenolic compounds and therefore, a higher level of chemical stress.
Table 3.
Variation of individual phenolic content in relation to the treatment applied on the buds of the ‘Prime©’ variety.
Table 4.
Variation of individual phenolic content in relation to the treatment applied on the buds of the ‘Ralli’ variety.
Compared to the control treatment, all other treatments produced an increase in the content of phenolic compounds (Table 3 and Table 4). In all likelihood, the evolution of phenolic compounds in the latent buds of the vine during the plant’s annual growth cycle appears to be associated with different development phases [15] and with abiotic stress as applied by the environment. In fact, the accumulation of those compounds during the phase of dormancy could be linked to the decrease in temperature and the shorter length of daylight. Such results have also been suggested by many researchers [35,39] who have shown that certain phenolics also play a role in the plant’s tolerance to abiotic stress and argue that the temperature, as a phenolic metabolism expression regulator, induces an accumulation of anthocyanins. As such, that regulation may intervene at the Phenylalanine (PAL) level of activity [40].
It seems that flavanols (catechin, epicatechin, procyanidin B1, procyanidin B2) appear to show a greater increase due to the chemically induced stress. Therefore, it can be suggested that these compounds are more involved in the antioxidant mechanism of the latent buds of the grapevine.
The accumulation of phenolic compounds seems to be associated with low temperatures, such as those that characterize the eco-dormancy phase when temperatures remain below 10 °C for a period of 10 days [15]. Such a hypothesis seems to be in agreement with the findings submitted by other researchers who showed that the cold caused an accumulation of phenolic compounds in Betunia hybrida leaves [41]. It has also been shown that the cold stimulates the phenolic compounds free gallic acid and catechin in the seeds of Vitis riparia [42].
According to the authors cited above, once those phenolic compounds metabolize, they are transferred to other parts of the plant to meet the plant’s developmental requirements. Results such as those above were also yielded by a study which reported that levels of quercetin in the grapevine variety Carignan increase during the phase of dormancy and decrease during the phase of budbreak [36]. Be that as it may, the results of the present experiment did not confirm those last findings since, in the case of the present study, quercetin increased during eco-dormancy and spiked once the treatments were affected (Table 4).
As mentioned earlier, the variations in phenolic compounds of latent buds during their annual growth cycle seems to be related to hydrogen peroxide [37]. However, it appears that a cinnamic acid pre-treatment, in tandem with a cold treatment, also enhance antioxidant activities. Proline and total phenolics content increased under chilling stress [43]. Acclimation to low temperature has been shown to increase concentrations of phenolic compounds in several fruit tree species, the grapevine [38,44] and pistachio [45] ones included.
All authors cited above showed that, in association with cinnamic acid, cold increases H2O2 levels. That result seems to be in agreement with several studies dealing with the involvement of the H2O2 in response to stress brought about by the abiotic environment [46]: it is quite likely that H2O2 acts as a messenger triggering a modification of ionic flux or a production of secondary messengers such as salicylic acid.
Principal Component Analysis (PCA)
PCA transforms the original data set, all measurements included, into a smaller set of uncorrelated new variables (Principal Components, where eigenvalues are >1). When performed on the phenolics studied, the PCA produced 2 components, in declining order of importance, which accounted for and explained 63.9% of the total variability between and among the different phenolics (Table 5).
Table 5.
Principal components (PC) of the phenolics evaluated.
Phenolic compounds are presented in Figure 2 as a function of both the first and second principal components (PC). The first principal component (PC1) accounted for 48.2% of the total variability and was defined by phenolic compounds catechin, chlorogenic acid, epicatechin, o-coumaric acid, piceid, procyanidin B1, procyanidin B2, rutin, vanillic acid, and ε-viniferin. The fact that all compounds were located at a distance from the axis origin, suggests that they were well represented by PC1 and were placed close together on the positive side of the PC1 to indicate a strong, positive correlation. The second principal component (PC2) explained another 15.7% of the total variability and was defined by luteolin, quercetin, and resveratrol which were also placed close together on the positive side of PC2, to indicate that they positively correlated with one another. In contrast, luteolin did not correlate with ε-viniferin, catechin, nor did it do so with any of the remaining polyphenols.
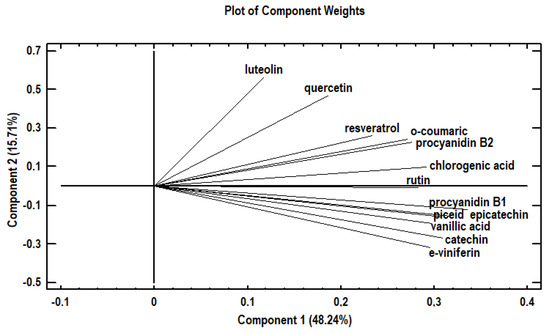
Figure 2.
Principal Component Analysis: plot of the polyphenols in relation to the first two principal components (PC1 & PC2).
The first component contains the measurements gauging catechin, chlorogenic acid, epicatechin, o-coumaric acid, piceid, procyanidin B1, procyanidin B2, rutin, vanillic acid, and ε-viniferin. As to the second component, it gauges quercetin, resveratrol, and luteolin. According to the PCA analysis for the purposes of the present study and as shown in Figure 2, luteolin increased in contrast to catechin and ε-viniferin.
3. Materials and Methods
3.1. Plant Material and Experimental Design
‘Prime©’ is a white table grape variety and ‘Ralli’ is a red table grape variety (Vitis vinifera L.). Both are regarded by viticulturists worldwide as two of the grapevine varieties with the earliest maturation. The present study’s researchers located 7-year old vines of these two varieties in a vineyard in Corinth (alt: 10 m, gradient: 2%), northeastern Peloponnese, Greece. The selected vines (already grafted on rootstock 1103 Paulsen), were bilaterally cordon-trained (bilateral Royat) at 2.2 m × 1.2 m intervals, and cane-pruned to 10-node canes per arm. Each vine consisted of four arms and, therefore, each vine comprised four canes in total. The usual viticultural techniques entailed: fertilization using 11-15-15 NPK at a dose of 250 g/vine; canopy management techniques (shoot thinning, topping; girdling); and irrigation. All studied vines had been grown in the same area and under the same climate and soil conditions. The meteorological data regarding the average air temperature (°C) was collected from the automatic weather station located at Corinth (Elev. 43 ft, 37.93° N, 22.92° E) (Figure 1).
3.2. Treatments
The experiment lasted three consecutive years and, more specifically, during the 2016–2018 cultivation seasons. Four different solutions (Theocopper & Theocal, Dormex, Erger, and garlic extract), known for their ability to advance budbreak, were applied to and evaluated for two table grape varieties, ‘Prime©’ and ‘Ralli’. Eight preparations were applied to each variety on three different dates (15 December, 15 January, and 15 February), in three consecutive years, bringing the total of treatments to 144. In brief, the two varieties were treated to eight applications, on three different dates, for three consecutive years (2 × 8 × 3 × 3 = 144). The groups of 10 vine canes selected were chosen not only because of their morphology but also because they were the most representative of each variety. For the needs of the experiment, the research made use of a Randomized Complete Block Design with three replications per treatment. Each group of 10 vine canes constituted one replication.
The 8 applications were affected using the following mixtures:
- i.
- 10 mL Theocopper and 1 g Theocal per Liter [TA];
- ii.
- 20 mL Theocopper and 1 g Theocal per Liter [TB];
- iii.
- 25 mL Dormex® per Liter [DA];
- iv.
- 50 mL Dormex® per Liter [DB];
- v.
- 35 mL Erger and 80 mL Active Erger per Liter [EA];
- vi.
- 70 mL Erger and 160 mL Active Erger per Liter [EB];
- vii.
- extract from 300 g (FW-fresh weight) garlic evaporated and then diluted in 1 L water [GA]; and
- viii.
- distilled water (control treatment) [Control].
Preparations were applied using a knapsack sprayer. The synthesis of the preparations was the following: Theocopper: 10% sugars, 10% amino acids, 12% urea, 1.4% potassium in organic form, 12% nitrogen in organic form, and 3.5% organic matter; Theocal: 30% calcium, 35% organic matter with a pH of 7.1. Dormex®: H2CN2 490 g L−1 (Basf Co.,Ludwigshafen/Rhein, Germany ).
As to the garlic extract, that was prepared in the following manner: 300 g of fresh and peeled cloves of garlic (Allium sativum L.) were ground in a blender. The ensuing mash was blended again with 1 L distilled water, filtered, and raised to 2 L by the addition of distilled water to obtain a final concentration of 15% garlic extract [24].
3.3. Sampling
The canes were sampled on day 0, i.e., before the first application, and then on day 3, 6, 9, 15, and 30 following each application. As stated earlier, the applications took place on 3 different dates (15 December; 15 January; 15 February). Starting at the base of the canes, the sprayings focused on the first 10 latent buds. The samples were randomly collected from the entire vineyard with a view to making sampling more homogeneous and representative of the space the samples had been grown in. Once collected, the samples were frozen in liquid nitrogen and then lyophilized. Lastly, buds were homogenized in liquid nitrogen, using a pre-chilled mortar and pestle for the extraction.
3.4. Reagents and Chemicals
The various phenolic compounds analyzed were identified according to their order of elution and the retention times of the pure compounds. Non-colored phenolics were purchased from a number of different sources. More specifically, catechin, vanillic acid, chlorogenic acid, epicatechin, o-coumaric acid, and rutin were procured from Sigma, St. Louis, MO, USA. Luteolin, procyanidin B1, procyanidin B2, ε-viniferin, quercetin, trans-resveratrol, and piceid were purchased from Extrasynthese, Gemay, France.
3.5. Extraction of Phenolic Compounds
The procedure followed in order to extract the phenolic compounds from each and every sample was the following: 5 mL of 70% v/v methanol acidified with 1% formic acid (v/v) were added to 200 mg of dried tissue which were then weighed on a precision scale (KERN 410). The mixture was shaken and placed in a water bath for 60 min at a temperature of 40 °C, and was centrifuged at 4000 rpm for 6 min. Once the supernatants (5 mL) were collected, the same extraction process was repeated twice more for the remaining phenolic compounds, resulting in a total extraction volume of 15 mL 70% v/v methanol. All fractions were combined. Lastly, the supernatants were stored at a temperature below 80 °C until the time of the analysis.
3.6. Analysis by HPLC
In order to measure individual phenolic compounds with HPLC, liquid extraction was carried out: 2 mL of the 70% v/v methanol extract were evaporated with a sample concentrator at room temperature under a stream of nitrogen gas. By means of that method, the tubes held nothing but the aqueous residue containing the phenolic compounds. Next, 1 mL water (HPLC grade) was added to that residue, followed by vortex. Then, 2 mL of ethyl acetate were added to the mixture followed by vortex for 1 minute. The following step entailed transferring the supernatant ethyl acetate to a new tube, adding 2 mL of ethyl acetate to the pellet, followed by vortex for 1 minute. The new supernatant ethyl acetate was transferred and mixed with the previous one. The combined ethyl acetate supernatant was evaporated with a sample concentrator at room temperature under a stream of nitrogen gas and the pellet was dissolved in 1 mL of methanol (HPLC grade). Lastly, prior to the HPLC analysis, the extract was filtered through a 0.22 μm membrane.
Monomeric and dimeric phenols [(+)-catechin, (−)-epicatechin, procyanidins B1 and B2, vanillic acid, o-coumaric, chlorogenic acid, piceid, rutin, trans-resveratrol, ε-viniferin, quercetin, and luteolin] were determined by the HPLC-DAD system (Shimadzu Nexera).
For the separation of monomeric and dimeric phenolic compounds, the study employed a 250 × 4.6 mm ID, 5 μm, Waters × select C18 column operating at 25 °C. The eluent comprised (a) H2O/C2H4O2 (99.3:0.7); and (b) CH3OH (100). The flow rate stood at 0.5 mL min−1. The linear gradient program used for the elution was the one described in a previous study [47].
3.7. Data Analysis
The experiment was designed and implemented following the principles of the Randomized Complete Block Design. Data were analyzed using the Statgraphics Centurion statistical package (Statgraphics Technologies, Inc., Τhe Plains, VA, USA, version 17) and are presented as mean ± SE (Standard Error) of the 3 replications. As mentioned earlier, each group of 10 grapevine canes constituted 1 replication.
A repeated measures General Linear Model (GLM) was applied to the data (phenolic compounds) considering the sampling time as repeated measure, with fixed effects of the treatment (control, TA, TB, DA, DB, EA, EB, GA), the grapevine variety (Prime©, Ralli), the year of the experiment (2016, 2017, 2018), the dates when the applications were performed (15 December, 15 January, and 15 February), and the number of days that had elapsed between applications and sampling (0, 3, 6, 9, 15, 30 days). Post hoc analyses were performed using Tukey’s HSD test. The Kolmogorov-Smirnov test revealed that all variables followed normal distribution. Moreover, in order to reduce the dimensionality of the data and investigate the relationships between and among phenolic compounds, pooled data (all phenolic compounds) were subjected to principal component analysis (PCA). Results and their detailed description are shown in the present study’s tables and diagram (plot). The significance level for all tests was set at 5%.
4. Conclusions
The results of the present study showed that chemically-induced stress conditions, such as the ones brought about by the application of chemical regulators which affect bud dormancy release and advance budbreak, also affect the content of phenolic compounds of the latent buds. Moreover, based on the experimental design that was implemented through (a) the different applications taking place on specific days and (b) the cane sampling taking place after a specific number of days had elapsed, the results confirmed, for the first time in such studies, the variations in the levels of the phenolic compounds that were identified and quantified. These variations may be very well associated with the changes inside the latent buds as the buds gradually progress from the buds’ dormancy release towards budbreak. Taking into consideration the fact that phenolic compounds are essentially involved in the resistance response to chilling stress, the variations in their levels constitute a first indicator of how much stress the latent buds actually undergo. Based on the results of the present study, and the fact that the higher rates of increase in the concentrations of the phenolic compounds were observed between 0 and 3 days, the stress response mechanism of the latent buds which leads to the production of phenolic compounds can be characterized as quite immediate.
Author Contributions
Conceptualization, I.D. and K.B.; Data curation, I.D. and K.S.; Formal analysis, I.D. and K.S.; Methodology, I.D. and M.S.; Supervision, M.S. and K.B.; Validation, M.S. and K.B.; Writing—original draft, I.D.; Writing—review & editing, I.D., M.S. and K.B. All authors have read and agreed to the published version of the manuscript.
Funding
This research received no external funding.
Institutional Review Board Statement
Not applicable.
Informed Consent Statement
Not applicable.
Data Availability Statement
The data presented in this study are available on request from the corresponding author. The data are not publicly available due to being part of ongoing doctoral thesis.
Conflicts of Interest
The authors declare no conflict of interest.
References
- Tibullo, D.; Caporarello, N.; Giallongo, C.; Anfuso, C.D.; Genovese, C.; Arlotta, C.; Puglisi, F.; Parrinello, N.L.; Bramanti, V.; Romano, A.; et al. Antiproliferative and antiangiogenic effects of Punica granatum juice (PGJ) in Multiple Myeloma (MM). Nutrients 2016, 8, 611. [Google Scholar] [CrossRef]
- Ho, C.T.; Lee, C.Y.; Huang, M.T. Phenolic Compounds in Food and Their Effects on Health; Analysis, Occurrence, and Chemistry, ACS Symposium Series 506; American Chemical Society: Washington, DC, USA, 1992. [Google Scholar]
- Oleszek, W.; Amiot, M.J.; Aubert, S.Y. Identification of some phenolics in pear fruit. J. Agric. Food Chem. 1994, 42, 1261–1265. [Google Scholar] [CrossRef]
- Blankenship, S.M.; Richardson, D.G. Changes in phenolic acids and external ethylene during long-term cold storage of pears. J. Am. Soc. Hortic. Sci. 1985, 110, 336–339. [Google Scholar]
- Amiot, M.J.; Aubert, S.; Nicolas, J. Phenolic composition and browning susceptibility of various apple and pear cultivars at maturity and postharvest. Acta Hortic. 1993, 343, 67–69. [Google Scholar] [CrossRef]
- Challice, J.C.; Williams, A.H. Phenolic compounds of genus Pyrus–II: A chemotaxonomic survey. Phytochemistry 1968, 7, 1781. [Google Scholar] [CrossRef]
- Herrmann, K. Occurrence and content of hydroxycinnamic and hydroxybenzoic acid compounds in foods. Crit. Rev. Food Sci. Nutr. 1989, 28, 315–347. [Google Scholar] [CrossRef] [PubMed]
- Ayaz, F.A.; Kadioglu, A.; Reunanen, M. Changes in phenolic acid contents of Diospyros lotus L. during fruit development. J. Agric. Food Chem. 1997, 45, 2539–2541. [Google Scholar] [CrossRef]
- Babic, I.; Amiot, M.J.; Nguyen-The, C.; Aubert, S. Changes in phenolic content in fresh ready-to-use shredded carrots during storage. J. Food Sci. 1993, 58, 351–356. [Google Scholar] [CrossRef]
- Nortje, B.K.; Koeppen, B.H. The flavonol glycosides in the fruit of Prunus communis L. cultivar Bon Chrétien. Biochem. J. 1965, 97, 209–213. [Google Scholar] [CrossRef] [PubMed]
- Manach, C.; Scalbert, A.; Morand, C.; Rémésy, C.; Jiménez, L. Polyphenols: Food sources and bioavailability. Am. J. Clin. Nutr. 2004, 79, 727–747. [Google Scholar] [CrossRef]
- Balasundram, N.; Sundram, K.; Samman, S. Phenolic compounds in plants and agri-industrial by products: Antioxidant activity, occurrence, and potential uses. Food Chem. 2007, 99, 191–203. [Google Scholar] [CrossRef]
- Peer, W.A.; Brown, D.E.; Tague, B.W.; Muday, G.K.; Taiz, L.; Murphy, A.S. Flavonoid accumulation patterns of transparent testa mutants of arabidopsis. Plant Physiol. 2001, 126, 536–548. [Google Scholar] [CrossRef] [PubMed]
- Bouchereau, A.; Aziz, A.; Larher, F.; Martin-Tanguy, J. Polyamines and environmental challenges: Recent development. Plant Sci. 1999, 140, 103–125. [Google Scholar] [CrossRef]
- Pouget, R. Recherches physiologiques sur le repos végétatif de la vigne (Vitis vinifera L.): La dormance des bourgeons et le mécanisme de sa disparition. Ann. Amelior. Plantes 1963, 13, 247. [Google Scholar]
- Febvre, E. Contribution à L’étude du Développement de Boutures de Saule (Salix babylonica L.) Cultivées In Vitro. Influence de Différentes Températures de Culture; Induction d’Une Dormance et Conséquences Morphogènes. Ph.D. Thesis, Université de Clermont-Ferrand-2, Clemont Ferrand, France, 1981. [Google Scholar]
- Olsen, J.E. Mechanisms of dormancy regulation. Acta Hortic. 2006, 727, 157–165. [Google Scholar] [CrossRef]
- Daskalakis, I.; Biniari, K. A new measurement model to estimate the intensity of acrotony on the latent buds of grapevine canes (Vitis vinifera L.). Not. Bot. Horti Agrobot. 2019, 47, 3. [Google Scholar] [CrossRef]
- Nigond, J. Recherches sur la Dormance des Bourgeons de la Vigne. Ph.D. Thesis, Université de Paris, Paris, France, 1967. [Google Scholar]
- Champagnat, P. Quelques réflexions sur la dormance des bourgeons des végétaux ligneux. Physiol. Vég. 1983, 21, 607–618. [Google Scholar]
- Marx, W.; Haunschild, R.; Bornmann, L. Climate change and viticulture—A quantitative analysis of a highly dynamic research field. Vitis 2017, 56, 35–43. [Google Scholar]
- Iwasaki, K. Effect of bud scale removal, calcium cyanamide, GA3 and ethephon on budbreak of ‘Muscat of Alexandria’ grape (Vitis vinifera L.). J. Jpn. Soc. Hortic. Sci. 1980, 48, 395–398. [Google Scholar] [CrossRef]
- Zelleke, A.; Kliewer, W.M. The effects of hydrogen cyanamide on enhancing the time and amount of budbreak in young grape vineyards. Am. J. Enol. Vitic. 1989, 40, 47–51. [Google Scholar]
- Kubota, N.; Miyamuki, M. Breaking bud dormancy in grapevines with garlic paste. J. Am. Soc. Hortic. Sci. 1992, 7, 898–901. [Google Scholar] [CrossRef]
- Mizutani, F.; Shinohara, K.; Amano, S.; Hino, A.; Kadoya, K.; Akiyoshi, H.; Watanabe, J. Effect of KCN and SHAM on budbreak and rooting of single eye cuttings of ‘Kyoho’ grape. Bull. Exp. Farm Coll. Agric. Ehime Univ. 1994, 15, 1–5. [Google Scholar]
- Botelho, R.V.; Pavanello, A.P.; Pires, E.J.P.; Terra, M.M.; Muller, M.M.L. Effects of chilling and garlic extract on bud dormancy release in Cabernet Sauvignon grapevine cuttings. Am. J. Enol. Vitic. 2007, 58, 402–404. [Google Scholar]
- Weaver, R.J.; McCune, S.B.; Coombe, B.G. Effects of various chemicals and treatments on rest period of grape buds. Am. J. Enol. Vitic. 1961, 12, 131–142. [Google Scholar]
- Shulman, Y.; Nir, G.; Fanberstein, L.; Lavee, S. The effect of cyanamide on the release from dormancy of grapevine buds. Sci. Hortic. 1983, 19, 97–104. [Google Scholar] [CrossRef]
- Kuroi, I. Effect of calcium cyanamide and cyanamide on budbreak of ‘Kyoho’ grape. J. Jpn. Soc. Hortic. Sci. 1985, 54, 301–306. [Google Scholar] [CrossRef][Green Version]
- Lin, C.H.; Wang, T.Y. Enhancement of bud sprouting in grape single bud cuttings by cyanamide. Am. J. Enol. Vitic. 1985, 36, 15–17. [Google Scholar]
- Dokoozlian, N.K.; Williams, L.E.; Neja, R.A. Chilling exposure and hydrogen cyanamide interact in breaking dormancy in grape buds. Hortic. Sci. 1995, 30, 1244–1247. [Google Scholar] [CrossRef]
- Carreno, J.; Faraj, S.; Martinez, A. The effects of hydrogen cyanamide on budburst and fruit maturity of Thompson Seedless grapevine. J. Hortic. Sci. Biotech. 1999, 74, 426–429. [Google Scholar] [CrossRef]
- Lavee, S.; May, P. Dormancy of grapevine buds–facts and speculation. Aust. J. Grape Wine Res. 1997, 3, 31–46. [Google Scholar] [CrossRef]
- Nagar, P.K.; Sood, S. Changes in endogenous abscisic acid and phenols during winter dormancy in tea (Camellia sinensis L. O. Kuntze). Acta Physiol. Plant. 1996, 18, 33–38. [Google Scholar]
- Macheix, J.J.; Fleuriet, A.; Jay-Allemand, C. Les Composés Phénoliques des Végétaux: Un Exemple de Métabolites Secondaires d’Importance Economique; Presses Polytechniques Universitaires Romandes: Lausanne, Switzerland, 2005. [Google Scholar]
- Zohra, K.D.; Asma, Z.; Kamelm, M.; Helmi, H.; Béchir, E. Changes of phenolic compounds in Carignan merithallus (Vitis vinifera L.) during bud dormancy and end of dormancy phase: Correlation with rhizogenesis. Agric. Sci. 2011, 2, 498–504. [Google Scholar] [CrossRef]
- Li, Q.; Yu, B.; Gao, Y.; Dai, A.H.; Bai, J.G. Cinnamic acid pretreatment mitigates chilling stress of cucumber leaves through altering antioxidant enzyme activity. J. Plant Physiol. 2011, 168, 927–934. [Google Scholar] [CrossRef]
- Said, Q.; Ez-zohra, I.F.; Mohamed, F.; Tayeb, K. Changes in levels of hydrogen peroxide and phenolic compounds in grapevine latent buds during the annual cycle. Int. J. Sci. Res. Public 2014, 4, 1–5. [Google Scholar]
- Wahid, A.; Ghazanfar, A. Possible involvement of some secondary metabolites in salt tolerance of sugarcane. J. Plant Physiol. 2006, 163, 723–730. [Google Scholar] [CrossRef] [PubMed]
- Macheix, J.J.; Fleuriet, A.; Billot, J. Fruit Phenolics; CRC Press, Inc.: Boca Raton, FL, USA, 1990. [Google Scholar]
- Pennycooke, J.C.; Cox, S.; Stushnoff, C. Relationship of cold acclimation, total phenolic content and antioxidant capacity with chilling tolerance in petunia (Petunia × hybrida). Environ. Exp. Bot. 2005, 53, 225–232. [Google Scholar] [CrossRef]
- Wróbel, M.; Karama, M.; Amarowicz, R.; Frczek, E.; Weidner, S. Metabolism of phenolic compounds in Vitis riparia seeds during stratification and during germination under optimal and low temperature stress conditions. Acta Physiol. Plant. 2005, 27, 313–320. [Google Scholar] [CrossRef]
- Shima, R.; Ghasem, S.; Mehdi, G.; Mansour, G.; Ehsan, M.; Rouhollah, K. Effect of gradual and shock chilling stress on abscisic acid, soluble sugars and antioxidant enzymes changes in ‘Sultana’ grapevine. Iran. J. Plant Physiol. 2017, 7, 2211–2224. [Google Scholar]
- Karimi, R.; Ershadi, A. Role of exogenous abscisic acid in adapting of ‘Sultana’ grapevine to low temperature stress. Acta Physiol. Plant. 2015, 37, 151. [Google Scholar] [CrossRef]
- Pakkish, Z.; Rahemi, M.; Baghizadeh, A. Seasonal changes of peroxidase, polyphenol oxidase enzyme activity and phenol content during and after rest in pistachio (Pistacia vera L.) flower buds. World Appl. Sci. J. 2009, 6, 1193–1199. [Google Scholar]
- Ashraf, M.; Harris, P.J.C. Potential biochemical indicators of salinity tolerance in plants. Plant Sci. 2004, 166, 3–16. [Google Scholar] [CrossRef]
- Biniari, K.; Xenaki, M.; Daskalakis, I.; Rusjan, D.; Bouza, D.; Stavrakaki, M. Polyphenolic compounds and antioxidants of skin and berry grapes of Greek Vitis vinifera cultivars in relation to climate conditions. Food Chem. 2020, 307, 125518. [Google Scholar] [CrossRef] [PubMed]
Publisher’s Note: MDPI stays neutral with regard to jurisdictional claims in published maps and institutional affiliations. |
© 2021 by the authors. Licensee MDPI, Basel, Switzerland. This article is an open access article distributed under the terms and conditions of the Creative Commons Attribution (CC BY) license (https://creativecommons.org/licenses/by/4.0/).