Article

Physiological and Morphological Responses of Cassava Genotypes to Fertilization Regimes in Chromi-Haplic Acrisols Soils

1
Institute of Horticultural Production Systems, Leibniz University Hannover, Herrenhäuser Str. 2, D-30419 Hannover, Germany
2
Department of Plant Sciences, School of Agricultural Sciences, University of Zambia, Lusaka P.O. Box 32379, Zambia
3
Seed Control and Certification Institute, Chilanga, Lusaka P.O. Box 350199, Zambia
4
Institute for Environmental Economics and World Trade, Leibniz University of Hannover, Königsworther Platz 1, D-30167 Hannover, Germany
5
Zambia Agriculture Research Institute, Root and Tuber Crops, Mansa P.O. Box 710129, Zambia
6
Department of Soil Sciences, School of Agricultural Sciences, University of Zambia, Lusaka P.O. Box 32379, Zambia
*
Author to whom correspondence should be addressed.
Agronomy 2021, 11(9), 1757; https://doi.org/10.3390/agronomy11091757
Submission received: 21 June 2021 / Revised: 4 August 2021 / Accepted: 9 August 2021 / Published: 31 August 2021
(This article belongs to the Section Innovative Cropping Systems)

Abstract

:
The objective of this study was to evaluate the performances of three cassava genotypes on yield, physiology and morphological traits under different fertilization regimes. A field experiment was conducted in a split-plot design for two consecutive seasons in the Mansa district of the Luapula Province of Northern Zambia in the highly weathered Chromi-haplic Acrisol soils. Four fertilization regimes, control-M3, lime-M1, NPK fertilizer-M4 and NPK fertilizer + lime-M2 were the main plots, while three varieties (Mweru-V1, Bangweulu-V2 and Katobamputa (local)-V3) were subplots. Periodic measurements of leaf area index, light interception, yield and yield components from 75 days after planting (DAP) up to 410 DAP and daily weather measurements of data were recorded. Fertilization significantly increased the radiation use efficiency (RUE) and light extinction coefficient (K) in two seasons compared to the control. Significant fertilization regimes and varietal effects were observed for seasonal LAI, stem yield, root yield, biomass, harvest index (HI), tuber number, root diameter, plant height and SPAD (chlorophyll index). A significant year’s effects on root yield, yield components and physiological performances were observed while significant fertilization × variety interaction was observed on seasonal LAI, tuber number, root diameter, plant height and SPAD. Significant fertilization × year interaction effects were observed on root yield, yield components and physiological performances. Variety × year interaction was significant for seasonal LAI, stem yield, harvest index and plant height and no three-way interactions were observed on all the traits. NPK fertilizer + lime and NPK fertilizer treatments may be adopted to increase the response of cassava varietal yield, physiology and morphological traits in low soil nutrient conditions under high rain-fed conditions.

1. Introduction

Yield differences between attainable yields and farmers’ actual yields are huge for cassava in Zambia [1]. Smallholder yields range to 6 ton/ha, while the potential yield in Zambia is 20–25 ton/ha. A major limitation for cassava productivity is inherently low soil fertility and continuous monocropping of cassava without fertilization [2]. Cassava, or manioc (Manihot esculenta Crantz), is a low input crop with the ability to yield well in adverse environments with low fertility and acidic soils where other crops failed [3,4]. The northern part of Zambia is characterized by highly weathered, leached soils with extreme acidity where crop production is dominated by cassava [5]. Cassava yield is limited by the availability of nitrogen (N) phosphorus (P) and potassium (K). Recent studies report that a sufficient supply of potassium (K) and nitrogen (N) is critical for yield stability and productivity [6]. Availability of K is critical for cassava bulking and substantially limits cassava root yield if the crop is repeatedly grown without adequate fertilization due to the large export of K in the harvested tubers [7]. Under a monocropping system, P supply is the main limitation to cassava productivity rather than K in the first cycle (first year) of cassava crop production [4]. In addition, low organic matter may also limit nitrogen, thus affecting plant canopy development for cassava [4].
Mineral fertilizer use in cassava production is a common practice in Latin America and Asia compared to Africa where there is little or no use of fertilizer [8]. This belief of no fertilizer use could be associated with the ability of cassava to yield better in poor soils where other crops fail completely. Recent findings, however, show that such an assertion provides an opportunity for increasing cassava yields under smallholder farming systems if the soil fertility status is improved [9]. An integrated soil fertility management (ISFM) is critical to cassava yield improvement through the combined use of improved germplasm/varieties, optimized use of fertilizers and organic amendments once adapted to smallholder farmers’ local conditions in Sub-Saharan Africa [10]. Studies have also shown that additional biological exhaustion (i.e., depression of soil life) causes a decline in cassava yields despite mineral fertilizer application [11]. Therefore, cassava intensification requires an integrated soil fertility management (ISFM) through the use of a judicious combination of agricultural inputs, especially fertilizers and varieties, to derive the best cost-reflective option for smallholder farmers [12].
Cassava is one of Zambia’s food security crops and is ranked second to maize as the most cultivated crop [1,13,14,15,16,17]. Recently, cassava has received more attention due to its drought resilience when maize and other cereals have failed [15,16]. Cassava production in Africa is mainly dominated by smallholder farmers without the use of external inputs such as improved cultivars and fertilization since they perceive cassava to grow in nutrient-depleted soils [18]. In addition, aspects of yield information are not well documented about the potential of varietal responses and cassava adaptation to fertilization under the Zambian Agroecological Zone III (AEZ). This partly accounts for the large yield gap between actual farm yields versus cassava potential yield [19,20,21]. At no doubt, fertilizer application increases yields as cassava is known to be a heavy miner of potassium (K) but also requires nitrogen, phosphorous and micronutrients for yield sustainability [4,22,23].
Application of NPK fertilizer in cassava should be related to the crop’s physiological and morphological effects, since biomass, HI, stems biomass, storage root diameter, the number of storage roots per plant, plant height, seasonal LAI and SPAD are considered important physiological and morphological indicators of cassava growth and productivity [20], and therefore these can be used as indicators for optimizing NPK application. Studies have shown that N application is a big promotor of RUE and increases cassava yields [22,24]. Furthermore, N stimulates canopy growth, photosynthesis and is key in carbon fixation [25,26]. In highly weathered, nutrient-deficient soils, P is the most limiting nutrient in cassava productivity [4]. Phosphorus is also an important plant nutrient for plant growth and plays a role in plant metabolism, structure and reproduction [27], apart from being a key element in energy transport in plants [28]. This implies that P is a limiting factor for cassava productivity and production in highly weathered soils. However, the availability of NPK is also affected by the soil acidic conditions, especially in Chromi-haplic Acrisol soils where liming may be essential to increased nutrient availability, improved soil structure and increased rates of infiltration [2,5]. On the other hand, studies have revealed that K is critical to cassava production as it plays a critical role in maintaining the photosynthetic activity essential in root bulking and it is highly demanded in the second cycle of cassava growth [29]. In K deficient soils, the application of K improves cassava productivity and radiation use efficiency [6,7,19] apart from increasing the efficiency of light conversion into photo-assimilates more than its interception efficiency [6]. On the other hand, reduced nutrient use efficiency potentially leads to reduced photosynthetic rate, stomatal conductance, SPAD, LAI and biomass production [30]. This implicates RUE in cassava as another yield determining factor.
It is important to recognize that the response of root yield to leaf area index (LAI) is an optimum curve with root yield increasing initially, reaching a plateau and then decreasing as internal shading due to excessive LAI becomes more severe. This causes the net assimilation and transport of assimilates to roots to decline [31]. In addition, Lenis et al. [32] also found that leaf area retention was highly correlated to root dry yield under both drought and well-watered conditions. This indicates that both LAI and leaf retention are important traits for achieving high root yield under stress and non-stress conditions. Cassava requires 60 to 80 days after planting (DAP) to achieve a leaf area index of one while light interception of 90% is achieved with a leaf area index of three at 120 to 150 DAP [33]. To achieve a high root yield, attaining an LAI of 3.5 as quickly as possible and sustaining it for the longest duration possible is critical. Leaf area indices larger than the optimum of 5–6 leads to excessive internal shading and substantial leaf abscission [34]. Apart from soil fertility with or without fertilizer application, leaf area dynamics are strongly influenced by moisture regime, ambient temperature and genotype (vigour and branching habit) [34]. Yield responses to fertilizer in cassava are likely to be associated with its effects on levels of assimilate sources (i.e., leaf area index and photosynthesis) and assimilate sinks such as tuber number and weight [29]. Therefore, fertilizer design and application rates should be tailored to increase assimilate sources and sinks for high yields. However, there is a lack of well-documented information on how NPK combinations and different varieties grown on highly weathered acidic soils interact to affect the root yield and morpho-physiological traits of cassava. This explains the reported high yield gap between actual farm yields compared to the potential yield in Zambia [35]. Henceforth, the reported yield gap has been cited as the major constraint to cassava productivity in Zambia [35]. The reported low actual farm productivity is attributed to the low use of improved cassava varieties and low or no fertilizer use in low nutrient soils [35].
The objective of this study was to evaluate the performance of three cassava genotypes on yield, physiology and morphological traits under different fertilization regimes. We hypothesised that:
  • Fertilization regimes and varietal responses affect cassava growth and root yield performance.
  • Fertilization increases RUE and modulates cassava varietal responses.

2. Materials and Methods

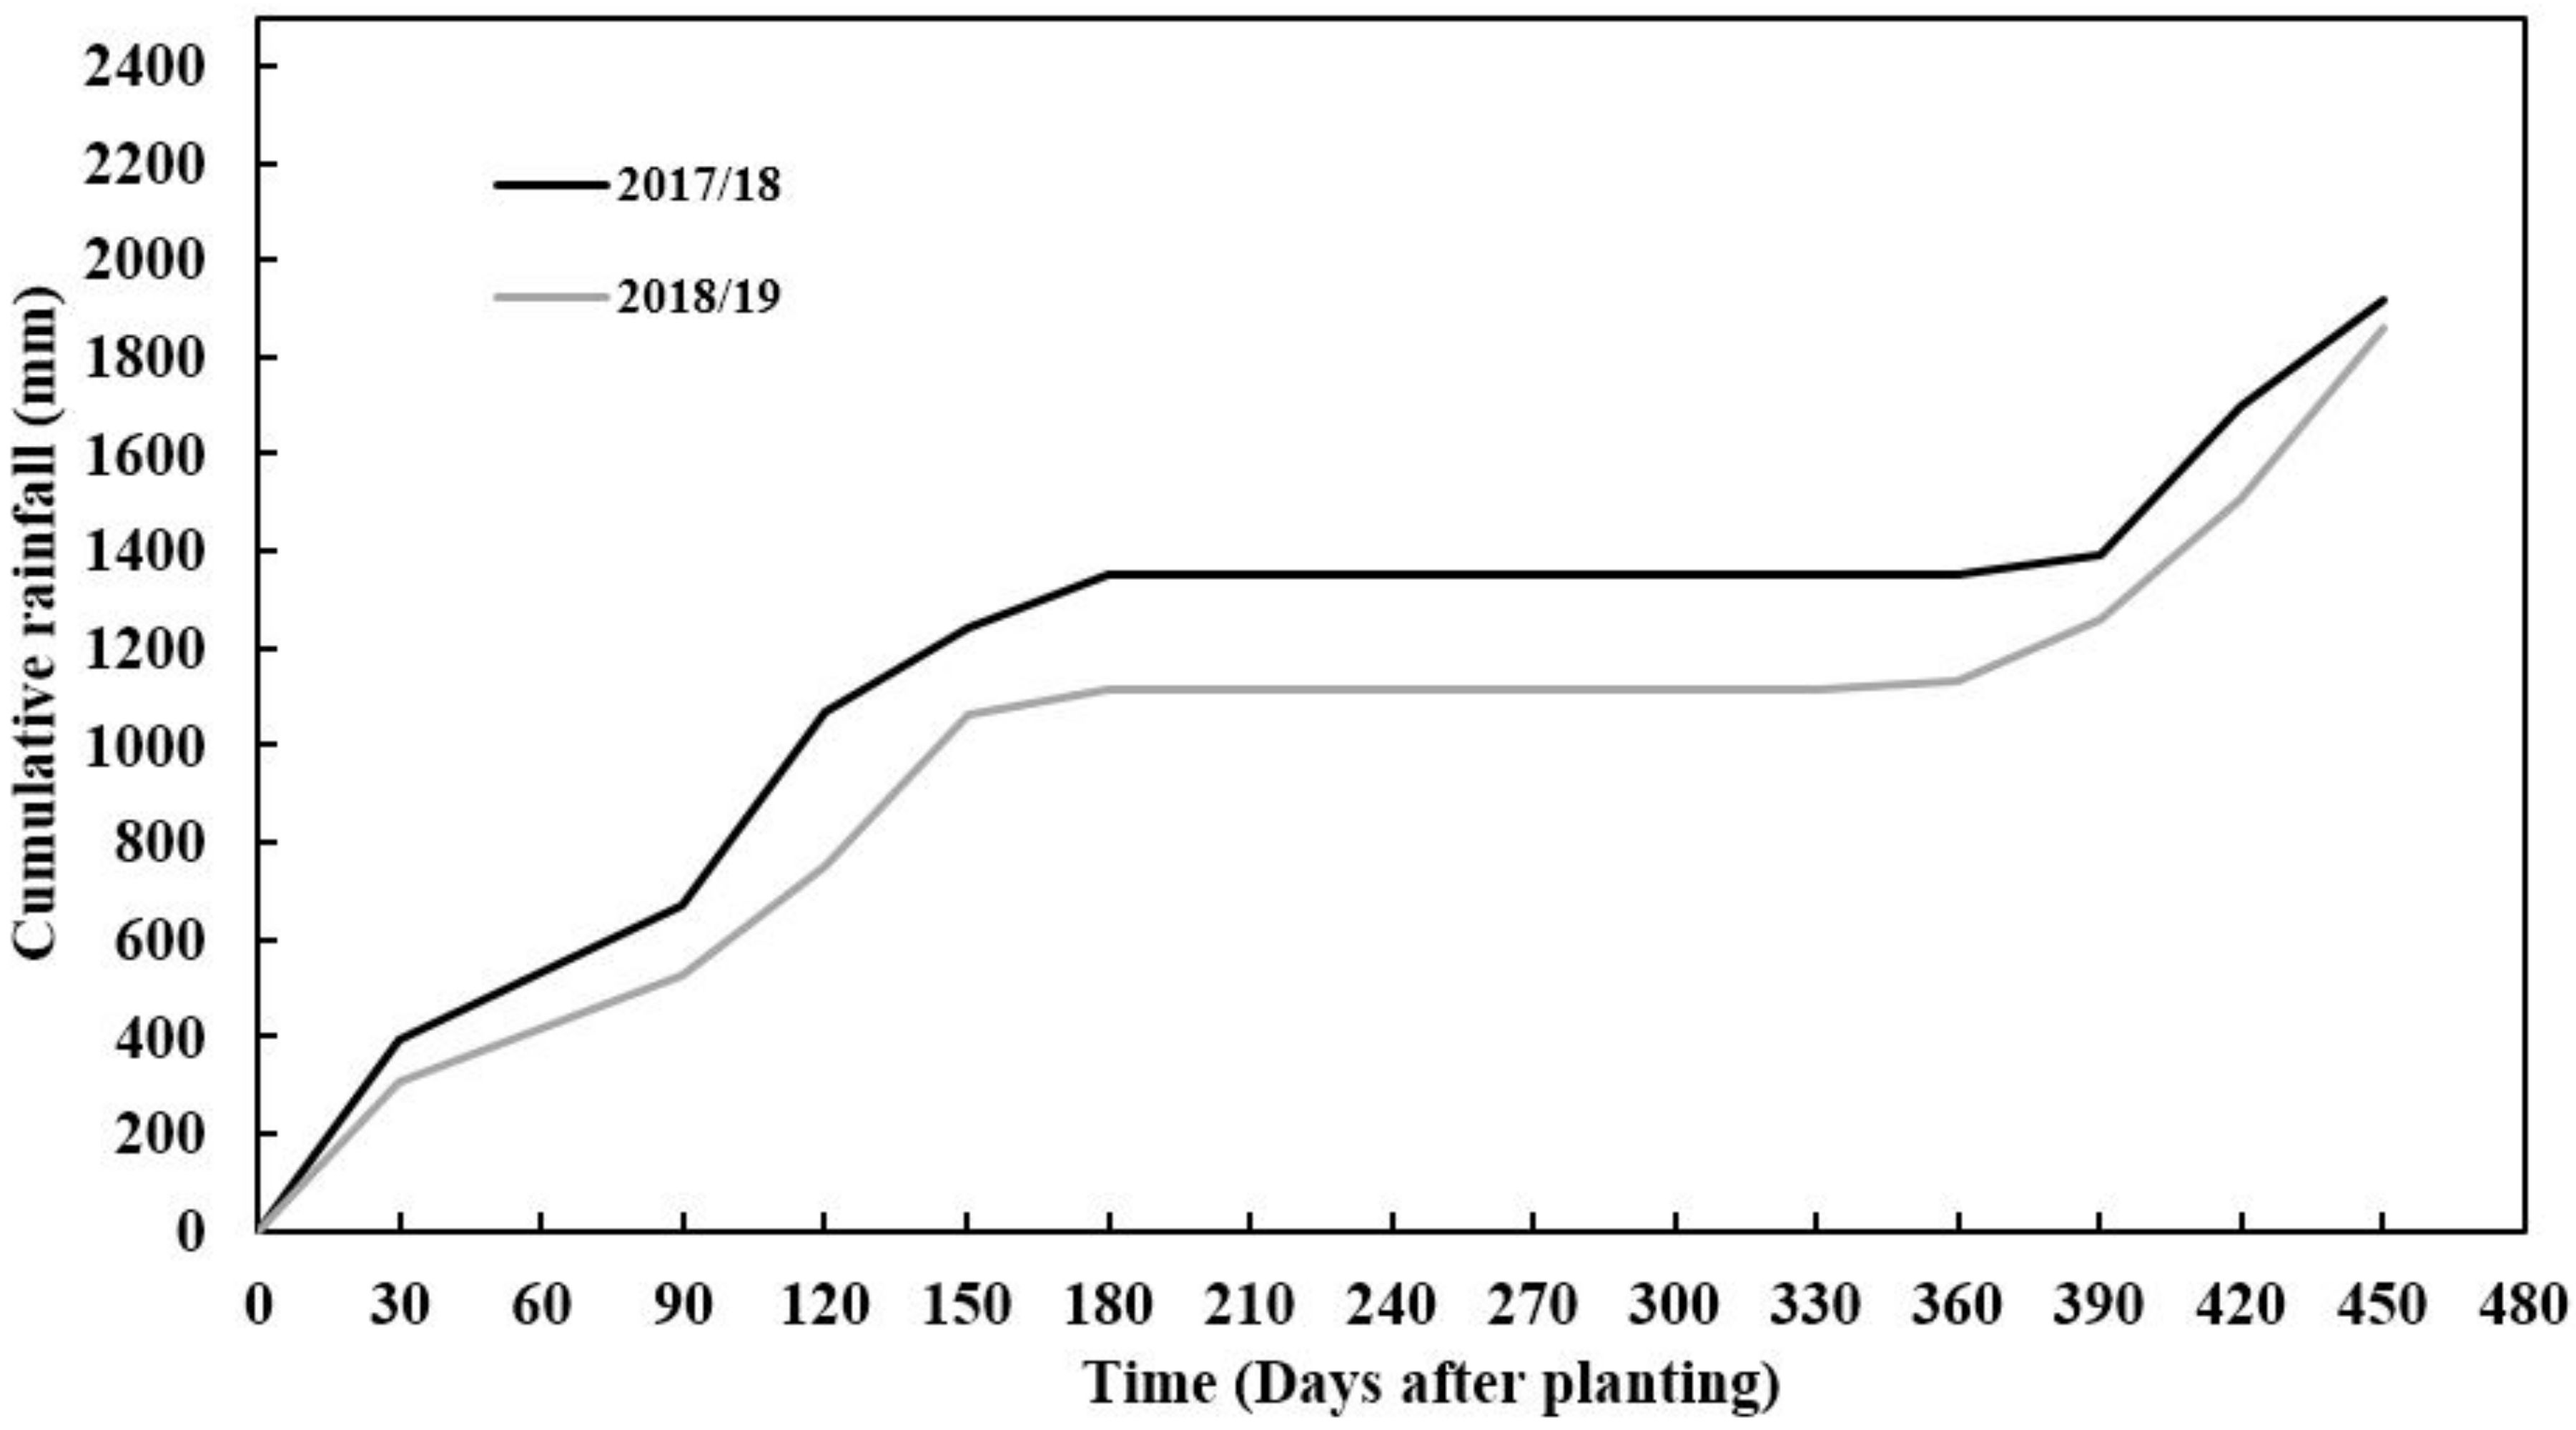
2.1. Study Area Description

A field experiment was carried out in Mansa at Zambia Agriculture Research Institute (ZARI) station (28.9508° E, 11.24135° S, 1230 m.a.s.l) situated in the Luapula Province of Zambia in Agroecological Zone 3 (AEZ3) for two consecutive seasons in 2017/18 and 2018/2019, respectively. This AEZ3 receives an average of more than 1200 mm of precipitation annually, with a growing season of 120–150 days. AEZ3 is characterized by highly weathered and leached soils with extreme acidity [36]. Soils are low in available plant nutrients for growth, with a high composition of exchangeable aluminium and manganese [37]. Daily rainfall and temperature data were collected from an automatic weather station that was less than 1 km from the experimental site. Soil samples were also taken for laboratory analysis to determine soil nutrient content (NPK), pH, organic matter and trace elements.

2.2. Experimental Germplasm Description

Three cultivars comprising of two improved varieties (Mweru and Bangweulu) from the root and tuber commodity released by Zambia Agriculture Research Institute (ZARI) and a local cassava landrace, Katobamputa, were used in the study. The varieties were selected for their wide adaptability and high yielding traits. Mweru was selected because of its wide adaptability and resistance to diseases, while Bangweulu and Katobamputa were selected for their high yielding in marginal soil conditions. The planting density was 10,000 plants Ha−1 planted at a spacing of 1 m × 1 m.

2.3. Experimental Design and Trial Management

A split-plot design in a completely randomized block was used with a fertilization regime as the main plot and variety as a subplot. The main plot had four fertilization regimes: M1-lime; M2-NPK fertilizer + lime; M3- no fertilizer regime and M4-NPK fertilizer only and subplots had three varieties; V1-Mweru, V2-Bangweulu and V3-Katobamputa. Fertilizer and lime at the rate of NPK 100:23:80 kg Ha−1 and 300 kg Ha−1 rates were calculated. The individual nutrient requirement from straight fertilizers of urea 46% (N) giving 217 Kgs of urea per Ha was calculated to meet 100 kg Ha−1 of N, triple superphosphate 46% (P2O5) giving 150 kg per Ha to achieve the above phosphorous application rate 23 kg Ha−1 and 50% muriate of Potash (K2O) amounting to 160 Kgs per Ha to meet 80 kg Ha−1 of potassium. The lime application was done using the recommended rate in Agroecological Region III of Zambia following a lime requirement of 1.5 × Al (cmol kg−1). Fertilizer and lime were applied in planting holes of cassava.
Before trial establishment, a composite soil sample from at least 10 random sampling spots per field was collected with a soil auger at 0–30 cm topsoil. The soil was later air-dried, passed through a 2 mm sieve and analyzed for standard physical-chemical properties. Soil texture analysis was performed using the hydrometer method, total N and organic carbon using the Dumas combustion method while available P was determined using the Bray 1 method. All analyses were done at the Department of Soil Sciences laboratories at the University of Zambia.

2.4. Data Collection

Plant height was measured from the base of the branch to the tip of the emerging new leaf using a tape measure [38]. Four chlorophyll measurements were taken on two leaves from either side of the midrib from the central lobe of the first fully developed leaf using the spad meter (SPAD 502, Konica Minolta and Tokyo Japan). For plant growth characteristics, measurements were taken on 5 tagged plants located in the middle of the plot. The readings were averaged over the growing cycle. Six sequential harvests were performed, with the first harvest at 75 DAP, and final harvests were performed on 396 and 410 DAP for the first and second growing cycles, respectively. A plot size of 36 m2 (6 × 1 m × 6 m) spaced at 1 m× 1 m with a target plant population of 10,000 plants/ha with a total plot population of 36 plants per plot. Plants were selected in the middle of the whole plots for sequential and final harvests in a 3 m × 3 m plot. To determine dry weights, plant parts were separated into storage roots, leaves and stems. Consequently, the fresh weights were determined in the field using the digital balance. For the roots and stems, 300 and 200 g of leaves were sampled for dry weight determination. The materials were oven-dried to a constant weight under 80 °C for 48 h. Dry matter was determined as the ratio of dry to fresh weight of the samples. In addition, the harvest index (HI) was calculated as the ratio of storage root dry weight to total plant biomass at all stages of sampling till the last harvest while the number of storage roots per plant was counted and averaged for 5 plants. Storage root diameter was measured using a digital Vernier calliper at all six stages of data collection.
The intercepted photosynthetically active radiation (PAR) was measured at each of the three locations in the plot using the 1-meter line quantum sensor and LI-COR 190R (LI-COR Inc., Lincoln, NE, USA). Leaf area index (LAI) was measured in established cassava plots at three different locations using the LAI2200 (LI-COR Inc., Lincoln, NE, USA).
During the season, PAR and LAI were determined in all plots during the six different dates of sampling from 75 days after planting till the last day of the final harvest. Three measurements of data were recorded at each of the three different locations per plot.

2.5. Parameter Estimation

Yield or dry matter of total biomass was obtained by summing up DM yields of storage roots, stems, harvested leaves and fallen leaves for each treatment. Dry matter of fallen leaves was estimated by summing all collected oven-dried leaves from each treatment plot at the time of sampling dates.
DM Kg Ha−1 = (DM plot (Kg)/number plants harvested in a plot) × plant population (plants Ha−1). The relationship of light interception and LAI was calculated according to Veltkamp [33]:
In (I/IO) = −K × LAI
where I is light received under the canopy
IO = incoming light above the crop canopy
K = extinction coefficient
Radiation user efficiency (RUE) for different treatment combinations was calculated as a slope of the linear regression of total plant biomass (gm−2) and cumulative intercepted radiation (IPAR) (MJm−2) during different times of growing seasons [22,39,40]. In this study, it was assumed that 45% of daily solar radiation (DTR) was photosynthetically active radiation (PAR)
IPAR = ∑DTR × 0.45 × Q
where DTR = daily total radiation
Q = proportion of intercepted radiation during the growing season.
The cumulative IPAR was calculated daily from the day of planting to a specific plant sampling interval date of harvest for plotting against produced biomass (leaves, stems, storage roots and fallen leaves). For optimization of RUE, the intercept of linear regression was set to zero since no cassava biomass production may occur without light interception by the canopy.

2.6. Statistical Analysis

Analysis of the variance was conducted to determine the effects of interaction between fertilizer management, harvesting intervals and varieties. R statistical software [41] was used for the analysis of the variance (ANOVA) using linear mixed models with lmer and emmeans packages for mean comparison using Tukey’s honest significance test. The general linear mixed model equation is described below.
Yijkl = µ + Vr + Fs + Yt + FVrs + FYst + VYrt + FVYrst.bi + wij + εijkl
where µ is the grand mean, Vr main effect of variety r (assigned to ijk units), Fs is the main effect of fertilizer managements (where different managements are assigned to subplot ijk), FVrs. is the interaction between variety and fertilizer regimes, FYst is the interaction between fertilizer regimes and year effect, VYrt is the interaction between variety and year effect, FVYrst is the interaction of fertilizer regime, variety and the year effect, bi is the effect of block i, wij is the whole plot j within block i and εijkl is the random error for unit ijkl.
In the analysis of variance, genotypes were considered as random while fertilizer regimes were considered as fixed. To determine the strength of the relationship of variables and their strength of association, a Pearson correlation analysis was conducted in R. In addition, stepwise regression was conducted to determine the most important traits contributing yield, stem dry matter and biomass formation using Akaike Information Criteria (AIC). Reference evapotranspiration for both seasons was calculated using CROPWAT Software Version 8.0.1.1 released by the Food Agriculture Organisation (FAO).

3. Results

3.1. Soil Physical and Chemical Properties

The amount of precipitation received during the first and second growing seasons varied, with 2017/18 receiving more rainfall than the 2018/19 season. The seasonal rainfall difference between seasons was 400 mm (Figure 1). The 2017/18 season had better rainfall distribution compared to the 2018/19 growing season, monthly. However, despite rainfall starting with low monthly rainfall distribution in 2018/19, the season received more rainfall in March, which was twice more than that received in the 2017/18 growing season in March (Figure 1). This period is critical for tuber formation in cassava since good rainfall is needed. Reference evapotranspiration varied across seasons with the 2017/18 season having a higher value than the 2018/19 season (Figure 2). This trend was in line with the amount of rainfall and radiation accumulations which also coincided with seasonal evapotranspiration. Soil pH, total nitrogen, exchangeable phosphorous (P), exchangeable potassium (K), exchangeable calcium (Ca) and exchangeable magnesium (mg) were slightly higher in the second season (2018/2019) than in the first season (2017/2018), except for exchangeable sodium which was slightly lower. The variations in soil chemical properties were not significantly (p > 0.05) different. The soil texture classification of sandy clay loam did not vary across seasons as these fields were very close to each other (Table 1).

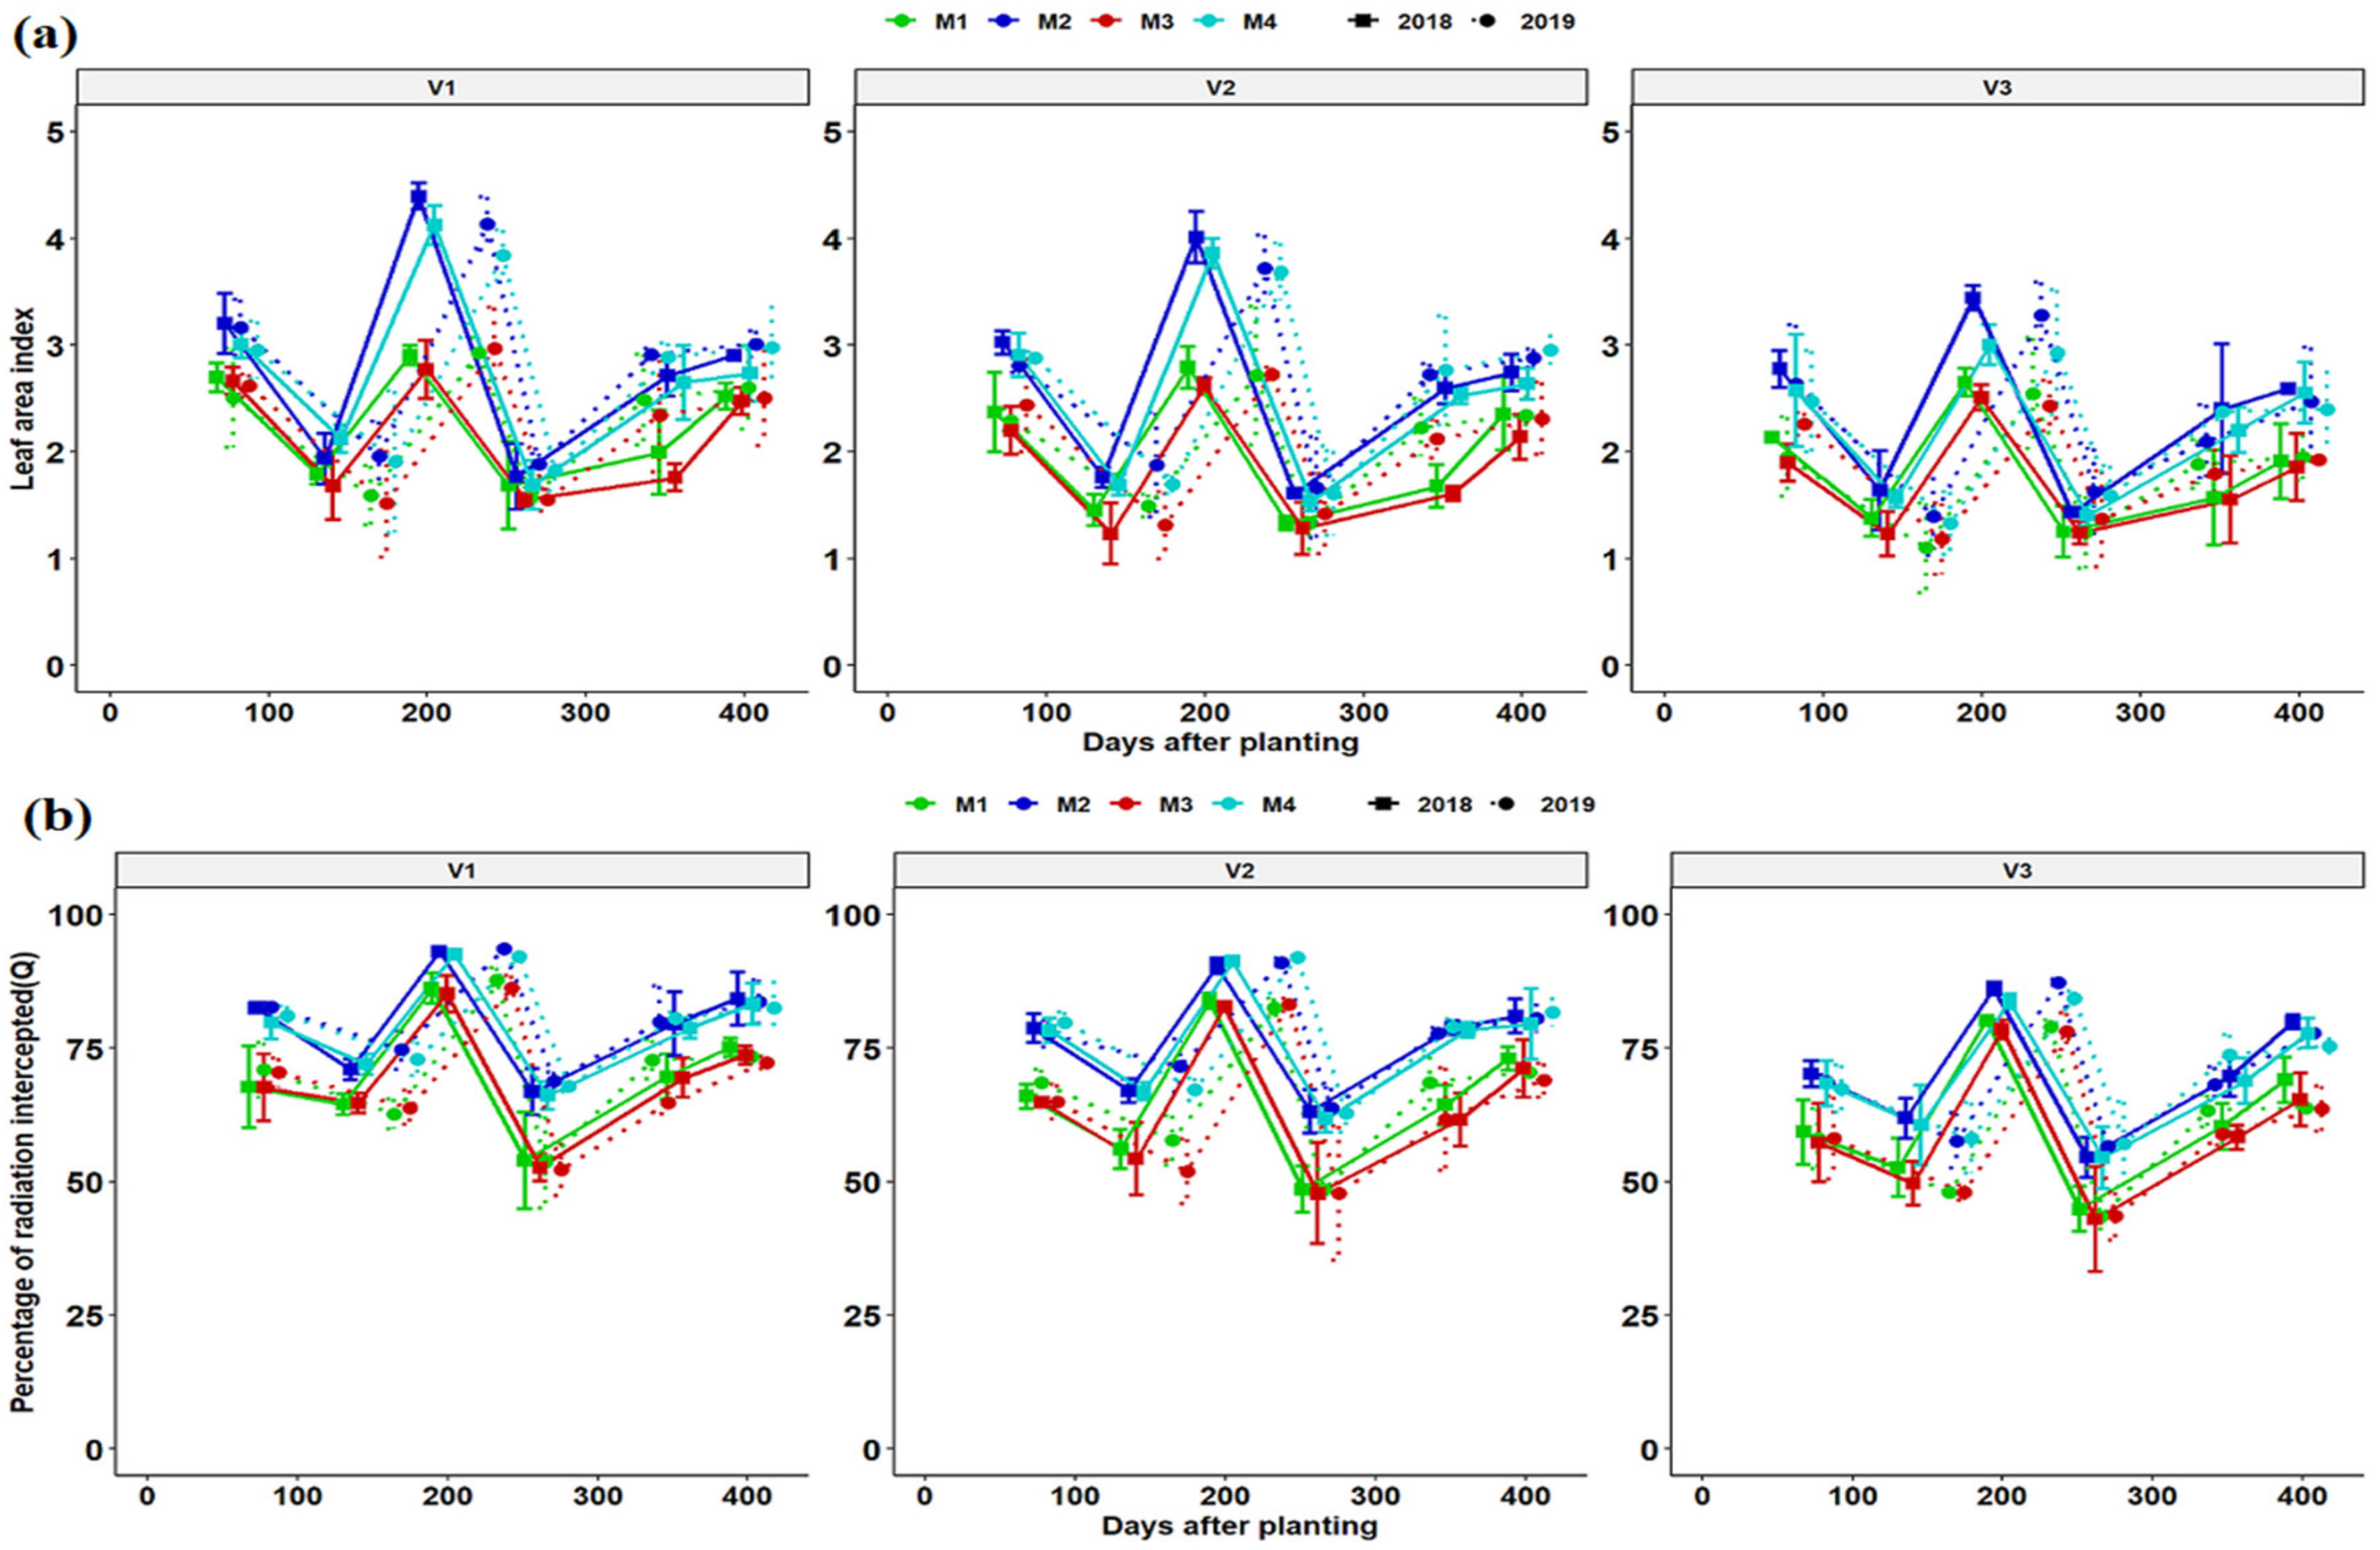
3.2. Leaf Area Index and Light Interception Dynamics

Determination of LAI was performed for each variety and growing season (year) for respective fertilizer management practice (Figure 3a). The development of cassava LAI was slow during the crop establishment phase of 1 to 3 months. It took approximately 6 to 7 months to reach the maximum LAI values in line with rainfall, temperature and leaf area longevity during the two seasons of growth. LAI development was slow from start taking a high notch from 75 days after planting reaching maximum values at 197 and 240 DAP in 2017/18 and 2018/19 growing seasons all parallel the rain season respectively. LAI decreased rapidly in the dry season. The LAI was highest at 197 and 240 DAP in the 2017/18 and 2018/19 seasons, respectively. Ultimately LAI decreased rapidly at 259 and 273 DAP in two respective seasons and only increased after the resumption of a rainy season in November in both seasons (Figure 3a). The period of reduced LAI corresponded with a drier period of the year and plants responded by reducing aboveground growth, hence limiting plant transpiration. In addition, there was maximum leaf fall. In both seasons the pattern of canopy growth was similar for all fertilization regimes, although M2 and M4 had a higher LAI compared to M1 and M3 regimes. A sharp increase in LAI was observed for all fertilization regimes and genotypes at 354 and 344 DAP for the 2017/18 and 2018/19 seasons till the final regrowth due to resumption of the rainy season. It is common practice in southern Africa and in Zambia’s cassava growing belts to harvest cassava during the rainy season for ease of harvesting in wet soils and to avoid storage root breakage, and consequently preserve the planting stalks (cassava cuttings).
Light interception followed a similar pattern as that of LAI for the growing cycles. The patterns of light interception by genotypic canopies are shown in Figure 3b. The first date of light measurement V1 intercepted a higher percentage of incoming PAR then followed by V2 and V3 regardless of fertilization regime. Light interception slightly decreased on 138 and 172 DAP at all treatment combinations, with V3 having the lowest light interception. The highest intercepted PAR was achieved at 197 and 240 DAP for the 2017/18 and 208/19 seasons, respectively. At 259 and 273 DAP, there was a remarkable decrease in light interception at all treatment combinations (genotypic and fertilization regimes). In addition, there was a maximum leaf fall during the dry season followed by new leaf formation as moisture conditions improved (Figure 1 and Figure 2). Genotypic and fertilization regimes differences in total intercepted PAR were negligible (Figure 3b). The range of the fraction of intercepted radiation (Q) ranged from 50–90% and 43–92% across treatments for the 2017/18 and 2018/19 seasons, respectively. Both LAI and Q were slightly higher in 2018 than in the 2019 season (Figure 3a,b).

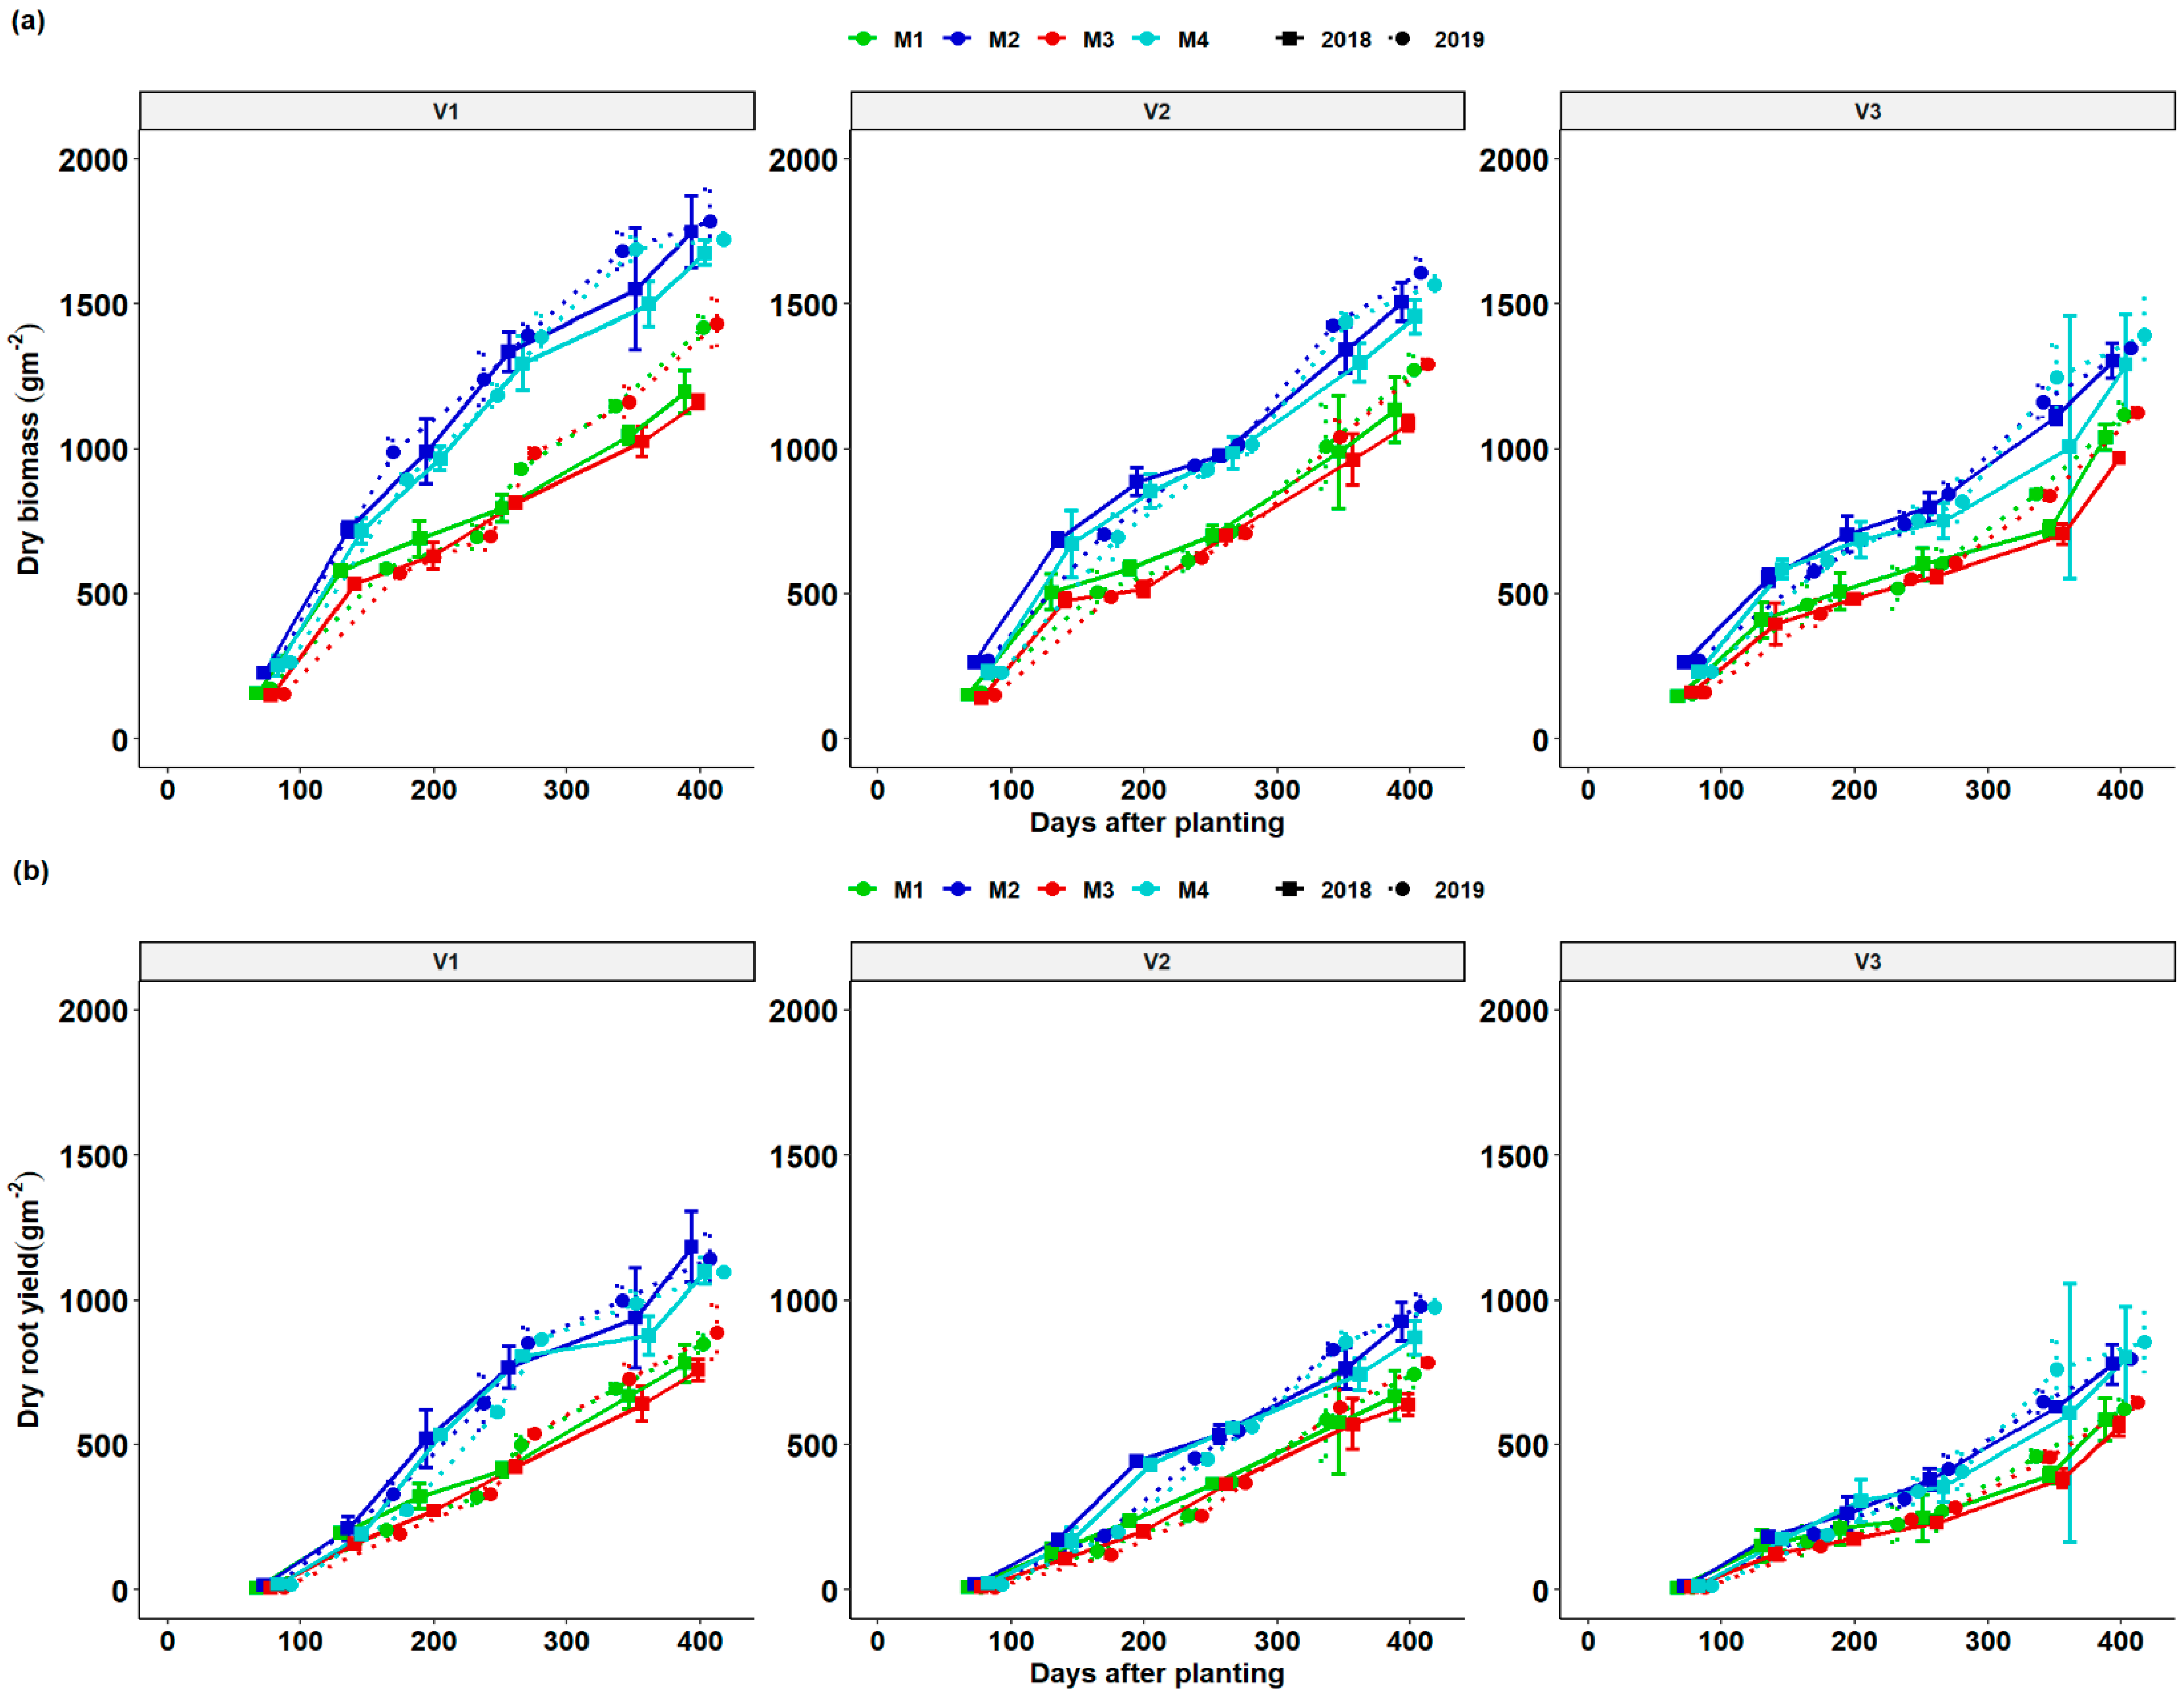
3.3. Dynamics of Total Dry Matter (TDM) and Root Dry Matter (RDM) as a Function of DAP and Season

Total dry matter (TDM) and root dry matter (RDM) of cassava growth increased gradually after crop establishment and grew rapidly after 200 DAP in response to the rise in moisture (Figure 2 and Figure 4). At all stages of growth and across years, biomass accumulation kept increasing and reduced in the dry season and increased rapidly after the onset of rain. At all stages, fertilization increased total biomass accumulation compared to unfertilized and limed treatments. During the growing season, total dry matter (TDM) and root dry matter (RDM) were determined during the six sequential plant harvests throughout the growing season. The growth of cassava biomass (TDM) and root yield (RDM) was slow until after 140 DAP of its growth cycle (fourth to the sixth harvest). During this period, the cassava used much of its carbohydrate reserves stored in its roots to rebuild its LAI. The increase in LAI led to an increase in both TDM and RDM growth especially between 320 and 410 DAP. Across all seasons, fertilizer + lime treatment and fertilizer-only treatment exhibited a similar trend and had significantly RDM and TDM compared to lime and control treatment. It was clear that the growth dynamics curve for V1 was better than V2 followed by V3 in RDM and TDM irrespective of the fertilizer treatment. It was also observed that growth in RDM and TDM was better in 2019 than in 2018. Cassava biomass (TDM) and root yield (RDM) growth slightly decreased on 259 and 273 DAP at all treatment combinations with V3 having the lowest visible growth. A sharp increase in cassava varietal biomass (TDM) and root yield RDM was observed for all fertilization regimes and genotypes at 354 and 344 DAP for the 2017/18 and 2018/19 seasons till the final regrowth due to resumption of the rainy season. Fertilization treatments M2 and M4 produced comparable higher total varietal plant biomass (DTM) and root dry matter (RDM) compared treatments M1 (lime) and M2 (control) which showed similarities in biomass production.

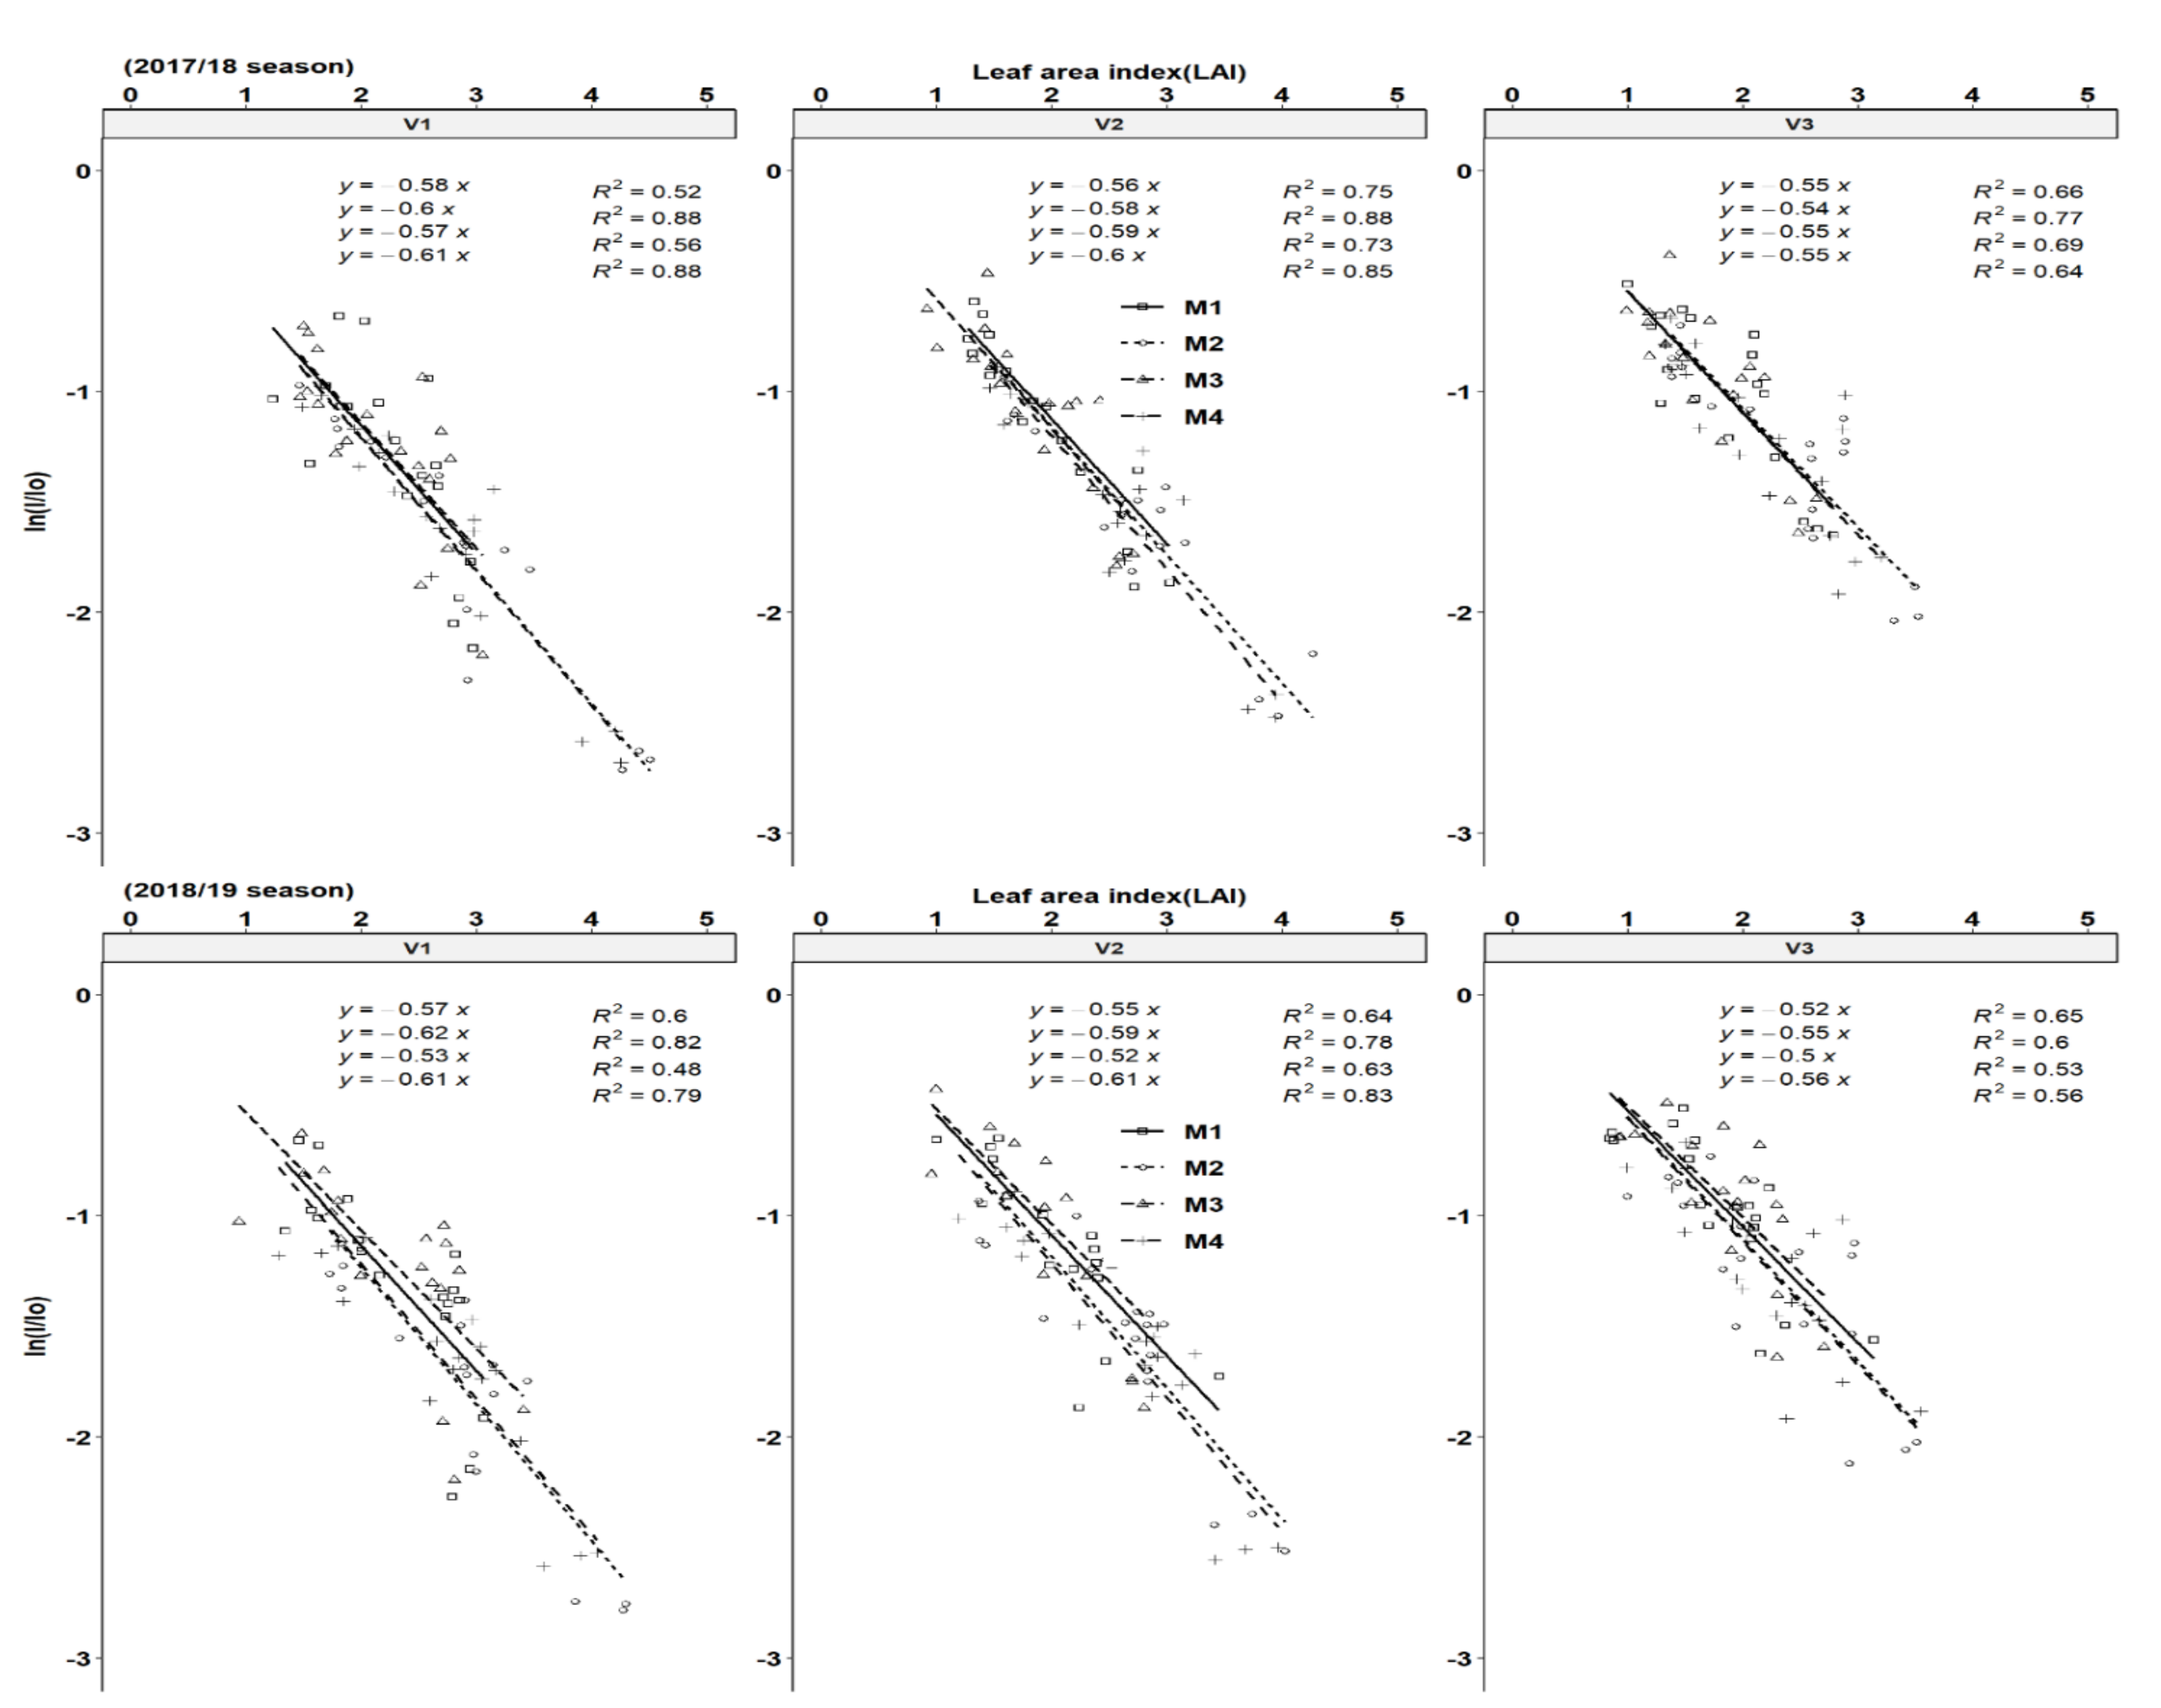
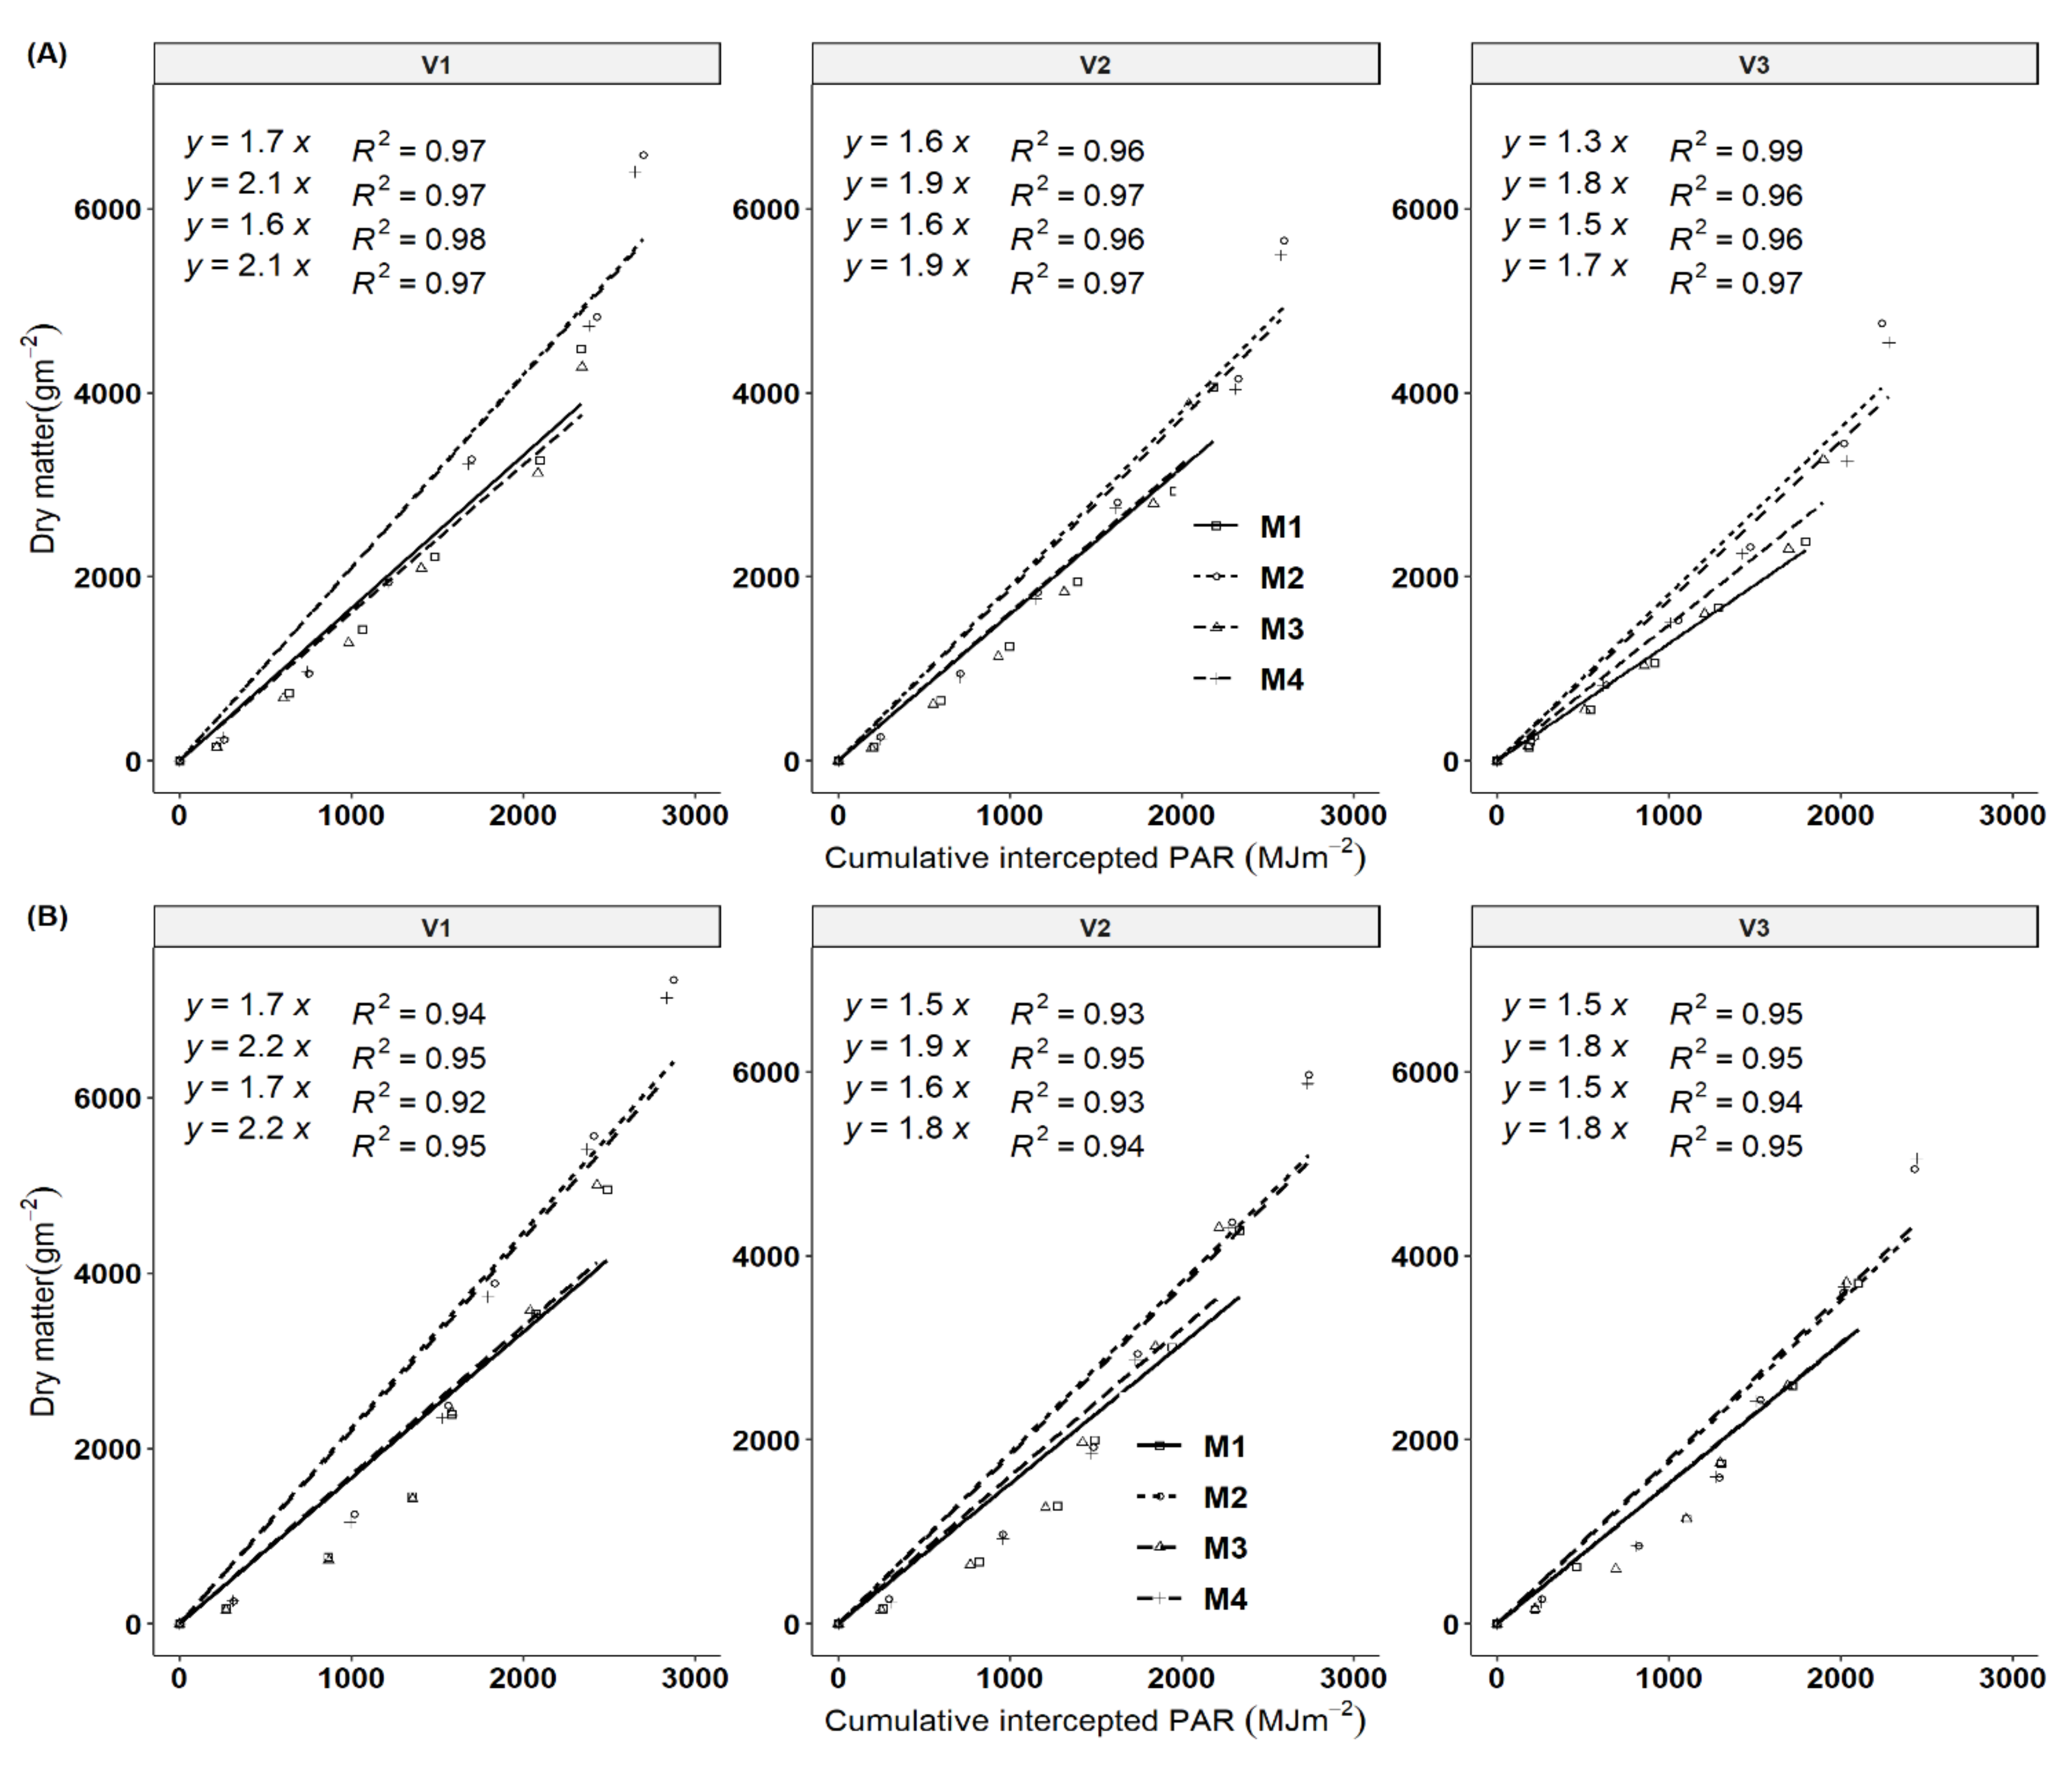
3.4. Light Extinction Coefficient and Solar Radiation Use Efficiency

The relationship between the percentage of light interception and LAI was calculated according to Veltkamp, [31] who suggested that the penetration of light down the canopy approximately followed the Lambert–Beers Law as applied in optic physics. Using Equation (1), good fits were obtained between the LAI and percentage of light interception as light extinction coefficients (K values). The K values ranged from 0.54–0.61 and 0.52–0.61 for the 2017/18 season, respectively across genotypes and fertilization regimes (Figure 5). Across all genotypes, fertilization increased the K values across seasons. This is a sign that higher light interception was achieved for the same LAI because of better leaf size, branching and leaf positioning resulting from the horizontally-oriented leaf structure of cultivars. The highest clonal K-values were obtained by cultivar Mweru (V1) followed by Bangweulu (V2) and Katobamputa (V3), respectively across all treatments. The cassava average K-value in the present study is similar to the value estimated for most crops (around = 0.60). Zhang et al. [42] estimated comparative K values among different vegetation ecosystems and found that cropland had the highest value of K (0.62), followed by broadleaf forest (0.59), shrubland (0.56), grassland (0.50) and needle leaf forest (0.45).
Data on the cumulative total biomass produced were plotted against cumulative intercepted photosynthetic active radiation (IPAR) for the different harvest times of the growing seasons. Biomass formation is a dynamic process that not only involves light interception via plant canopy but also carbon fixation by photosynthesis, and dry matter partitioning patterns among aerial and belowground organs. All genotypes showed a significant increase in RUE in response to fertilization (Figure 6) due to an indirect effect of increased LAI, and a direct effect of increases in stems and storage roots with fertilization. Fertilization regimes M2 and M4 showed the highest RUE values compared to M1 and M3 across all genotypes. The RUE values ranged from 1.3–2.1 and 1.5–2.2 gMJ−1 PAR in 2017/18 and 2018/19 seasons, respectively. These RUE values are within the ranges of four cultivars observed under variable fertilization treatments in the subhumid zone of Colombia, South America [22]. Genotypic variation of RUE was observed with V1 having higher values followed by V2 in comparison to V3. Fertilization increased the RUE by 20.69% and 20.34% in the 2019 and 2018 seasons in comparison to the control (no fertilizer). Seasonal variations were not reflected in the values of RUE in the 2018 and 2019 growing cycles. The K values obtained in this study indicate that most of the clones had moderately horizontal leaves (planophile pattern).

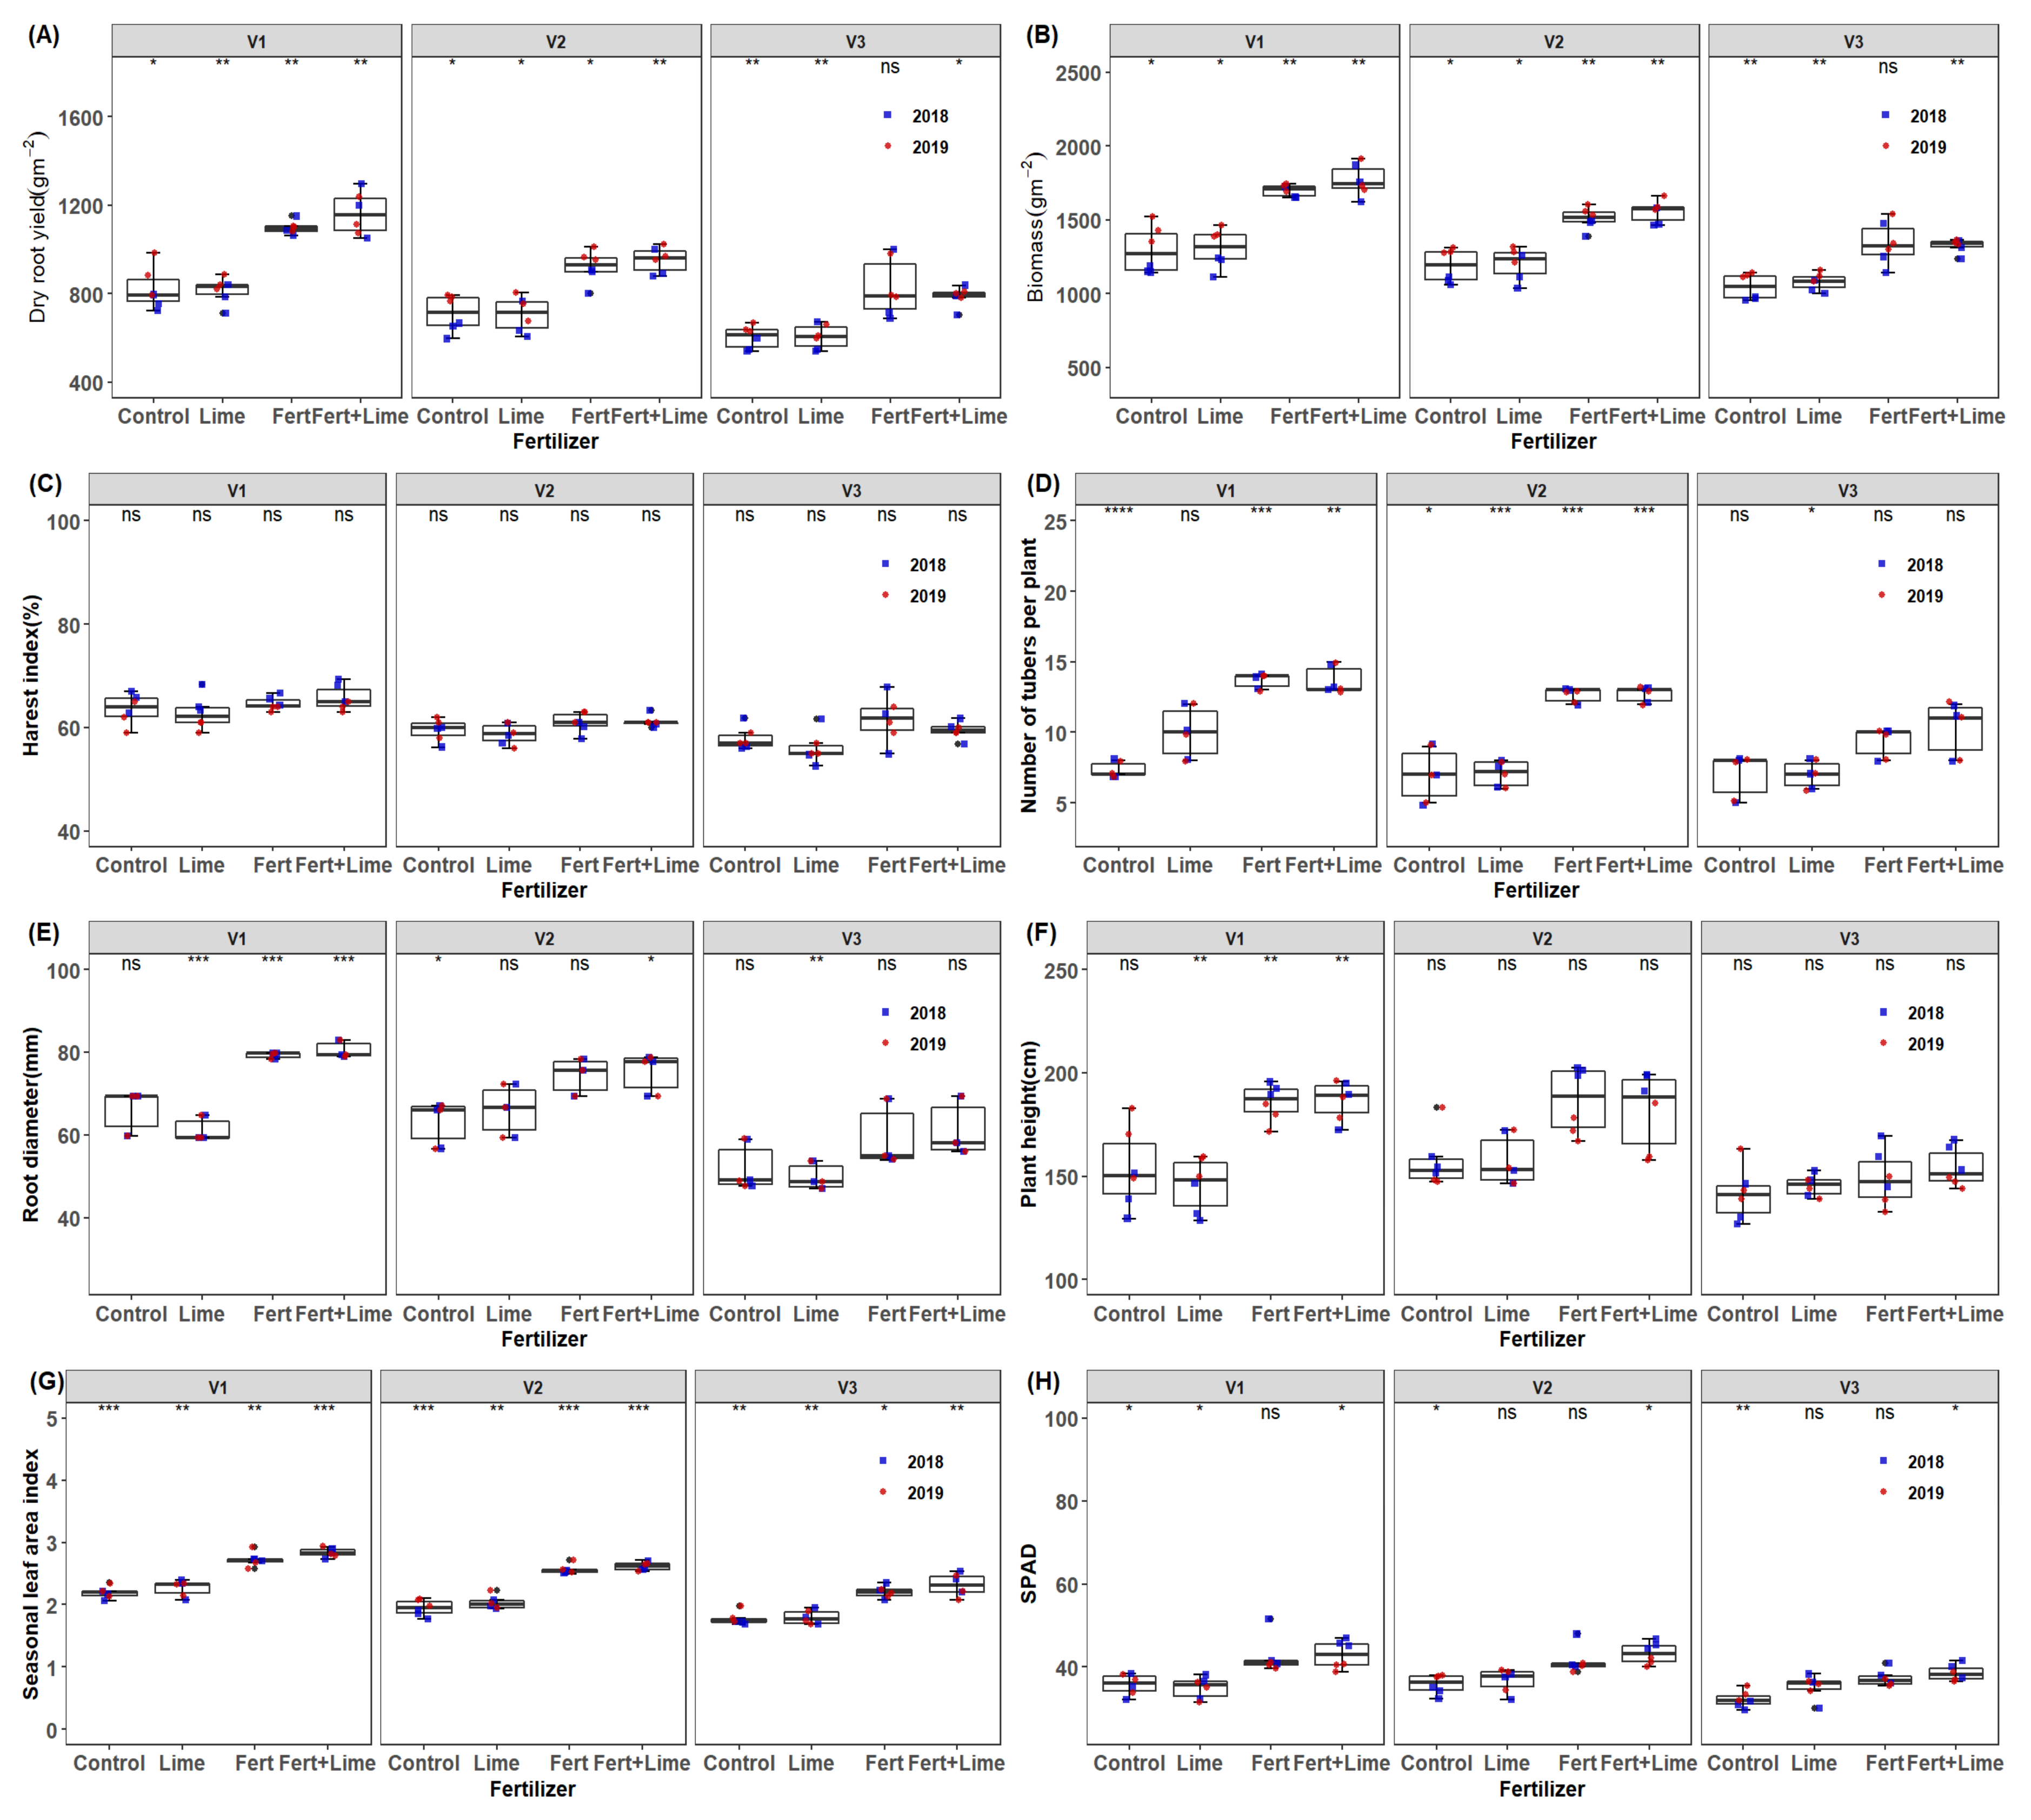
3.5. Effect of Fertilization on Yield, Yield Components and Source Traits of Different Cassava Genotypes across the Growing Seasons

Significant differences for fertilization regimes and genotypes were observed in dry root yield, biomass, harvest index, root diameter, plant height, mean LAI, except for stems biomass, the number of tubers per plant and SPAD (chlorophyll content) in the 2017/18 season. In the 2018/19 season, significant differences in fertilizer and genotypic variations were observed in dry root yield, biomass, stems biomass, root diameter, plant height, mean LAI, SPAD and the number of storage roots, except for harvest index (HI) whose variations only reflected on genotypes (p = 0.05). Across seasons (year) an increase in yield of 27 and 28% was observed due to fertilizer and genotype, respectively. Mean root yield was higher in 2019 than in the 2018 season. Further, a yield advantage in both years of 23.9 and 27.02% in the 2018 and 2019 seasons, respectively, was attained for fertilization substitution. The interaction of cultivar and the growing season was observed. Storage root yield across all treatment effects was around 7.36% higher in 2019 than in 2018. A similar trend was observed on whole plant biomass and stems biomass across the treatments. This was probably due to better crop establishment and stable rainfall in the 2019 season (Figure 1). In addition, the higher total daily radiation during the growth period increased aerial biomass, an indication of plant growth. The mean chlorophyll index was higher in 2018 by 2.8% than in 2019 while fertilizer × year interaction and genotype × year interaction effect was also observed. There were no seasonal LAI differences observed across seasons across all treatments despite observing some variations in fertilization and genotypes. Plant height and number of storage roots showed significant genotype by year effects as well as genotype × year (Table 2 and Figure 3). Plant height was slightly higher in 2018 compared to 2019 across treatments while fertilizer by cultivar interaction effect was also observed. Significant fertilizer and genotype effects were observed on storage root numbers, although these differences did not reflect the year effects (Figure 7). Application of NPK notably has shown to promote cassava storage root yields as reported in recent studies [43,44]. N is an essential yield promoter in agriculture farming.
The average dry root yield increase of 31–41% for all varieties was observed from the application of NPK fertilizer + lime. The fresh root yield increase ranged from 31 to 37% across varieties with a mean of 33%. This increase in fresh root yield, in market terms, would represent an increase of US$ 506 from the sale of additional roots, versus a total expense of USD 207 (US$ 200 from NPK fertilizer and US$ 7 from lime expenses) on a hectare basis. This represents a gross profit of US$ 299. The application of fertilizer only resulted in an average yield increase in fresh root yield of 53% which translates to a US$ 331 (531–200) gross profit. Despite this, the long term effects of liming are likely to offset the negligible yield reduction in fresh root yield. Furthermore, it was observed that both NPK fertilizer + lime and fertilizer treatment revealed higher similar genotypic effects compared to liming and the control on yield and biomass. No fertilization regime by genotype interaction effects was observed for both fresh and dry matter of root yield and biomass, respectively. However, no overall significant lime response was observed on yield and biomass (Table 3).

3.6. Important Traits for Cassava Yield, Stem Yield and Biomass

Table 4 and Table 5 present the correlation matrix for two growing seasons 2018 and 2019 and cassava traits responsible for yield determination, respectively. The traits were final and average seasonal values at the end of the growing season for correlations. Autocorrelations were observed for total plant biomass and final root yield. Source assimilates such as mean LAI, RUE and mean chlorophyll (SPAD), economic sinks storage root numbers and root diameter showed consistently highly significant correlations with total biomass and root yield.
Plant height and leaf yields were all positively correlated to final yield and total final plant biomass.
The stepwise regression model was developed using lower Akaike Information Criteria (AIC) to arrive at the model explaining most variation. Stem dry matter, mean LAI, radiation use efficiency RUE and tuber number per plant were important factors in determining the root yield of cassava (Table 5). Biomass was strongly influenced by root yield, SPAD, leaf matter, HI Mean LAI, tuber number and RUE (p < 0.001, R2 = 0.99).
For stem yield, the most significant contributing factors were root yield, leaf matter, SPAD (chlorophyll, harvest index (HI), plant height (PH), root diameter, mean LAI, tuber number and RUE (p < 0.001, R2 = 0.99).

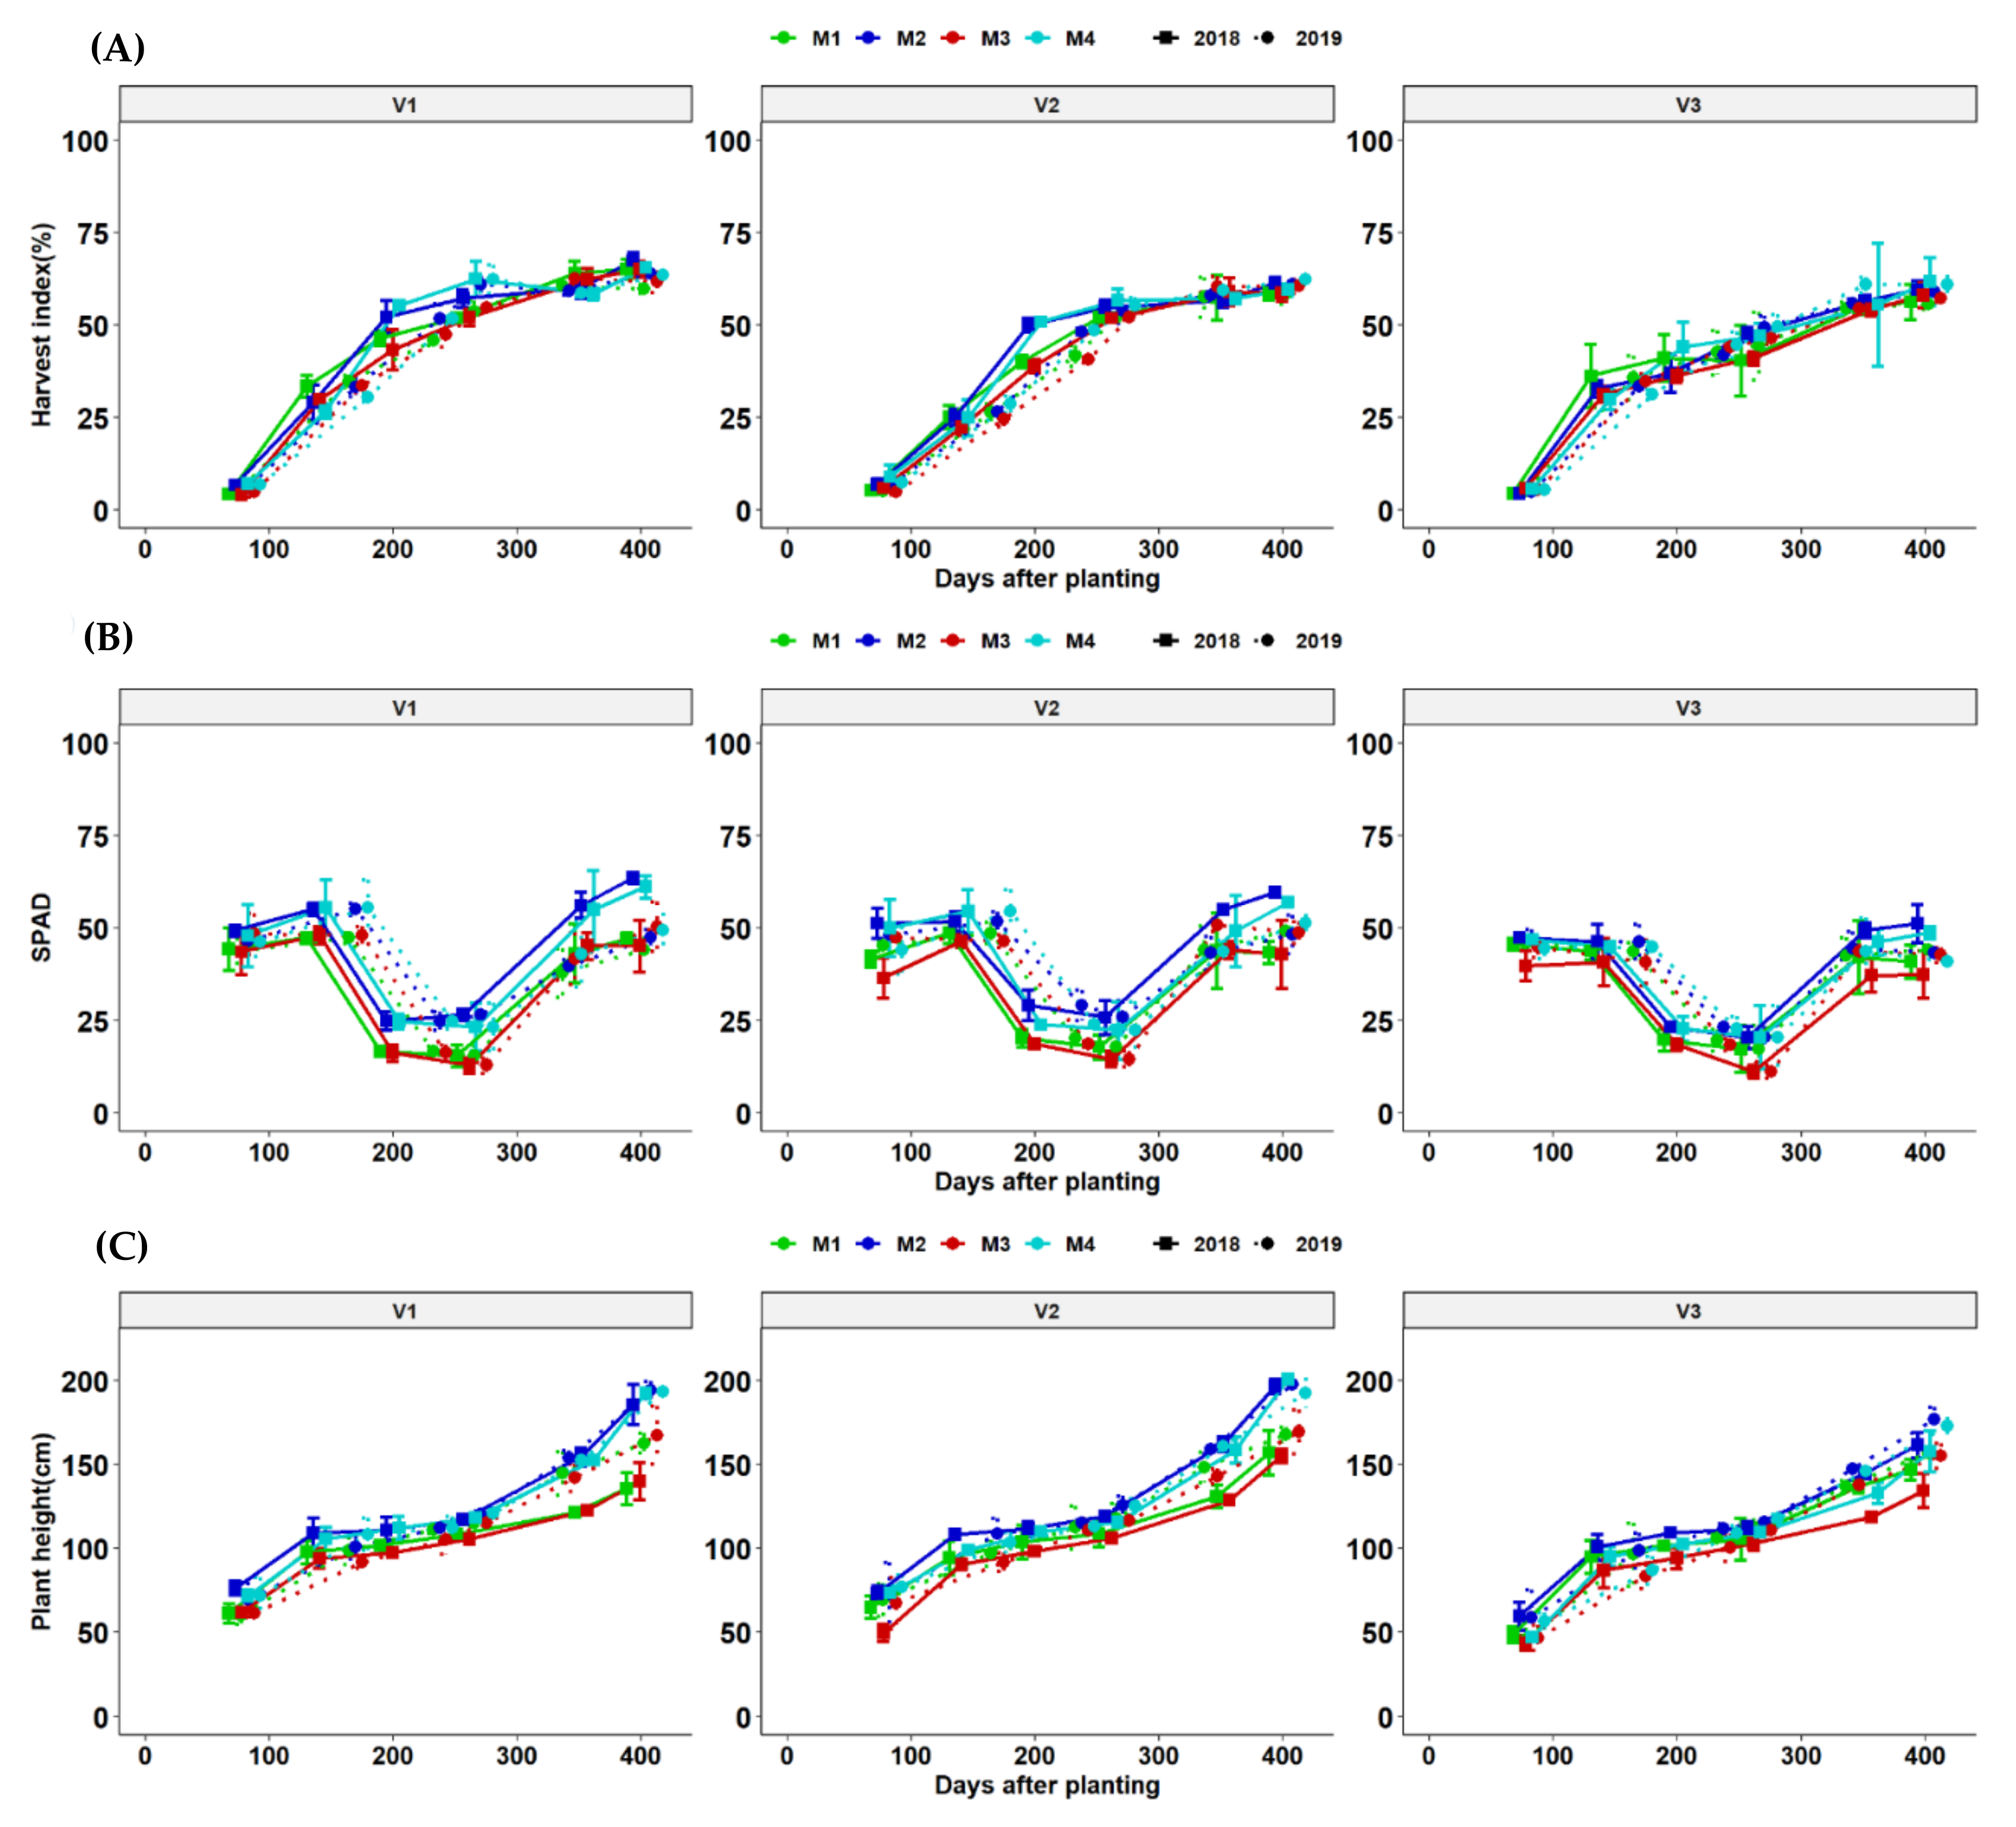
3.7. Growth Dynamics of Cassava Genotypes as Affected by Fertilization Regimes

At all stages, application fertilization dry matter accumulation to the root (harvest index-HI) compared to unfertilized and limed treatments. Genotypic responses to fertilization were significant at nearly all points of harvests. The growth curve for total HI was more related to a logistic growth function. HI is an important indicator of genotypic partitioning efficiency and followed a similar logistic trend until the last day of harvesting but there were no significant effects due to fertilization as differences were only reflected in genotypes. SPAD readings showed that chlorophyll increased with moisture and dropped drastically during drought stress before the rainy season but quickly increased to appreciable amounts until the last harvests.
Significant fertilizer × genotype interaction effects were observed over time and this trend was consistent across the two seasons of the experimental trial. Plant height increased with fertilization and influenced varietal plant height differentially (Figure 8).

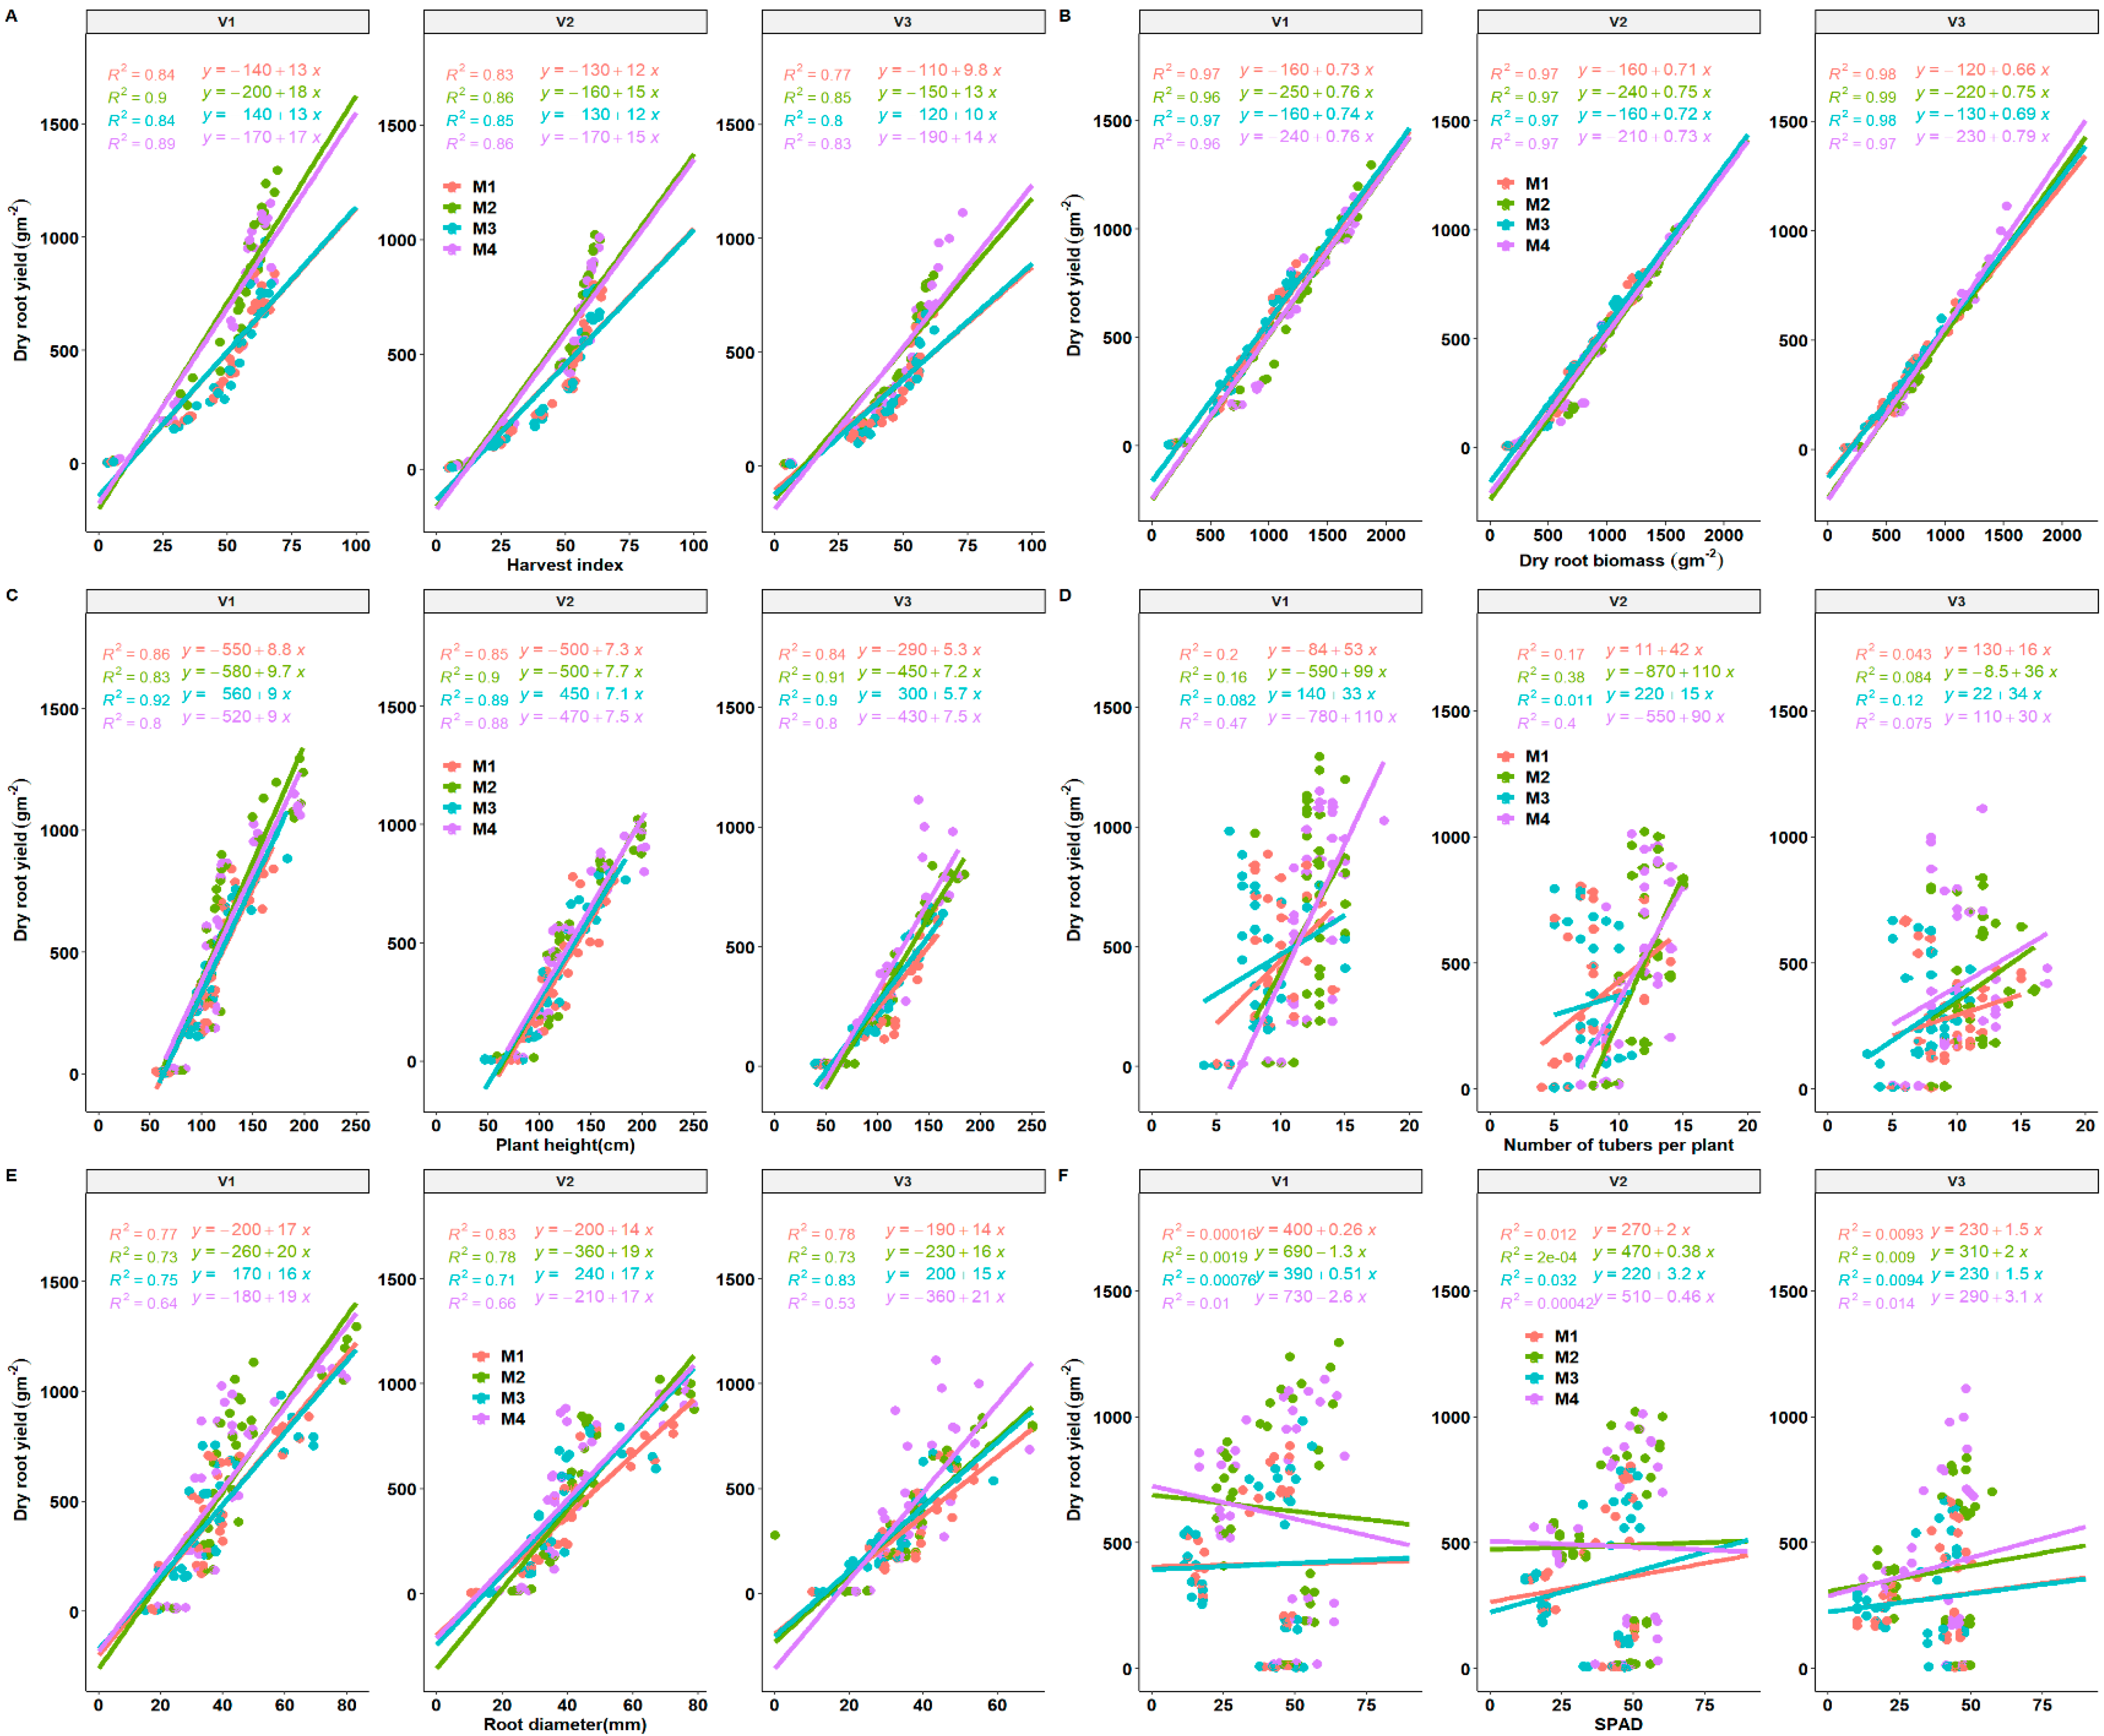
3.8. Seasonal Yield Determinants of Cassava Storage Root Yield as Influenced by Fertilization Regimes and Variety

Phenotypic traits present dynamic combinations between various plant mechanisms that can easily be explained by correlations. As usual, HI and total plant biomass correlated well with storage root yield and explained more variation in storage root yield of cassava genotypes regardless of fertilization regimes as indicated by the level of high accuracy of storage root yield prediction (Figure 9A,B). In addition, plant height was positively correlated with storage root yield across fertilization regimes and genotypes. The correlation was strong for plant height versus storage root yield, an indication that plant height is an indicator and a determinant of cassava storage root yield in these genotypes. It was also observed that positive moderate correlation values were obtained for the number of storage roots per plant versus storage root yield. Variation across fertilization regimes and cultivars also reflected in fertilization with an improved accuracy of prediction for storage root yield. In addition, we observed a consistent positive relationship across seasons for most traits and strongly correlated with cassava storage root yield (Figure 9A–E).
Root diameter and storage root yield also revealed a stronger relationship from the positive regression curves across treatment effects (Figure 9E). Storage root diameter may be used as a strong indicator (sink) in the determination of storage root yield. A strong correlation of storage root yield was observed with root diameter. A moderate correlation between the number of storage roots per plant and storage root yield was observed, an indication that genotypes with the higher number of storage roots per plant will be beneficial for storage root yield increase, as suggested by Pellet and El-Sharkawy [45]. In 2019, a weak correlation of SPAD with storage root yield was observed, while a positive and negative trend was observed in the 2018 growing season. SPAD values explained approximately up to a maximum of 4.9% of the variation across the treatment effects in 2018 while a 9.4% variation was observed across the treatments (Figure 9).
The stepwise regression model was developed using lower Akaike Information Criteria (AIC) to arrive at the model explaining most variation. Stem dry matter, mean LAI, radiation use efficiency RUE and tuber number per plant were important factors in determining the root yield of cassava (Table 5). Biomass was strongly influenced by root yield, SPAD, leaf matter, HI mean LAI, tuber number and RUE (p < 0.001, R2 = 0.99).
For Stem yield, the most significant contributing factors were root yield, leaf matter, SPAD (chlorophyll), harvest index (HI), plant height (PH), root diameter, mean LAI, tuber number and RUE (p < 0.001, R2 = 0.99).

4. Discussion

The increasing importance of cassava production and the role of NPK fertilization in highly poor weathered Chromi-haplic Acrisol soils was studied in the Mansa district of the Luapula province of Zambia under rain-fed conditions. This study aimed at understanding the interaction of NPK fertilization regimes and genotypic variation on RUE, light interception, yield and yield components of cassava. Significant differences in cassava cultivar response to fertilization regimes across seasons were clear. Cassava RUE, biomass, storage root yield and related yield components (plant height, LAI, SPAD, HI, stem yield, tuber number and root diameter) were dependent on varietal and fertilization responses. Root yield was determined by stem dry matter, mean LAI, radiation use efficiency RUE and tuber number per plant, while plant biomass was strongly influenced by root yield, SPAD, leaf matter, HI mean LAI, tuber number and RUE. In addition, stem yield is highly influenced by root yield, leaf matter, SPAD (chlorophyll), harvest index (HI), plant height (PH), root diameter, mean LAI, tuber number and RUE. These findings were supported by stepwise regression (Table 5).
Fertilization regimes had a significant effect on all phenological and morpho-physiological stages across seasons (Table 2 and Table 3, Figure 3, Figure 4, Figure 5 and Figure 6). The pattern of LAI and light interception followed a pattern that corresponds to moisture availability during cassava growth (Figure 1, Figure 2, Figure 3 and Figure 6). A high LAI and light interception between 90–180 DAP were reported, which was in line with changes in evapotranspiration [33]. However, a sudden fall in LAI and light interception was observed after 200 DAP (Figure 3). Maximum canopy size and dry matter partitioning to the leaves and stems observed in this study have been reported in several other studies [46,47]. However, studies indicate that during drought stress, LAI, light interception and dry matter partitioning to stems and leaves reduces rapidly as photo-assimilates are mostly channelled to the growth of storage roots and only increase after the resumption of rainfall as reported in some studies [20,48].
Fertilization regimes had a significant net effect on the growth of cassava biomass (TDM) and root yield (RDM) across seasons and varieties (Figure 4). In addition, there was a remarkable increase in cassava biomass and root yield on the fifth and sixth harvest with fertilization regimes of fertilizer + lime and fertilizer-only treatment showing root bulking strength as compared to lime treatment and the control. In comparison to canopy development storage, root biomass was utterly nonexistent in the first two to three months after planting as root growth was limited to the fibrous root system (Figure 4). However, with fertilization treatments M2 and M4, V1 produced a significantly higher final root yield compared to V2 followed by V3. Pellet and El-Sharkawy [23] observed significant variation in varietal responses to fertilization for a study conducted on the hillside of Columbia under different fertilization regimes. From the results, it was observed that fertilization increased the cassava varietal root bulking and this indicates that cassava supplemented with NPK fertilization would have reduced time to harvesting.
In the second year, there was a better crop establishment, which led to better biomass and storage root yield as a result of better RUE. All three cultivars showed significant variation in the value of light extinction coefficient (K) both in year one and year two with a strong positive response to fertilization (Figure 5). However, differential responses in K values did not reflect the variation of radiation use efficiency (RUE). All genotypes showed a significant increase in RUE in response to fertilization (Figure 6). Variety V1 had the highest RUE followed by V2 and the least was V3. Pellet and El-Sharkawy [22] observed a significant genotypic response of K to fertilization. Our RUE ranged from 1.2–2.2 gDM MJ−1 PAR intercepted across the cropping seasons and fell within the range of 1.15–2.30 gMJ−1 and the lower range of 1.4 gMJ−1 obtained by Pellet and El-Sharkawy [23] and Veltkamp [33], respectively. Our RUE value did not surpass the highest value of 2.3 gMJ−1 obtained by Pellet and El-Sharkawy [23] due to the reason that our short growing rainy season in Southern Africa only lasts for 150 days, followed by a drought period, which results in low biomass production due to moisture stress. Response variations in fertilization regimes were observed, NPK fertilizer in combination with lime and NPK fertilizer only regimes increased varietal RUE. Surprisingly, the RUE response of varieties was also reflected and showed that the application of NPK+ liming and NPK fertilizer only increased the light extinction coefficient (K) with varying varietal response in comparison to lower K values for limed and unfertilized treatments. Pellet and El-Sharkawy [23] reported significantly increased K-values in the four cultivars with notable variations in genotypes under fertilization.
The application of NPK fertilizer significantly increased storage root yield, morphophysiological traits and yield components of cassava. Significant cultivar responses were observed on biomass, stems biomass, HI, storage root diameter, number of storage roots per plant, plant height, seasonal LAI, light extinction coefficient(K) and SPAD to fertilization (p = 0.05). However, during the extended dry season, we observed a sharp decline in SPAD, LAI and biomass production (Figure 8). On average, a stronger genotypic increment in the variables studied here was associated mainly with fertilization regime: M2 (NPK fertilizer + lime) and M4 (NPK fertilizer) than M1 (lime) and (without lime nor NPK fertilizer) application. The morphological and physiological traits were significantly and positively correlated with the storage root yield of cassava (Table 4 and Figure 9). For instance, fertilization increased mean LAI due to increased leaf size and resulted in a significant correlation with storage root yield across the seasons indicating the important role LAI plays in determining the storage root yield of cassava [49]. Cock et al. [31] also found that the storage root dry yield of cassava was highly dependent on an incremental LAI of 3 to 4 during most of the growth period of cassava, implying that an increase in LAI improves storage root yield. In addition, our seasonal LAI was reflected in cultivars V1, V2 and V3 in response to NPK fertilization, an indication that genotypes responded inherently differently (Figure 3 and Figure 6). It is noteworthy to underscore that the response curve follows an optimum curve, producing a decline of root yield when LAI passes beyond 4–5. It is possible that canopy structures such as leaf orientation, carbon fixation and assimilation as well as partitioning could be physio-genetic factors possibly influencing the storage root yield differences in varietal responses to fertilization regimes. Several other studies have identified HI as a vital trait with a stronger correlation with storage root yield in cassava, hence, recommended as a significant trait for storage root yield selection [50,51]. This implication means that a higher yield can quickly be achieved by increasing sink storage root strength. However, in other studies modification of source characteristics such as photosynthetic capacity, LAI and RUE have been the key traits associated with an increased storage root yield [52]. This is in line with our study findings where LAI and RUE were critical for root yield (Table 4 and Table 5). This study also confirms the importance of HI in the root yield determination under fertilized and unfertilized conditions for cassava grown under rain-fed conditions with a high degree of accuracy (Figure 9A and Table 2 and Table 4).
Source activity such as RUE, a carbon fixation related trait, and storage root yield showed a significant and positive correlation in our present study (Table 4). In addition, RUE, mean LAI and tuber number strongly contributed to cassava yield, stem yield and biomass among influential traits (Table 5). El-Sharkawy and Tafur, [52] and El-Sharkawy et al. [53] found a similar relationship of a source activity (net photosynthesis) versus storage root yield in a wide range of cassava cultivars grown in optimal soil conditions. In addition, positive significant correlations for the number of storage roots per plant and root diameter versus storage root yield were observed across seasons (Table 4). Fertilization had a significant positive effect on number of storage roots and root diameter, although factors responsible for this remain unclear. These findings are in agreement with Pellet and El-Sharkawy [45], whose findings relate to our present study outcome. In cassava, it appears that certain conditions can be a sink limitation where the storage root number is considered as a sink strength indicator. Cock, et al. [31] pointed that sink limitation occurs at less than nine storage roots per plant, although this number is approximately lower than our varietal mean number of ten storage roots per plant obtained under this study. This is an indication that varieties used in this study can utilize assimilates effectively and produce the much-needed dry matter. It was also observed that cassava varieties had a positive incremental response to fertilizer on the number of storage roots per plant (Figure 7). This could be an indication that varietal yield responses to NPK depend on the optimum balance between sink and source. Similar results were obtained when cassava varieties were observed in response to different P fertilizer levels [45].
The overall response of cassava genotypes to NPK fertilization and liming (M2) resulted in a significant increase of dry storage roots, fresh storage root yield, stem dry matter, fresh biomass and dry biomass in comparison to liming only (M1) and the control (M3) (Figure 6 and Table 2 and Table 3). Similar genotypic responses were obtained with NPK fertilizer M4. However, no fertilizer by genotype interaction was found. Comparable results were reported by Pellet and El-Sharkawy, [23] where NPK fertilization significantly increased cassava root yield with a stronger varietal response to NPK fertilization on M Col1684 and CMC40 varieties. Moderate NPK fertilization is essential for maintaining soil fertility and yield in cassava cropping systems [7]. Interestingly, a recent study conducted in South Western Nigeria on tillage, plant density, weed control and fertilizer application in cassava also showed that fertilizer significantly increased yields even at a higher plant population of 12,500 [54].
Treatments such as liming and the control did not show a significant response to cassava variety growth and yield parameters, compared to fertilizer + lime and fertilizer-only treatments (p = 0.05). Root yield and yield components did not show a significant incremental response to liming probably because our liming was too short-term to produce any effect. The unfertilized treatment provided a baseline to which responses of all other treatments were compared. In contrast, liming is believed to show the existence of genetic differences in the tolerance of acid soils among cassava cultivars [55]. Lime is known to increase cassava yields in soils where pH is low to neutral by offsetting soil acidity which improves the availability of plant nutrients such as Mg and Ca in low pH soils [4]. Although lime can be used to ameliorate soil acidity on such soils under continuous cultivation, its residual effect is short especially in kaolinitic and oxidic soils characterized by high rainfall [2,4]. The lack of response in root yield, biomass, physiological and yield components to the lime application could be due to the highly weathered and leached soils that may require continuous liming till soil acidity is ameliorated to avail nutrients for plant growth (Table 1 and Table 3). However, it is expected that long-term application of lime could help reduce soil acidity in the northern part of Luapula province and stabilize cassava yields as observed in our study. This could be attributed to the fact that all essential elements from our soil analysis results were below the minimum requirement thresholds for cassava productivity (Table 1).

5. Conclusions

This study showed that applying NPK fertilizer + lime or NPK fertilizer only treatments significantly resulted in higher yield when compared to lime or the control in cassava cropping systems. Furthermore, the study revealed that RUE, Mean LAI and number of tubers per plant were the most yield determinant factors in cassava.
Our results show the importance of integrated soil fertility management (ISFM) in achieving higher root yield, physiology and morphological traits under the rain-fed conditions in Chromi-haplic Acrisol low-nutrient soils in the northern belts of Zambia. The study highlights the importance of an improved variety of use and fertilization as a way of improving cassava yields in nutrient exhausted soils.
Further, a cassava yield advantage of 57.79% was achieved when the highest yielding improved variety (V1) with NPK fertilizer and lime treatment was applied compared to using low yielding variety (V3) without fertilizer or lime. These results give hope to farmers intending to raise cassava productivity using balanced NPK fertilization and improve the response of high yielding varieties in just 12 months after planting. The cost of fertilizer is only half of the additional revenue through increased yields, therefore the government is urged to support fair pricing of fertilizer and promotion of extension services on fertilizer use in cassava. In addition, fertilization could help farmers harvest cassava early and increase their profitability due to reduced time to maturity (early bulking). In conclusion, NPK fertilizer + lime and NPK fertilizer treatments may be adopted to increase the response of cassava varietal yield, physiology and morphological traits in low soil nutrient conditions under high rain-fed conditions.

Author Contributions

Conceptualization, S.M., P.K., D.M.-N., E.W., M.C., B.H.C., K.M. and H.S.; methodology, S.M., H.S., K.M.; investigation, S.M.; resources, E.W. and H.S., data analysis, S.M., D.M.-N., data curation, S.M.; writing—original draft preparation, S.M.; writing—review and editing, S.M., P.K., D.M.-N., E.W., M.C., B.H.C., K.M. and H.S.; supervision, H.S. and K.M. All authors have read and agreed to the published version of the manuscript.

Funding

The research was funded by the Food Security for Rural Zambia (FoSeZa) project through the German Federal Ministry of Food and Agriculture BMEL [2813FSNU11]. The publication of this article (article processing charge) was funded by the Open Access Fund of the Leibniz University Hannover.

Acknowledgments

We are grateful to the technical staff at Zambia Agriculture Institute (ZARI) in Mansa for their assistance in trial management and other field evaluations during our work as well as Steven Gronau from the FoSeZa project for facilitating research logistics. Special thanks go to Dietrich E Leihner, of Universitaet Hohenheim, for manuscript review and for making useful suggestions.

Conflicts of Interest

The authors declare no conflict of interest.

References

  1. Kaluba, P.; Mwamba, S.; Moualeu-Ngangue, D.P.; Chiona, M.; Munyinda, K.; Winter, E.; Stützel, H.; Chishala, B.H. Cropping Practices and Effects on Soil Nutrient Adequacy Levels and Cassava Yield of Smallholder Farmers in Northern Zambia. Int. J. Agron. 2021, 2021, 12. [Google Scholar] [CrossRef]
  2. Sanchez, P.A.; Buresh, R.J.; Calhoun, F.; Shepherd, K.D.; Soule, M.J.; Place, F.M.; Buresh, R.J.; Izac, A.-M.N.; Mokwunye, A.U.; Kwesiga, F.R.; et al. Soil fertility replenishment in Africa: An investment in Natu Sanchez, Pedro A. Ral Resource Capital. In Replenishing Soil Fertility in Africa; American Society of Agronomy, Inc.: Madison, WI, USA, 1997; Volume 51. [Google Scholar] [CrossRef]
  3. El-Sharkawy, M.A.; Mejia de Tafur, S.; López, Y. Cassava productivity, photosynthesis, ecophysiology, and response to environmental stresses in the tropics: A multidisciplinary approach to crop improvement and sustainable production. In Cassava in the Third Millennium: Modern Production, Processing, Use, and Marketing Systems; Publicación CIAT No. 377; Bernardo, O.P., Hernán, C., Eds.; Centro Internacional de Agricultura Tropical (CIAT); Latin American and Caribbean Consortium to support Cassava Research and Development (CLAYUCA); Technical Centre for Agricultural and Rural Cooperation (CTA): Cali, CO, USA, 2012; pp. 29–88. [Google Scholar]
  4. Howeler, R.H. Cassava mineral nutrition and fertilization. Cassava Biol. Prod. Util. 2001, 1, 115–147. [Google Scholar] [CrossRef] [Green Version]
  5. Haynes, R.J. Effects of liming on phosphate availability in acid soils—A critical review. Plant Soil 1982, 68, 289–308. [Google Scholar] [CrossRef]
  6. Ezui, K.S.; Franke, A.C.; Leffelaar, P.A.; Mando, A.; van Heerwaarden, J.; Sanabria, J.; Sogbedji, J.; Giller, K.E. Water and radiation use efficiencies explain the effect of potassium on the productivity of cassava. Eur. J. Agron. 2017, 83, 28–39. [Google Scholar] [CrossRef]
  7. Howeler, R.H. Long-term effect of cassava cultivation on soil productivity. Field Crop. Res. 1991, 26, 1–18. [Google Scholar] [CrossRef]
  8. Kelly, V. Factors Affecting Demand for Fertilizers in SubSaharan Africa; Agriculture and Rural Development Discussion Paper 23; The World Bank: Washington, DC, USA, 2006. [Google Scholar]
  9. Fening, J.O.; Gyapong, T.A.; Ababio, F.; Gaisie, E. Effect of site characteristics on the productivity and economic returns from cassava legume intercropping in ghana. Afr. J. Environ. Sci. Technol. 2009, 3, 326–331. [Google Scholar]
  10. Pypers, P.; Sanginga, J.M.; Kasereka, B.; Walangululu, M.; Vanlauwe, B. Increased productivity through integrated soil fertility management in cassava-legume Intercropping Systems in the Highlands of Sud-Kivu, DR Congo. Field Crop. Res. 2010, 120, 76–85. [Google Scholar] [CrossRef]
  11. Howeler, R. Sustainable Soil and Crop Management of Cassava in Asia: A Reference Manual; International Center for Tropical Agriculture: Cali, CO, USA, 2014. [Google Scholar]
  12. Vanlauwe, B.; Descheemaeker, K.; Giller, K.E.; Huising, J.; Merckx, R.; Nziguheba, G.; Wendt, J.; Zingore, S. Integrated soil fertility management in sub-Saharan africa: Unravelling local adaptation. Soil 2015, 1, 491–508. [Google Scholar] [CrossRef] [Green Version]
  13. Alamu, E.O.; Ntawuruhunga, P.; Chibwe, T.; Mukuka, I.; Chiona, M. Evaluation of Cassava processing and utilization at household level in Zambia. Food Secur. 2019, 11, 141–150. [Google Scholar] [CrossRef] [Green Version]
  14. Alene, D. Economic impacts of cassava research and extension in Malawi and Zambia. J. Dev. Agric. Econ. 2013, 5, 457–469. [Google Scholar] [CrossRef] [Green Version]
  15. Haggblade, S.; Nyembe, M. Commercial Dynamics in Zambia’s Cassava Value Chain: Cassava Transformation in Southern Africa (CATISA); Food Security Research Project: Lusaka, Zambia, 2007. [Google Scholar]
  16. Barratt, N.; Chitundu, D.; Dover, O.; Elsinga, J.; Eriksson, S.; Guma, L.; Haggblade, M.; Haggblade, S.; Henn, T.O.; Locke, F.R.; et al. Cassava as drought insurance: Food security implications of cassava trials in central Zambia. Agrekon 2006, 45, 106–123. [Google Scholar] [CrossRef] [Green Version]
  17. Chitundu, M.; Droppelmann, K.; Haggblade, S. A Value Chain Task Force Approach for Managing Privatepublic Partnerships: Zambia’s Task Force on Acceleration of Cassava Utilisation; Working Paper No. 21; Food Security Research Project: Lusaka, Zambia, 2006; p. 32. Available online: https://ageconsearch.umn.edu/record/54480/ (accessed on 22 January 2021).
  18. Pypers, P.; Bimponda, W.; Lodi-Lama, J.P.; Lele, B.; Mulumba, R.; Kachaka, C.; Boeckx, P.; Merckx, R.; Vanlauwe, B. Combining mineral fertilizer and green manure for increased, profitable cassava production. Agron. J. 2012, 104, 178–187. [Google Scholar] [CrossRef]
  19. El-Sharkawy, M.A. Prospects of photosynthetic research for increasing agricultural productivity, with emphasis on the tropical c4 amaranthus and the cassava c3-c4 crops. Photosynthetica 2016, 54, 161–184. [Google Scholar] [CrossRef]
  20. Ezui, K.S.; Franke, A.C.; Mando, A.; Ahiabor, B.D.K.; Tetteh, F.M.; Sogbedji, J. Fertiliser requirements for balanced nutrition of cassava across eight locations in west africa. Field Crop. Res. 2015, 185, 69–78. [Google Scholar] [CrossRef] [Green Version]
  21. Alves, A.A.C. Cassava botany and physiology. Cassava Biol. Prod. Util. 2002, 1, 67–89. [Google Scholar] [CrossRef]
  22. Byju, G.; Suja, G. Mineral nutrition of cassava. Adv. Agron. 2020, 159, 169–235. [Google Scholar] [CrossRef]
  23. Pellet, D.M.; El-Sharkawy, M.A. Cassava varietal response to fertilization: Growth dynamics and implications for cropping sustainability. Exp. Agric. 1997, 33, 353–365. [Google Scholar] [CrossRef]
  24. Spiertz, J.H.J. Nitrogen, Sustainable agriculture and food security. A review. Agron. Sustain. Dev. 2010, 30, 43–55. [Google Scholar] [CrossRef] [Green Version]
  25. Sinclair, T.R.; Horie, T. Leaf nitrogen, photosynthesis, and crop radiation use efficiency: A Review. Crop SC 1989, 29, 90–98. [Google Scholar] [CrossRef]
  26. Luening, R.; Kelliher, F.M.; De Pury, D.G.G.; Schulze, E.-D. Leaf nitrogen, photosynthesis, conductance and transpiration: Scaling from leaves to canopies. Plant. Cell Environ. 1995, 18, 1183–1200. [Google Scholar] [CrossRef]
  27. Day, A.D.; Ludeke, K.L. Plant Nutrients in Desert Environments; Springer: Berlin/Heidelberg, Germany, 2003. [Google Scholar] [CrossRef]
  28. Howeler, R. Mineral Nutrition and Fertilization of Cassava; Centro Internacional de Agricultura Tropical (CIAT): Cali, CO, USA, 1981. [Google Scholar]
  29. Martin, M.H.; Marschner, H. The Mineral Nutrition of Higher Plants. J. Ecol. 1988, 76, 1250. [Google Scholar] [CrossRef] [Green Version]
  30. Dinh, T.H.; Watanabe, K.; Takaragawa, H.; Nakabaru, M.; Kawamitsu, Y. Photosynthetic response and nitrogen use efficiency of sugarcane under drought stress conditions with different nitrogen application levels. Plant Prod. Sci. 2017, 20, 412–422. [Google Scholar] [CrossRef] [Green Version]
  31. Cock, J.H.; Franklin, D.; Sandoval, G.; Juri, P. Ideal cassava plant for maximum yield. Crop Sci. 1979, 19, 271–279. [Google Scholar] [CrossRef]
  32. Lenis, J.I.; Calle, F.; Jaramillo, G.; Perez, J.C.; Ceballos, H.; Cock, J.H. Leaf retention and cassava productivity. Field Crop. Res. 2006, 95, 126–134. [Google Scholar] [CrossRef]
  33. Veltkamp, H.J. Physiological Causes of Yield Variation in Cassava (Manihot Esculenta Crantz); Agricultural University Wageningen: Wageningen, The Netherlands, 1985. [Google Scholar]
  34. Keating, B.A.; Evenson, J.; Fukai, S. Environmental effects on growth and development of cassava (Manihot Esculenta Crantz.) i. Crop development. Field. Crop. Res. 1982, 5, 271–281. [Google Scholar] [CrossRef]
  35. Ezui, K.S.; Franke, A.C.; Ahiabor, B.D.K.; Tetteh, F.M.; Sogbedji, J.; Janssen, B.H.; Mando, A.; Giller, K.E. Understanding cassava yield response to soil and fertilizer nutrient supply in west africa. Plant Soil 2017, 420, 331–347. [Google Scholar] [CrossRef] [Green Version]
  36. Nhamo, N. Evaluating yield gaps in cassava production systems in Zambia. In Proceedings of the World Congress on Root and Tuber Crops, Nanning, China, 18–22 January 2016. [Google Scholar]
  37. Chapoto, A.; Chabala, L.; Lungu, O. A long history of low productivity in Zambia: Is it time to do away with blanket recommendations? Zambia Soc. Sci. J. 2016, 6, 6. [Google Scholar]
  38. Tsuji, T.; Mambo, A.; Phiri, L.K.; Msoni, R.; Sokotela, S.B.; Yerokun, O.A. Studies on nutrient distribution in some Zambian soils with special reference to sulphur using GIS (Geographic Information Systems) II. Evaluation of plant-available sulphur and its distribution in major Zambian soils. Soil Sci. Plant Nutr. 2005, 51, 943–952. [Google Scholar] [CrossRef]
  39. Fukuda, W.M.G.; Guevara, C.L.; Kawuki, R.; Ferguson, M.E. Selected Morphological and Agronomic Descriptors for the Characterization of Cassava; IITA: Ibadan, Nigeria, 2010; Volume 19. [Google Scholar]
  40. Manrique, L.A.; Kinry, J.R.; Hodges, T.; Axness, D.S. Dry matter production and radiation interception of potato. Crop Sci. 1991, 31, 1044. [Google Scholar] [CrossRef]
  41. R Core Team. R: A Language and Environment for Statistical Computing; The R Project for Statistical Computing: Vienna, Austria, 2020; Available online: http://www.r-project.org/index.html (accessed on 22 January 2021).
  42. Zhang, L.; Hu, Z.; Fan, J.; Zhou, D.; Tang, F. A meta-analysis of the canopy light extinction coefficient in terrestrial ecosystems. Front. Earth Sci. 2014, 8, 599–609. [Google Scholar] [CrossRef]
  43. Biratu, G.K. Effect of Chicken Manure application on cassava biomass and root yields in two agro-ecologies of Zambia. Agriculture 2018, 8, 45. [Google Scholar] [CrossRef] [Green Version]
  44. Biratu, G.K.; Elias, E.; Ntawuruhunga, P.; Sileshi, G.W. Cassava response to the integrated use of manure and NPK fertilizer in Zambia. Heliyon 2018, 4, e00759. [Google Scholar] [CrossRef] [Green Version]
  45. Pellet, D.; El-Sharkawy, M.A. Cassava Varietal response to phosphorus fertilization. ii. phosphorus uptake and use efficiency. Field Crop. Res. 1993, 35, 13–20. [Google Scholar] [CrossRef]
  46. Lahai, M.T.; Ekanayake, I.J. Accumulation and distribution of dry matter in relation to root yield of cassava under a fluctuating water table in inland valley ecology. Afr. J. Biotechnol. 2009, 8, 4895–4905. [Google Scholar]
  47. Howeler, R.H.; Cadavid, L.F. Accumulation and distribution of dry matter and nutrients during a 12-month growth cycle of cassava. Field Crop. Res. 1983, 7, 123–139. [Google Scholar] [CrossRef]
  48. Alves, A.A.; Setter, T. response of cassava to water deficit: Leaf area growth and abscisic acid. Crop Sci. 2000, 40, 131–137. [Google Scholar] [CrossRef]
  49. Cock, J.H.; El-Sharkawy, M.A. The Physiological Response of Cassava to Stress In Proceedings of the VIIth Symposium of the International Society for Tropical Root Crops, Gosier, Guadeloupe, French, 1–6 July 1985.
  50. Karim, K.Y.; Ifie, B.; Dzidzienyo, D.; Danquah, E.Y.; Blay, E.T.; Whyte, J.B.A.; Kulakow, P.; Rabbi, I.; Parkes, E.; Omoigui, L.; et al. Genetic characterization of cassava ( Manihot Esculenta Crantz ) genotypes using agro-morphological and single nucleotide polymorphism markers. Physiol. Mol. Biol. Plants 2020, 26, 317–330. [Google Scholar] [CrossRef] [Green Version]
  51. Kawano, K.; Daza, P.; Amaya, A.; Rios, M.; Goncalves, W.M.F. T Evaluation of cassava germplasm for productivity. Crop Sci. 1978, 18, 8–11. [Google Scholar] [CrossRef]
  52. El-sharkawy, M.A.; Tafur, S.M.D. Eco-Physiological Research for Breeding Improved Cassava Cultivars in improved cassava cultivars in favourable and stressful environments in tropical/subtropical biosystems. Environ. Res. J. 2014, 6, 144–211. [Google Scholar]
  53. El-Sharkawy, M.A.; Cock, J.H.; Lynam, J.K.; del Pilar Hernàndez, A.; Cadavid, L.F.L. Relationships between Biomass, Root-Yield and Single-Leaf Photosynthesis in Field-Grown Cassava. Field Crop. Res. 1990, 25, 183–201. [Google Scholar] [CrossRef]
  54. Onasanya, O.O.; Hauser, S.; Necpalova, M.; Salako, F.K.; Kreye, C.; Tariku, M.; Six, J.; Pypers, P. On-Farm Assessment of Cassava Root Yield Response to Tillage, Plant Density, Weed Control and Fertilizer Application in Southwestern Nigeria. Field Crop. Res. 2021, 262, 108038. [Google Scholar] [CrossRef]
  55. Manrique, L.A. Response of cassava to liming on a strongly acid ultisol of Panama. Commun. Soil Sci. Plant Anal. 1987, 18, 115–130. [Google Scholar] [CrossRef]
Figure 1. Cumulative daily rainfall (mm) as recorded at Mansa Zambia Agricultural Research Station (ZARI) during two experimental seasons (2017/18 and 2018/19).
Agronomy 11 01757 g001
Figure 2. Evapotranspiration-ETo (mm/day) of cassava canopy at Zambia Agricultural Research Station (ZARI) in Mansa during two experimental seasons (2017/18 and 2018/19 season).
Agronomy 11 01757 g002
Figure 3. Leaf area index (a) and fraction light interception (b) dynamics of different cassava varieties as affected by different fertilizer regimes. Key: M1 = lime application only, M2 = fertilizer and lime, M3 = no fertilizer and no lime (low input farmer practice) and M4 = fertilizer application only. V1 = Mweru, V2 = Bangweulu and V3 = Katobamputa during the two agricultural seasons 2018 and 2019.
Agronomy 11 01757 g003
Figure 4. Biomass (TDM—total dry matter) (a) and root yield (RDM—root dry matter) (b) dynamics of different cassava varieties as affected by different fertilizer regimes. Key: M1 = lime application only, M2 = fertilizer and lime, M3 = no fertilizer and no lime (low input farmer practice) and M4 = fertilizer application only. V1 = Mweru, V2 = Bangweulu and V3 = Katobamputa during the two agricultural seasons 2018 and 2019.
Agronomy 11 01757 g004
Figure 5. An illustration of cassava canopy extinction coefficients (K) of cassava genotypes. Each slope corresponds to radiation use efficiency (RUE) according to treatment effects for different harvesting periods for the 2017/18 and 2018/19 seasons, respectively. Key: M1 = lime application only, M2 = fertilizer and lime, M3 = no fertilizer and no lime (low input farmer practice) and M4 = fertilizer application only. V1 = Mweru, V2 = Bangweulu and V3 = Katobamputa.
Agronomy 11 01757 g005
Figure 6. The relationship between the cumulative cassava biomass produced and cumulative amounts of intercepted photosynthetic radiation (IPAR) for different harvesting periods for the 2017/18 and 2018/19 season, respectively (A,B) presents RUE for 2017/18 and 2018/19 seasons. Each slope corresponds to radiation use efficiency (RUE) according to treatment effects. Key: M1 = lime application only, M2 = fertilizer and lime, M3 = no fertilizer and no lime (low input farmer practice) and M4 = fertilizer application only. V1 = Mweru, V2 = Bangweulu and V3 = Katobamputa.
Agronomy 11 01757 g006
Figure 7. Box plots of (A) root yield and (BG) are cassava yield components, and (H) is green canopy trait of mean values per genotype and season (2018 and 2019) for the different fertilization regimes M1 = lime only, M2 = Fertilizer + Lime, M3 = no fertilizer, no lime (traditional low resource farmer management), M4 = Fertilizer only, V1 = Mweru, V2 = Bangweulu, V3 = Katobamputa. Significance codes are indicated for different treatment effects as 0 ‘***’ 0.001; ‘**’ 0.01; ‘*’ 0.05, ns: not significant above boxplots within the figure.
Agronomy 11 01757 g007
Figure 8. Line plots dynamics of (AC) are: harvest index (%), SPAD and plant height (cm) are cassava yield components of mean values per genotype at different fertilizer treatments management options. M1 = liming only, M2 = Fertilizer + lime, M3 = no fertilizer, no lime (traditional low-resource farmer management) and M4 = fertilizer only for two seasons (2018 and 2019). V1 = Mweru, V2 = Bangweulu, V3 = Katobamputa are cassava genotypes (clones).
Agronomy 11 01757 g008
Figure 9. Regression plots between dry root yield and selected yield components (AF) present correlations of dry root yield versus HI (harvest index), biomass, plant height, number of tubers per plant, root diameter and SPAD. M1 = lime only, M2 = fertilizer + lime, M3 = no fertilizer, no lime (traditional low resource farmer management), M4 = fertilizer only as different fertilization regimes. V1 = Mweru, V2 = Bangweulu, V3 = Katobamputa are different varieties.
Agronomy 11 01757 g009
Table 1. Selected physio-chemical properties of the topsoil (0–30 cm depth) of the experimental site at Zambia Agricultural Research Institute (ZARI) at Mansa.
ParameterUnitMean 2018Mean 2019Cassava Suitability Production Levels
pH (CaCl2)-4.474.494.5–7.0
Total N%0.220.240.20–0.50
Org C%0.230.292.0–4.0
Exchangeable P(cmol kg−1)2.62.710–14
Exchangeable K(cmol kg−1)0.080.080.15–2.5
Exchangeable Ca(cmol kg−1)0.870.951.0–5.0
Exchangeable Mg(cmol kg−1)0.170.210.4–1.0
Exchangeable Na(cmol kg−1)0.0040.002
Micronutrients
Zn(mg kg−1)0.610.580.5–1.0
Cu(mg kg−1)5.125.190.1–0.3
Mn (mg kg−1)50495–10
Fe(mg kg−1)72691–10
Particle size (%)
Sand 7473
Clay 4.34.2
Silt 20.720.4
Textural class sandy clay loam sandy clay loam
Cassava suitability production levels. Source: Howeler, 2011.
Table 2. Analysis of the variance for genotypic, year and fertilization effects and their interaction effects on yield, physiological and morphological plant traits using linear mixed model during the 2017/18 and 2018/19 season (year effect).
TraitFertilityVarietyYearFertility:VarietyFertility:YearVariety:YearFertility:Variety:Year
Seasonal LAI******ns********ns
Stem yield *********ns****ns
Fresh root yield********ns***ns**
Root yield*********ns*nsns
Fresh biomass*********ns*****
Dry biomass*********ns***nsns
Harvest index*******nsns*ns
Tuber number******ns****nsns
Root diameter******ns**nsnsns
Plant height******ns*******ns
SPAD**********nsns
Significant codes: ‘***’ 0.001; ‘**’ 0.01; ‘*’ 0.05; ns: not significant.
Table 3. Cassava yield and biomass as affected by the different fertilization regimes and variety averaged across two growing seasons (2017/2018 and 2018/2019).
TreatmentsTraits
Fertilization RegimesVarietyFresh Root Yield
(gm−2)
Dry Root Yield
(gm−2)
Fresh Biomass
(gm−2)
Dry Biomass
(gm−2)
ControlV11891ab823abc3044abcd1294bcd
V21658ab710ab2766abc1187abc
V31370a603a2398a1044a
LimeV12072abc818abc3257abcd1309bcd
V21874ab710ab2996abcd1206abc
V31564ab608a2684ab1082ab
Fertilizer onlyV12834cd1096de4340e1698fg
V22242abcd921bcd3628cde1509def
V32363bcd826bc3669de1340cde
Fertilizer + limeV13012d1162e4504e1768g
V22401bcd952cde3844de1558efg
V31975abc787abc3363bcd1328cde
SE(Fertilizer)101.6 **22.2 ***97.7 ***25.2 ***
SE(Variety)73.1 ***19.3 ***74.3 ***19.9 ***
SE(Fertilizer × Variety)156.8 ns38.6 ns155.8 ns41.13 ns
Significant codes: ‘***’ 0.001; ‘**’ 0.01; ns: not significant, V1: Bangweulu, V2: Mweru and V3: Katobamputa. Values in the column followed by the same letter are not statistically different by Tukey’s honest significance test.
Table 4. Correlation coefficients (n = 36) for 2017/18 (1) and 2018/19 (2) growing season averaged across fertilizer management and variety.
TraitsYear Leaf YieldStem YieldRoot YieldBiomassHITuber NumberRoot DiameterPHSPADMeanLAIRUE
Leaf yield11
21
Stem yield10.664 ***1
20.639 ***1
Root yield10.731 ***0.449 **1
20.795 ***0.774 ***1
Biomass10.814 ***0.626 ***0.976 ***1
20.819 ***0.831 ***0.993 ***1
HI10.272 ***−0.217ns0.755 ***0.599 ***1
20.572 ***0.499 **0.901 ***0.849 ***1
Tuber number10.732 ***0.671 ***0.7601 **0.831 ***0.333 *1
20.718 ***0.694 ***0.776 ***0.799 ***0.589 ***1
Root diameter10.603 ***0.595 ***0.761 ***0.809 ***0.389 *0.666 ***1
20.653 ***0.758 ***0.807 ***0.827 ***0.648 ***0.666 ***1
PH10.814 ***0.771 ***0.662 ***0.772 ***0.175 ns0.743 ***0.752 ***1
20.599 ***0.556 ***0.691 ***0.697 ***0.543 **0.582 ***0.743 ***1
SPAD10.820 ***0.591 ***0.758 ***0.815 ***0.398 *0.788 ***0.683 ***0.807 ***1
20.668 ***0.541 **0.691 ***0.703 ***0.547 **0.633 ***0.715 ***0.616 ***1
MeanLAI10.696 ***0.567 ***0.870 ***0.898 ***0.558 ***0.896 ***0.755 ***0.759 ***0.826 ***1
20.749 ***0.807 ***0.892 ***0.911 ***0.728 ***0.839 ***0.837 ***0.648 ***0.636 ***1
RUE10.717 ***0.609 ***0.884 ***0.918 ***0.529 **0.862 ***0.823 ***0.759 ***0.772 ***0.905 ***1
20.835 ***0.743 ***0.898 ***0.909 ***0.730 ***0.838 ***0.749 ***0.603 ***0.882 ***0.624 ***1
Significant codes: ‘***’ 0.001; ‘**’ 0.01; ‘*’ 0.05.
Table 5. Stepwise linear regression model for root yield, biomass and stem yield.
Response VariablesVariablesRegression Coefficientp-ValueR2p-Value for Regression Model
Root yieldConstant−568.10<0.001 ***0.95<0.001
Stem Dry Matter0.280.28 ns
Mean LAI458.67<0.001 ***
Tuber Number−24.470.04 *
RUE291.690.02 *
BiomassConstant1492.02<0.001 ***0.99<0.001
Root yield1.55<0.001 ***
SPAD−3.010.02 *
Leaf Matter−0.810.06 ns
HI−25.17<0.001 ***
Mean LAI143.660.001 **
Tuber Number−4.710.15 ns
RUE11.660.72 ns
Stem yieldConstant348.980.09 ns0.99<0.001
Root yield−0.550.01 *
SPAD0.840.28 ns
Leaf Matter−0.750.01 *
HI−7.060.05 ns
Biomass0.67<0.001 ***
PH−0.090.52 ns
Root Diameter−0.610.10 ns
Mean LAI21.520.44 ns
Tuber Number−5.9620.001 **
RUE27.530.11 ns
Significant codes: ‘***’ 0.001; ‘**’ 0.01; ‘*’ 0.05; ns: not significant.
Publisher’s Note: MDPI stays neutral with regard to jurisdictional claims in published maps and institutional affiliations.

