Abstract
Potassium (K) has a significant effect on wheat yield and quality. Owing to the limitations of irrigation and production costs, soil-based applications of potassium fertilizer are not performed in wheat production on the Loess Plateau of China. In the late growth stage of wheat, potassium deficiency occurs even under sufficient nitrogen/phosphorus (N/P) levels, so it is necessary to supplement potassium through foliar spraying. However, there are few studies on the effect of the foliar application of potassium fertilizer (KFA) on wheat quality. Field experiments were conducted at two experimental sites for 2 years to study the effects of different potassium fertilizer application levels and periods on wheat yield and quality. The results showed that KFA had no significant effect on the yield of the wheat variety Xinong 20 (XN20) but increased the yield of the wheat variety Xiaoyan 22 (XY22). The improvement effect of KFA on the wet gluten content and stabilization time (ST) of XN20 was better than that on these parameters of XY22, while the sedimentation value (SV) and formation time (FT) showed the opposite trend. KFA significantly reduced the albumin content of the two varieties but had no significant effect on the globulin content. Compared with that at the other two stages, the potassium application in the form of potash fertilizer spray at a concentration of 60 mmol L−1 (K2) at the flowering stage (BBCH 65) significantly increased the protein content, wet gluten content, SV and gluten protein content in XN20 grains, whereas the application at 10 days after flowering (AA10, BBCH 71) at the K2 concentration was more beneficial to prolonging the dough FT. For XY22, the application of potassium fertilizer at the K2 concentration at the flowering stage increased the wet gluten and gluten protein levels and dough development time. There were significant genotypic differences in the composition and content of HMW-GS between the two varieties. KFA significantly increased the levels of the 1, 7 + 8, and 4 + 12 subunits in XN20 and the 1 subunit in XY22, but had no significant effect on the 2 + 12 subunit in XY22. Partial least squares path modelling (PLS-PM) analysis showed that the processing quality indexes (SV, FT, ST) and gluten protein and HMW-GS levels were regulated by the potassium fertilizer foliar spraying stage and concentration and revealed in part that KFA affected the processing quality by affecting the HMW-GS content.
1. Introduction
Wheat (Triticum aestivum L.) is a staple crop that is important for global food security [1]. With economic development and the improvement in living standards, there is an increasing demand for high-quality wheat. As the wheat yield increases, sufficient attention should be given to grain quality to achieve simultaneous growth in both quantity and quality [2,3]. Therefore, the identification of effective measures to improve wheat quality to meet the market demand for high-quality wheat is particularly important.
Potassium (K) is one of the essential nutrient elements for plants, and it is involved in photosynthesis, carbohydrate and protein formation, water and nutrient transport, and nitrogen utilization [4]. Therefore, it has significant effects on wheat yield and quality [5,6]. In Northwest China, the soil is traditionally considered to be rich in potassium [7], nitrogen and phosphate fertilizers are the main fertilizers used in wheat production, while potassium fertilizer is rarely applied. However, an increase in crop yield leads to a decrease in the soil potassium content, and the senescence of the root system in the late wheat growth stage weakens the plant’s nutrient absorption ability, which results in potassium shortages following wheat production [8].
Potassium deficiency has negative effects on the yield and quality of wheat [9], and reduces the quality and quantity of agricultural products [10,11]. The current literature indicates that at the global level, K is as limiting as N and P for plant productivity in terrestrial ecosystems [11]. Foliar fertilization increased corn height, leaf area, fresh matter, and yield [12]. However, improper foliage fertilization could also cause leaf wilt, thus reducing leaf effective surface and photosynthetic efficiency [13]. In addition, potassium deficiency leads to reductions in both the number and size of leaves produced, resulting in a decrease in the amount of photosynthetic assimilates available for growth and ultimately having strong negative effects on production yield and quality [9]. Therefore, supplementing potassium in the late stages of production is favourable for wheat production.
Foliar fertilization has many advantages over soil fertilization and can compensate for a lack of soil fertilization. As a supplementary means of basic fertilization, foliar spraying can improve crop nutrient absorption and transformation efficiency, which is often recommended in production. However, when large amounts of nutrients are needed for crop supply, the effect of foliar fertilization is limited [14]. Moreover, the spray concentration must be considered to avoid burning the leaves. The absorption rate and utilization efficiency of nutrients applied to crop leaves are much higher than those of fertilizers applied to soil [15]. Due to the complex soil environment and soil fertilization, the crop absorption efficiency was low, and foliar spraying of iron and magnesium is an ideal practice [16]. Compared with soil K fertilization, foliar application of potassium fertilizer (KFA) has the advantages of low cost and no restriction of irrigation conditions and can be combined with simultaneous insect control spray management (one spraying event with three prevention measures). For these reasons, KFA is of great significance in wheat production in northern China.
Protein components play an important role in nutritional quality and processing quality of grain [17], and are the main factors determining wheat quality [18]. It is generally believed that gliadin plays a major role in dough elongation, while gluten plays a major role in the elasticity or strength of the dough [2]. Among the rheological properties of wheat dough, the dough formation time (FT), stabilization time (ST), and sedimentation value (SV), which directly affect dough strength, are the most direct and accurate indexes reflecting the wheat processing quality [19]. Differences in the grain glutenin levels affect the dough FT, ST, and SV [20]. In addition, the high molecular weight glutenin subunit (HMW-GS) is an important component of grain protein, and its composition and content are important indicators of wheat processing quality [21]. Appropriate amounts of K fertilizer were shown to increase the wheat yield [22], and quality indexes such as the wet gluten content, SV, ST, protein content, and protein yield, especially the wet gluten content and protein content, were significantly increased [23]. Previous studies on the effect of potassium fertilizer on quality have mainly focused on soil potassium application, and there have been few studies on KFA.
Numerous studies have found that the influence of KFA on the grain weight and quality of wheat is complex. The effect of KFA on grain weight of different varieties differed greatly due to differences in the gluten types of wheat [24]. Variation in the amounts and periods of potassium application to soil resulted in large differences in yield and the rational application of potassium fertilizer could significantly improve wheat yield and quality [6]. The appropriate application of potassium fertilizer can increase the wheat yield and the crude protein content [25]. However, some studies have shown that the grain quality of wheat decreases after the application of potassium fertilizer [21]. Although there are many studies on the effect of potassium fertilizer application on wheat yield and quality, previous research has focused mainly on the effect of soil application of potassium fertilizer, and there are few studies on the effects of the amount and period of KFA.
It is well known that the potassium fertilizer has an effect on wheat yield and quality. In this study, different concentrations of potassium fertilizer were sprayed on the wheat leaves at three stages. The effects of foliar application of potassium on wheat grain yield, protein and protein components, wet gluten content, and dough mixing were studied. The characteristics and influence of quality indicators such as HMW-GSs were investigated, and whether HMW-GSs are closely related to the processing quality of wheat was determined to help guide the development of potassium farmland management measures suitable for local production.
2. Materials and Methods
2.1. Experimental Sites
Field experiments were conducted at the Crop Specimen Farm of Northwest A&F University (CSF, 34°160′ N, 108°4′ E; altitude 521 m) and Doukou wheat and maize test station (DK, 34°36′ N, 108°52′ E; altitude 427.4 m), Shaanxi Province, during 2016–2017 and 2017–2018. The soil type was loamy clay, and the soil physical and chemical properties and the temperature and rainfall are listed in Table 1 and Figure 1. In this study, two winter wheat varieties (provided by Northwest A&F University, Yangling, China), namely, the strong gluten wheat variety Xinong 20 (XN20) and the medium gluten wheat variety Xiaoyan 22 (XY22), were grown for experimentation. Nitrogen and phosphorus fertilizers were applied as basal fertilizers (soil tillage was used, and no herbicides, fungicides, or insecticides were applied) in one application of 150 kg ha−1 urea and 100 kg ha−1 diammonium phosphate, respectively. The wheat at CSF was sown on 12 October 2016 and 3 October 2017, and the wheat at DK was sown on 18 October 2016 and 10 October 2017. The seedling rate at all the test sites was 150 kg ha−1, and the row spacing was 0.25 m. Each test site was subjected to 24 treatments in a split-zone test design, and each treatment had three replicates with a plot size of 5 × 3 m.

Table 1.
Soil chemical properties of the 0–20 cm top soil.
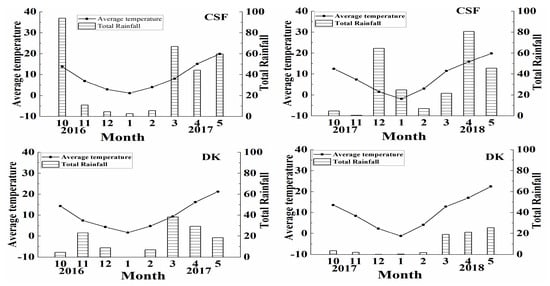
Figure 1.
Precipitation and temperature changes in the winter wheat growth season from 2016 to 2018. CSF: Crop specimen farm; DK: Doukou wheat and maize test station.
In this experiment, potassium chloride (KCl) was sprayed at the wheat booting stage (BBCH48), flowering stage (BBCH 65), and 10 days after flowering (AA10, BBCH 71). Potash fertilizer spray concentrations of 30 mmol L−1 (K1), 60 mmol L−1 (K2), and 90 mmol L−1 (K3) were used, and the spraying rate was 750 kg hm−2 at each application. An equal volume of deionized water was applied to control plants (CK). At each spraying time point, spraying was carried out from 17:00 to 19:00 every day for two consecutive days. The monthly rainfall and average air temperatures from sowing to harvest in the two crop seasons and the soil chemical properties of the topsoil (0–20 cm) are shown in Figure 1 and Table 1.
2.2. Experimental Design
2.2.1. Grain Yield Determination
Three 1 m2 areas in each plot (excluding the boundary) were selected, and the plants in those areas were harvested. The wheat grains were dried naturally and were used to measure the quality parameters. The number of spikes in each sampling area was counted to calculate the spikes per hectare. The kernel number of each spike was determined by counting the total number of grains on 50 spikes. Thousand-kernel weights were determined by randomly selecting 1000 kernels, with three replicates.
2.2.2. Determination of the Protein Content and Components, Wet Gluten Content, and Dough Rheological Properties
A near-infrared reflectance instrument (Diode Array 7200, Perten Instruments AB, Sweden) was used to estimate the protein content, wet gluten content, SV, dough ST, and FT of the grain, which were determined as described previously [26]. The sample plate with the instrument was filled with wheat grains and flattened. Then, the sample disc was put into the analysis position, and the analysis was started. Each test was conducted three times, and the average value of the test data was calculated. Three technical repetitions were performed per sample.
According to the solubility of proteins in various solvents, four protein components, namely, albumin, globulin, prolamin, and glutenin, were extracted in sequence according to a previous study [27]. Extraction of albumin was performed as follows: One gram of flour was weighed and placed in a test tube, and 10 mL of distilled water was added. Then, the mixture was oscillated for 30 min. The supernatant was centrifuged at 4000 r/min for 15 min and transferred to a 50 mL volumetric flask. After continuous extraction for three times, the supernatant was put into a 50 mL volumetric flask and the volume was measured. The extracts of globulin, gliadin, and glutelin were obtained in 10% NaCl, 75% ethanol, and 0.2% NaOH, respectively. The glutenin content was determined by biuret colorimetry [28], and the levels of the other three proteins were determined by Coomassie brilliant blue staining [29]. Each sample was measured three times on the basis of internal calibration, and the average value was calculated.
2.2.3. Quantification of HMW-GSs by Reversed-Phase High-Performance Liquid Chromatography (RP-HPLC)
The extraction and separation of glutenin were based on the method described by [30]. Samples were eluted by a Hitachi liquid chromatograph (coupled to D-2000 Elite HSM software, an L-2400 UV detector, an L-2300 column incubator, and an L-2130 pump) equipped with a Zobax 300SB-C18 analytical column (aperture 300, particle size 3.5 μm, 150 × 4.6 mm). Mobile solvents A and B were deionized water and acetonitrile, respectively, and each solvent contained 0.1% (v/v) trifluoroacetic acid. The injection volume was 20 mL, and the column temperature was maintained at 50 °C. Elution was performed at a flow rate of 1.0 mL min−1, and detection was performed by measuring the ultraviolet absorbance at 210 nm. The proteins were eluted with a linear gradient from 24 to 48% solvent B over 55 min with a 10-min equilibration period at a flow rate of 1.0 mL min−1. An initial isocratic condition with 24% solvent B was followed by a 50 min linear gradient from 24 to 56% solvent B. After each run, the column was cleaned with 90% solvent B (5 min) and equilibrated with the starting concentration of solvent B (10 min). The HMW-GS content was calculated from the area under the curve in the RP-HPLC chromatogram.
2.3. Data Analysis
The annual results were subjected to ANOVA and correlation analysis using SPSS 16.0 for Windows. The analysis was conducted by a split-plot design, and the mean value was analysed by the least significant difference (LSD) method, p = 0.05, LSD 0.05. In addition, partial least squares path modelling (PLS-PM) was used to show the relationships among the potassium fertilizer, protein content, HMW-GSs, and processing quality indexes. The degree to which latent variables (i.e., period and concentration of KFA, protein content, HMW-GSs, and processing quality indexes) explained the observed variables were determined using PLS-PM. The path coefficients and R2 were used to show the strength and direction of relationships between latent variables and assess the proportion of explained variance. An average variance extracted (AVE) and composite reliability (CR) greater than 0.5 and 0.7, respectively, suggest that the model was effective. Smart PLS (version 3.2.9) was used for PLS-PM [31,32]. All figures were prepared using Origin 2019. The data for each index in the figures were the averages for the two sites in the 2 years.
3. Results
3.1. Yield and Grain Protein Concentrations
The results showed that the yield and protein content of XN20 were significantly affected by the year and location, and the protein content was also significantly affected by the spraying period and concentration of potassium fertilizer (Table 2). The yield of XY22 was significantly affected by the year and potassium fertilizer concentration, and the protein content was significantly affected by the location, potassium fertilizer spraying period, and concentration (Table 3). The varieties significantly affected the yield and protein content ((Supplementary Table S1). KFA had no significant effect on the yield of XN20, but it increased the yield of XY22, and the effect was strongest under the K2 concentration (Figure 2). There was a significant difference in protein content between the two varieties in each year. The grain protein concentrations of XN20 were significantly higher than those of XY22 (Figure 3). There were significant differences in protein content between the two varieties during the three spraying periods, and the effect of spraying during flowering or at 10 days after flowering was significantly higher than that at the booting stage. The K2 treatment at anthesis of XN20 and XY22 led to the highest grain protein for both varieties (increasing by 7.9 and 6.8%, respectively), and the yield was significantly higher than that in the CK treatment.
Table 2.
Variance analysis of the effects of year, experimental site, and foliar application stage and concentration of potassium fertilizer on yield, protein and components, wet gluten, sedimentation value, and rheological properties of dough of wheat XN 20.
Table 3.
Variance analysis of the effects of year, experimental site, and foliar application stage and concentration of potassium fertilizer on yield, protein and components, wet gluten, sedimentation value, and rheological properties of dough of wheat XY22.
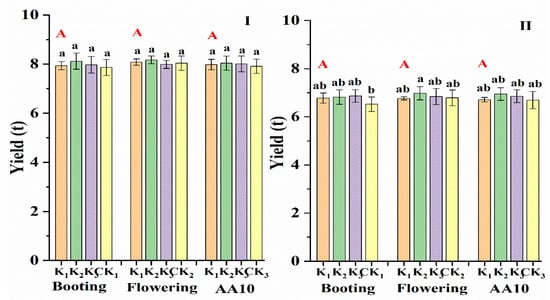
Figure 2.
Effects of potassium foliar application on the grain yield of wheat. I represented Xinong 20, and Ⅱ represented Xiaoyan 22. Booting (BBCH 48), Anthesis (BBCH 65), and AA10 (BBCH 71): Potassium fertilizer foliar sprayed at booting stage, anthesis stages, and 10 days post anthesis, respectively. K1, K2, and K3 represented the application concentration of potassium 30, 60, and 90 mmol L−1, respectively. CK: Same amount of deionized water was sprayed on the leaves. Vertical bars represent the mean values ± standard deviation (n = 3). Different lower-case letters indicate a significant difference (p < 0.05). Different capital letters indicate a significant difference (p < 0.05) among different spraying stages.
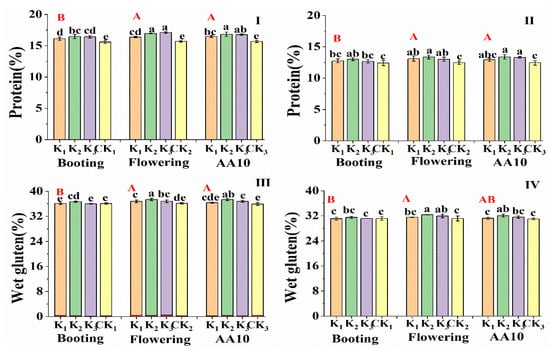
Figure 3.
Effects of potassium foliar application on the protein and wet gluten of wheat with Xinong 20 and Xiaoyan 22. I and III represented Xinong 20, and II and IV represented Xiaoyan 22. Booting (BBCH 48), Anthesis (BBCH 65), and AA10 (BBCH 71): Potassium fertilizer foliar sprayed at booting stage, anthesis stages, and 10 days post anthesis, respectively. K1, K2, and K3 represented the application concentration of potassium 30, 60, and 90 mmol L−1, respectively. CK: Same amount of deionized water was sprayed on the leaves. Vertical bars represent the mean values ± standard deviation (n = 3). Different lower-case letters indicate a significant difference (p < 0.05). Different capital letters indicate a significant difference (p < 0.05) among different spraying stages.
3.2. Changes in Dough Rheological Properties
The year, site, and KFA all significantly affected the wet gluten content, SV, and ST of XN20, and the FT was significantly affected by the year, potassium fertilizer spraying stage, and concentration (Table 2). The year, site, and KFA all significantly affected the wet gluten content and FT of XY22, the SV was significantly affected by the year and potassium fertilizer spraying concentration, and the ST was significantly affected by the year, potassium fertilizer spraying stage, and concentration (Table 3). In addition, the interaction of the spraying stage and K level notably affected the dough FT and ST (Table 2 and Table 3). The variety significantly affected wet gluten, SV, ST, and FT of the two varieties (Supplementary Table S1). The interaction of years, locations, and varieties significantly affected the SV, ST, and FT of the two varieties. There were significant differences in the wet gluten content, SV, and ST between years.
As shown in Figure 4, the SV and the dough formation and stabilization times of XN20 were approximately 3–4 times higher than those of XY22. The improvement effect of KFA on the wet gluten content and ST of XN20 was better than that of XY22, while the SV and FT showed an opposite trend. For XN20, the application of potassium fertilizer at the flowering stage with the K2 level had better effects on the wet gluten content, SV, and dough ST than did the application at the other stages. The FT was greatest under AA10 with the K2 concentration (increasing by 13.91%), although it did not significantly differ from that achieved with spraying at the flowering stage. For XY22, spraying potassium at the K2 concentration was more effective at prolonging the dough ST and FT and increasing the wet gluten content and SV when conducted at anthesis than at other times (increasing the values by 8.10, 18.60, 4.21, and 3.40%).
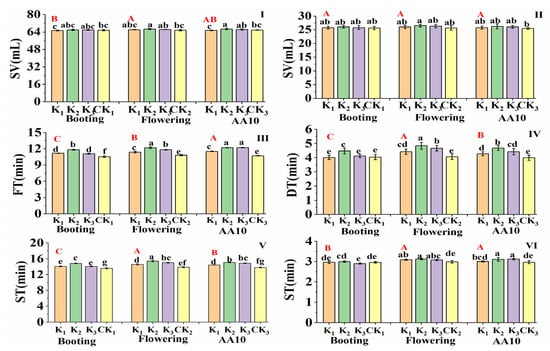
Figure 4.
Effects of potassium foliar application on the rheological properties of wheat with Xinong 20 and Xiaoyan 22. I, III, and V represented Xinong 20, and II, IV, and VI represented Xiaoyan 22. Booting Booting (BBCH 48), Anthesis (BBCH 65), and AA10 (BBCH 71): Potassium fertilizer foliar sprayed at booting stage, anthesis stages, and 10 days post anthesis, respectively. K1, K2, and K3 represented the application concentration of potassium 30, 60, and 90 mmol L−1, respectively. CK: Same amount of deionized water was sprayed on the leaves. Vertical bars represent the mean values ± standard deviation (n = 3). Different lower-case letters indicate a significant difference (p < 0.05). Different capital letters indicate a significant difference (p < 0.05) among different spraying stages.
3.3. Changes in Protein Fractions
The year, site, and KFA all significantly affected the albumin, gliadin, and glutelin levels and globulin was significantly affected by the year, site, and potassium fertilizer spray concentration (Table 2 and Table 3). In addition, the interaction of the spraying period and K level notably affected the levels of albumin, prolamin, and gluten of XN20 and the contents of albumin and gluten in XY22. The variety significantly affected the albumin, globulin, gliadin, and gluten levels (Supplementary Table S1). The interaction of the year, location, and variety significantly affected the albumin, globulin, and gliadin levels in the two varieties. There were significant differences in the four protein components between years.
As shown in Figure 5 and Figure 6, the albumin content of XN20 was lower than that of XY22, while the contents of the other three proteins showed the opposite trend. KFA increased the contents of prolamin and glutenin in both varieties but was not conducive to the accumulation of nutritional albumin and had no significant effect on globulin content. Compared with the potassium application in the other two spraying periods, the potassium fertilizer applied 10 days after flowering had a stronger effect on gluten content in XN20. However, for XY22, spraying at the flowering stage had the greatest effect on the gluten content, and the increase was strongest with the K2 concentration. The content of albumin in both varieties decreased considerably under KFA at the K2 concentration at 10 days after anthesis. When the potassium fertilizer was sprayed on the leaves of XN20 at 10 days post flowering, the contents of gliadin and gluten increased by 16.08 and 15.93%, respectively. In addition, the gliadin and gluten levels in XY22 increased by 4.90 and 17.12% under KFA at the K2 concentration at anthesis.
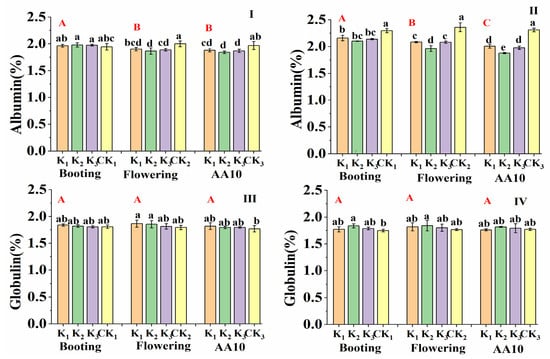
Figure 5.
Effects of potassium foliar application on the Albumin and Globulin of wheat with Xinong 20 and Xiaoyan 22. I and III represented Xinong 20, and II and IV represented Xiaoyan 22. Booting (BBCH 48), Anthesis (BBCH 65), and AA10 (BBCH 71): Potassium fertilizer foliar sprayed at booting stage, anthesis stages, and 10 days post anthesis, respectively. K1, K2, and K3 represented the application concentration of potassium 30, 60, and 90 mmol L−1, respectively. CK: Same amount of deionized water was sprayed on the leaves. Vertical bars represent the mean values ± standard deviation (n = 3). Different lower-case letters indicate a significant difference (p < 0.05). Different capital letters indicate a significant difference (p < 0.05) among different spraying stages.
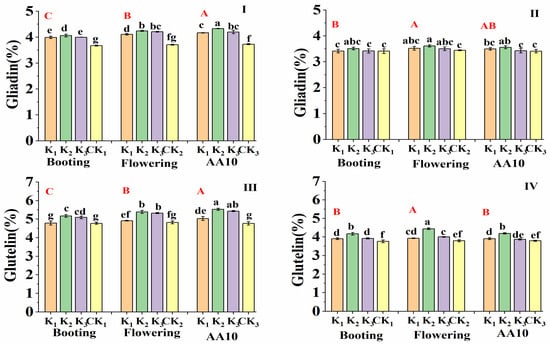
Figure 6.
Effects of potassium foliar application on the Gliadin and Glutelin of wheat with Xinong 20 and Xiaoyan 22. Ⅰ and Ⅲ represented Xinong 20, and Ⅱ and Ⅳ represented Xiaoyan 22. Booting (BBCH 48), Anthesis (BBCH 65), and AA10 (BBCH 71): Potassium fertilizer foliar sprayed at booting stage, anthesis stages, and 10 days post anthesis, respectively. K1, K2, and K3 represented the application concentration of potassium 30, 60, and 90 mmol L−1, respectively. CK: Same amount of deionized water was sprayed on the leaves. Vertical bars represent the mean values ± standard deviation (n = 3). Different lower-case letters indicate a significant difference (p < 0.05). Different capital letters indicate a significant difference (p < 0.05) among different spraying stages.
3.4. Effect of KFA on the HMW-GS Content in Grain
As shown in Figure 7, according to the previously described naming method [33], the subunit composition of XN20 was 1, 7 + 8, and 4 + 12, and the subunit composition of XY22 was 1, 7 + 9, and 2 + 12. Moreover, the subunit composition of HMW-GSs was not affected by KFA. The composition and concentration of HMW-GSs had important effects on the quality of dough processing. Here, we focused on the effect of KFA on the level of each subunit.
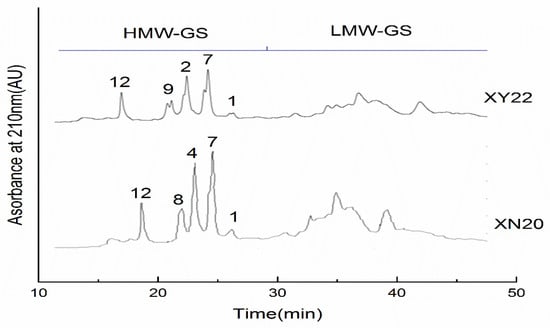
Figure 7.
Reverse phase high performance liquid chromatography (RP-HPLC) image of high molecular weight gluten subunit (HMW-GS). KFA was the potassium foliar application on wheat. CK was applied as the same amount of water.
The contents of subunits 1 and 7 + 8 in XN20 were significantly affected by the year, site, and KFA, the level of the 4 + 12 subunits in XN20 was significantly affected by the year, site, and potassium fertilizer spray concentration, and the contents of subunits 7 + 9 and 2 + 12 in XY220 were markedly affected by the potassium fertilizer application (Table 4). The interaction between the spraying period and concentration of potassium fertilizer significantly affected the HMW-GS content of the two varieties, except for subunit 4 + 12 of XN20. The content of subunits in XN20 was significantly higher than that in XY22, and KFA significantly increased the contents of each subunit in XN20 and 1 subunit in XY22 (Figure 8). Moreover, in XN20, the level t of subunit 1 was lower than those of the 7 + 8 and 4 + 12 subunits (Figure 8). The content of subunit 1 in flowering stage A was significantly higher than that in the booting stage and AA10. However, there was no significant difference in the content of subunits 4 + 12 among the different spraying periods. The content of each subunit in XN20 increased most obviously at the K2 concentration. There was an interaction effect of the spraying time and amount on the contents of subunits 1 and 7 + 8, and the greatest increases (of 23.95 and 6.32%, respectively) were observed in response to the K2 concentration at the flowering stage.
Table 4.
Variance analysis of the effects of year, experimental site, and foliar application stage and concentration of potassium fertilizer on the HMW-GS content of wheat XN20 and XY22.
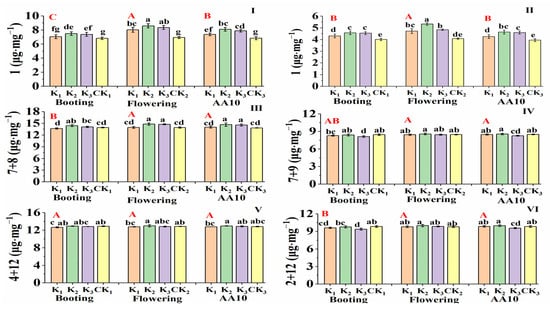
Figure 8.
Variation of HMW-GS content in Xinong 20 and Xiaoyan 22. Ⅰ, Ⅲ, and Ⅴ represented Xinong 20, Ⅱ, Ⅳ, and Ⅵ represented Xiaoyan 22. Booting (BBCH 48), Anthesis (BBCH 65), and AA10 (BBCH 71): Potassium fertilizer foliar sprayed at booting stage, anthesis stages, and 10 days post anthesis, respectively. K1, K2, and K3 represented the application concentration of potassium 30, 60, and 90 mmol L−1, respectively. CK: Same amount of deionized water was sprayed on the leaves. Vertical bars represent the mean values ± standard deviation (n = 3). Different lower-case letters indicate a significant difference (p < 0.05). Different capital letters indicate a significant difference (p < 0.05) among different spraying stages.
Figure 8 shows that in XY22, the content of subunit 1 was lower than those of the 7 + 9 and 2 + 12 subunit pairs. Compared with the other two periods, spraying potassium fertilizer at the flowering stage facilitated the increase of the 1 and 2 + 12 subunit levels, and the improvement was most significant with the K2 concentration at the flowering stage. There was no significant difference in the content of subunits 7 + 9 among the different spraying periods, and the level increased significantly under the K2 concentration. There was an interaction effect of the spraying time and amount on the contents of subunits 1, 7 + 9, and 2 + 12, with the greatest increase (of 30.70, 1.23, and 2.02%, respectively) was observed in response to the K2 treatment at the flowering stage.
3.5. Partial Least Squares Path Modelling
The results of PLS-PM showed that 91.5, 95.9, and 92.1% of the variation in the SV, ST, and development time of XN20 were attributed to the period and concentration of KFA (Figure 9). The period and concentration of potash fertilizer application explained 68.1 and 90.7%, respectively, of the variation in gliadin and gluten. The direct effects of gliadin on SV, ST, and FT (with path coefficients of 0.419, 0.270, and 0.240, respectively) were lower than those of gluten (with path coefficients of 0.771, 0.708, and 0.692, respectively). The direct effect of potassium fertilizer application period (path coefficient = 0.512) on gliadin was stronger than that of the potassium fertilizer application period (path coefficient = 0.215). The effects of the application period and concentration of potassium fertilizer were weaker than those of the HMW-GS 4 + 12 subunit (with path coefficients of 0.003 and 0.047, respectively). The direct effects of potassium fertilizer concentration on the HMW-GS 1 and 7 + 8 subunits were slightly larger than those in the spraying (with path coefficients of 0.623 and 0.511, respectively).
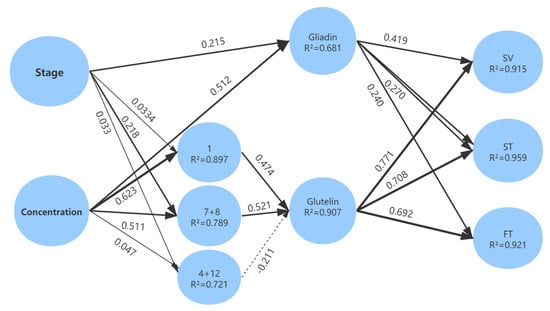
Figure 9.
The results of PLS-PM showed the direct and indirect effects of period and concentration of potash application, Gliadin, Glutelin, and HMW-GS (1, 7 + 8, 4 + 12) on the process quality index (sedimentation value (SV), stabilization time (ST), formation time (FT)) of wheat XN20. Solid and dotted arrows represent the positive and negative relationships, respectively. The strength of path coefficients is proportional to the width of arrows. The variance of the explained proportion is expressed in terms of R2.
For XY22, 56.8, 63.4, and 83.9% of the variation in SV, ST, and development time, respectively, were explained by the period and concentration of potassium fertilizer foliar application (Figure 10). Moreover, 78.1, 63.3, and 57.6% of the variation in HMW-GS 1, 7 + 9, and 2 + 12, respectively, was caused by differences in the application periods and concentrations of potassium fertilizer. Relative to that on SV and ST, the direct effect of gliadin on the development time was stronger (path coefficient = 0.839). The direct effects of gluten on the development time and ST were also strong (with path coefficients of 0.350 and 0.333, respectively), but the direct effect on SV was weak (path coefficient = 0.006).
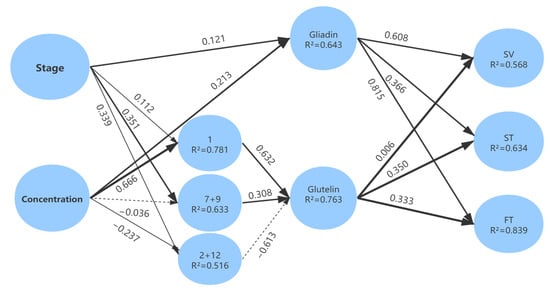
Figure 10.
The results of PLS-PM showed the direct and indirect effects of stage and concentration of potash application, Gliadin, Glutelin, and HMW-GS (1, 7 + 9, 2 + 12) on the process quality index (sedimentation value (SV), stabilization time (ST), formation time (FT)) of wheat XY22. Solid and dotted arrows represent the positive and negative relationships, respectively. The strength of path coefficients is proportional to the width of arrows. The variance of the explained proportion is expressed in terms of R2.
4. Discussion
4.1. Changes in the Protein Content and Its Components
This study showed that the foliar application of potassium fertilizer had different effects on the yield of the two varieties, which was beneficial to the increase of the yield of medium gluten wheat XY22, and had no significant effect on the yield of strong gluten wheat XN20. The difference in the response of two varieties to potassium fertilizer might be caused by the accumulation or transportation of photosynthetic products [9]. The potassium fertilizer was beneficial to the transportation and accumulation of photosynthetic products for XY22, and ultimately increased the grain yield. Potassium plays vital roles in photosynthesis, protein synthesis, enzyme activation, osmo-regulation, energy transfer, stomatal movement, cation and anion balance, and stress resistance [4,34]. Potassium can play effective roles in the physiological processes of photosynthesis, carbohydrate and protein formation, water and nutrient transport, nitrogen (N) utilization, and stimulation of early growth in plants [4]. Potassium can promote the absorption and transport of NO3− in plants [35] and the conversion of amino acids into protein, thereby increasing the grain protein content. The results of the present study indicated that foliar spraying of potassium fertilizer in the late stage of wheat growth significantly increased the protein and wet gluten contents and gluten protein in the grain in both varieties, but the best spraying effect was observed at different stages, which may have been caused by the differences in the gluten types of the selected wheat.
These findings are consistent with those of a previous study in which potassium was applied to soil [36]. The results suggested that late spraying of potash fertilizer affects wheat grain quality and can have effects similar to those of soil K, which may be related to wheat growth. These results indicated that the effect of KFA on wheat grain quality in the later growth period can have effects similar to those of soil potassium application, which may be related to the characteristics of the potassium demand and protein accumulation of wheat. Wheat absorbs K periodically, and certain quantities of K are needed in later growth periods. The appropriate K fertilizer application in the correct amount can improve the quality of wheat grains by increasing the accumulation of N and K in the middle and late stages of wheat growth [37,38]. In our study, the spraying of potassium fertilizer at the late growth stage may have increased the protein content of the mature grain by promoting the absorption and transport of nitrogen in the late filling stage. There was significant genotype associated differences in protein accumulation in wheat. The protein content of high-protein varieties decreases slowly in the early stage of filling. Furthermore, the accumulation rate of wheat grain storage protein is significantly higher in high-protein varieties than in low-protein varieties. In this experiment, it was found that the protein accumulation rate of the high-protein variety XN20 was higher than that of the low-protein variety XY22.
An appropriate increase in potassium application in the mid-growth stage of wheat led to simultaneous improvements in the grain yield and quality of the strong and medium gluten wheat varieties [39]. The results of the present study showed that the application of potassium fertilizer in the late growth period increased the protein content of the two varieties, but had an effect on yield only in XY22. These results indicated that spraying potassium fertilizer at the later growth stage of wheat improved wheat quality and that the effect on yield varied with variety. In addition, a study on soil potassium application has shown that the appropriate postponement of the topdressing period can promote the absorption and transport of nitrogen in the late filling stage and increase the protein content of the grain at the mature stage [39]. However, in the present study, spraying of K fertilizer at the booting stage, the flowering stage, and 10 days after flowering had no significant effect on the yield or protein content of wheat. This finding differs from the results of applying potassium to the soil. Previous studies have shown that the accumulation of protein in wheat grains at the filling stage presents an “S”-shaped curve [40]. In this study, the period of foliar potassium spraying corresponded to the early stage of protein accumulation. Therefore, its effect on protein accumulation was largely consistent. These results show that spraying potassium fertilizer after flowering helps synergistically increase wheat yield and protein quality. In wheat production in China, an important agronomic practice during the flowering period is to conductone the spraying event with three preventive measures (with the spray including chemicals for pest control and growth regulators to protect against dry and hot wind conditions) to improve the combined resistance of wheat in the later stage. In this period, potash fertilizer can be sprayed in combination with applying these measures. This approach can improve the yield and quality of wheat. In addition, spraying with other regulators can reduce labour and other costs and efficiency of wheat production.
In this study, the effect of potassium on the formation of different protein components was analysed. It was found that the effect of potassium application on the promotion of gliadin in the high-protein variety XN20 was greater than that on the medium-protein variety XY22, and the glutenin content of the two varieties was significantly increased after the potassium application. Therefore, gliadin and glutenin were the main contributors to the improvement in grain protein content by potassium, while albumin contributed to a lesser extent. In this study, KFA had no significant effect on the globulin content but slightly reduced albumin content and significantly increased gluten content. These findings indicated that KFA positively affected the grain processing quality. This positive effect might have been mediated by changes in the FT of the protein components in grains, nitrogen accumulation during flowering, or post anthesis nitrogen absorption in the aboveground parts [41,42]. Nitrogen accumulation is the main source of grain protein accumulation and nitrogen plays an important role in nitrogen metabolism and affects the synthesis of protein components [43]. In the grain filling stage, the synthesis of albumin and globulin occurred earlier than that of gluten protein, the nutritional protein content increased in the early filling stage and then remained stable, and the content of gluten increased with the grain development until the end of maturation [42]. KFA may affect the content of each protein component by affecting nitrogen accumulation and translocation. After potassium fertilizer was sprayed on the leaves, the albumin content decreased, which may have been due to the fact that the potassium fertilizer inhibited the formation of amino acids that introduce nitrogen into albumin, which finally resulted in a decrease in the albumin content. The relationship between the globulin content and nitrogen accumulation and translocation is nonlinear and highly significantly positively correlated with gliadin and glutenin [38]. Therefore, although KFA increased nitrogen accumulation and transport, the globulin content in grains did not increase significantly. After foliar spraying of potassium fertilizer, the accumulation and reuse of nitrogen increased, which led to an increase in the gliadin and glutenin content.
4.2. Changes in HMW-GS Contents and Processing Quality Indicators
Wheat gluten is composed mainly of prolamin and glutenin, which form a tightly cross-linked three-dimensional structure through hydrogen bonds, other noncovalent bonds, and disulfide bonds. The interactions of various proteins in gluten has important impacts on dough rheological properties and flour processing quality. With respect to wheat dough rheological properties, the FT, ST, and SV directly affect dough strength and are the most direct and accurate indicators of wheat processing quality [19]. This study showed that KFA improved the wet gluten content, SV, ST, and FT of the grains, which indicated that the spraying of potassium fertilizer on leaves in the late growth stage improved the processing quality of the wheat grains (Figure 4). These phenomena are inconsistent with some previous research results, possibly due to the differences in the varieties selected, fertilization methods, and cultivation environment among studies [44]. These findings also showed that the potassium fertilizer application methods have different effects on wheat grain processing quality. The gliadin and glutenin contents had influence on the ductility and elasticity of the dough respectively, and the processing quality of wheat flour was significantly affected by the gluten content [45]. This study showed that KFA was conducive to the increase of gliadin and glutenin content, and ultimately affected the changes of processing quality indexes such as wheat flour ST, FT, and SV. It is necessary to strengthen the research in this area to explore the physiological mechanisms through which the potassium fertilizer affects the quality of wheat grain and thereby provide a reference for the improved application of potassium fertilizer.
In addition to protein components, the composition and content of HMW-GSs have a significant impact on the wheat processing quality [46,47]. The Cys residues in HMW-GSs can form disulfide bonds in the protein structure. Through disulfide bond links, large protein polymers can be formed between HMW-GSs [48,49,50]. In addition, an increase in the glutamine residue content in HMW-GSs can lead to increased formation of hydrogen bonds, which is beneficial for maintaining the stability of the glutenin polymer structure and thus improves dough mixing time and ST [51,52]. Due to the compensation effect between subunits, subunit combinations can be used to evaluate the machining quality more accurately than single subunits. Therefore, we performed a combinatorial analysis of subunits at the same site. Previous studies suggested that 1, 2, *, 5 + 10, 7 + 8, and 14 + 15 are high-quality subunit combinations that often have better food processing quality than other subunit combinations [53]. The present study revealed that the content of high-quality subunit 1 and total content of the subunits in XN20 were significantly higher than those in XY22.
The results showed that the wet gluten content of XN20 was significantly higher than that of XY22 and that the dough rheological properties of XN20 were better than those of XY22. The PLS-PM analysis showed that the processing quality indexes (SV, FT, ST) and gluten protein and HMW GS levels were regulated by the potassium fertilizer foliar spraying time and concentration and revealed that KFA affected the processing quality partially by affecting the HMW-GS content. The wet gluten content of XN20 was significantly higher than that of XY22, and its dough rheological properties were also better than those of XN20. These findings indicate that the reason why the processing quality of XN20 was better than that of XY22 may be related to the composition and content of high-quality subunits in the former. In addition, the foliar spraying of potassium fertilizer increased the content of each subunit pair. This may have occurred due to the fact that the foliar spraying of potassium fertilizer increased the number of Cys residues, changed their distribution, or increased the content of glutamine and enhanced hydrogen bond synthesis, which ultimately increased the content of HMW-GS, enhanced the strength and elasticity of the dough, and improved the processing quality of the wheat. These changes may be the physiological reasons underlying the improvement in wheat quality in the middle and late stages of growth by foliar potassium spraying.
5. Conclusions
The results showed that KFA had no significant effect on the yield of XN20 but increased the yield of XY22. KFA had no significant effect on the globulin content but reduced the albumin content. For XN20, among the treatment combinations, potassium fertilizer at the K2 concentration (60 mmol L−1) sprayed at 10 days after flowering was the most beneficial for increasing the gluten content. However, under the K2 concentration at flowering stage, SV, dough ST, and FT exhibited the most obvious increases, and the levels of the 1, 7 + 8, and 4 + 12 subunits increased significantly. For XY22, the wet gluten content, gluten protein content, dough ST and FT increased most significantly when potassium was sprayed at the K2 concentration at the flowering stage. The HMW-GS content in XN20 was significantly higher than that in XY22. There were significant genotypic differences in HMW-GS composition and content between the two wheat varieties, which could explain the changes in processing quality. These results indicated that KFA affected the grain processing quality by increasing the contents of HMW-GSs, and the variations in subunit types and content between the two varieties resulted in the varietal differences in processing quality. With respect to wheat production, suitable KFA methods can be used to achieve high quality and high yield. Overall, KFA improved the wheat quality and significantly increased SV and dough rheological properties, thus improving the quality of grain processing. In general, KFA with K2 concentration (60 mmol L−1) at the flowering stage was the most beneficial to increase the yield and quality of the two varieties of wheat simultaneously. In Northwest China, the quality of both strong gluten and medium gluten wheat were all improved, and both varieties were suitable for planting.
Supplementary Materials
The following are available online at https://www.mdpi.com/article/10.3390/agronomy11091749/s1, Table S1: Variance analysis of the effects of year, area, cultivar, and foliar application of potash fertilizer on yield, protein and components, wet gluten, sedimentation value, and rheological properties of dough.
Author Contributions
Funding acquisition, Y.L. (Yang Liu) and X.W.; data curation, N.L. and D.Z.; investigation, X.G., B.W. and Y.L. (Yihong Liu); writing—original draft preparation, X.G. and Y.L. (Yang Liu). All authors have read and agreed to the published version of the manuscript.
Funding
This research was funded by the National Natural Science Foundation of China, grant numbers 31971860 and 31871567.
Institutional Review Board Statement
Not applicable.
Conflicts of Interest
The authors declare no conflict of interest.
References
- Gil-Humanes, J.; Pistón, F.; Shewry, P.R.; Tosi, P.; Barro, F. Suppression of gliadins results in altered protein body morphology in wheat. J. Exp. Bot. 2011, 62, 4203. [Google Scholar] [CrossRef]
- Godfrey, D.; Hawkesford, M.J.; Powers, S.J.; Millar, S.; Shewry, P.R. Effects of crop nutrition on wheat grain composition and end use quality. J. Agric. Food Chem. 2010, 58, 3012–3021. [Google Scholar] [CrossRef]
- Chope, G.A.; Wan, Y.; Penson, S.P.; Bhandari, D.G.; Powers, S.J.; Shewry, P.R.; Hawkesford, M.J. Effects of Genotype, Season, and Nitrogen Nutrition on Gene Expression and Protein Accumulation in Wheat Grain. J. Agric. Food Chem. 2014, 62, 4399–4407. [Google Scholar] [CrossRef] [PubMed]
- Lakudzala, D.D. Potassium Response in some Malawi Soils. Int. Lett. Chem. Phys. Astron. 2013, 13, 175–181. [Google Scholar] [CrossRef]
- Kutman, U.B.; Yildiz, B.; Ozturk, L.; Cakmak, I. Biofortification of Durum Wheat with Zinc Through Soil and Foliar Applications of Nitrogen. Cereal Chem. 2010, 87, 1–9. [Google Scholar] [CrossRef]
- Wani, J.; Malik, M.; Dar, M.; Akhter, F.; Raina, S. Impact of method of application and concentration of potassium on yield of wheat. J. Environ. Biol./Acad. Environ. Biol. India 2014, 35, 623–626. [Google Scholar]
- Guo, S.; Wu, J.; Dang, T.; Liu, W.; Li, Y.; Wei, W.; Syers, J.K. Impacts of fertilizer practices on environmental risk of nitrate in semiarid farmlands in the Loess Plateau of China. Plant Soil 2010, 330, 1–13. [Google Scholar] [CrossRef]
- Zhao, H.; Si, L. Effects of topdressing with nitrogen fertilizer on wheat yield, and nitrogen uptake and utilization efficiency on the Loess Plateau. Acta Agric. Scand. 2015, 65, 681–687. [Google Scholar] [CrossRef]
- Pettigrew, W.T. Potassium influences on yield and quality production for maize, wheat, soybean and cotton. Physiol. Plant 2008, 133, 670–681. [Google Scholar] [CrossRef]
- Khan, S.A.; Mulvaney, R.L.; Ellsworth, T.R. The potassium paradox: Implications for soil fertility, crop production and human health. Renew. Agric. Food Syst. 2014, 29, 3–27. [Google Scholar] [CrossRef]
- Sardans, J.; Peñuelas, J. Potassium: A neglected nutrient in global change. Glob. Ecol. Biogeogr. 2015, 24, 261–275. [Google Scholar] [CrossRef]
- Brankov, M.; Simić, M.; Dolijanović, Ž.; Rajković, M.; Mandić, V.; Dragičević, V. The Response of Maize Lines to Foliar Fertilizing. Agriculture 2020, 10, 365. [Google Scholar] [CrossRef]
- Kaur, G.; Nelson, K. Effect of Foliar Boron Fertilization of Fine Textured Soils on Corn Yields. Agronomy 2015, 5, 1. [Google Scholar] [CrossRef]
- Fageria, N.; Filho, M.; Moreira, A.; Guimarães, C. Foliar Fertilization of Crop Plants. J. Plant Nutr. 2009, 32, 1044–1064. [Google Scholar] [CrossRef]
- Zhang, F.; Niu, J.; Zhang, W.; Chen, X.; Li, C.; Yuan, L.; Xie, J. Potassium nutrition of crops under varied regimes of nitrogen supply. Plant Soil 2010, 335, 21–34. [Google Scholar] [CrossRef]
- Neuhaus, C.; Geilfus, C.-M.; Mühling, K.-H. Increasing root and leaf growth and yield in Mg-deficient faba beans (Vicia faba) by MgSO4 foliar fertilization. J. Plant Nutr. Soil Sci. 2014, 177, 741–747. [Google Scholar] [CrossRef]
- Xue, C.; Rossmann, A.; Schuster, R.; Koehler, P.; Mühling, K.-H. Split Nitrogen Application Improves Wheat Baking Quality by Influencing Protein Composition Rather Than Concentration. Front. Plant Sci. 2016, 7, 738. [Google Scholar] [CrossRef]
- Ramková, Z.; Gregová, E.; Turdík, E. Chemical composition and nutritional quality of wheat grain-Review. Acta Chim. Slovaca 2009, 2, 115–138. [Google Scholar]
- Unbehend, L.; Unbehend, G.; Lindhauer, M.G. Protein composition of some Croatian and German wheat varieties and their influence on the loaf volume. Food/Nahr. 2003, 47, 145–148. [Google Scholar] [CrossRef]
- Shi, Y.; Zhang, Y. Effects of nitrogen fertilization on protein components contents and processing quality of different wheat genotypes. Plant Nutr. Fertil. Sci. 2010, 16, 33–40. [Google Scholar]
- Visioli, G.; Bonas, U.; Dal Cortivo, C.; Pasini, G.; Marmiroli, N.; Mosca, G.; Vamerali, T. Variations in yield and gluten proteins in durum wheat varieties under late-season foliar versus soil application of nitrogen fertilizer in a northern Mediterranean environment. J. Sci. Food Agric. 2018, 98, 2360–2369. [Google Scholar] [CrossRef]
- Haeder, H.E.; Beringer, H. Analysis of yield of winter wheat grown at increasing levels of potassium. J. Sci. Food Agric. 2010, 32, 547–551. [Google Scholar] [CrossRef]
- Zhang, H.M.; Liu, H.X.; Wang, L.S.; Wang, H.; Zhou, W.L.; Guo, Y.X.; Wang, L.H. Effect of potassium on the growth at the late stages and grain quality of winter wheat in dryland. J. Triticeae Crop. 2004, 24, 73–75. [Google Scholar]
- Lv, X.; Li, T.; Wen, X.; Liao, Y.; Liu, Y. Effect of potassium foliage application post-anthesis on grain filling of wheat under drought stress. Field Crop. Res. 2017, 206, 95–105. [Google Scholar] [CrossRef]
- Noori, M.; Assaha, D.; Saneoka, H. Effect of salicylic acid and potassium application on yield and grain nutritional quality of wheat under drought stress condition. Cereal Res. Commun. 2018, 46, 1–11. [Google Scholar] [CrossRef]
- Zhao, H.; Guo, B.; Wei, Y.; Zhang, B. Near infrared reflectance spectroscopy for determination of the geographical origin of wheat. Food Chem. 2013, 138, 1902–1907. [Google Scholar] [CrossRef] [PubMed]
- Liu, Z.H.; Cheng, F.M.; Cheng, W.D.; Zhang, G.P. Positional variations in phytic acid and protein content within a panicle of japonica rice. J. Cereal Sci. 2005, 41, 297–303. [Google Scholar] [CrossRef]
- Holme, D.J.; Peck, H. Analytical biochemistry, 3rd ed.; Addison Wesley Longman: New York, NY, USA, 1998; pp. 388–393. [Google Scholar]
- Bollag, D.M.; Edelstein, S.J. Protein Methods. Quarterly Review of Biology; Wiley-Liss: New York, NY, USA, 1990; pp. 50–56. [Google Scholar]
- Marchylo, B.A.; Kruger, J.E.; Hatcher, D.W. Quantitative reversed-phase high-performance liquid chromatographic analysis of wheat storage proteins as a potential quality prediction tool. J. Cereal Sci. 1989, 9, S0733–S5210. [Google Scholar] [CrossRef]
- Vanalle, R.M.; Ganga, G.M.D.; Godinho Filho, M.; Lucato, W.C. Green supply chain management: An investigation of pressures, practices, and performance within the Brazilian automotive supply chain. J. Clean. Prod. 2017, 151, 250–259. [Google Scholar] [CrossRef]
- Li, J.; Shen, Z.; Li, C.; Kou, Y.; Wang, Y.; Tu, B.; Zhang, S.; Li, X. Stair-Step Pattern of Soil Bacterial Diversity Mainly Driven by pH and Vegetation Types Along the Elevational Gradients of Gongga Mountain, China. Front. Microbiol. 2018, 9, 1–10. [Google Scholar] [CrossRef]
- Payne, P.I.; Lawrence, G.J. Catalogue of alleles for the complex gene loci, Glu-A1, Glu-B1, and Glu-D1 which code for high-molecular-weight subunits of glutenin in hexaploid wheat. Cereal Res. Commun. 1983, 11, 29–35. [Google Scholar]
- Kausar, A.; Gull, M. Effect of Potassium Sulphate on the Growth and Uptake of Nutrients in Wheat (Triticum aestivum L.) Under Salt Stressed Conditions. J. Agric. Sci. (1916–9752) 2014, 6, 101–112. [Google Scholar] [CrossRef][Green Version]
- Blevins, D.G.; Hiatt, A.J.; Lowe, R.H.; Leggett, J.E. Influence of K on the Uptake, Translocation, and Reduction of Nitrate by Barley Seedlings. Agron. J. 1978, 70, 393–396. [Google Scholar] [CrossRef]
- Hussain, M.I.; Shah, S.; Hussain, S.; Iqbal, K. Growth, Yield and Quality Response of Three Wheat (Triticum aestivum L.) Varieties to Different Levels of N, P and K. Int. J. Agric. Biol. 2002, 4, 362–364. [Google Scholar]
- Wang, X.D.; Yu, Z.W.; Wang, D. Effects of potassium on carbohydrate content in stem and leaf sheath and starch accumulation in grain of wheat. Plant Nutr. Fertil. 2003, 9, 57–62. [Google Scholar]
- Zou, T.X.; D, Y.B.; Jiang, D.; Jing, Q.; Cao, W.X. Effects of potassium level on nitrogen accumulation and translocation and grain protein formation in wheat. Sci. Agric. Sin. 2006, 39, 686–692. [Google Scholar]
- Cao, W.; Guo, W.; Wang, L. Physiological Ecology and Optimization Technology of Wheat Quality; China Agricultural Press: Beijing, China, 2005; pp. 110–120. [Google Scholar]
- Stone, P.J.; Nicolas, M.E. Varietal Differences in Mature Protein Composition of Wheat Resulted From Different Rates of Polymer Accumulation During Grain Filling. Funct. Plant Biol. 1996, 23, 727–737. [Google Scholar] [CrossRef]
- Giuliani, M.M.; Giuzio, L.; De Caro, A.; Flagella, Z. Relationships between Nitrogen Utilization and Grain Technological Quality in Durum Wheat: I. Nitrogen Translocation and Nitrogen Use Efficiency for Protein. Agron. J. 2011, 103, 1487–1494. [Google Scholar] [CrossRef]
- Shewry, P.R.; Mitchell, R.A.C.; Tosi, P.; Wan, Y.; Underwood, C.; Lovegrove, A.; Freeman, J.; Toole, G.A.; Mills, E.N.C.; Ward, J.L. An integrated study of grain development of wheat (cv. Hereward). J. Cereal Sci. 2012, 56, 21–30. [Google Scholar] [CrossRef]
- Luo, L.C.; Hui, X.L.; Wang, Z.H.; Zhang, X.; Xie, Y.H.; Gao, Z.Q. Multi-site evaluation of plastic film mulch and nitrogen fertilization for wheat grain yield, protein content and its components in semiarid areas of China. Field Crops Res. 2019, 240, 86–94. [Google Scholar] [CrossRef]
- Wu, L.Y.; X., M.L. Effect of optimal fertilization on wheat quality and yield. Soil 2003, 35, 11–15. [Google Scholar]
- Dong, M.W.Q.; Zhou, Q.; Cai, J.; Wang, X.; Dai, T.B.; Jiang, D. Efficient promotion of the nutritional and processing quality of wheat grain by Zn forliar spraying at 5 days after anthesis. J. Plant Nutr. Fertil. 2018, 24, 63–70. [Google Scholar] [CrossRef]
- Gao, X.; Liu, T.; Yu, J.; Li, L.; Feng, Y.; Li, X. Influence of high-molecular-weight glutenin subunit composition at Glu-B1 locus on secondary and micro structures of gluten in wheat (Triticum aestivum L.). Food Chem. 2016, 197, 1184–1190. [Google Scholar] [CrossRef]
- Zhang, P.; He, Z.; Chen, D.; Zhang, Y.; Larroque, O.R.; Xia, X. Contribution of common wheat protein fractions to dough properties and quality of northern-style Chinese steamed bread. J. Cereal Sci. 2007, 46, 1–10. [Google Scholar] [CrossRef]
- Shewry, P.R.; Halford, N.G.; Lafiandra, D. Genetics of wheat gluten proteins. Adv. Genet. 2003, 49, 111–184. [Google Scholar] [CrossRef] [PubMed]
- Pirozi, M.R.; Margiotta, B.; Lafiandra, D.; Macritchie, F. Composition of polymeric proteins and bread-making quality of wheat lines with allelic HMW-GS differing in number of cysteines. J. Cereal Sci. 2008, 48, 117–122. [Google Scholar] [CrossRef]
- Anderson, O.D.; Bekes, F. Incorporation of high-molecular-weight glutenin subunits into doughs using 2 g mixograph and extensigraphs. J. Cereal Sci. 2011, 54, 288–295. [Google Scholar] [CrossRef]
- Ribeiro, M.; Bancel, E.; Faye, A.; Dardevet, M.; Ravel, C.; Gérard, B.; Igrejas, G. Proteogenomic Characterization of Novel x-Type High Molecular Weight Glutenin Subunit 1Ax1.1. Int. J. Mol. Sci. 2013, 14, 5650–5667. [Google Scholar] [CrossRef]
- Gianibelli, M.C.; Larroque, O.R.; MacRitchie, F.; Wrigley, C.W. Biochemical, Genetic, and Molecular Characterization of Wheat Glutenin and Its Component Subunits. Cereal Chem. J. 2001, 78, 635–646. [Google Scholar] [CrossRef]
- Wang, K.; An, X.L.; Pan, L.P.; Dong, K.; Gao, L.Y.; Wang, S.L.; Xie, Z.Z.; Zhang, Z.; Appels, R.; Ma, W. Molecular characterization of HMW-GS 1Dx3(t) and 1Dx4(t) genes from Aegilops tauschii and their potential value for wheat quality improvement. Hereditas 2012, 149, 41–49. [Google Scholar] [CrossRef]
Publisher’s Note: MDPI stays neutral with regard to jurisdictional claims in published maps and institutional affiliations. |
© 2021 by the authors. Licensee MDPI, Basel, Switzerland. This article is an open access article distributed under the terms and conditions of the Creative Commons Attribution (CC BY) license (https://creativecommons.org/licenses/by/4.0/).