Article

Arsenic Accumulation in Rice Grain as Influenced by Water Management: Human Health Risk Assessment

1
Department of Soil Science, Bangladesh Agricultural University, Mymensingh 2202, Bangladesh
2
Department of Soil Science, Khulna Agricultural University, Khulna 9100, Bangladesh
3
Global Centre for Environmental Remediation (GCER), The University of Newcastle, Callaghan, Newcastle, NSW 308, Australia
4
Department of Genetics and Plant Breeding, Bangladesh Agricultural University, Mymensingh 2202, Bangladesh
5
Department of Botany and Microbiology, College of Science, King Saud University, Riyadh 2455, Saudi Arabia
6
Queensland Alliance for Agriculture and Food Innovation, University of Queensland, Brisbane, QLD 4072, Australia
*
Authors to whom correspondence should be addressed.
Agronomy 2021, 11(9), 1741; https://doi.org/10.3390/agronomy11091741
Submission received: 13 July 2021 / Revised: 13 August 2021 / Accepted: 26 August 2021 / Published: 30 August 2021

Abstract

:
Rice is a staple food for humans and a key source of soil arsenic (As) transfer to the human food chain. As a result, it is critical to develop ways for reducing As accumulation in rice. A pot experiment with seven different water management practices was done to examine the impacts of water management on rice (cv. BRRI dhan28) growth, yield, and As accumulation in rice grain. Any health risk due to As accumulation in rice grain was also determined. The soil used in the experiment was artificially contaminated with As and the source of As was sodium arsenate (Na2HAsO4 7H2O). Water management practices affect different plant growth and yield parameters including filled grains per panicle, unfilled grains per panicle, 1000-grain weight, grain yield and straw yield of rice. The number of filled grains per panicle and 1000-grain weight were found to be at their highest in the T7 (alternate wetting and drying) condition, whereas the number of unfilled grains per panicle was at its lowest in the same treatment. The T7 also demonstrated the highest grain yield (21.08 g/pot) and straw yield (22.02 g/pot), whereas the lowest values were noted in T1 (flooding throughout the growth period). The highest As concentration in rice grain (0.52 mg kg−1) was found in T1 and the lowest As concentration in grain (0.27 mg kg−1) was found in T7. Estimation of the human health risk revealed that the non-carcinogenic risks (HQ > 1) and carcinogenic risks (CR > 1.0 × 10⁻⁴) were greatly affected by different water regimes. The rice plant grown under alternate wetting and drying condition (T7) showed the lowest health risks compared to other water management practices. Thus, alternate wetting and drying conditions are a good water management strategy for increasing rice output while reducing arsenic buildup in rice grain.

1. Introduction

Arsenic is a non-threshold poisonous metalloid that is found in abundance in the natural world. Rice consumption is thought to be a major source of As exposure, accounting for more than half of the total dietary As intake [1,2,3,4]. It is extremely important throughout the Asian subcontinent, particularly in Bangladesh, India, China, Japan, Sri Lanka, and Pakistan [5]. Rice is particularly troublesome in terms of As since it is grown under constant flooding conditions, which enhances the bioavailability and mobility of As in the soil, resulting in an increase in As accumulation in rice grains [6]. Around 75% of the world’s rice is cultivated in irrigated lowlands [7], where the fields are typically flooded constantly during the growing season. While continuously flooded rice systems are highly productive, they are associated with a number of issues such as high-water use [8], high methane emissions [9], and accumulation, in the grain, of heavy metals, such as mercury [10] and arsenic [11]. A high concentration of As penetrates the food chain via absorption by crops from roots to straw and grain polluted by irrigated water, in addition to the health concerns associated with drinking water. Water draining from shallow aquifers for irrigation is also expected to contribute one million kg of As each year to Bangladesh’s arable soil, primarily in rice crops [12]. As accumulation in soils and crop absorption has increased as a result of this [13,14].
The extraction of groundwater from shallow aquifers in many areas where surface water is polluted by disease-causing bacteria is a particularly important way of mobilizing As. Because of the interaction of groundwater with aquifer minerals and the higher potential in aquifers for the development of physicochemical conditions conducive for As release, groundwater is more sensitive to As contamination than surface water [15]. Groundwater from shallow aquifers is more likely than deep aquifer groundwater to have greater levels of As [16]. High levels of As in soils and water can lead to higher levels of As in rice grain and straw. Rice from As-contaminated regions has greater As contents, up to 1.8 mg kg−1 in certain Bangladeshi rice, according to reports [14]. Human As intake through rice eating can be significant, and in certain cases exceeds that from drinking water, according to recent studies [17,18]. The quantity of arsenic in rice straw is greater than in rice grain. This is also a concerning problem because many animals are primarily fed rice straw [19]. As a result, this hazardous element may infiltrate the food chain, causing chronic As poisoning in humans, which may lead to lung, bladder, skin, and kidney malignancies, as well as other chronic illnesses including neurogenic and diabetic effects [20].
One of the greatest ways to reduce As buildup in rice is to use water management practices in paddy fields. According to Takahashi et al. [21], the redox state of the soil is primarily important for preventing As contamination in irrigation water by assisting oxidation in the soil, which interferes with As (V) to As reduction (III). Honma et al. [22] conducted water management studies and discovered that traditional irrigation and intermittent irrigation at various intervals resulted in significant variations in rice grain As concentrations due to changes in Eh, pH, and dissolved Fe (II) concentrations in soils. Likewise, Hu et al. [23] found that the reproductive development stage of rice is critical for grain As accumulation management. They also discovered that using traditional irrigation until full tillering, then intermittent watering, results in low As and high grain production. It has also been discovered that As absorption by rice is lower under aerobic water management practices than in anaerobic circumstances.
Dietary exposure of As from rice ingestion is a significant risk factor for cancer, especially for the peoples who depend heavily on a rice diet [1,24]. Another study also confirmed that As is associated with both cancer risk and non-cancer effects [25]. Thus, there is an urgent need to develop mitigation strategies to reduce As toxicity in rice plants as well as associated health risks from rice consumption. Health risk estimation for As exposure from rice intake is crucial as it provides important information on risk management and enables action required to minimize risk so that human health is protected. However, few studies have investigated the human health risk due to As intake from rice under water management practices. The present study was designed to investigate the As toxicity of rice grown in an artificially contaminated soil under different water regimes and estimate the associated human health risks. The overall objectives of this study were to determine: (i) the effect of different water regimes on growth and yield of a rice variety, (ii) the effect of different water regimes on As accumulation in rice grain, and (iii) estimate the human health risks in terms of non-carcinogenic risks denoted as hazard quotient (HQ) and carcinogenic risks (CR). As a result, the goal of this study was to see how changing water regimes affect rice development, yield, and As accumulation.

2. Materials and Methods

2.1. Site Description and Soil Properties

During January to April 2018, the experiment was carried out in the net house (no controlled environment, a metallic framed structure enclosed by agro nets or any other woven material to allow required sunlight, moisture and air to pass through the gaps and also to protect animal attack) of the Department of Soil Science, Bangladesh Agricultural University (BAU), Mymensingh. The net house is part of the BAU farm’s environment (AEZ 9). During the kharif season (April–September), the region has a sub-tropical humid climate with high temperatures and relatively heavy rainfall, and low temperatures during the rabi season (October–March). The climate is characterised by heavy humidity and rainfall, as well as occasional strong gusts during the kharif season. The soil is classified as Non-calcareous Dark Grey Floodplain soil (Aeric Haplaquept in the U.S. Soil Taxonomy) [26]. Physical and chemical characteristics such as texture, pH, organic carbon, total nitrogen, available P, exchangeable K, available S, and As content were measured in the initial soil samples and results are presented in Table 1. The BRRI dhan28 rice variety was tested in the experiment.

2.2. Treatments and Design of the Experiment

The experimental pots were separated into three lines, each representing three replications, in a Completely Randomized Design (CRD). There were seven water management treatments on each line. A total of 21 (7 × 3) pots were prepared for the experiment. The treatments were as follows:
TreatmentDescription
T1Flooding throughout the growth period
T2Flooding from transplanting to 3 weeks after heading
T3Flooding from transplanting to heading
T4Flooding from transplanting to 3 weeks before heading and from heading to 3 weeks after heading
T5Flooding from transplanting to 3 weeks before heading
T6Flooding from transplanting for 2 weeks and then from 3 weeks before heading to 3 weeks after heading
T7Alternate wetting and drying (AWD)
Note: T = Treatment; AWD = Alternate Wetting and Drying.
The treatment T1is the usual irrigation practice all over Bangladesh. Farmers usually keep 3–5 cm water in the rice field during the whole growing period for better weed management and yield. Therefore, T1 will be considered as control.

2.3. Pot Preparation and Fertilizer Application

A total of 8 kg of soil was placed in each of plastic pots having a volume of 10 L, and once the soil had settled down, 2–3 cm of standing water was added to maintain an artificial field condition. 10 days before rice transplanting, BRRI dhan28, the appropriate quantity of As (10 mg kg−1) was applied in each pot to make the soil As ~12 mg kg−1 which was reported as the average As concentration in Bangladesh soils [34]. In our experiment, the actual As concentration in the soil was (background soil As 3.73 mg kg−1 + added soil As 10 mg kg−1) 13.73 mg kg−1. Sodium arsenate (Na2HAsO4 7H2O) was the source of As. During final pot preparation, recommended quantities of TSP (0.8 g/pot), MoP (1.04 g/pot), Gypsum (0.8 g/pot), and zinc sulphate (0.04 g/pot) were administered as a baseline dosage to all experimental pots using the BARC fertilizer recommendation guide [35]. The recommended urea dose (2.7 g/pot) was applied in three equal doses (0.9 g/pot in each dose) ten days after transplantation; the second split was applied 35 days after transplanting, at maximum tillering stage, and the third split was applied 60 days after transplanting. Treatments for water management were added to each pot according to the timetable. For T7, water was applied in the pots and allowed to dry until hair like cracking in soil appeared.

2.4. Chemical Analysis

The grain samples were collected, cleaned, and dehusked. The samples were then oven-dried and powdered in the Ball Mill (Retsch Planetary Ball Mill PM100). One hundred mg (0.1 g) of each of the powdered rice grain samples was weighed out using Shimadzu digital weighing scales into labeled 100 mL digestion tubes (VELP Scientifica Srl in Usmate, Italy) and the precise weights were recorded. 5 mL of Sigma Trace element grade 69% nitric acid (HNO3) was added to each tube. The same volume of nitric acid was added to the tube designated as blank. Arsenic analysis in the grain samples followed the method described by Hossain et al. [33].
The tubes were hand-shaken briefly and left overnight to predigest. Following this period, 2 mL of Analar 30% hydrogen peroxide (H2O2) was added to each centrifuge tube via pipette. Tubes were left open for 15 min to outgas. Tubes were then placed into the Block digester (VELP, Italy) and digested for 5 h at 120 °C. The white fume in the digestion tubes was considered the completion of sample digestion. After cooling, the digests were transferred to 50 mL plastic bottle. The digestion tubes were washed several times with deionized water to transfer the whole digest of each sample into the plastic bottle with extreme care to check the loss of the elements. Finally, each plastic bottle was made up to its final weights (50 g) with deionized water, and the weights were recorded to calculate the dilution factor. Five standards were made up using TraceCERT®, 1000 mgL−1 As in nitric acid (Sigma-Aldrich, Bangalore, India). The standards were in a range of 0–50 µg L−1 As. The standard tubes were then made up to the final weight (50 g) with 1% HNO3 aq. 10 mL from the final digestate was poured into 15 mL polypropylene tubes to be placed into the auto-sampler in the predetermined random run order. Total As in the digest and water samples was determined following flow injection hydride generation Polarized Zeeman Atomic Absorption Spectrophotometer (ZA3000 Series, Hitachi, Kyushu, Japan).

2.5. Determination of As Uptake by Rice Grain

As uptake was calculated by the following formula
As uptake/pot (µg pot−1) = As concentration in rice grain (µg kg−1) × Grain yield (kg pot−1)
Projected As uptake ha−1 was calculated by the following formula
Projected As uptake/ha (g ha−1) = As uptake/pot (µg pot−1) × 250,000
where, 250,000 is the plant density per hectare. Farmers usually plant rice at a spacing of 20 cm × 20 cm in the field [36]. At this spacing, the number of plants per hectare is 250,000.

2.6. Estimation of Health Risk from As Exposure

In this study, the potential health risks from As contamination through consumption of rice was estimated by calculating average daily intake (ADI), hazard quotient (HQ) and cancer risk (CR) using the following equations [37,38,39,40]:
ADI = C A s × I R B W
HQ = ADI R f D  
CR = ADI × CSF
where
ADI = Estimated daily intake of As (mg d−1) per BM (kg).
CAs = Concentration of As in rice (mg kg−1).
IR = Ingestion rate of rice (0.432 kg d−1) for adult obtained from [37].
BW = Body weight (70 kg) [38].
RfD = Oral reference dose (0.3 × 10⁻³ mg kg−1 daily for As) as suggested by USEPA [39].
CSF = Cancer slope factor (1.5 mg kg−1 per day) [38,40].
In terms of non-carcinogenic risk, HQ > 1 denotes significant adverse human health effects due to presence of particular element in the diet while HQ < 1 indicates no significant risk is anticipated [41,42,43,44]. In case of carcinogenic risk, if CR value surpassing 1.0 × 10⁻⁴ is considered as unacceptable whereas CR value below 1.0 × 10⁻⁶ is not considered to develop significant health effect, CR value lies from 1.0 × 10⁻⁶ to 1.0 × 10⁻⁴ are usually supposed to be an acceptable range [39].

2.7. Data Analysis

The analysis of variance (ANOVA) for various plant parameters and grain was conducted following one-way analysis of variance using General Linear Model (GLM) and the means were compared using Tukey’s method at 95% Confidence level in Minitab 17 statistical package (State College, PA, USA).

3. Results

3.1. Effect of Water Management on Growth Parameters of BRRI dhan28

Water management practices had no significant effect on the plant height of BRRI dhan28 (p = 0.336), as shown in Table 2. T1 (Flooding throughout the growth period) resulted in the tallest plants (83.5 cm). T7 (Alternate wetting and drying) gave the second tallest plant height of 82.5 cm, whereas T5 (Flooding from transplanting to 3 weeks before heading treatment) had the lowest plant height of 78.0 cm. Although the plant height of BRRI dhan28 differed numerically, the results were equal in all treatments. Table 2 shows that there was no significant variation in panicle length of BRRI dhan28 in pot soil as a consequence of impacted water management techniques (p = 0.644). The longest panicle length of 22.1 cm was recorded in T1 (Flooding throughout the growth period) and the shortest panicle length (21.0 cm) was observed in T5 (Flooding from transplanting to 3 weeks before heading). Statistically the values of panicle length did not differ between the treatments (Table 2).
The number of filled grains per panicle is an important plant growth parameter that contributes to rice grain yield. Different water management techniques had a substantial impact on the quantity of filled grains per panicle of rice (p = 0.000) (Table 2). The highest number of filled grains per panicle (86.22) was recorded in T7 (Alternate wetting and drying) (Table 2). The number of filled grains per panicle obtained from T1 (Flooding throughout the growth period), T2 (Flooding from transplanting to 3 weeks after heading), T3 (Flooding from transplanting to heading), T4 (Flooding from transplanting to 3 weeks before heading and from heading to 3 weeks after heading) and T6 (Flooding from transplanting for 2 weeks and then from 3 weeks before heading to 3 weeks after heading) were 70.40, 78.45, 74.33, 73.37, and 82.89 g/pot, respectively. The lowest number of filled grains per panicle recorded in T5 (Flooding from transplanting to 3 weeks before heading) was 64.03 (Table 2). The number of unfilled grains per panicle was significantly affected by different water management practices (p = 0.000) in rice when grown in pot soil (Table 2). The highest number of unfilled grains per panicle (59.49) was found in T5 (Flooding from transplanting to 3 weeks before heading) whereas the lowest number of unfilled grains per panicle (8.93) was found in T7 (Alternate wetting and drying condition). The number of unfilled grains per panicle (40.96) was considerably greater than the lowest value of 8.93 when plants were grown in a constantly wet environment. The values of unfilled grains per panicle obtained from T4 (Flooding from transplanting to 3 weeks before heading and from heading to 3 weeks after heading) was statistically similar with T1 (Flooding throughout the growth period) as reported in Table 2.
Different water management practices had a significant effect on 1000-grain weight (p = 0.000) of BRRI dhan28 (Table 2). The highest 1000-grain weight (22.80 g) was found in T7 (Alternate wetting and drying) condition. T6 (Flooding from transplanting for 2 weeks and then from 3 weeks before heading to 3 weeks after heading) had the second highest 1000-grain weight (20.27 g), which was statistically similar to T5 (Flooding from transplanting for 2 weeks and then from 3 weeks before heading to 3 weeks after heading). The 1000-grain weight showed the lowest value of 14.76 g in T5 (Flooding from transplanting to 3 weeks before heading). When plants were grown under continuously flooded condition, the value of 1000-grain weight was observed as 16.26 g.

3.2. Effects of Water Management on the Yield of Rice (cv. BRRI dhan28)

Grain yield of BRRI dhan28 as reported in Table 3 was significantly influenced by different water management practices (p = 0.001). The highest grain yield of 21.08 g/pot was observed when grown under alternate wetting and drying condition (T7). In T1 (Flooding throughout the growth period), a grain yield of 13.90 g/pot was recorded. The lowest grain yield (13.52 g/pot) was observed in T5 (Flooding from transplanting to 3 weeks before heading). The grain yield increase over control ranged from 51.65 to 16.55% with the highest increase in T7 (Alternate wetting and drying) and the lowest increase in T4 (Flooding from transplanting to 3 weeks before heading and from heading to 3 weeks after heading). A negative value of grain yield increase over control (−2.73%) was found in T5 (Flooding from transplanting to 3 weeks before heading), which was not common in water management practices (Table 3). Based on the grain yield, the treatments can be ranked in the order: T7 > T6 > T2 > T3 > T4 > T1 > T5.
Like grain yield, the straw yield of rice (BRRI dhan28) was also significantly influenced by different water management practices (p = 0.015) (Table 3). The highest straw yield (22.02 g/pot) was observed in T7 (Alternate wetting and drying) which was statistically similar with the value ofT6 (Flooding from transplanting for 2 weeks and then from 3 weeks before heading to 3 weeks after heading). The lowest straw yield of 14.01 g/pot was recorded in T5 (Flooding from transplanting to 3 weeks before heading). Maximum straw yield increase over control (30.76%) was found in T7 (Alternate wetting and drying). The second highest straw yield increase over control (27.55%) was found in T6 (Flooding from transplanting for 2 weeks and then from 3 weeks before heading to 3 weeks after heading). The value of straw yield over control decreased from −16.80% in T5 (Flooding from transplanting to 3 weeks before heading) to −5.20% in T4 (Flooding from transplanting to 3 weeks before heading and from heading to 3 weeks after heading). Based on straw yield the treatments can be rank in the order of T7 > T6 > T3 > T2 > T4 > T1 > T5.

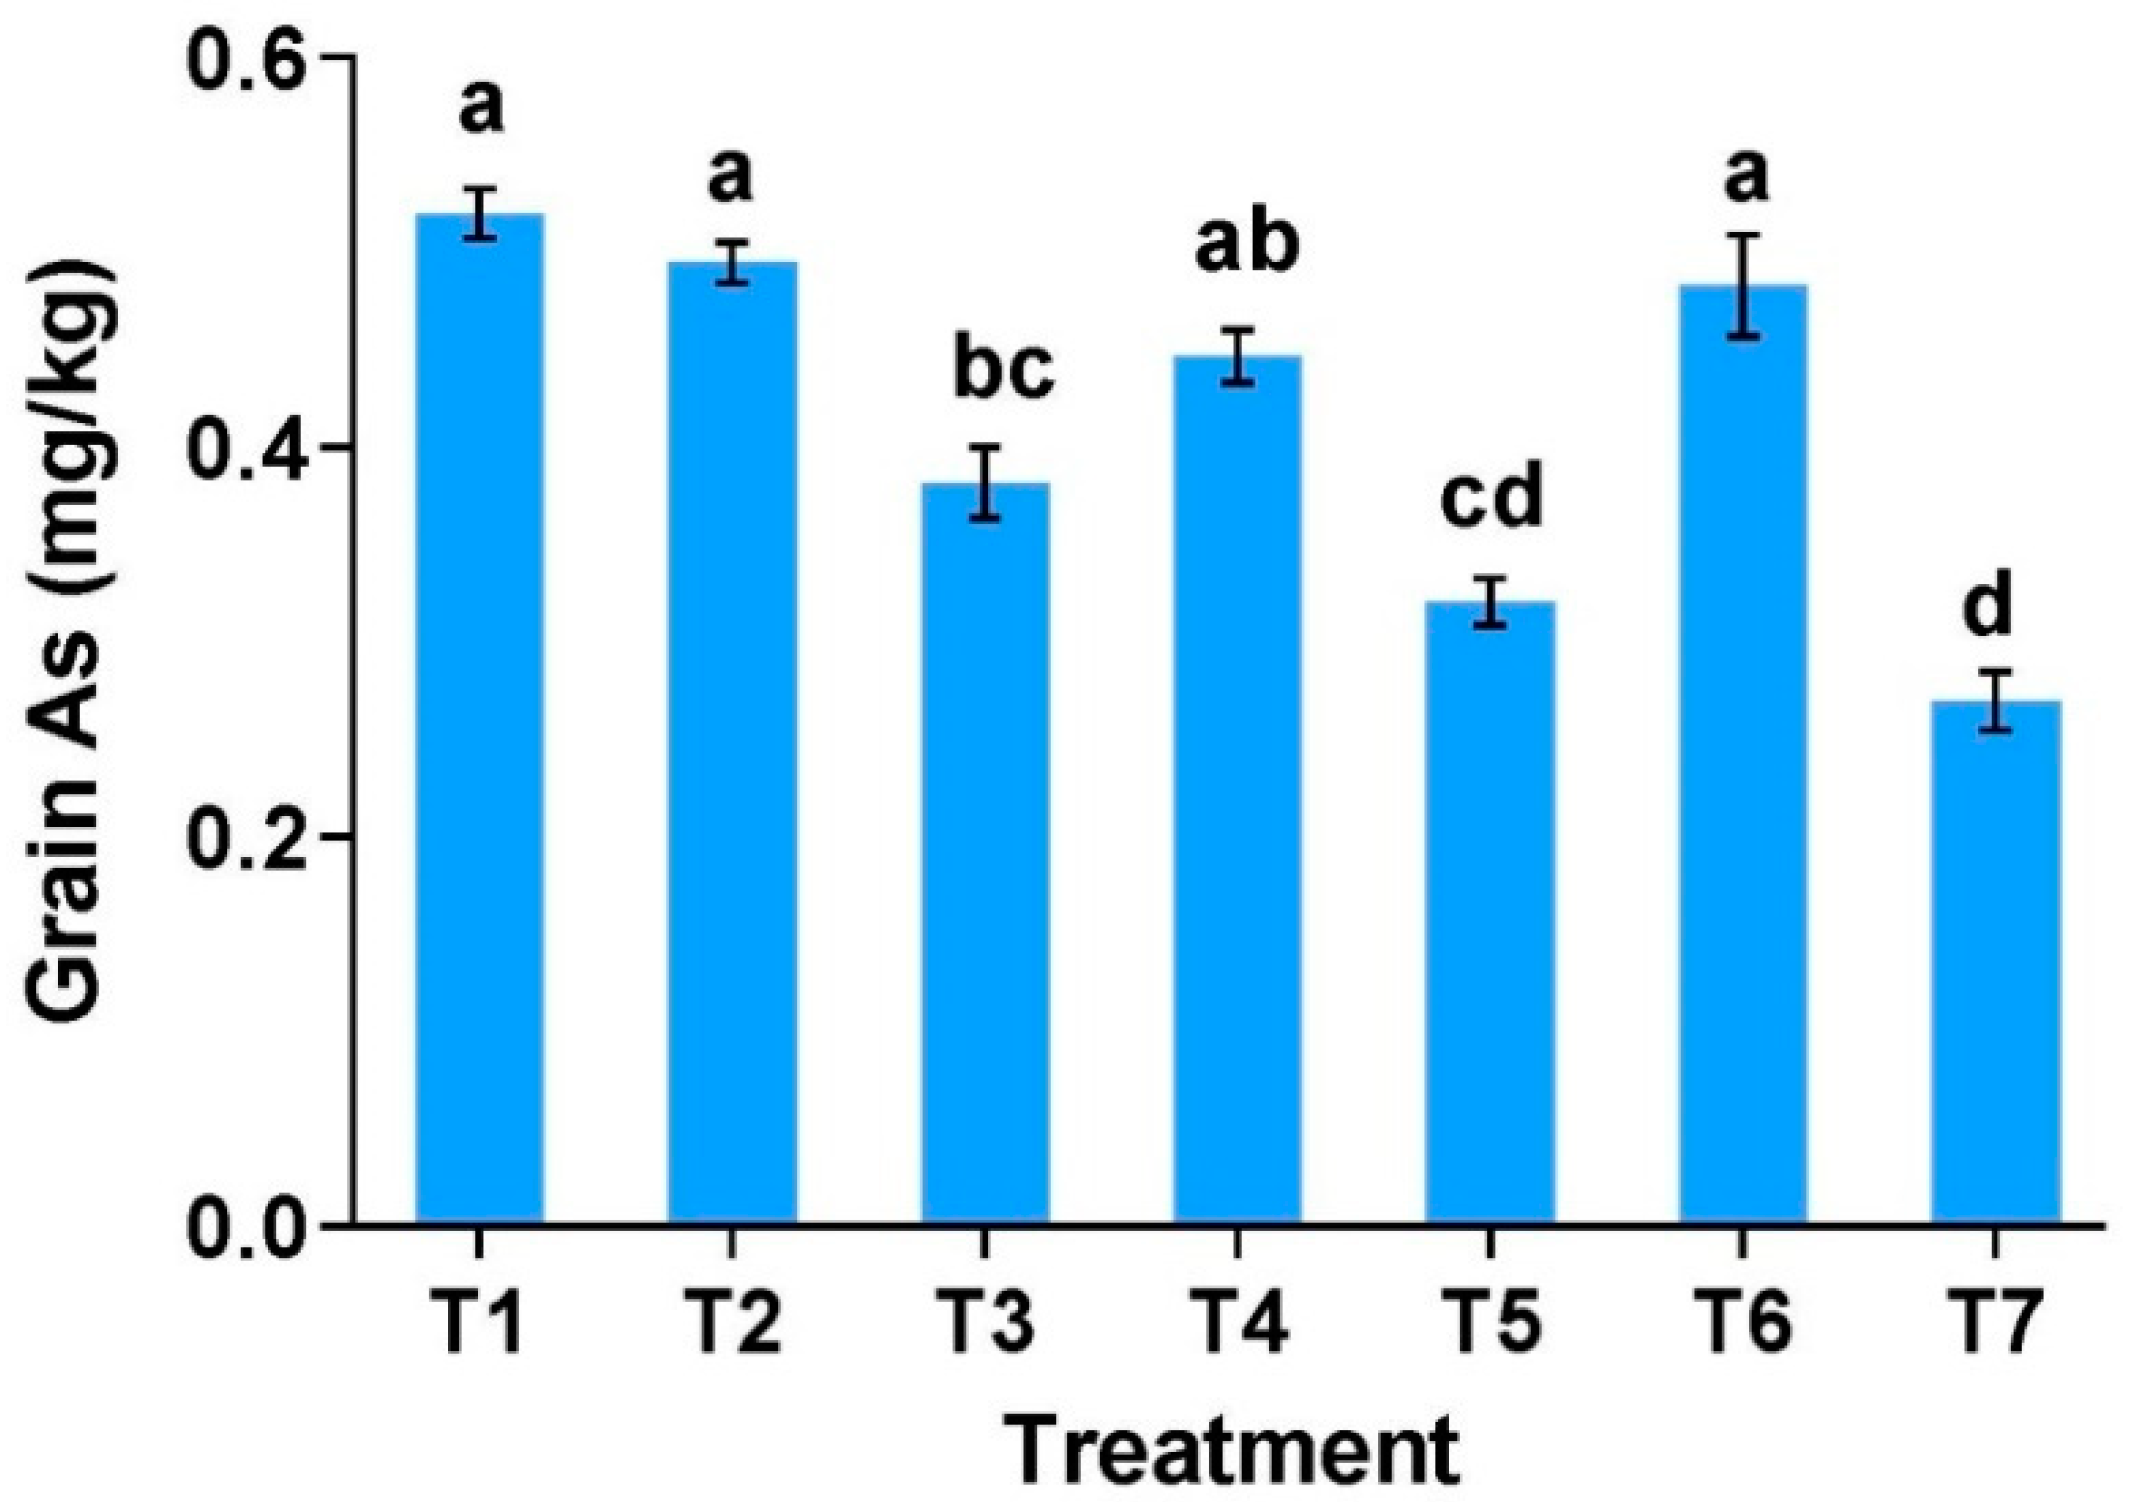
3.3. Effects of Water Management on As Accumulation in Rice Grain

The results depicted in Figure 1 and Table S1 indicate that the concentration of rice grain As was significantly influenced by different water management practices carried out in the pot soil. The highest grain As concentration (0.52 mg kg−1) was found when plants were grown under continuously flooded condition (T1) having a transfer factor (Grain As mg kg−1/Soil As mg kg−1) of 0.038 [45]. Grain As in T1 was statistically similar with T2 (Flooding from transplanting to 3 weeks after heading), T4 (Flooding from transplanting to 3 weeks before heading and from heading to 3 weeks after heading) and T6 (Flooding from transplanting for 2 weeks and then from 3 weeks before heading to 3 weeks after heading) with the value of 0.49, 0.45 and 0.48 mg kg−1, respectively. A grain As concentration of 0.32 mg kg−1 was found in T5 (Flooding from transplanting to 3 weeks before heading). The lowest grain As concentration of 0.27 mg kg−1 was obtained when plants were grown under AWD condition (T7) that has a transfer factor of 0.02. Based on the As concentration in rice grain, the water management treatments can be ranked in the order of T1 > T2 > T6 > T4 > T3 > T5 > T7. Therefore, grain arsenic concentration was significantly reduced by the water management practices. Higher irrigation resulted in the higher As concentration in rice grain.

3.4. Effect of Water Management on As Uptake

Different water management also significantly influenced the As uptake by rice grain (p < 0.001, Table 4). The highest As uptake by (8.77 µg pot−1) was found in T6 (Flooding from transplanting for 2 weeks and then from 3 weeks before heading to 3 weeks after heading), whereas the lowest uptake (4.32 µg pot−1) was observed in T5 (Flooding from transplanting to 3 weeks before heading treatment). T3, T5, and T7 reduced As uptake by 8.1%, 40.3%, and 21.3%, respectively, over control (T1) (Table 4). In contrast, T2, T4, and T6 increased As uptake by 16.7%, 0.2%, and 21.2%, respectively, over control (T1) (Table 4). Projected As uptake per hectare ranged from 1.08 to 2.19 g ha−1 in different water management treatments used in the experiment. Based on the projected As uptake/ha, the water management treatments can be ranked in the order of T6 > T2 > T1 = T4 > T3 > T7 > T5 (Table 4).

3.5. Exposure and Cancer Risks Estimation

Different health risks estimation indices such as ADI, HQ and CR were calculated from the inorganic As dataset of BRRI dhan28 and presented in Table 5. ADI of As from rice grain of BRRI dhan28 ranged from 3.21 × 10⁻³ to 1.67 × 10⁻³ (mg kg−1 bwd−1). In this study, the highest ADI (3.21 × 10⁻³ mg kg−1 bwd−1) was observed in T1 treatments where rice plants were grown under continuous flooded condition while the lowest value of ADI (1.67 × 10⁻³ mg kg−1 bwd−1) was detected in T7 treatments (alternate wetting and drying condition). In this present study, the HQ ranged from 5.55 to 10.70 and the highest value was noticed for rice plant cultivated in continuous flooded condition (T1). The lowest value of HQ was observed for rice plant grown under alternate wetting and drying condition (T7). For all treatments in this study As exceeded the acceptable limit of HQ (>1) that could induce adverse health effects. According to USEPA, the permissible value of CR is 1.0 × 10⁻⁴ while the tolerable limit of CR for regulatory purposes ranges from 1.0 × 10⁻⁶ to 1.0 × 10⁻⁴ [35]. The CR value of As exposure was shown in Table 5. It was observed that the CR value at all treatment combinations were higher than the permissible limit of 1.0 × 10⁻⁴ indicating a potential carcinogenic significant risk of As from rice consumption. The CR value (2.50 × 10⁻³) under alternate wetting and drying condition had the lowest risk as compared to other treatments.

4. Discussion

In the current study, we investigated the effects of different water regimes on growth, yield, and accumulation of As in rice grain. It is well established that efficient water management in the paddy field affects As bioavailability and subsequent accumulation of As in rice grain [46,47,48]. Rice can accumulate approximately 10 times more As compared to other cereals (wheat and barley) [17], due to its anaerobic cultivation practices. Continuous flooding condition in the rice field increases the mobilization and bioavailability of As and thus increasing accumulation in grain and straw, while aerobic or alternate wetting and drying conditions decrease the mobilization and accumulation of As in rice [6,48,49]. In the present study, we observed higher As accumulation in continuous flooding conditions compared to alternate wetting and drying (AWD) and intermittent flooding conditions. The accumulation of As in rice grain under continuous flooded condition is increased because the anaerobic condition increases the bioavailability of As through reductive dissolution of iron oxyhydroxides and by reduction of Arsenate (As (V)) to arsenite (As (III)) [21,22,49]. As (III) is more mobile than As(V), thus, the mobility of As is increased in soil solution under anaerobic condition, contributing to more available As for plant uptake [17,21]. In contrast, under AWD systems, the soil is intermittently flooded where excess irrigation water is drained out though evapotranspiration and percolation to maintain aerobic condition for a substantial period, after which the soil is reirrigated. Due to prolonged drying period in AWD systems the mobilization of As in paddy soil is decreased and thus facilitating lower total As accumulation in rice grain and straw [50,51].
Intermittent flooding around heading stage and drainage before harvest also affects bioavailability of As in soil [52]. Maintaining aerobic conditions after the flowering stage significantly decreases As accumulation in rice straw and grains compared with rice grown under flooded conditions [6]. The Heading stage, particularly 3 weeks after heading is considered as the most crucial period for As accumulation in rice [53]. In our study, the concentration of total As in grain was higher inT4 than in T5 and T3 where flooding was done before heading. Therefore, it can be summarized that flooding after heading could increase total As accumulation in rice grain more than flooding before heading. This is because, flooding after heading increases the mobilization of As in soil, and thus increases the uptake of As in rice grain [53]. Lower As accumulation in rice grain could be achieved by maintaining aerobic conditions in the paddy soil during heading stage [54].
Our results also revealed that ADI value was higher for rice plant grown under continuously flooded conditions as compared to other treatments. The joint FAO/WHO Expert Committee on Food Additives (JECFA) recommended a provisional tolerable weekly intake (PTWI) value of As as 15 × 10−3 mg kg−1 bw which is equivalent to 2.14 × 10⁻³ mg kg−1 bw per day (PTDI) [54]. For treatment T5 and T7, the mean As exposure from rice grain was just below the provisional tolerable daily intake (PTDI) while T1, T2, T4 and T6 showed higher As exposure than the PTDI. Our results were in line with García-Rico et al. [55] who found that average daily intake of As was 2.7 × 10⁻³ mg kg−1 bw. Islam et al. [56] demonstrated that average daily intake of As in different types of rice greatly varied and ranged from 0.50 × 10⁻³ to 1.41 × 10⁻³ mg kg−1 bw, which was lower than this study. In the present investigation, the bioaccessibility of As was not considered which might be the reason for higher ADI of As from rice consumption. Zhuang et al. [43] demonstrated that the bioaccessibility of As in raw rice using simulated gastric and gastrointestinal digestion were 62–93% and 75–96%, respectively. Another study showed that the bioaccessibility fraction of As in various rice genotypes ranged from 25 to 94% [49]. So, average daily intake of As will be less if we consider the bioaccessibility fraction of As in rice grain. Further investigation on the bioaccessibility fraction of As in rice grain should be conducted in order to ensure more accurate As risk estimation.
In this study, the non-carcinogenic risks in terms of HQ were determined. Potentially adverse impacts on human health would occur when HQ value exceeds 1. The HQ values in different treatment combinations exceeded the safe level (HQ > 1), indicating a risk existed due to non-carcinogenic effects. The results of this study are in good agreement with the recent study by Rahman et al. [3] who reported HQ value from rice consumption was higher than the threshold level and ranged between 1.0 to 20. Islam et al. [56] also demonstrated that the HQ values varied from 1.20 to 4.70 from rice intake which supports our investigation. Based on CR assessment, all treatment combination demonstrated a risk level greater than 1.0 × 10⁻⁴ and treatment T1 (rice grown under continuous flooded condition) showed the highest risk of 4.81 × 10⁻³ which means that 48.1 per 10,000 exposed population are at risks for cancer caused by As intake. The CR value in this study was notably higher than what Islam et al. [56] found (0.76–2.12) × 10−3 (i.e., 7.6–21.2 per 10,000 exposed population) due to As exposure from rice consumption but much lower than the value of (4.5–5.5) × 10−2 (i.e., 45–55 per 1000 exposed population) reported for rice in Iran [57].

5. Conclusions

Rice As concentration decreased linearly with the duration of standing water in rice field and rice growth phase, which also has significant effect on the yield of rice. Our results clearly show that alternate wetting and drying significantly decreased As accumulation in rice grain and increased grain yield compared to other water management practices. Higher values of HQ (>1) were observed for all treatments indicating adverse health effects to the population from As exposure. AWD irrigation may have significant implications for the fate of As in rice-producing countries of the world.

Supplementary Materials

The following are available online at https://www.mdpi.com/article/10.3390/agronomy11091741/s1, Table S1: Effect of water management on arsenic accumulation in rice grain (cv. BRRI dhan28).

Author Contributions

Conceptualization, M.R.I., I.J.H. and M.H.; methodology, M.R.I., I.J.H. and M.H.; software, I.J.H., H.A., A.B.S. and S.U.; validation, M.R.I., I.J.H., M.H. and H.A.; formal analysis, I.J.H., R.J. and S.U.; investigation, M.R.I., I.J.H., R.J. and M.H.; resources, M.R.I., M.H. and H.A.; data curation, M.R.I., I.J.H., R.J. and S.U.; writing—original draft preparation, M.R.I., I.J.H., R.J., S.U., M.A.H. and A.B.S.; writing—review and editing, M.R.I., I.J.H., R.J., H.A., M.H., S.U., M.A.H., A.B.S., S.A., M.H., M.H.S. and R.J.H.; visualization, M.R.I., H.A., A.B.S. and S.U.; supervision, M.R.I. and M.H.; project administration, M.R.I., I.J.H. and M.H.; funding acquisition, M.R.I., S.A., M.H.S. and M.H. All authors have read and agreed to the published version of the manuscript.

Funding

Researchers Supporting Project number (RSP-2021/194), King Saud University, Riyadh, Saudi Arabia.

Data Availability Statement

The data that support this study will be shared upon reasonable request to the corresponding author.

Acknowledgments

We are thankful to University Grants Commission of Bangladesh and Bangladesh Agricultural University Research System (BAURES) for partial fund to conduct this research. Authors would like to extend their sincere appreciation to the Researchers Supporting Project number (RSP-2021/194) King Saud University, Riyadh, Saudi Arabia. The first author acknowledges the NST Fellowship (2017–2018) of Ministry of Science and Technology, Government of the People’s Republic of Bangladesh.

Conflicts of Interest

The authors declare that they have no conflict of interest to publish this manuscript.

References

  1. Islam, S.; Rahman, M.M.; Islam, M.R.; Naidu, R. Geographical variation and age-related dietary exposure to arsenic in rice from Bangladesh. Sci. Total Environ. 2017, 601–602, 122–131. [Google Scholar] [CrossRef]
  2. Kumarathilaka, P.; Seneweera, S.; Ok, Y.S.; Meharg, A.; Bundschuh, J. Arsenic in cooked rice foods: Assessing health risks and mitigation options. Environ. Int. 2019, 127, 584–591. [Google Scholar] [CrossRef]
  3. Rahman, M.M.; Alauddin, M.; Alauddin, S.T.; Siddique, A.B.; Islam, M.R.; Agosta, G.; Mondal, D.; Naidu, R. Bioaccessibility and speciation of arsenic in children’s diets and health risk assessment of an endemic area in Bangladesh. J. Hazard. Mater. 2021, 403, 124064. [Google Scholar] [CrossRef]
  4. Rasheed, H.; Kay, P.; Slack, R.; Gong, Y.Y. Arsenic species in wheat, raw and cooked rice: Exposure and associated health implications. Sci. Total Environ. 2018, 634, 366–373. [Google Scholar] [CrossRef]
  5. Rahman, M.A.; Rahman, M.M.; Reichman, S.M.; Lim, R.P.; Naidu, R. Arsenic Speciation in Australian-Grown and Imported Rice on Sale in Australia: Implications for Human Health Risk. J. Agric. Food Chem. 2014, 62, 6016–6024. [Google Scholar] [CrossRef]
  6. Xu, X.Y.; McGrath, S.P.; Meharg, A.; Zhao, F.J. Growing rice aerobically markedly decreases arsenic accumulation. Environ. Sci. Technol. 2008, 42, 5574–5579. [Google Scholar] [CrossRef]
  7. International Rice Research Institute (IRRI). Rice Knowledge Bank. 2017. Available online: https://www.irri.org/rice-knowledge-bank (accessed on 27 June 2021).
  8. Bouman, B.; Barker, B.; Humphreys, E.; Tuong, T.P. Rice: Feeding the billions. In Comprehensive Assessment of Water Management in Agriculture. Water for Food, Water for Life: A Comprehensive Assessment of Water Management in Agriculture; Earthscan, London and International Water Management Institute: London, UK, 2007; pp. 515–549. [Google Scholar]
  9. Linquist, B.A.; Adviento-Borbe, M.A.; Pittelkow, C.M.; van Kessel, C.; van Groeningen, K.J. Fertilizer management practices and greenhouse gas emissions from rice systems: A quantitative review and analysis. Field Crops Res. 2012, 135, 10–21. [Google Scholar] [CrossRef]
  10. Zhang, H.; Feng, X.; Larssen, T.; Shang, L.; Li, P. Bioaccumulation of methylmercury versus inorganic mercury in rice (Oryza sativa L.) grain. Environ. Sci. Technol. 2010, 44, 4499–4504. [Google Scholar] [CrossRef]
  11. Zhao, F.J.; McGrath, S.P.; Meharg, A.A. Arsenic as a food chain contaminant: Mechanisms of plant uptake and metabolism and mitigation strategies. Annu. Rev. Plant Biol 2010, 61, 535–559. [Google Scholar] [CrossRef] [Green Version]
  12. Akinbile, C.O.; Haque, A.M.M. Arsenic Contamination in Irrigation Water for Rice Production in Bangladesh: A Review. Trends Appl. Sci. Res. 2012, 7, 331–349. [Google Scholar] [CrossRef]
  13. FAO. Arsenic Threat in Rice: Reducing Arsenic Levels in Rice through Improved Irrigation Practices; FAO: Rome, Italy, 2007. [Google Scholar]
  14. Meharg, A.A.; Rahman, M. Arsenic contamination of Bangladesh paddy field soils: Implications for rice contribution to arsenic consumption. Environ. Sci. Technol. 2003, 7, 229–234. [Google Scholar] [CrossRef]
  15. Norra, S.; Aggrawala, P.; Wagner, F.; Berner, Z.; Chandrasekharam, D.; Stuben, D. Impact of irrigation with As rich groundwater on soil and crops: A geochemical case study in Malda District, West Bengal. Appl. Geochem. 2005, 20, 18901906. [Google Scholar] [CrossRef]
  16. Smedley, P.L. Sources and distribution of arsenic in groundwater and aquifers. In Arsenic in Groundwater: A World Problem; Appelo, T., Ed.; IAH Publication: Utrecht, The Netherlands, 2008; Volume 5, pp. 4–32. [Google Scholar]
  17. Williams, P.N.; Islam, M.R.; Adomako, E.E.; Raab, A.; Hossain, S.A.; Zhu, Y.G.; Feldmann, J.; Meharg, A.A. Increase in rice grain arsenic for regions of Bangladesh irrigating paddies with elevated arsenic in groundwaters. Environ. Sci. Technol. 2006, 40, 4903–4908. [Google Scholar] [CrossRef]
  18. Duxbury, J.M.; Mayer, A.B.; Lauren, J.G.; Hassan, N. Food Chain Aspects of Arsenic Contamination in Bangladesh: Effects on Quality and Productivity of Rice. J. Environ. Sci. Health 2003, 38, 61–69. [Google Scholar] [CrossRef]
  19. Mallick, S.; Sinam, G.; Sinha, S. Study on arsenate tolerant and sensitive cultivars of Zea mays L.: Differential detoxification mechanism and effect on nutrients status. Ecotoxicol. Environ. Sci. 2011, 74, 1316–1324. [Google Scholar] [CrossRef]
  20. Mishra, S.S.; Inderpal, S.; Gothecha, V.K. Chronic Arsenic Poisoning and Role of Natural Antioxidants: A Review. Int. J. Green Herbal. Chem. 2014, 3, 056–063. [Google Scholar]
  21. Takahashi, Y.; Minamikawa, R.; Hattori, K.H.; Kurishima, K.; Kihou, N.; Yuita, K. Arsenic behavior in paddy fields during the cycle of flooded and non-flooded periods. Environ. Sci. Technol. 2004, 38, 1038–1044. [Google Scholar] [CrossRef]
  22. Honma, T.; Ohba, H.; Kaneko-Kadokura, A.; Makino, T.; Nakamura, K.; Katou, H. Optimal Soil Eh, pH, and water management for simultaneously minimizing arsenic and cadmium concentrations in rice grains. Environ. Sci. Technol. 2016, 50, 4178–4185. [Google Scholar] [CrossRef]
  23. Hu, P.; Huang, J.; Ouyang, Y.; Wu, L.; Song, J.; Wang, S.; Li, Z.; Han, C.; Zhou, L.; Huang, Y.; et al. Water management affects arsenic and cadmium accumulation in different rice cultivars. Environ. Geochem. Health 2013, 35, 767–778. [Google Scholar] [CrossRef]
  24. Davis, M.A.; Signes-Pastor, A.J.; Argos, M.; Slaughter, F.; Pendergrast, C.; Punshon, T.; Gossai, A.; Ahsan, H.; Karagas, M.R. Assessment of human dietary exposure to arsenic through rice. Sci. Total Environ. 2017, 586, 1237–1244. [Google Scholar] [CrossRef]
  25. Mondal, D.; Polya, D.A. Rice is a major exposure route for arsenic in Chakdaha block, Nadia district, West Bengal, India: A probabilistic risk assessment. Appl. Geochem. 2008, 23, 2987–2998. [Google Scholar] [CrossRef]
  26. FAO. Land Resources Appraisal of Bangladesh for Agricultural Development. Report 2; Agroecological Regions of Bangladesh, United Nations Development Programme, Food and Agriculture Organization: Rome, Italy, 1988; pp. 212–221. [Google Scholar]
  27. Peech, M. Hydrogen-ion activity. In Methods of Soil Analysis, Part 2; Black, C.A., Ed.; American Society of Agronomy: Madison, WI, USA, 1965. [Google Scholar]
  28. Black, C.A. Method of Soil Analysis, Part 2, Chemical and Microbiological Properties; American Society of Agronomy, Inc.: Madison, WI, USA, 1965. [Google Scholar]
  29. Bremner, J.M.; Mulvaney, C.S. Nitrogen-Total. In Methods of Soil Analysis, Part 2; Page, A.L., Miller, R.H., Keeney, D.R., Eds.; ASA & SSSA: Madison, WI, USA, 1982; pp. 595–624. [Google Scholar]
  30. Olsen, S.R.; Sommer, L.E. Phosphorus. In Methods of Soil Analysis, Part 2; Page, A.L., Miller, R.H., Keeney, D.R., Eds.; ASA & SSSA: Madison, WI, USA, 1982; pp. 403–430. [Google Scholar]
  31. Knudsen, D.; Peterson, G.A.; Pratt, P.F. Lithium, sodium and potassium. In Methods of Soil Analysis, Part 2; Page, A.L., Miller, R.H., Keeney, D.R., Eds.; ASA & SSSA: Madison, WI, USA, 1982; pp. 225–245. [Google Scholar]
  32. Fox, R.L.; Olson, R.A.; Rhoades, H.F. Evaluating the sulfur status of soils by plants and soil tests. Soil Sci. Soc. Am. Proceed 1964, 28, 243–246. [Google Scholar] [CrossRef]
  33. Hossain, M.; Islam, M.R.; Jahiruddin, M.; Abedin, A.; Islam, S.; Meharg, A.A. Effects of Arsenic-Contaminated Irrigation Water on Growth, Yield, and Nutrient Concentration in Rice. Commun. Soil Sci. Plant Anal. 2008, 39, 302–313. [Google Scholar] [CrossRef]
  34. Islam, M.R.; Jahiruddin, M.; Rahman, G.K.M.M.; Miah, M.A.M.; Farid, A.T.M.; Panaullah, G.M.; Loeppert, R.H.; Duxbury, J.M.; Meisner, C.A. Arsenic in paddy soils of Bangladesh: Levels, distribution and contribution of irrigation and sediments. In Proceedings of the Behavior of Arsenic in Aquifers, Soils and Plants Conference Proceedings, Dhaka, Bangladesh, 16–18 January 2005. [Google Scholar]
  35. Jahiruddin, M.; Ahmed, S. Fertilizer Recommendation Guide; Bangladesh Agricultural Research Council: Dhaka, Bangladesh, 2018.
  36. Saha, K.K.; Paul, S.K.; Sarkar, M.A.R. Influence of Spacing of Planting on the Yield Performance of Some Aromatic Rice Varieties in Boro Season. Sustain. Food Agric. 2020, 1, 10–14. [Google Scholar] [CrossRef]
  37. Pirsaheb, M.; Hadei, M.; Sharafi, K. Human health risk assessment by Monte Carlo simulation method for heavy metals of commonly consumed cereals in Iran- Uncertainty and sensitivity analysis. J. Food Compos. Anal. 2021, 96, 103697. [Google Scholar] [CrossRef]
  38. IARC. Cadmium and cadmium compounds. In IARC Monograph on the Evaluation of Carcinogenic Risks to Humans. Review of Human Carcinogens: Arsenic, Metals, Fibre and Dusts; IARC: Lyon, France, 2012. [Google Scholar]
  39. Kusin, F.M.; Azani, N.N.M.; Hasan, S.N.M.S.; Sulong, N.A. Distribution of heavy metals and metalloid in surface sediments of heavily-mined area for bauxite ore in Pengerang, Malaysia and associated risk assessment. Catena 2018, 165, 454–464. [Google Scholar] [CrossRef]
  40. Abtahi, M.; Fakhri, Y.; Oliveri Conti, G.; Keramati, H.; Zandsalimi, Y.; Bahmani, Z.; Hosseini Pouya, R.; Sarkhosh, M.; Moradi, B.; Amanidaz, N. Heavy metals (As, Cr, Pb, Cd and Ni) concentrations in rice (Oryza sativa) from Iran and associated risk assessment: A systematic review. Toxin Rev. 2017, 36, 331–341. [Google Scholar] [CrossRef]
  41. Antoniadis, V.; Golia, E.E.; Liu, Y.T.; Wang, S.L.; Shaheen, S.M.; Rinklebe, J. Soil and maize contamination by trace elements and associated health risk assessment in the industrial area of Volos, Greece. Environ. Int. 2019, 124, 79–88. [Google Scholar] [CrossRef] [PubMed]
  42. Halder, D.; Saha, J.K.; Biswas, A. Accumulation of essential and non-essential trace elements in rice grain: Possible health impacts on rice consumers in West Bengal, India. Sci. Total Environ. 2020, 706, 135944. [Google Scholar] [CrossRef]
  43. Zhuang, P.; Zhang, C.; Li, Y.; Zou, B.; Mo, H.; Wu, K.; Wu, J.; Li, Z. Assessment of influences of cooking on cadmium and arsenic bioaccessibility in rice, using an in vitro physiologically-based extraction test. Food Chem. 2016, 213, 206–214. [Google Scholar] [CrossRef]
  44. Li, R.Y.; Stroud, J.L.; Ma, J.F.; McGrath, S.P.; Zhao, F.J. Mitigation of arsenic accumulation in rice with water management and silicon fertilization. Environ. Sci. Technol. 2009, 43, 3778–3783. [Google Scholar] [CrossRef] [PubMed]
  45. Jung, H.; Lee, J.; Chae, M.; Kong, M.S.; Lee, C.H.; Kang, S.S.; Kim, Y.H. Growth-inhibition patterns and transfer-factor profiles in arsenic-stressed rice (Oryza sativa L.). Environ. Monit. Assess. 2017, 189, 638. [Google Scholar] [CrossRef] [PubMed] [Green Version]
  46. Huang, Z.; Pan, X.; Wu, P.; Han, J.; Chen, Q. Health Risk Assessment of Heavy Metals in Rice to the Population in Zhejiang, China. PLoS ONE 2013, 8, e75007. [Google Scholar] [CrossRef]
  47. Liao, G.; Wu, Q.; Feng, R.; Guo, J.; Wang, R.; Xu, Y.; Ding, Y.; Fan, Z.; Mo, L. Efficiency evaluation for remediating paddy soil contaminated with cadmium and arsenic using water management, variety screening and foliage dressing technologies. J. Environ. Manag. 2016, 170, 116–122. [Google Scholar] [CrossRef] [Green Version]
  48. Yamaguchi, N.; Nakamura, T.; Dong, D.; Takahashi, Y.; Amachi, S.; Makino, T. Arsenic release from flooded paddy soils is influenced by speciation, eh, pH, and iron dissolution. Chemosphere 2011, 83, 925–932. [Google Scholar] [CrossRef] [PubMed]
  49. Nakamura, K.; Katou, H. Arsenic and cadmium solubilization and immobilization in paddy soils in response to alternate submergence and drainage. In Competitive Sorption and Transport of Heavy Metals in Soils and Geological Media; Selim, H.M., Ed.; CRC Press: Boca Raton, FL, USA, 2012; pp. 379–404. [Google Scholar]
  50. Li, C.; Carrijo, D.R.; Nakayama, Y.; Linquist, B.A.; Green, P.G.; Parikh, S.J. Impact of Alternate Wetting and Drying Irrigation on Arsenic Uptake and Speciation in Flooded Rice Systems. Agric. Ecosyst. Environ. 2019, 272, 188–198. [Google Scholar] [CrossRef]
  51. Carrijo, D.R.; Akbar, N.; Reis, A.F.B.; Li, C.; Gaudin, A.C.M.; Parikh, S.J.; Green, P.G.; Linquist, B.A. Impacts of variable soil drying in alternate wetting and drying rice systems on yields, grain arsenic concentration and soil moisture dynamics. Field Crops Res. 2018, 222, 101–110. [Google Scholar] [CrossRef]
  52. Arao, T.; Kawasaki, A.; Baba, K.; Mori, S.; Matsumoto, S. Effects of water management on cadmium and arsenic accumulation and dimethylarsinic acid concentrations in Japanese rice. Environ. Sci. Technol. 2009, 43, 9361–9367. [Google Scholar] [CrossRef]
  53. Yamane, T. Mechanisms and counter-measures of arsenic toxicity to rice plant. Bull. Shimane Agric. Exp. Stn. 1989, 24, 1–95, (In Japanese with English Summary). [Google Scholar]
  54. JECFA. Joint FAO/WHO Expert Committee on Food Additives, Seventy-Third Meeting, Geneva, 8–17 June 2010. Summary and Conclusions; JECFA/73/SC; Food and Agriculture Organization of the United Nations: Rome, Italy; WHO: Geneva, Switzerland, 2010. [Google Scholar]
  55. García-Rico, L.; Tejeda-Valenzuela, L.; Vélez, D.; Montoro, R. Content of selenium, total and inorganic arsenic and bioaccessibility of arsenic in children’s diets of Mexico. J. Sci. Food Agric. 2012, 92, 1725–1731. [Google Scholar] [CrossRef]
  56. Islam, S.; Rahman, M.M.; Duan, L.; Islam, M.R.; Kuchel, T.; Naidu, R. Variation in arsenic bioavailability in rice genotypes using swine model: An animal study. Sci. Total Environ. 2017, 599–600, 324–331. [Google Scholar] [CrossRef]
  57. Fakhri, Y.; Bjørklund, G.; Bandpei, A.M.; Chirumbolo, S.; Keramati, H.; Hosseini Pouya, R.; Asadi, A.; Amanidaz, N.; Sarafraz, M.; Sheikhmohammad, A.; et al. Concentrations of arsenic and lead in rice (Oryza sativa L.) in Iran: A systematic review and carcinogenic risk assessment. Food Chem. Toxicol. 2018, 113, 267–277. [Google Scholar] [CrossRef]
Figure 1. Effects of water management on arsenic accumulation in rice grain. Same letters do not differ significantly at 5% level of significance.
Agronomy 11 01741 g001
Table 1. Physicochemical properties of the soil.
Soil PropertiesValuesDetermination Method
TextureSilt loam
pH (1:2.5, soil: water)6.3Glass electrode pH meter method [27]
Organic carbon (%)1.8Black’s wet oxidation method [28]
Total nitrogen (%)0.10micro-Kjeldahl method [29]
Available P (mg kg−1)9.31Olsen method [30]
Exchangeable K (meq./100 g soil)0.071NH4OAc (1 N) extraction method [31]
Available S (mg kg−1)13.2CaCl2 turbidity method [32]
Total As (mg kg−1)3.73HG-AAS method [33]
Table 2. Effects of water management on plant growth parameters of BRRI dhan28.
TreatmentsPlant Height
(cm)
Panicle Length
(cm)
Filled Grains per
Panicle
(No.)
Unfilled Grains per
Panicle
(No.)
1000-Grain Weight
(g)
T183.5 ± 1.722.1 ± 0.370.40 ± 2.93 cd40.96 ± 1.65 bc16.26 ± 0.19 de
T281.0 ± 1.521.6 ± 0.278.45 ± 1.33 abc36.47 ± 0.80 c18.20 ± 0.17 c
T381.1 ± 0.522.0 ± 0.574.33 ± 0.35 bc44.11 ± 1.17 b17.70 ± 0.36 cd
T478.7 ± 0.822.0 ± 0.573.37 ±1.65 c41.83 ± 0.69 bc19.03 ± 0.19 bc
T578.0 ± 2.721.0 ± 0.464.03 ± 2.89 d59.49 ± 2 a14.76 ± 0.29 e
T681.6 ± 1.922.0 ± 0.382.89 ± 0.9 ab19.75 ± 0.41 d20.27 ± 0.29 b
T782.5 ± 2.222.1 ± 0.786.22 ± 1.13 a8.93 ± 0.32 e22.80 ± 0.55 a
p value0.3360.6440.0000.0000.000
Figures in a column having common letters do not differ significantly at 5% level of significance; p = Probability; SE (±) = Standard Error.
Table 3. Effects of water management on grain and straw yield of rice (cv. BRRI dhan28).
TreatmentGrain Yield
(g/pot)
Grain Yield
Increase over
Control (%)
Straw Yield
(g/pot)
Straw Yield
Increase over
Control (%)
T113.90 ± 0.77 bc-16.84 ± 0.65 ab-
T217.08 ± 0.92 abc22.8820.08 ± 1.99 ab19.23
T317.45 ± 0.47 abc25.5420.03 ± 2.11 ab18.94
T416.20 ± 0.79 bc16.5515.97 ± 1.42 ab−5.16
T513.52 ± 1.43 c−2.7314.01 ± 0.25 b−16.80
T618.19 ± 0.75 ab30.8621.48 ± 1.09 a27.55
T721.08 ± 0.81 a51.6522.02 ± 1.97 a30.76
p value0.001-0.015-
Figures in a column having common letters do not differ significantly at 5% level of significance; p = Probability; SE (±) = Standard Error.
Table 4. Effect of water management on As uptake by rice grain (cv. BRRI dhan28).
TreatmentAs Uptake/Pot
(μg pot−1)
Projected As Uptake/Ha
(g ha−1)
T17.24 ± 0.48 abc1.81 ± 0.12 abc
T28.45 ± 0.46 ab2.11 ± 0.12 ab
T36.65 ± 0.14 bc1.66 ± 0.04 bc
T47.25 ± 0.53 abc1.81 ± 0.13 abc
T54.32 ± 0.43 d1.08 ± 0.11 d
T68.77 ± 0.50 a2.19 ± 0.13 a
T75.69 ± 0.43 cd1.42 ± 0.11 cd
Level of significance******
*** indicates 0.1% level of significance, Figures in a column having common letters do not differ significantly at 5% level of significance; SE (±) = Standard Error.
Table 5. Average daily intake from inorganic As and health risk assessment.
TreatmentsGrain As Concentration
(mg kg−1)
ADI × 10−3
(mg kg−1 bw d−1)
HQCR (×10−3)
T10.523.2110.704.81
T20.493.0210.084.54
T30.382.357.823.52
T40.452.789.264.17
T50.321.976.582.96
T60.482.969.874.44
T70.271.675.552.50
ADI, estimated daily intake of As (mg d−1) per BM (kg); HQ, hazard quotient; CR, cancer risk.
Publisher’s Note: MDPI stays neutral with regard to jurisdictional claims in published maps and institutional affiliations.

