Article

Effect of Ascophyllum nodosum Alga Application on Microgreens, Yield, and Yield Components in Oats Avena sativa L.

by
Barbara Drygaś
1,*,
Joanna Depciuch
2 and
Czesław Puchalski
1
1
Department of Bioenergetics, Food Analysis and Microbiology, Institute of Food Technology and Nutrition, College of Natural Science, Rzeszow University, Ćwiklińskiej 2D, 35-601 Rzeszow, Poland
2
Institute of Nuclear Physics, Polish Academy of Sciences, 31-342 Krakow, Poland
*
Author to whom correspondence should be addressed.
Agronomy 2021, 11(7), 1446; https://doi.org/10.3390/agronomy11071446
Submission received: 24 May 2021 / Revised: 16 July 2021 / Accepted: 17 July 2021 / Published: 20 July 2021

Abstract

:
This paper describes the influence of Ascophyllum nodosum algae on the seeds, microgreens, yield, and yield components of oat Avena sativa cv. Bingo. This article includes the results from three experiments. In one of the experiments, the oat seeds were soaked in a solution of demineralized water with dried comminuted and homogenized algae. For the FT–Raman spectra measurements, a spectrometer with an Nd:YAG laser, with a germanium detector, was used. The results obtained show that an excessively low as well as an excessively high alga concentration did not have an influence on the change in oat composition. Other algae concentrations that were used in these experiments caused significant chemical changes in the oat seeds. For the FT–Raman data, separation of the control from all the oat grains treated with different algae concentrations was possible. The aim of the pot experiment was to determine the effect of the application of algae (in different doses) on the A. sativa green mass of young plants (microgreens). The certified oat seeds, after being soaked in a solution with algae, were planted in the ground. For the chemometric analysis of the oat samples, a Fourier-transform infrared (FTIR) spectrometer device was used. The data were recorded with a viewing diamond with an attenuated total reflection (ATR) crystal plate. The FTIR spectra showed that soaking in an algae suspension affected the germination, general metabolism, and chemical composition of the oats. The use of algae did not change the lipid content of the plant. The three-year field experiment was established by introducing two factors: A. nodosum application (A) and a pre-sowing stimulation with a low-frequency magnetic field (S). The influence of experimental factors on the oat yield and its structure (yield structure components and yield components) was investigated. The beneficial effect of algae on oat yield was demonstrated by improved parameters such as the number and weight of the grains; however, under field conditions, the pre-sowing magnetic field stimulation of seeds did not have a beneficial effect. Various weather conditions also had a great influence on the yield. This study also considered the role of A. nodosum as a biostimulant in plants, and this showed potential under less favorable conditions.

1. Introduction

The idea of sustainable agriculture is based on the need to develop modern technologies to improve plant production efficiency and food quality while reducing adverse impacts on the environment [1,2,3,4]. An important element of effective and sustainable plant production is good seed quality with good health and viability [5]. The use of physical factors has a positive effect on the metabolic processes of grains [6].
Environmental factors, such as stress, also limit the growth and productivity of plants. In the current global scenario, to meet the requirements of the ever-increasing world population, chemical pesticides and synthetic fertilizers are used to boost agricultural production. These harmful chemicals pose a serious threat to the health of humans, animals, plants, and the entire biosphere [7]. According to Kahane et al. [8], modern cereal breeding programs should be replaced by breeding programs of so-called development opportunity crops, which are nutritious crops that are currently under-valued and under-utilized [8]. The current management strategy in the agriculture industry relies on the search for new, natural biological agents that will act not only against different pathogens, but will also have stimulating effects on plants [9]. One way to reduce fertilizer doses without compromising plant nutrition is to increase their uptake of nutrients through natural sources [10].
According to a scientific definition [11], “A plant biostimulant is any substance or microorganism applied to plants with the aim to enhance nutrition efficiency, abiotic stress tolerance and/or crop quality traits, regardless of its nutrients content.” By extension, plant biostimulants can be commercial products that contain mixtures of these substances and/or microorganisms [11]. According to the European Biostimulant Industry Council (EBIC) [EIBC] [12], “Plant biostimulants contain substance(s) and/or microorganisms whose function when applied to plants or the rhizosphere is to stimulate natural processes to enhance/benefit nutrient uptake, nutrient efficiency, tolerance to abiotic stress, and crop quality.” They act through mechanisms that are distinct from fertilizers, regardless of the presence of nutrients [12]. Examples of biostimulants include humic and fulvic acids, protein hydrolysates and other N-containing compounds, seaweed extracts and botanicals, chitosan and other biopolymers, inorganic compounds, beneficial fungi, and bacteria [13]. When using seaweed extracts as stimulants, attention should be paid to the fact that some of its substances may be similar to those found in plants (phytohormones) and may act inside or outside the plant (leaf surface or soil) and have physical, physio-chemical (osmolytes), metabolic (antioxidants), hormone-like, and physiological effects on nutrition efficiency and biotic and abiotic stress responses [13].
The legal definition of fertilizers is as follows: “Products intended to provide plants with nutrients or to increase the fertility of soils or to increase the fertility of fish ponds, such as mineral fertilizers, natural fertilizers, organic fertilizers and organic-mineral fertilizers” [14]. Indeed, mineral fertilizer use has a strong impact on the environment.
Seaweed biomass as a fertilizer and a source of organic matter has been used for a long time in the agricultural industry, but its biostimulant effects have only recently been reported [11] In plants, the nutritional effects of seaweed, i.e., supplying micro- and macro-nutrients, indicate that it also acts as a fertilizer, in addition to its other roles [15,16].
Extracts of Ascophyllum nodosum have been examined for their ability to improve plant growth and agricultural productivity [7]. By using preparations based on A. nodosum, an improvement in yield has been achieved in Capsicum annuum (pepper) [17], Vitis vinifera (grapevine) [18,19], Clementine mandarins and Navelina oranges [20], Citrullus lanatus (watermelon) [21], strawberries [22], Spinacia oleracea (spinach) [23], and Allium cepa (onion) [24]. A. nodosum is a rich source of bioactive phenolic compounds, such as phlorotannins and polysaccharides, i.e., alginic acid, fucoidans, mannitol, and laminarin [7]. Some of the compounds show seasonal variation [24,25]. The biostimulation effects of A. nodosum, among others, have been proven. These include mitigating abiotic stresses (including drought and freezing) in plants, improving salinity tolerance, improving plant defenses against various pathogens, improving soil health, changes in the modes of action and/or function of rhizospheric microbial populations, changes in the host plant that induce changes in the rhizospheric microbial population, and regulating phytohormone biosynthesis [7]. There is also evidence that the hormonal effects of A. nodosum extracts can be explained, to a large extent, by the regulation of hormone biosynthetic genes in plant tissues [11,26], and not only the hormonal contents of the seaweed extracts themselves. Alga-based preparations are produced in several ways, such as water-based extraction, acid hydrolysis, alkaline hydrolysis, and microwave-assisted, ultrasound-assisted, enzyme-assisted, super-critical fluid, and pressurized liquid extractions [7].
Different extraction procedures are used for the production of seaweed-based biostimulants in liquid and powder form. Various extraction methods have been cited in the literature that use both dry and wet biomass. The bioactivity and composition of A. nodosum biostimulants are not all identical and depend on the extraction method applied. In this study, water extracts were used. The biostimulatory compounds in this method were sourced by blending and hydrating dried seaweed meal in the presence of water. Biostimulants prepared using this method, in all likelihood, show activity that is similar to hormone-like activity [7].
Exposing seeds to a magnetic field (MF) may provide a viable alternative to improve seed vigor and vitality. The effect of exposing seeds to an MF before germination has been confirmed by many authors [27]. Negative consequences of treating plants with an MF or an artificial MF from the plant environment, such as the deterioration of growth traits, have also been reported, as well as a lack of consequences of treating plants with an MF. For instance, in a 1977 study, no response of oats (Avena sativa L.) to pre-sowing magnetic stimulation was found [28]. The enhancement of growth in crops under precise MF conditions has been confirmed, but an extensive, more accurate study is still necessary in order to delineate the mechanisms of the magnetic action in cells and tissues [29].
Oats, a plant with significant nutritional properties, were the subject of this experiment. The largest producers of oats are the European Union Member States (7.9 megatons per year), followed by Russia (4.4 meg-atons) and Canada (4.160 megatons), Australia (935 tons per year), Brazil (825 tons), and the USA (771 tons) [30]. In terms of yield per hectare (data from 2019), Chile and New Zealand have the highest yields (averaging 6 tons per hectare). European countries mostly yielded 3 tons per hectare. Taking into account the sowing area (in thousands of hectares), the largest sowing area is located in the following European Union countries (2552), Russia (2400) and Canada (1160) [30].
According to Ebert, western diets could be positively modified by micro-scale vegetable production, such as sprouts or microgreens of, for example, alfalfa, black gram, chickpea, lentil, mung bean, soybean, barley, maize, oat, rice, wheat, amaranth, buckwheat, quinoa, linseed, sesame, sunflower, broccoli, cabbage, carrot, celery, clover, fennel, kale, leek, lettuce, parsley, radish, arugula, spinach, onion, turnip, and watercress [31].
In the last decade, there has been an increase in sprouted grains in the human diet and increased scientific literature regarding their nutritional traits and phytochemical contents [32]. Nowadays, consumer lifestyles have shifted toward “healthy living and healthier foods”. “Microgreens” is a marketing term used to describe a category of products that have no legal definition. They differ from sprouts in requiring light and a growing medium and have a longer growing cycle [33]. “Microgreens” is the most common and equivocal market term for seedlings that are at the fully expanded cotyledon stage, or at the first true leaf stage, and are sold with stems, cotyledons, and first true leaves [32].

2. Materials and Methods

2.1. Microgreens Experiment
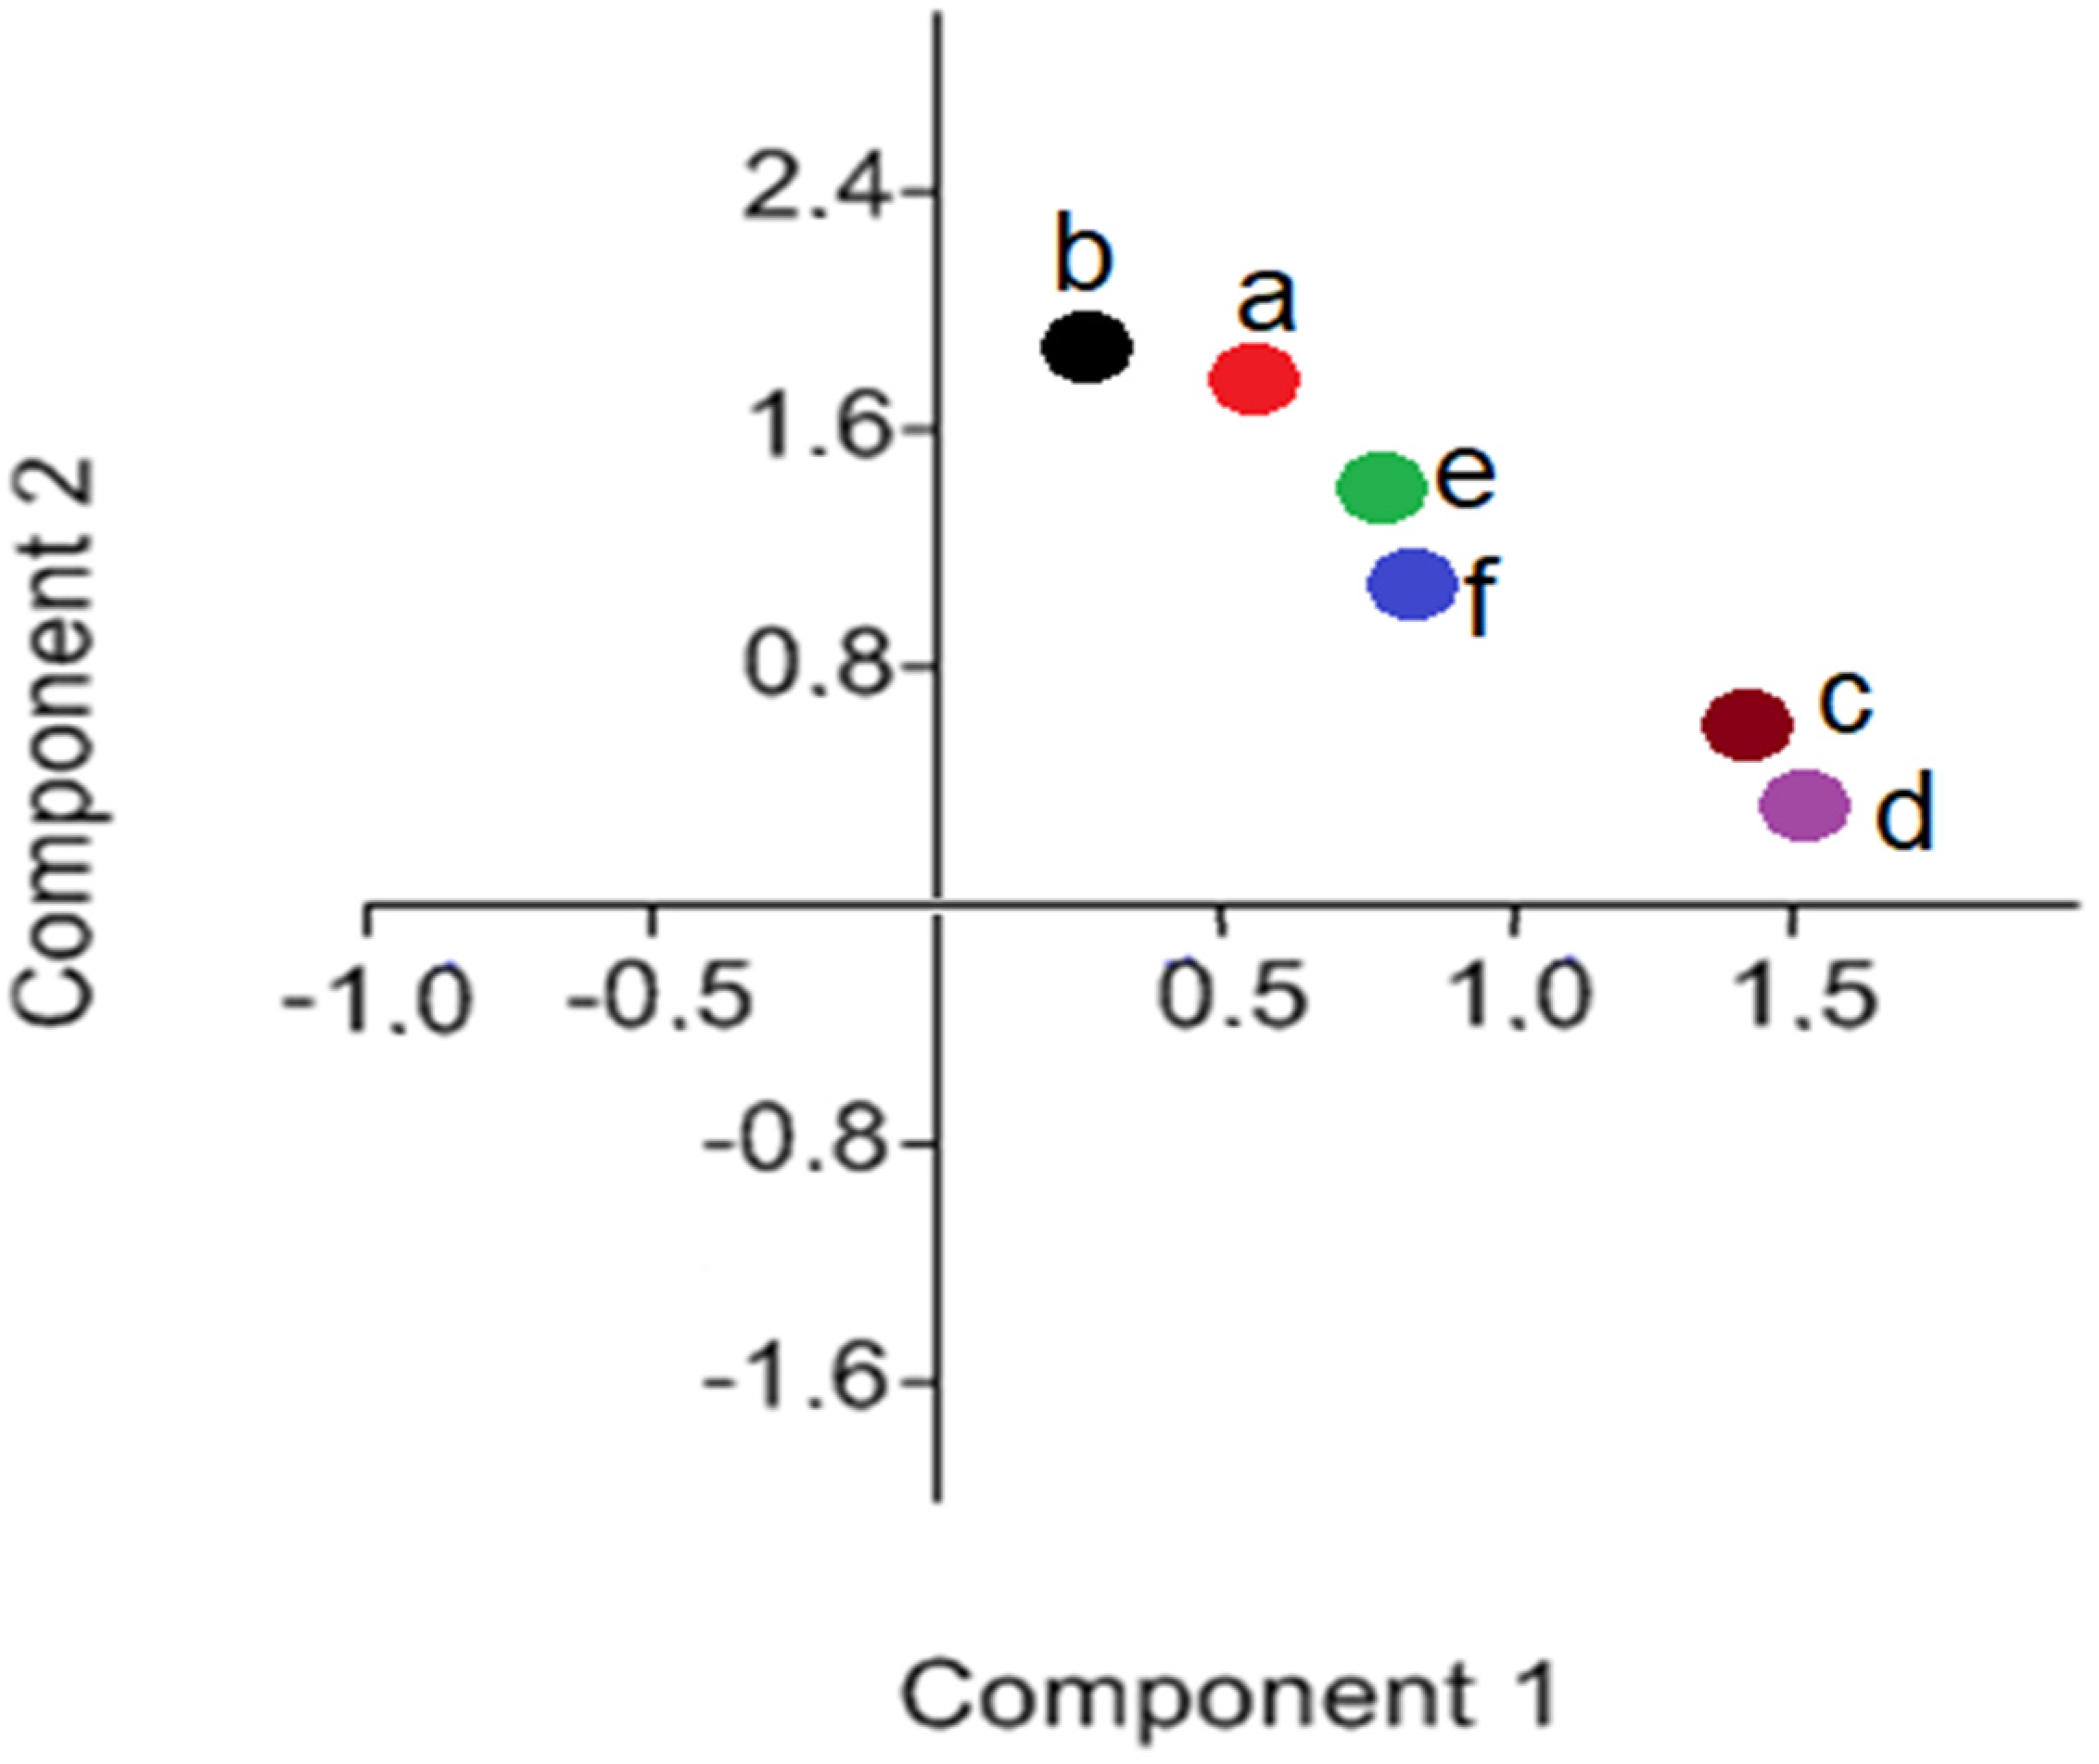
The aim of the pot experiment was to determine the effect of the application of algae (in different doses) to the A. sativa green mass of young plants (microgreens). The microgreens used in the experiment were also called “oatgrass”, which is similar to wheatgrass, and is the youngest stage of wheat plants that grow from the wheat grain, taking 6–10 days to germinate (related to Triticum aestivum) [33,34]. In cereals, the terms “ricegrass” for rice and “barleygrass” for barley are also used. The generic term “cereal grass” could be utilized [34].
The certified oat seeds (cv. Bingo) were soaked in a solution of demineralized water with dried comminuted and homogenized algae for 24 h, without access to light, at a temperature of 20 ± 1 °C. The mixture (suspension) was homogeneous at the following concentrations (w/v):
(a)
control (dose 0) seeds soaked in water without the addition of algae;
(b)
dose 0 without soaking;
(c)
0.5% algae;
(d)
1% of algae;
(e)
5% of algae;
(f)
10% of algae.
The experiment was carried out under controlled conditions—i.e., a pot experiment. The following growing conditions were ensured:
  • Bright period imitating day: 16 h (350 µmol·m−2·s−1) at 23 °C; dark period imitating night: 8 h at 16 °C.
  • Air humidity 75–80%.
  • Universal soil Sterlux (HolLas) was used; pH: 5.5–6.5 NPK (nitrogen–phosphorus–potassium) fertilizer + Mg (magnesium) 14–16–18 + (5)–0.6 kg·m−3, maximum salinity 1.9 g NaCl dm−3.
  • Each object (=pot containing seeds treated with the same dose) in four repetitions.
  • Material for analysis: 10-day-old plants (above-ground part—young leaves).
This study was performed in 2016. The study was conducted in a climatic chamber.

2.1.1. FTIR Spectroscopy

For the chemometric analysis of oat samples, a Fourier-transform infrared (FTIR) spectrometer (Vartex 70v, Brucker, Germany) device was used. All the samples were prepared from the middle section of the young leaves, from which the main veins were removed. Moreover, before being measured, the materials were dried and ground in an agate mortar to a fine powder in order to obtain information about the average chemical compositions collected from all the analyzed parts of the leaf.
The data were recorded with a viewing diamond with an attenuated total reflection (ATR) crystal plate. A liquid nitrogen-cooled mercury cadmium telluride (MCT) detector was used to verify the infrared spectra of the samples. Briefly, the oat samples were placed on the diamond/MCT of the ATR unit. The results from the spectra were obtained at a scanning range of 600–4000 cm−1 and at a resolution of 4 cm−1. Each spectrum had an average of 32 scans and the measurement time was approximately 1 min for each spectrum. We recorded and analyzed the spectral data of oats using OPUS software (Brucker, Germany). Water molecules in the air affected the IR spectra [35]; therefore, the spectrum of the empty diamond/MCT of the ATR unit was verified automatically as background and was subtracted using the appropriate software. ATR spectra were baseline-corrected [36], and to remove the normalized scaling [37] that is commonly used in other studies [38,39], the Savitzky–Golay filter was used for smoothing [39].

2.1.2. Statistical Analysis

To determine the similarity between the samples from the pot experiment, principal component analysis (PCA) was performed. First, PCA was undertaken, which reduced the dimensionality and data variables while maintaining as much variance as possible. PCA was performed based on the selected spectral regions between 800 and 1800 cm−1. This analysis was done using OriginPro 2019b software (OriginLab Co.; Northampton, MA, USA).

2.2. Seed Experiment

The oat Bingo seeds were soaked in a solution of demineralized water with dried comminuted and homogenized algae for 24 h, without access to light, at a temperature of 20 ± 1 °C. The mixture (suspension) was homogeneous at the following concentrations (w/v):
(1)
Control (dose 0) seeds soaked in water without the addition of algae;
(2)
0.025% of algae
(3)
0.01% of algae;
(4)
0.05% of algae;
(5)
0.1% of algae;
(6)
0.25% of algae;
(7)
0.5% of algae;
(8)
1% of algae;
(9)
2.5% of algae;
(10)
5% of algae;
(11)
10% of algae;
(12)
15% of algae.
Washed and dried seeds were the material for analysis.

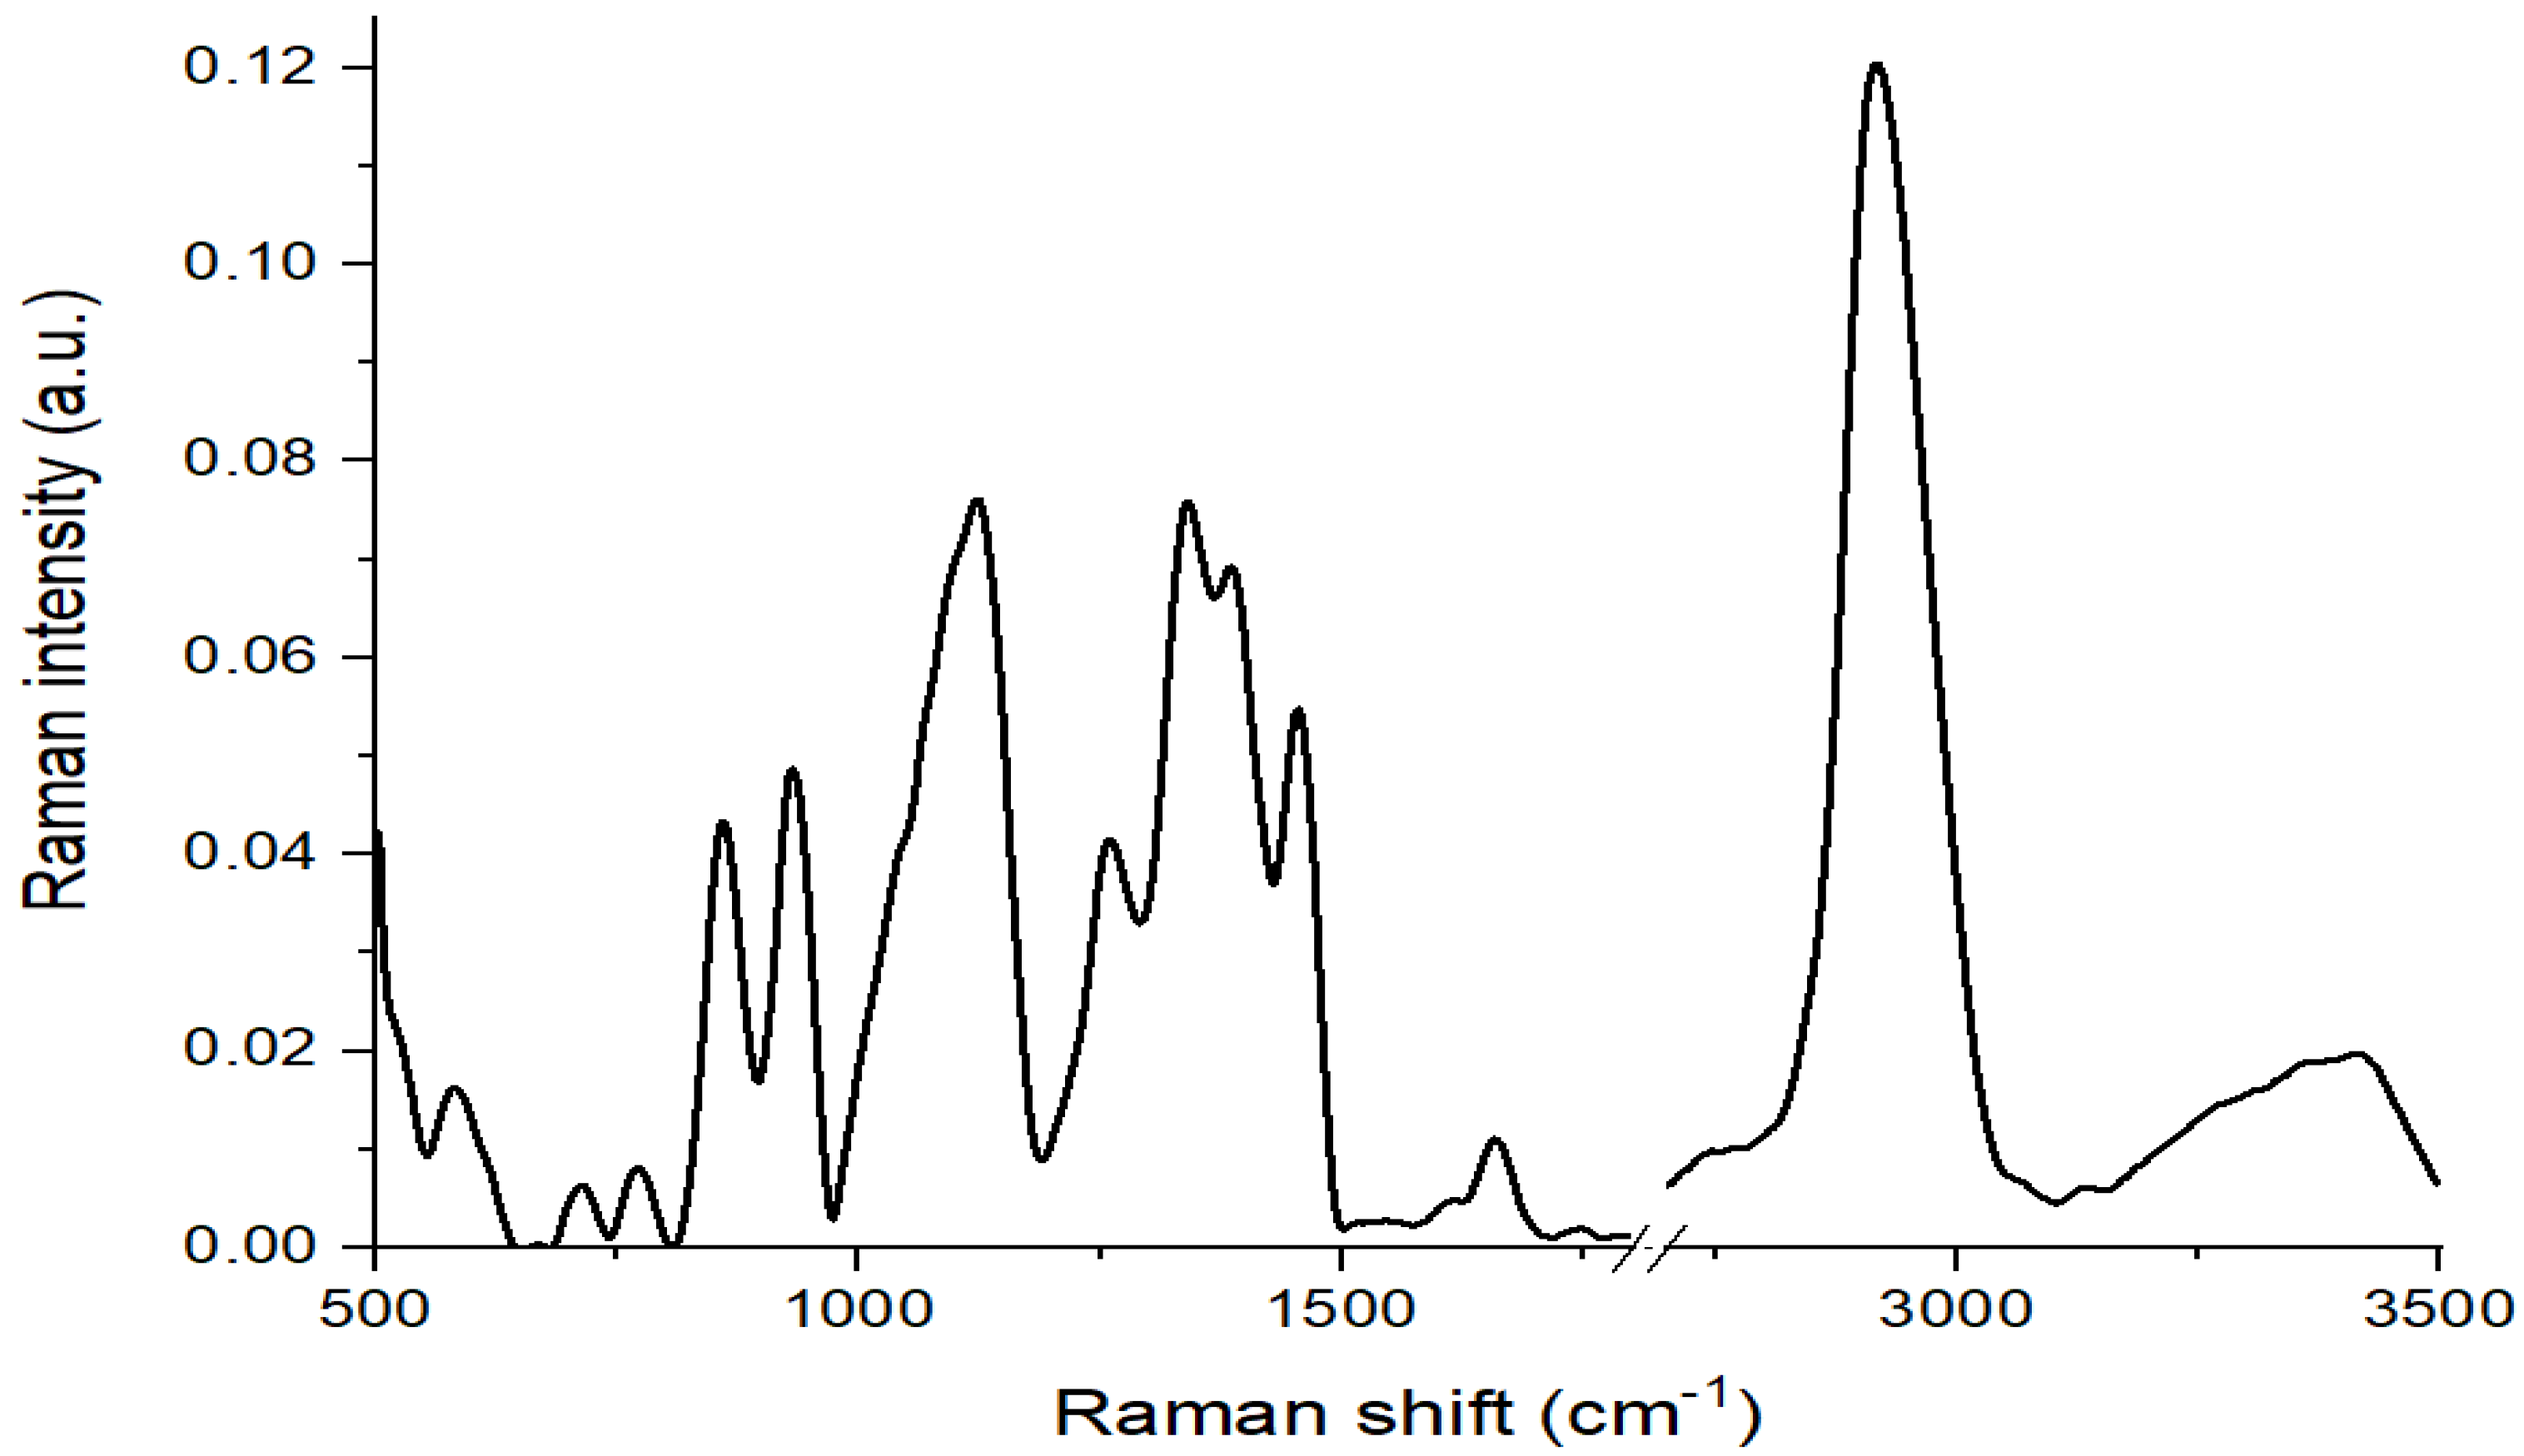
2.2.1. FT–Raman Measurements

For the FT–Raman spectra, a Nicolet NXR 9650 FT–Raman Spectrometer was used. The spectrometer had an Nd:YAG laser (1064 nm) and a germanium detector. The measurement range was between 150 cm−1 and 3700 cm−1. The laser power was 0.5 W. Moreover, each sample was measured using 64 scans with an 8 cm−1 resolution. All the spectra obtained were analyzed with OPUS software using baseline correction, smoothing (7 points), and normalization with vector normalization functions.

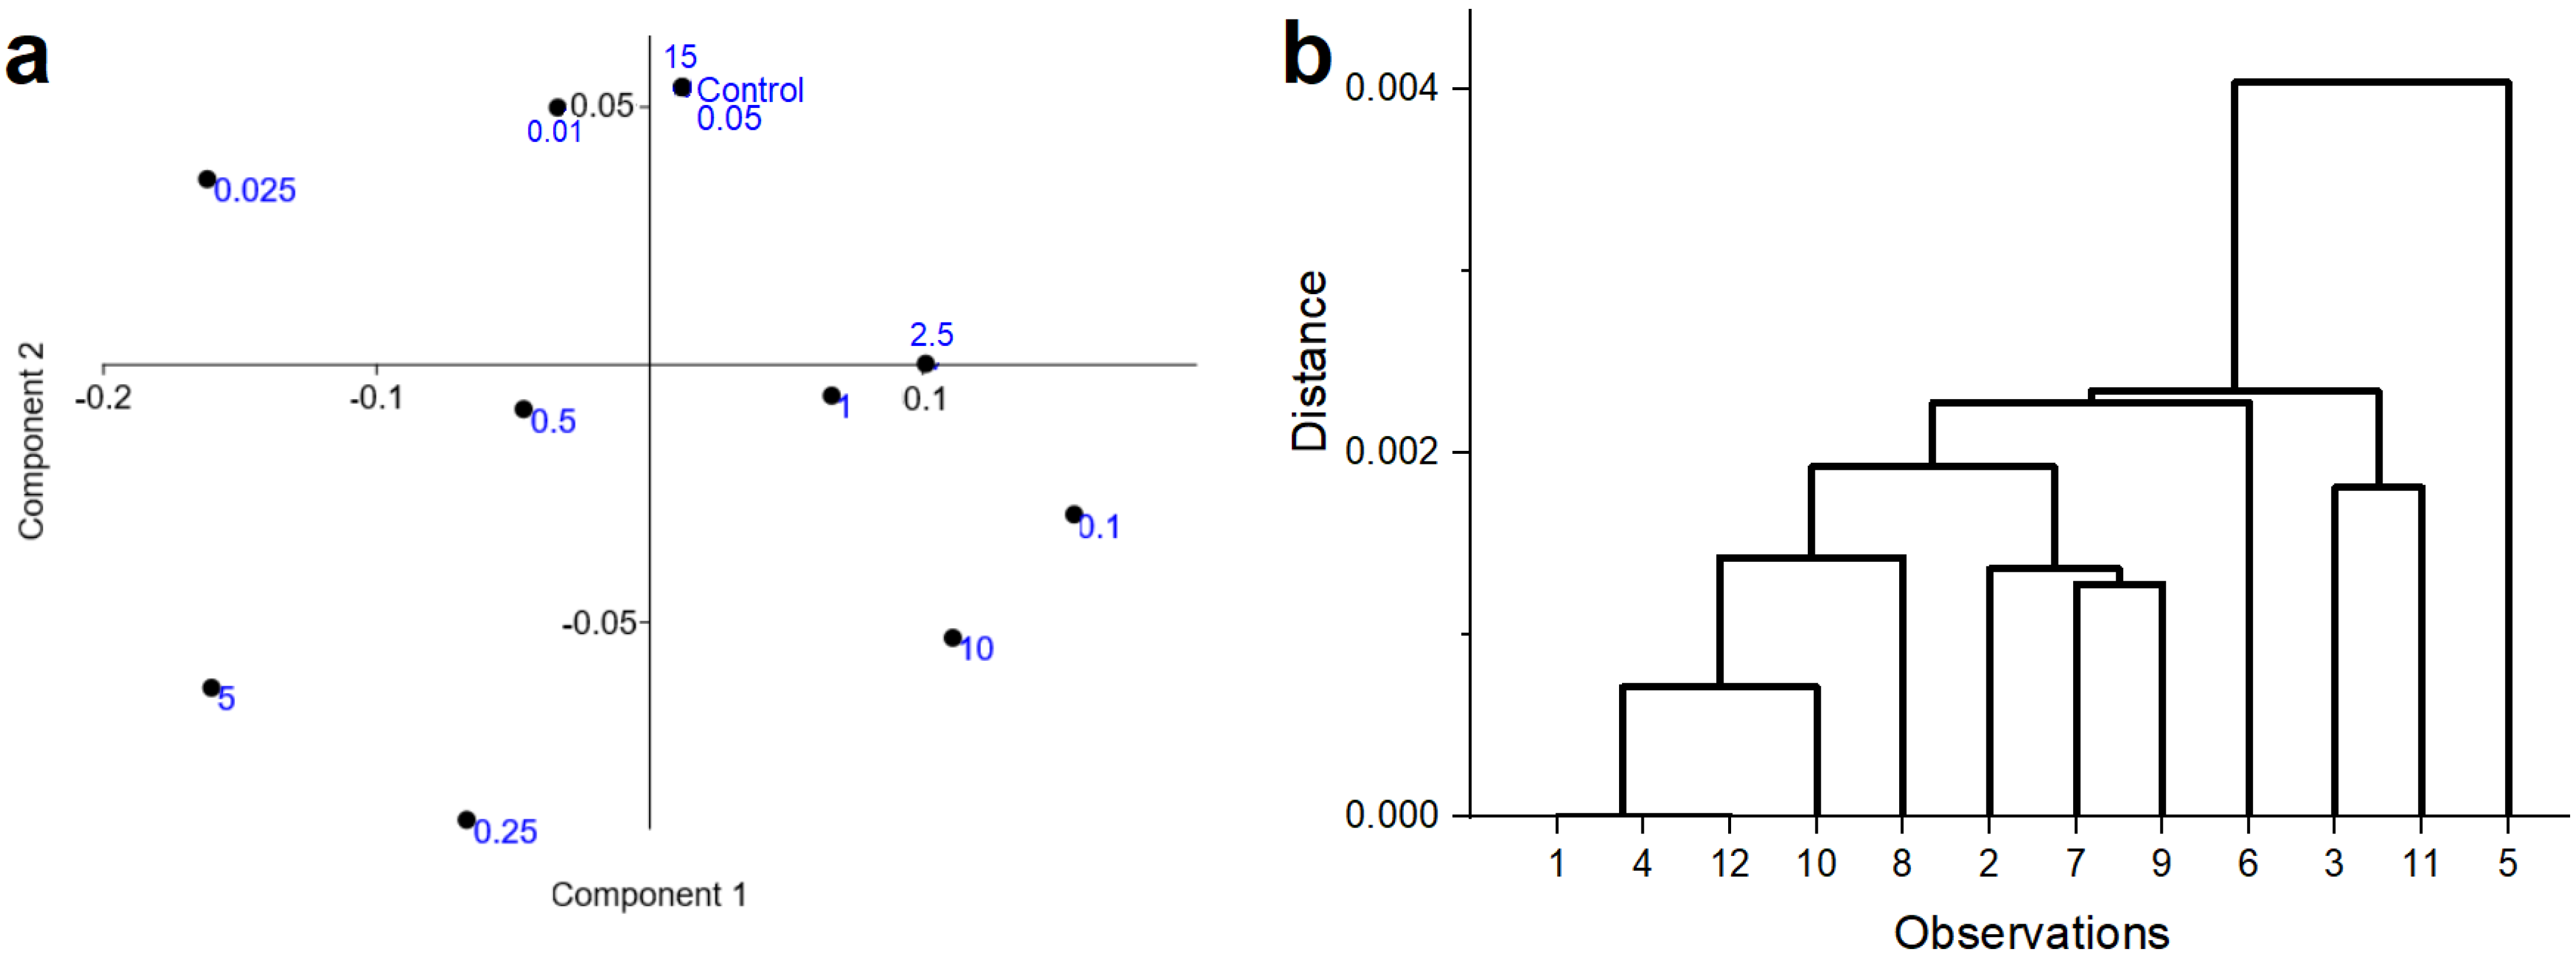
2.2.2. Statistics—Multivariate Analysis, Pearson Correlation Test

Principal component analysis (PCA) was performed in order to obtain information about the spectral variation among the types of samples. PCA reduced the dimensionality, which is the number of variables in the data, while maintaining as much variance as possible. PCA was performed based on the selected spectral regions, which were determined after counting the average values of the Raman intensities of the analyzed peaks. Furthermore, an HCA (hierarchical cluster analysis) analysis was performed to determine the similarity between each group of samples. All the analyses were performed using Past 3.0 software. In addition, considering the low number of samples in this study, a partial least squares (PLS) analysis was performed. It was used in the case of multicollinearity problems associated with complex biological data when the number of predictors was much larger than the number of samples in the tall or wide data sets, as in this study. Moreover, variables’ importance in projection (VIP) was calculated in order to define the most important vibrational band that was associated with the separation between each type of measured sample. The PLS analysis and VIP factor calculation were performed using OriginPro 2019b software (OriginLab Co.; Northampton, MA, USA).

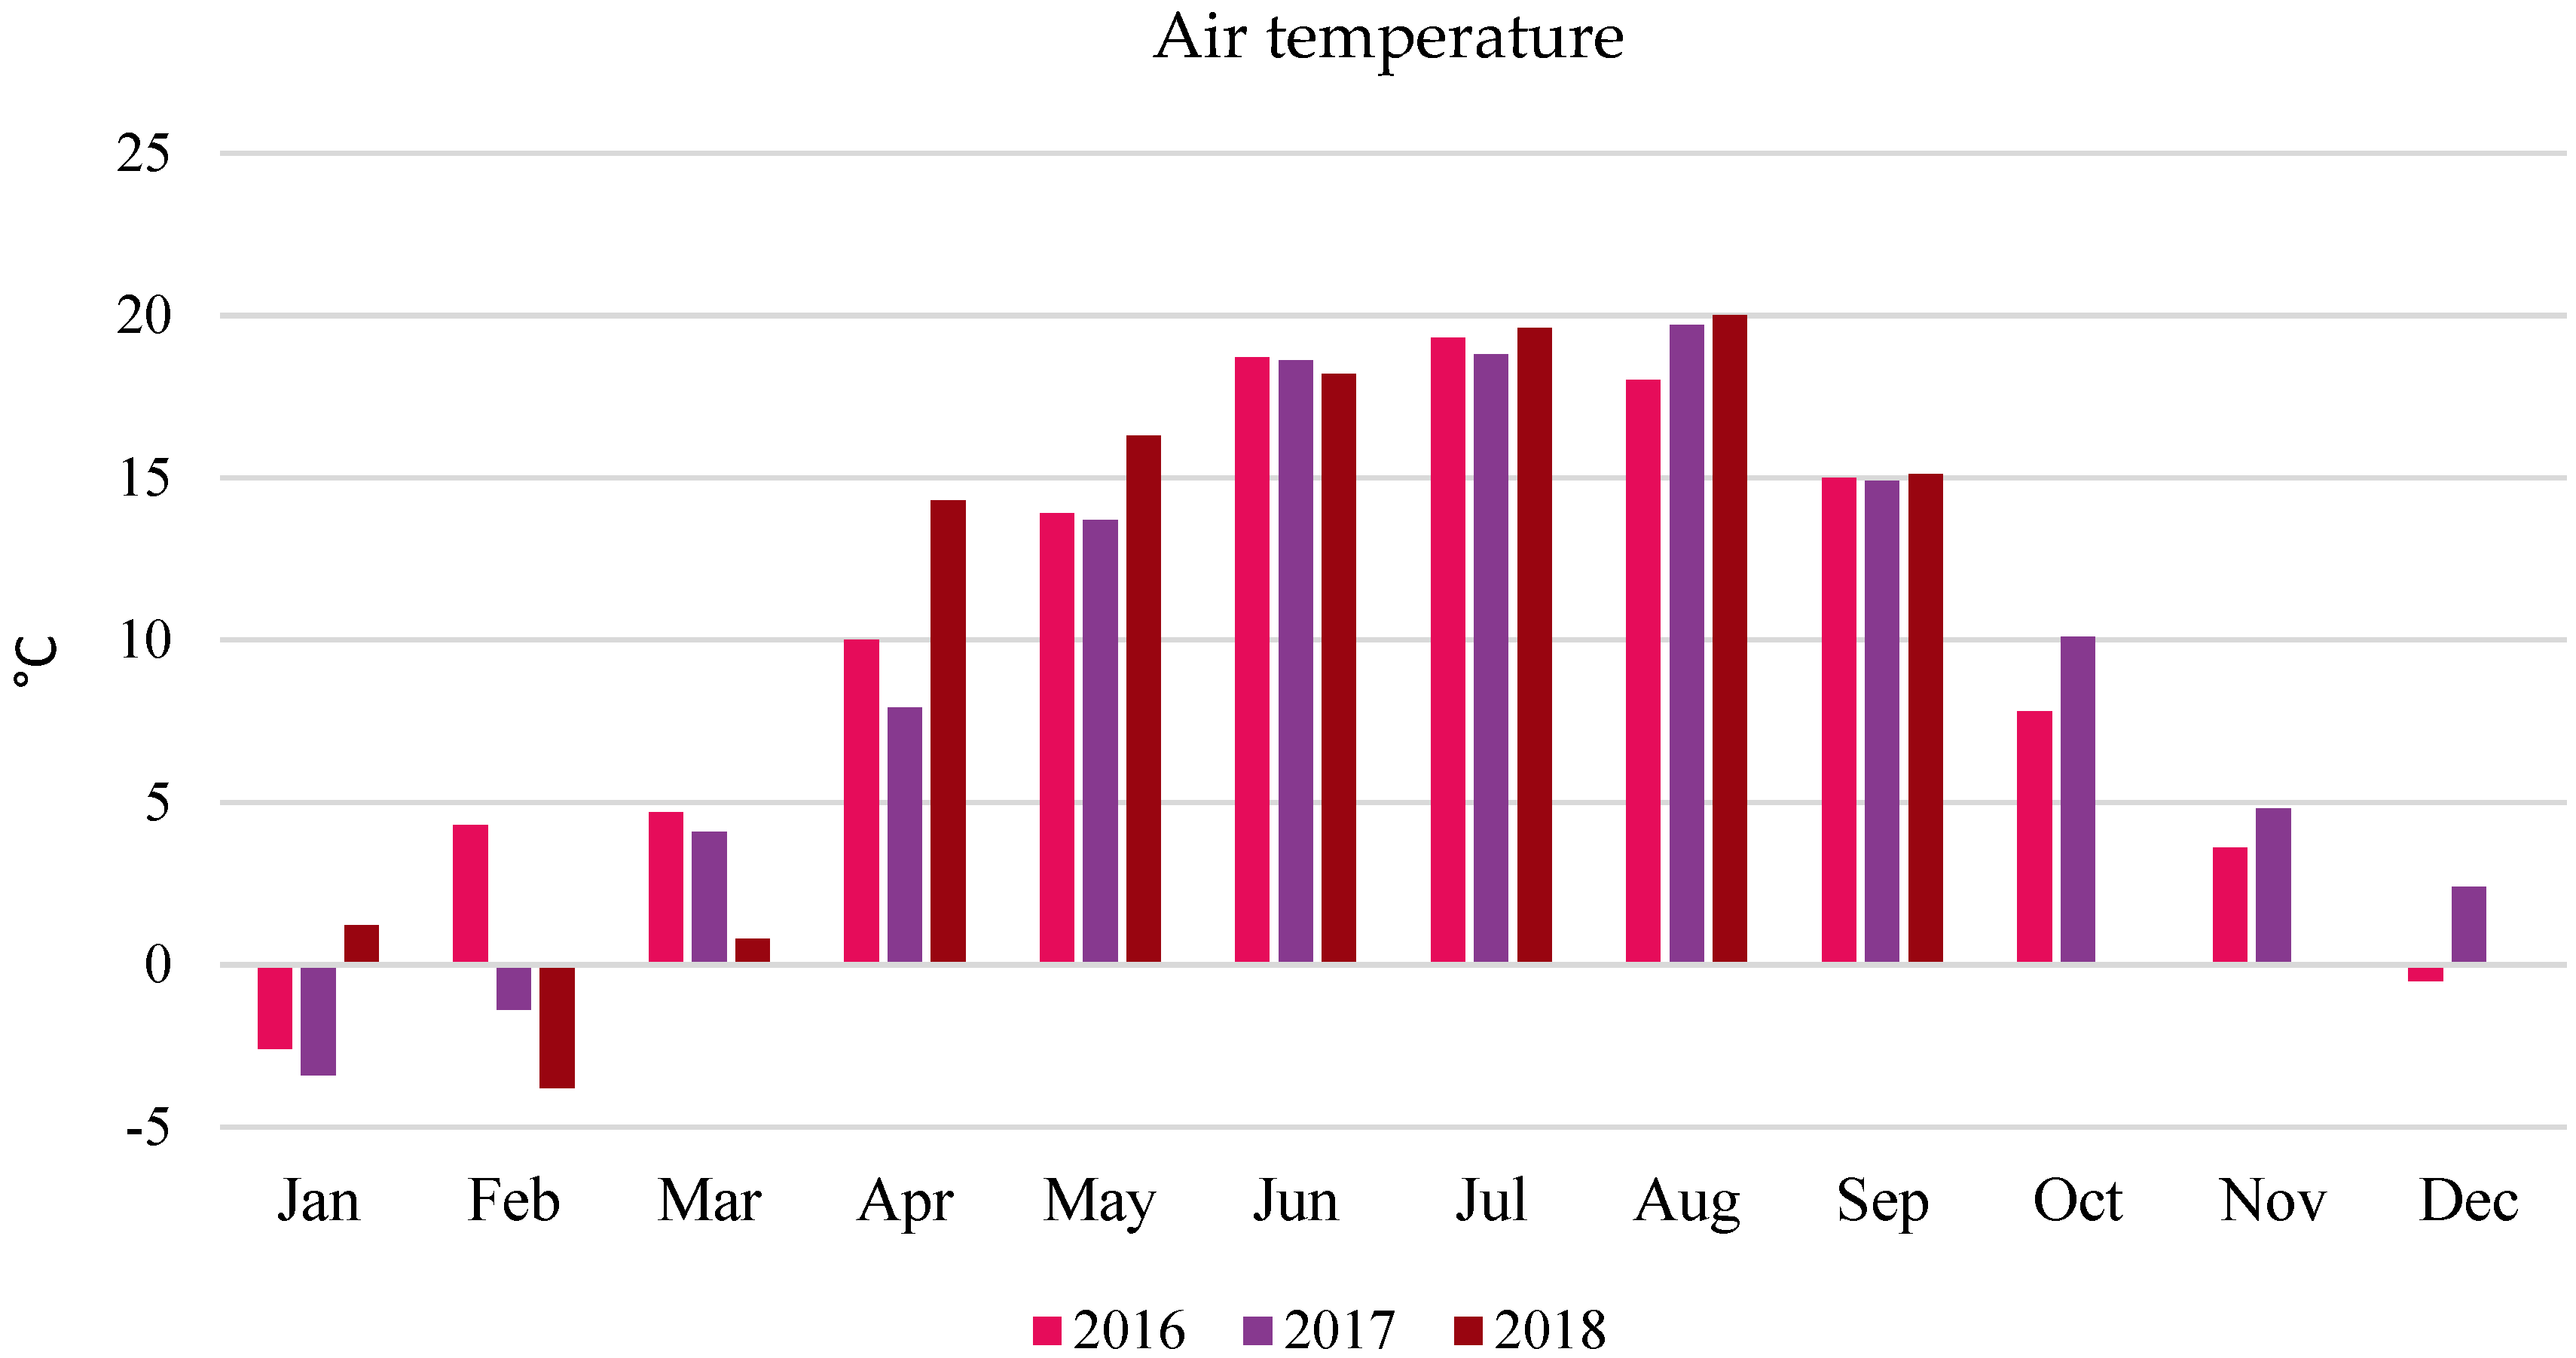
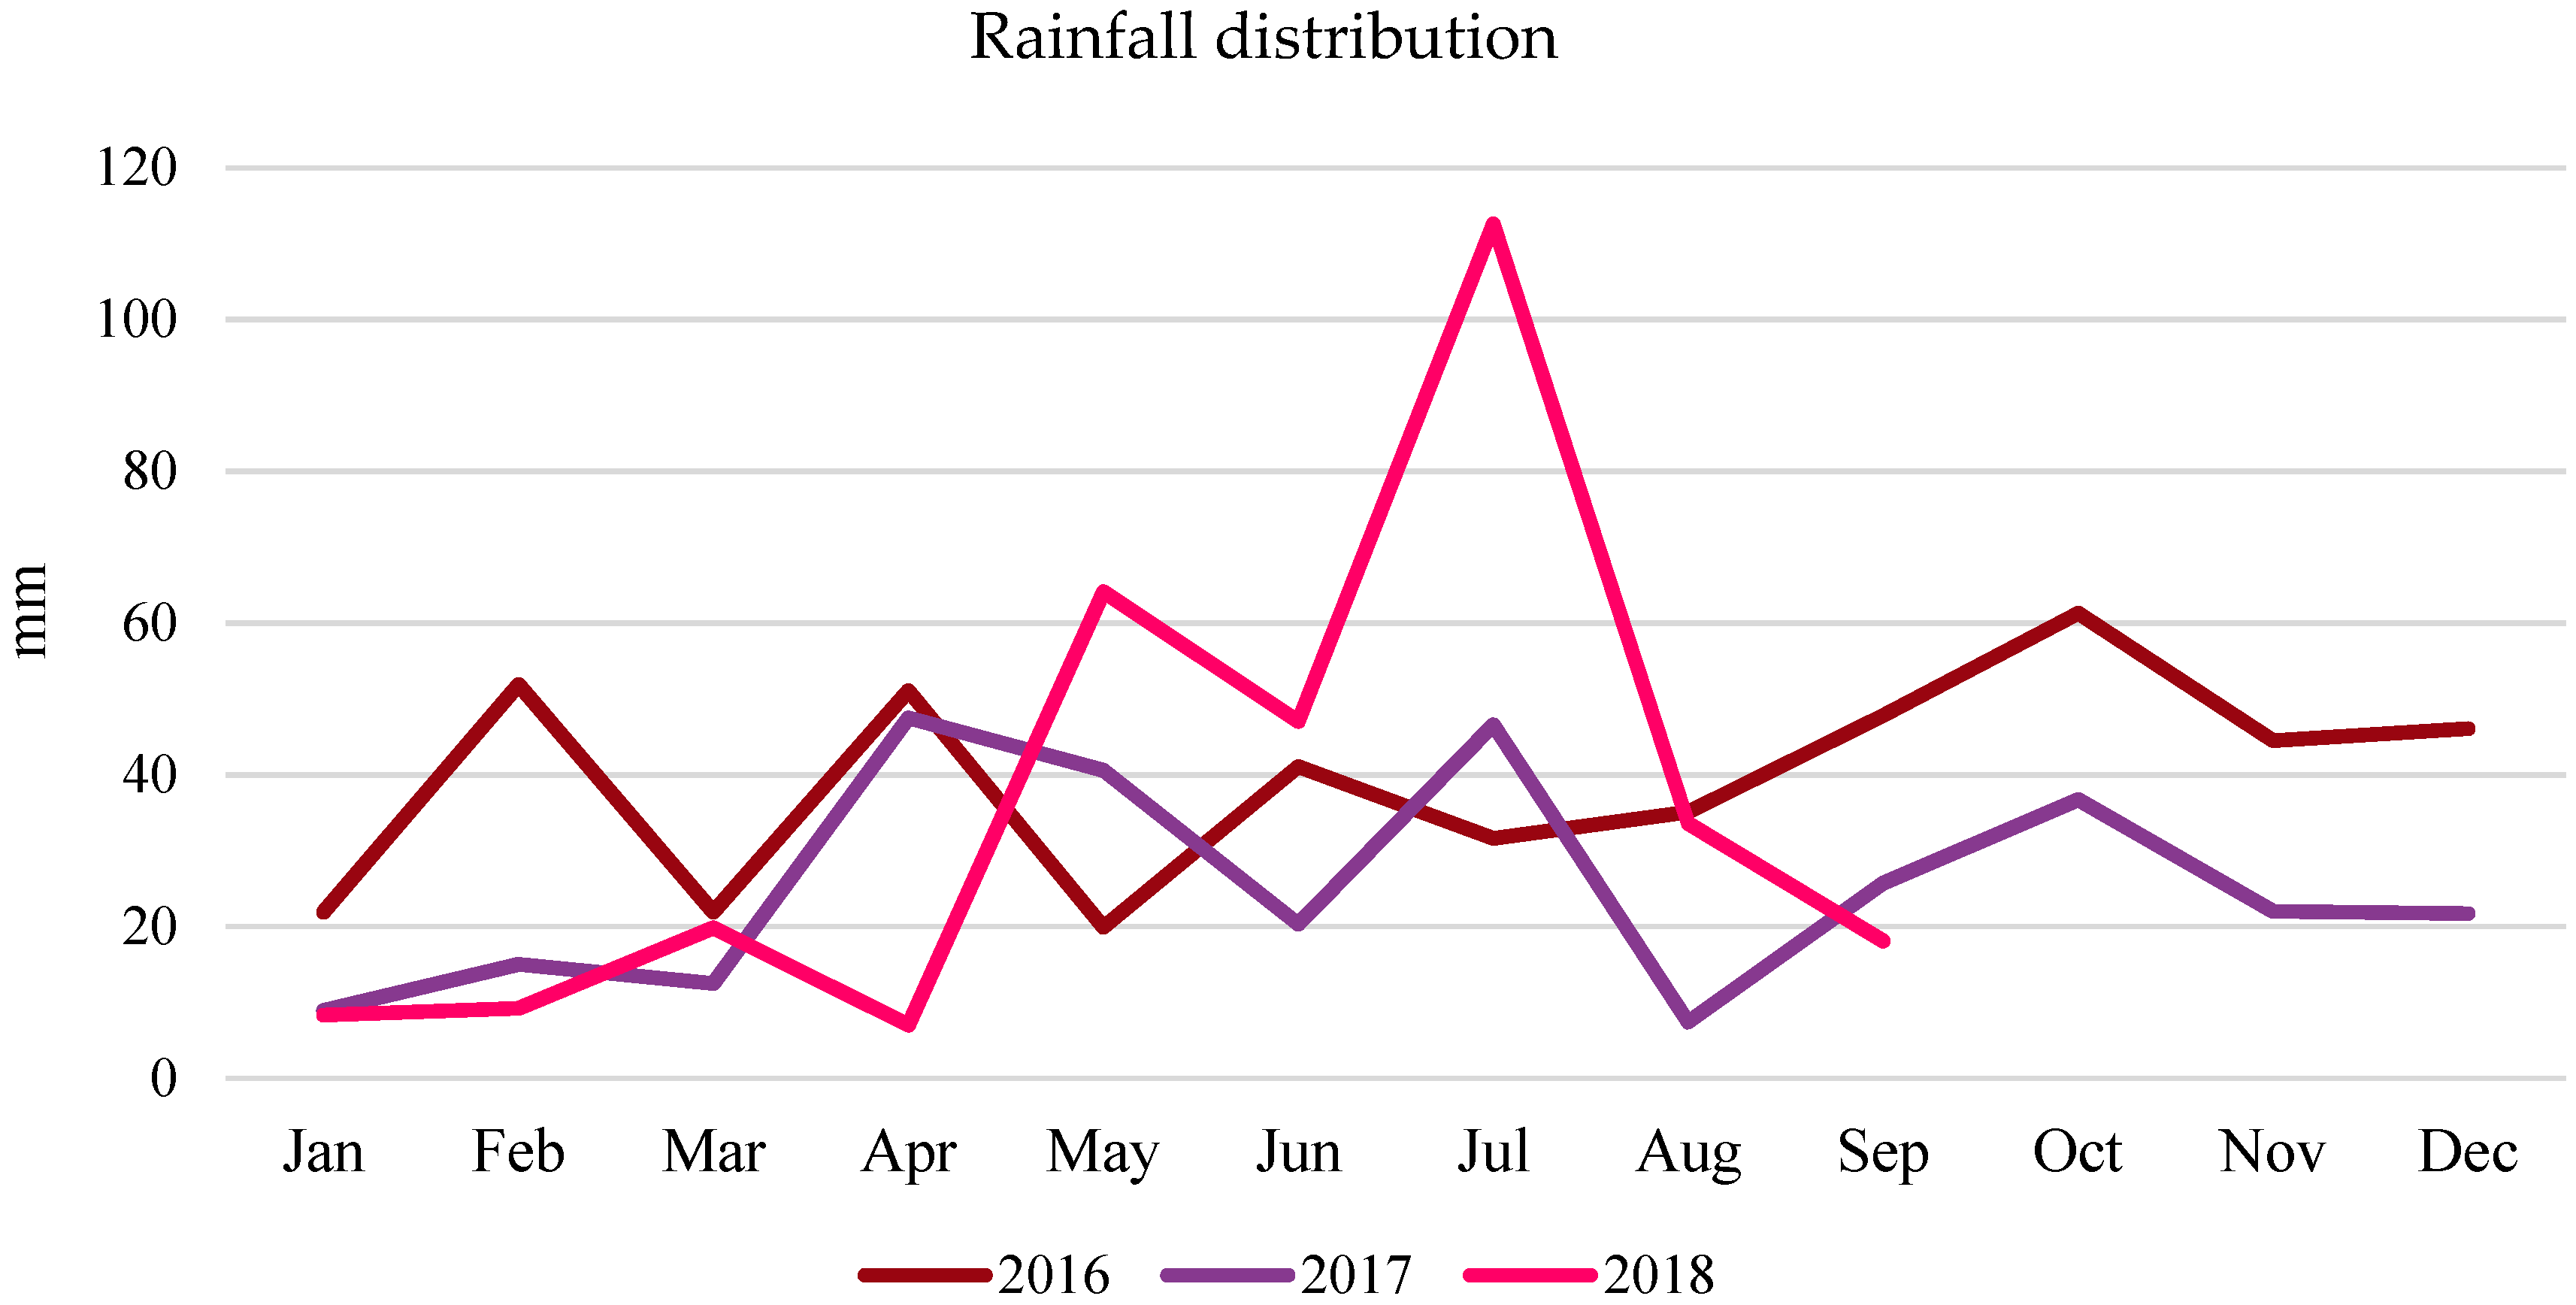
2.3. Field Experiment

A three-year field experiment was established in Krasne (50°30′ N and 22°06′ E) and was carried out from 2016 to 2018. The Bingo variety was chosen due to the need for a stable pattern with a proven even yield. The certified seeds came from the central seed station (IHAR Strzelce, Poland). After the harvesting of forecrops, the field was plowed annually and then harrowed; then, mineral fertilizers were sown, and pre-winter plowing was done. Cultivating and harrowing was carried out before sowing. The oat seeds were sown with an SPZ 020 suspended seed drill. Weed control was done with the herbicide Chwastox Turbo 340 SL (MCPA, dicamba; CIECH Sarzyna S.A., Poland), and Asparagus beetles with Karate Zeon 050 CS in the amount of 0.6 L·ha−1. The experiment was carried out in a split-block system (equivalent subblocks and perpendicular strips). Table 1 shows the total content, which has been divided into 2 doses for level A1 and 4 doses for level A2. This is the total dose that was delivered in installments. This means that each individual spray contained (g·ha−1) 1.6 B, 1.25 Mn, 1.05 Cu, 3.1 Zn and Fe—0.215 kg·ha−1.
The factor was applied to foliage with 2- and 4-fold spraying during the tillering (BBCH 29) and stalk shooting (BBCH 39) phases. The MF exposure of the seeds consisted of placing the seeds, on the day of sowing, in a 50 mT magnetic field at 50 Hz over: 6 s (S1) and 60 s (S2), with S0 (stimulation at 0 = no magnetic stimulation) as a control. Conditions for conducting the field experiment are presented in Table 2.
Meteorological data from the Meteorological Station of the University of Rzeszów located in the Rzeszów Zalesie municipal district (50°30′ N and 22°01′ E) were collected and utilized in order to develop humidity characteristics for individual months based on the “k” indicator, with a division into classes (Sielianinov coefficient). The air temperature and precipitation distribution around the experimental area are presented in Figure 1 and Figure 2, respectively.
Moisture characteristics of the months of the growing season depending on the value of the Sielianinov hydrothermal coefficients are presented in Table 3.
Testing results in the field experiment were subjected to statistical analyses. A two-way analysis of variance was carried out using Statistica software (ver. 13.3, StatSoft Inc., Tulsa, OK, USA/TIBCO Software Inc. Palo Alto, CA, USA) in order to assess the influence of the tested factors on the chemical composition of the grain. The significance of the differences between the means of the objects and between years was examined using a Tukey’s multiple comparison test at a significance level of α = 0.05. According to Tukey’s HSD (honest significant difference) test, the means marked with the same letter were not significantly different at α ≤ 0.05.

3. Results

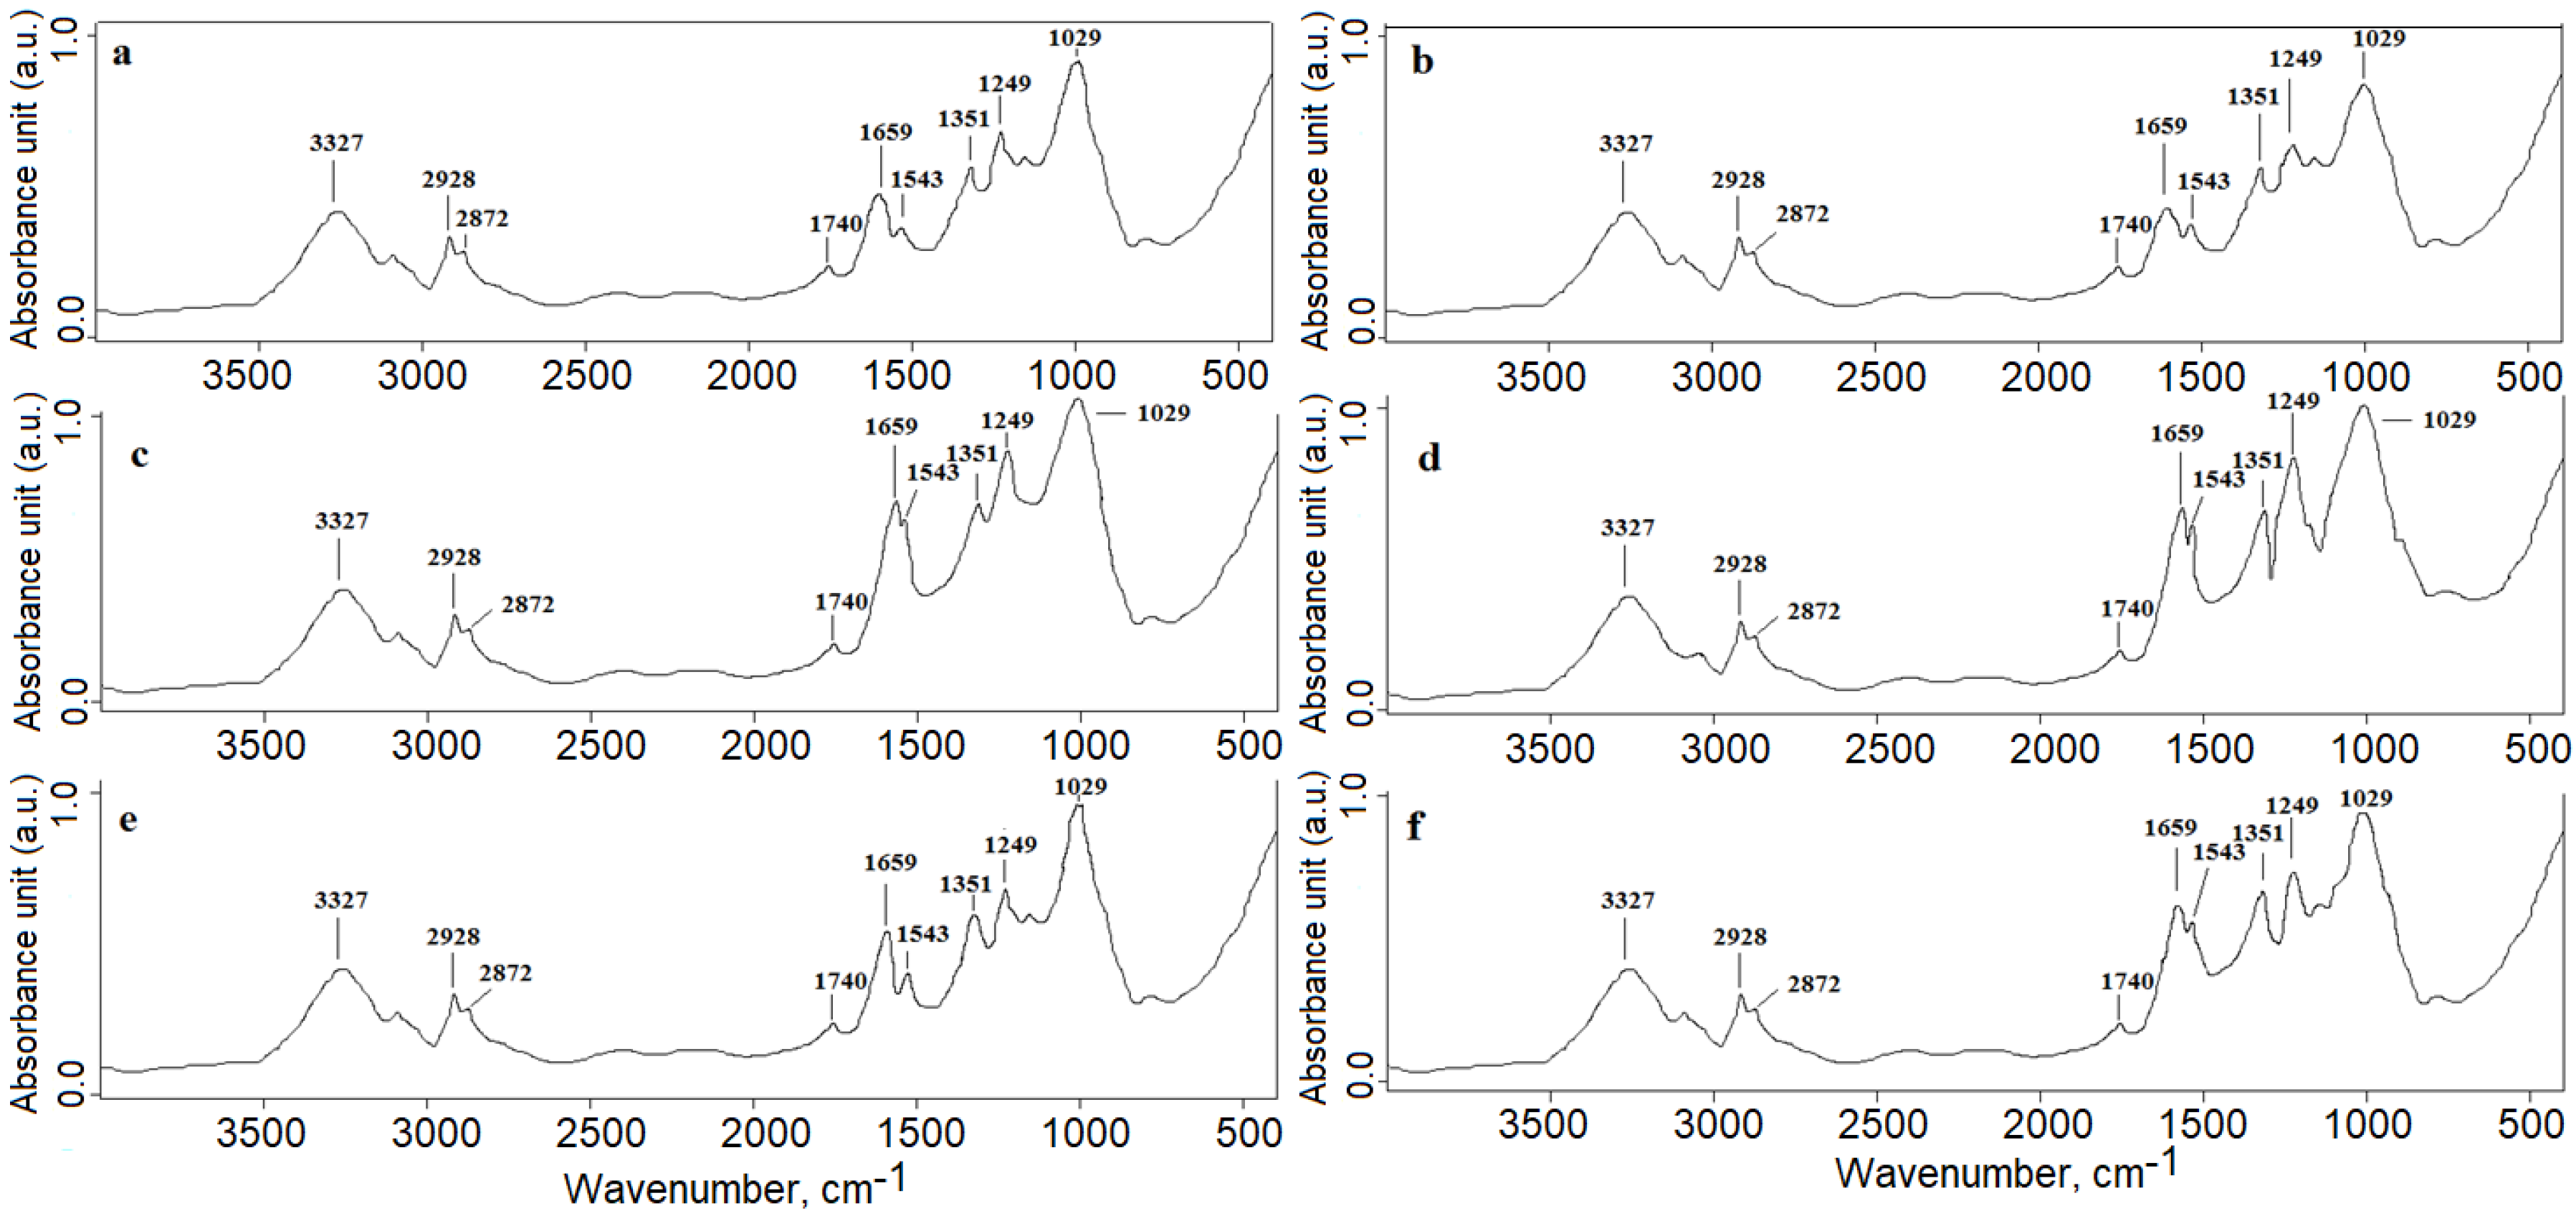
3.1. FTIR Analysis (Microgreens Experiment)

In the FTIR spectra (Figure 3), peaks corresponding to functional groups of polysaccharides, proteins, and lipids were visible. The peak at 1029 cm−1 corresponded to the stretching vibrations of the C–O–C groups from the polysaccharides, while the peak at 1351 cm−1 originated from cellulose. Moreover, stretching PO2− modes at 1249 cm−1 were visible. Furthermore, the peaks at 1543, 1659, and 3327 cm−1 corresponded to protein vibrations, specifically from the N–H and C–N stretching vibrations of amide II, amide I, and amide A, respectively, while the last wave number also originated from the stretching vibrations of water. Moreover, a vibration in the C=O groups was visible at 1740 cm−1. The last IR region corresponded to lipid vibrations. In the FTIR spectra, two peaks corresponded to symmetric vibrations in the CH3 group and the asymmetric vibrations of the CH2 group [40,41].
The FTIR spectra showed that algae suspension soaking affects plants, their general metabolism, and the chemical composition of oat leaves. Plants from grains that were soaked in a 1%, 0.5%, 5%, or 10% suspension showed higher absorbance values for the sugar-building functional groups (1029 and 1351 cm−1) and proteins (1543 and 1659 cm−1), as compared to the control oats. The highest absorbance values were found for oats treated with 0.5% and 1% stimulator concentrations. The leaves derived from treated grains with algae in the two highest concentrations (5% and 10%) did not show large spectral differences among themselves, while in the case of lower doses (0.5% and 1%), differences between the spectra could be seen. The use of algae did not change the lipid content of the plant.
The FTIR analysis showed that the concentration of algae in the suspension affected plants. When analyzing the influence of A. nodosum on the germination of kernels, it was noticed that oat seeds treated with an algae dose of 1%, 0.5%, 5%, or 10% showed higher absorbance values for the sugar (1029 and 1351 cm−1) and protein functional groups (1543 and 1659 cm−1), as compared to the control. Compared to the control samples, lower absorbance values of the chemical compound of the oats were seen in sample b (without water, 0%). Moreover, it was observed that the highest absorbance values were for the oats treated with 0.5% and 1% doses of the biostimulator. It was noticed that the oats treated with the preparation in the two highest doses (5% and 10%) did not show large spectral differences among themselves. With the other doses (0.5% and 1%), differences between the spectra could be seen.
PCA was performed in order to determine which oat samples were similar, thus determining the effect of the alga dose on the plant’s production of the chemical compounds identified in the FTIR spectra (Figure 4).
The PCA analysis showed that the samples treated with 5% and 10% algae solutions were the most similar to the control. These samples were also similar to one another. Similarly, the samples soaked in 0.5% and 1% algae solutions showed similarity with one another. The PCA analysis also showed that the measured samples were similar to the control, but to different degrees, as mentioned above. This similarity was due to the classification of all the tested samples being in one quadrant of the diagram.

3.2. Seed Experiment (Raman Spectroscopic Measurements)

To determine the chemical structure of oat seeds and the changes in their structures, FT–Raman spectroscopy measurement, combined with multivariate analysis, was performed. In Figure 5, the FT–Raman spectra of the oat seeds are presented. In these spectra, stretching vibrations of the C–C groups were noticed in wave numbers between 810 cm−1 and 975 cm−1. Moreover, FT–Raman ranged between 920 cm−1 and 960 cm−1; 1190 cm−1 and 1455 cm−1 originated from functional groups from polysaccharides. Peaks at 1260 cm−1, 1382 cm−1, and 1338 cm−1 corresponded to amide III and the secondary structure of proteins (α-helix), while the peak at 1550 cm−1 and 1637 cm−1 originated from the C–O groups that build proteins and lipids. Finally, the FT–Raman ranged between 2800 cm−1 and 3000 cm−1, which corresponded to the C-H groups that were part of the carbon chains of fatty acids.
The FT–Raman spectrum consists of a large amount of numerical data, which provides information about the vibrations of functional groups; however, some of them are not always different, despite, for example, oat seeds being treated with different concentrations of algae. Therefore, in order to select the values of statistically significant wave numbers, which allowed us to distinguish individual spectra and then to show which of them were similar to others, PCA and HCA analysis was performed (Figure 6).
The PCA of average spectra (Figure 6a) showed that the Raman spectra of the control and samples treated with 0.05 and 15 concentrations of algae could not be distinguished by the FT–Raman spectra. This means that this algae concentration did not cause the changes in the chemical structure of the oats. These results were confirmed by the HCA analysis (Figure 6b), where samples numbered 1, 4, and 12 created one very similar group of samples. Interestingly, sample number 8 (1 algae concentration) was also similar to this group. The results obtained show that an excessively low as well as an excessively high algae concentration did not have an influence on the change in the oat composition. Moreover, PCA analysis showed that the other algae concentrations that were used in these experiments caused significant chemical changes in the oat grains. Consequently, the HCA analysis showed which algae concentrations caused similar changes. The first similarity group was created with samples treated with 0.025, 0.5, and 2.5 algae concentrations, while the second similarity group was created with samples treated with 0.05 and 10 algae concentrations.
The PCA obtained from the FT–Raman data showed a separation between the control and treated samples. Therefore, a partial least squares analysis (PLS) with variables importance in projection (VIP) was performed (Figure 7).
The PLS results presented as plots in the predictor in Figure 7a showed that, in the FT–Raman spectra, the region that could be used to separate oat grains treated with different algae concentrations was between 500 cm−1 and 1500 cm−1 and around 2700–2800 cm−1. Moreover, the region between 1500 cm−1 and 1700 cm−1 was very important in describing the changes in the proteins and polysaccharides. The VIP values were generated from the model, as shown in Figure 7b. The threshold level was established at 0.8. Note that the VIP values were not associated for all the measured FT–Raman spectra. For the FT–Raman data, the VIP values showed that separation of the control and all the oat grains treated with different algae concentrations was possible.

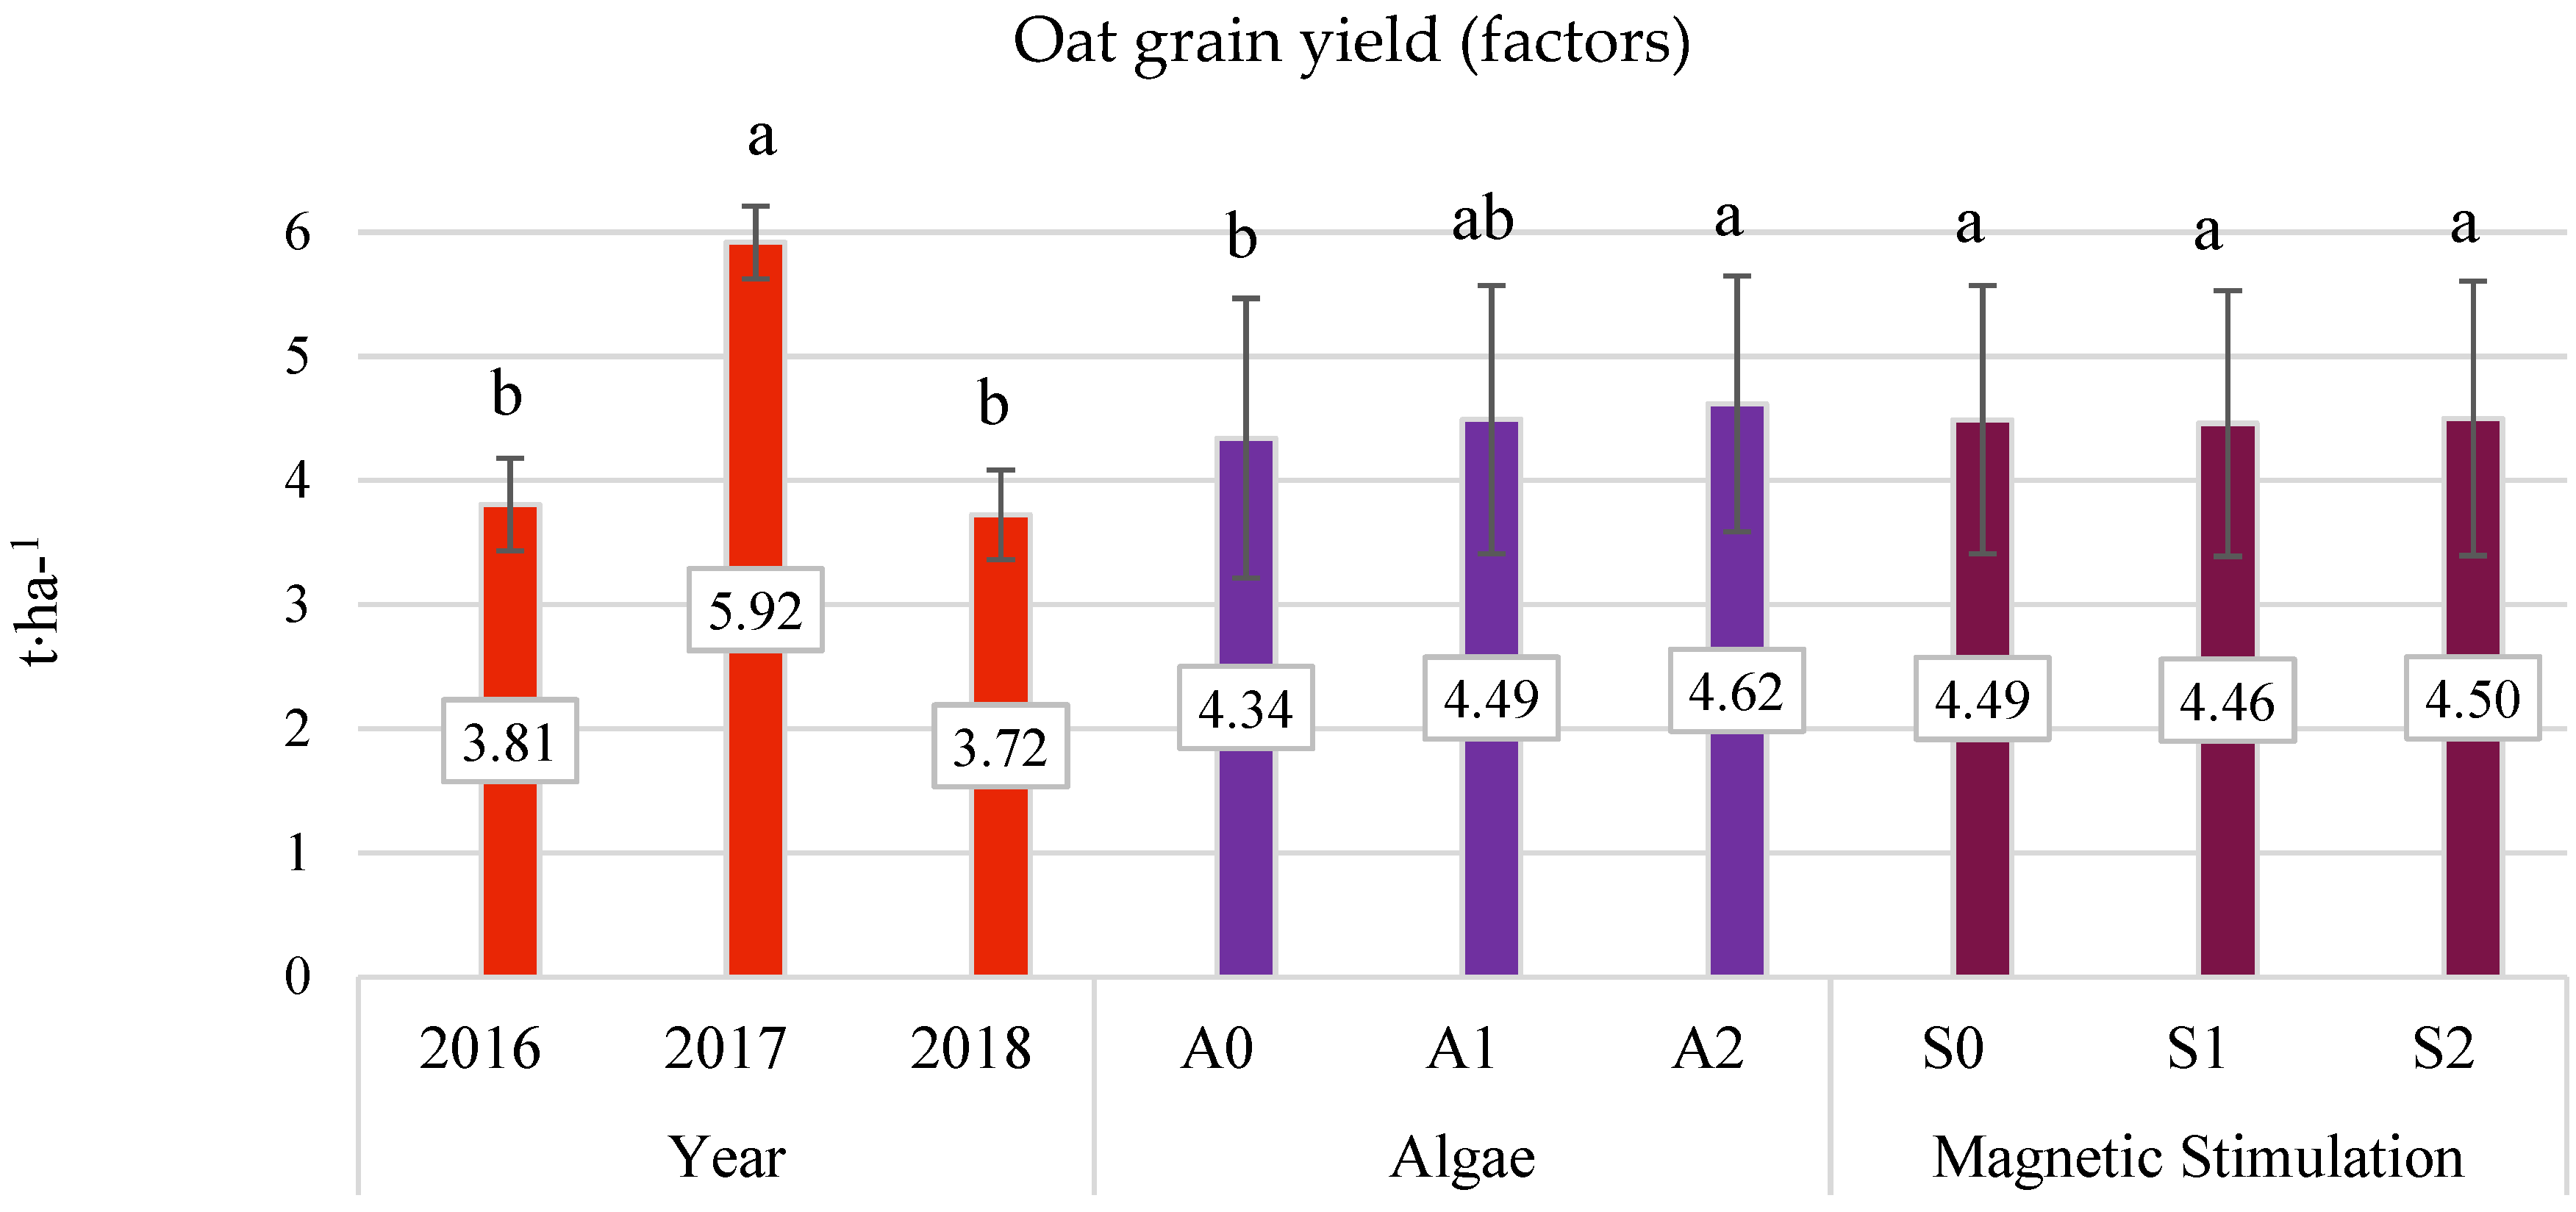
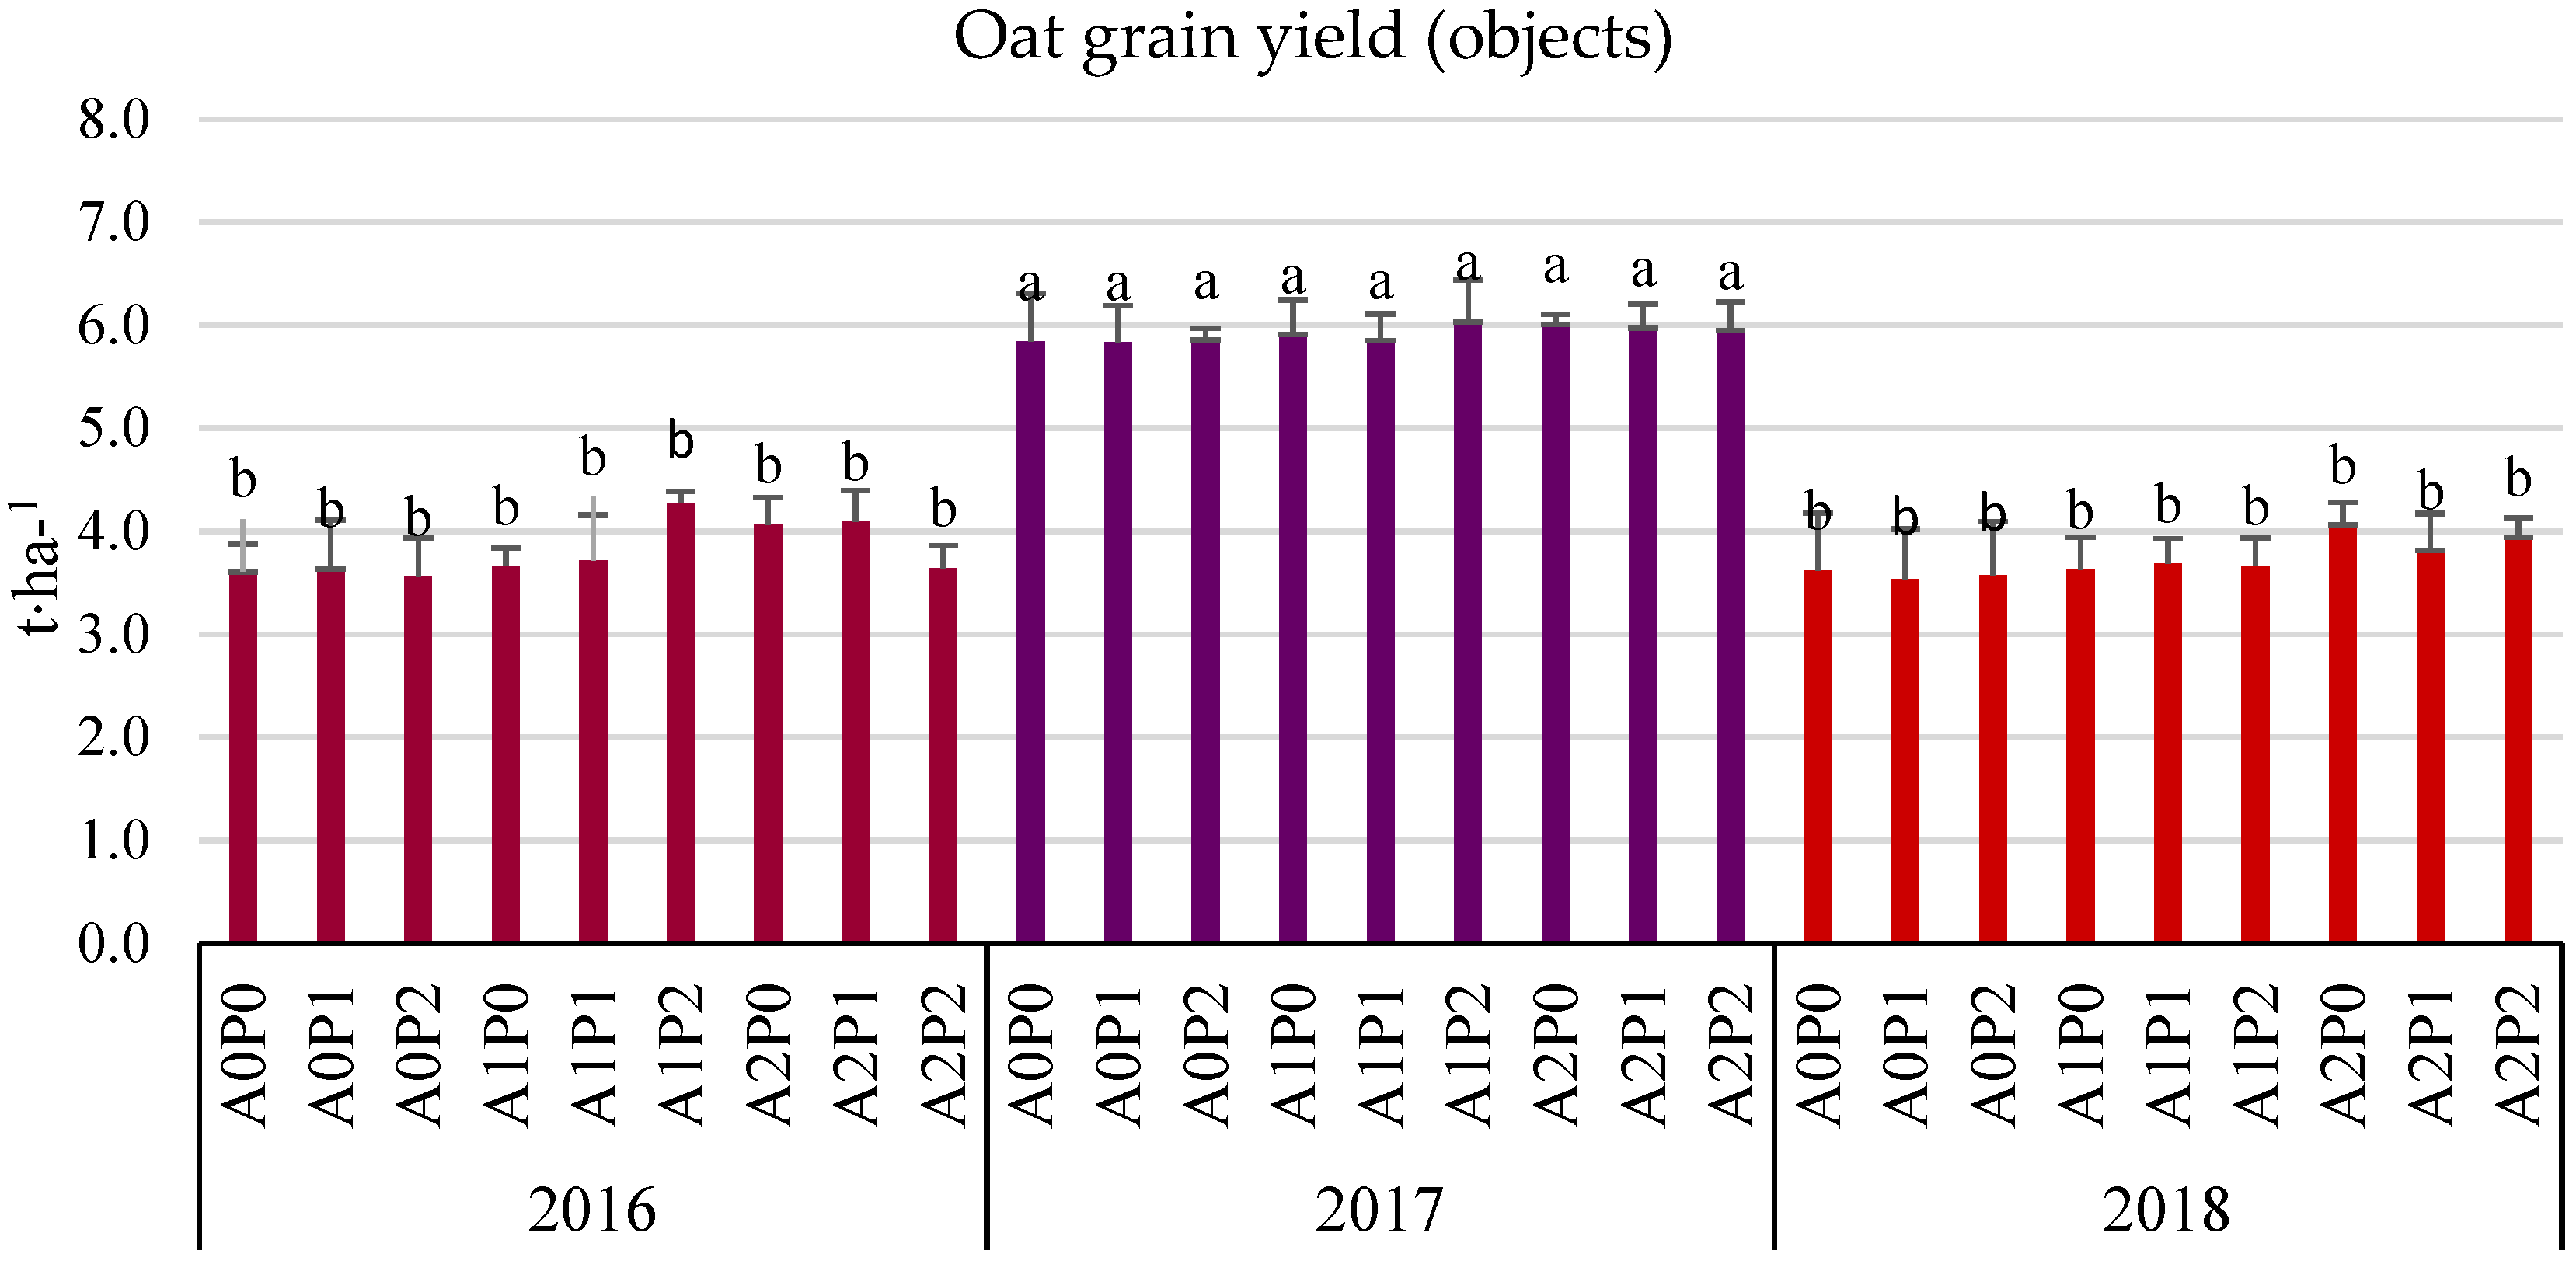
3.3. Grain Yield (Field Experiment)

The average experimental yield is shown in Figure 8, while the effect of the algae fertilizer dose and the MF exposure dose on yields is shown in Figure 9. Pre-sowing magnetic stimulation did not have a significant effect on the yield in the years of the experiment. Figure 9, Figure 10, Figure 11, Figure 12 and Figure 13 show the influence of the factors on the examined features (separately).
The algae doses and weather conditions significantly modified the yield of oat grain during the study. The highest grain yield was obtained in 2017, which was 2.11 t·h−1 higher than that in 2016 and 2.20 t·h−1 higher than that in 2018. The application of the highest dose of algae (A2) resulted in a significant increase (0.28 t·h−1) in oat yield, as compared to the control. A significant effect of the algae dose on the oat yield was demonstrated in 2016 and 2018, when the oat vegetation’s weather conditions were less favorable. In the experiment, significant interactions between experimental factors in yield shaping were only shown in 2016.

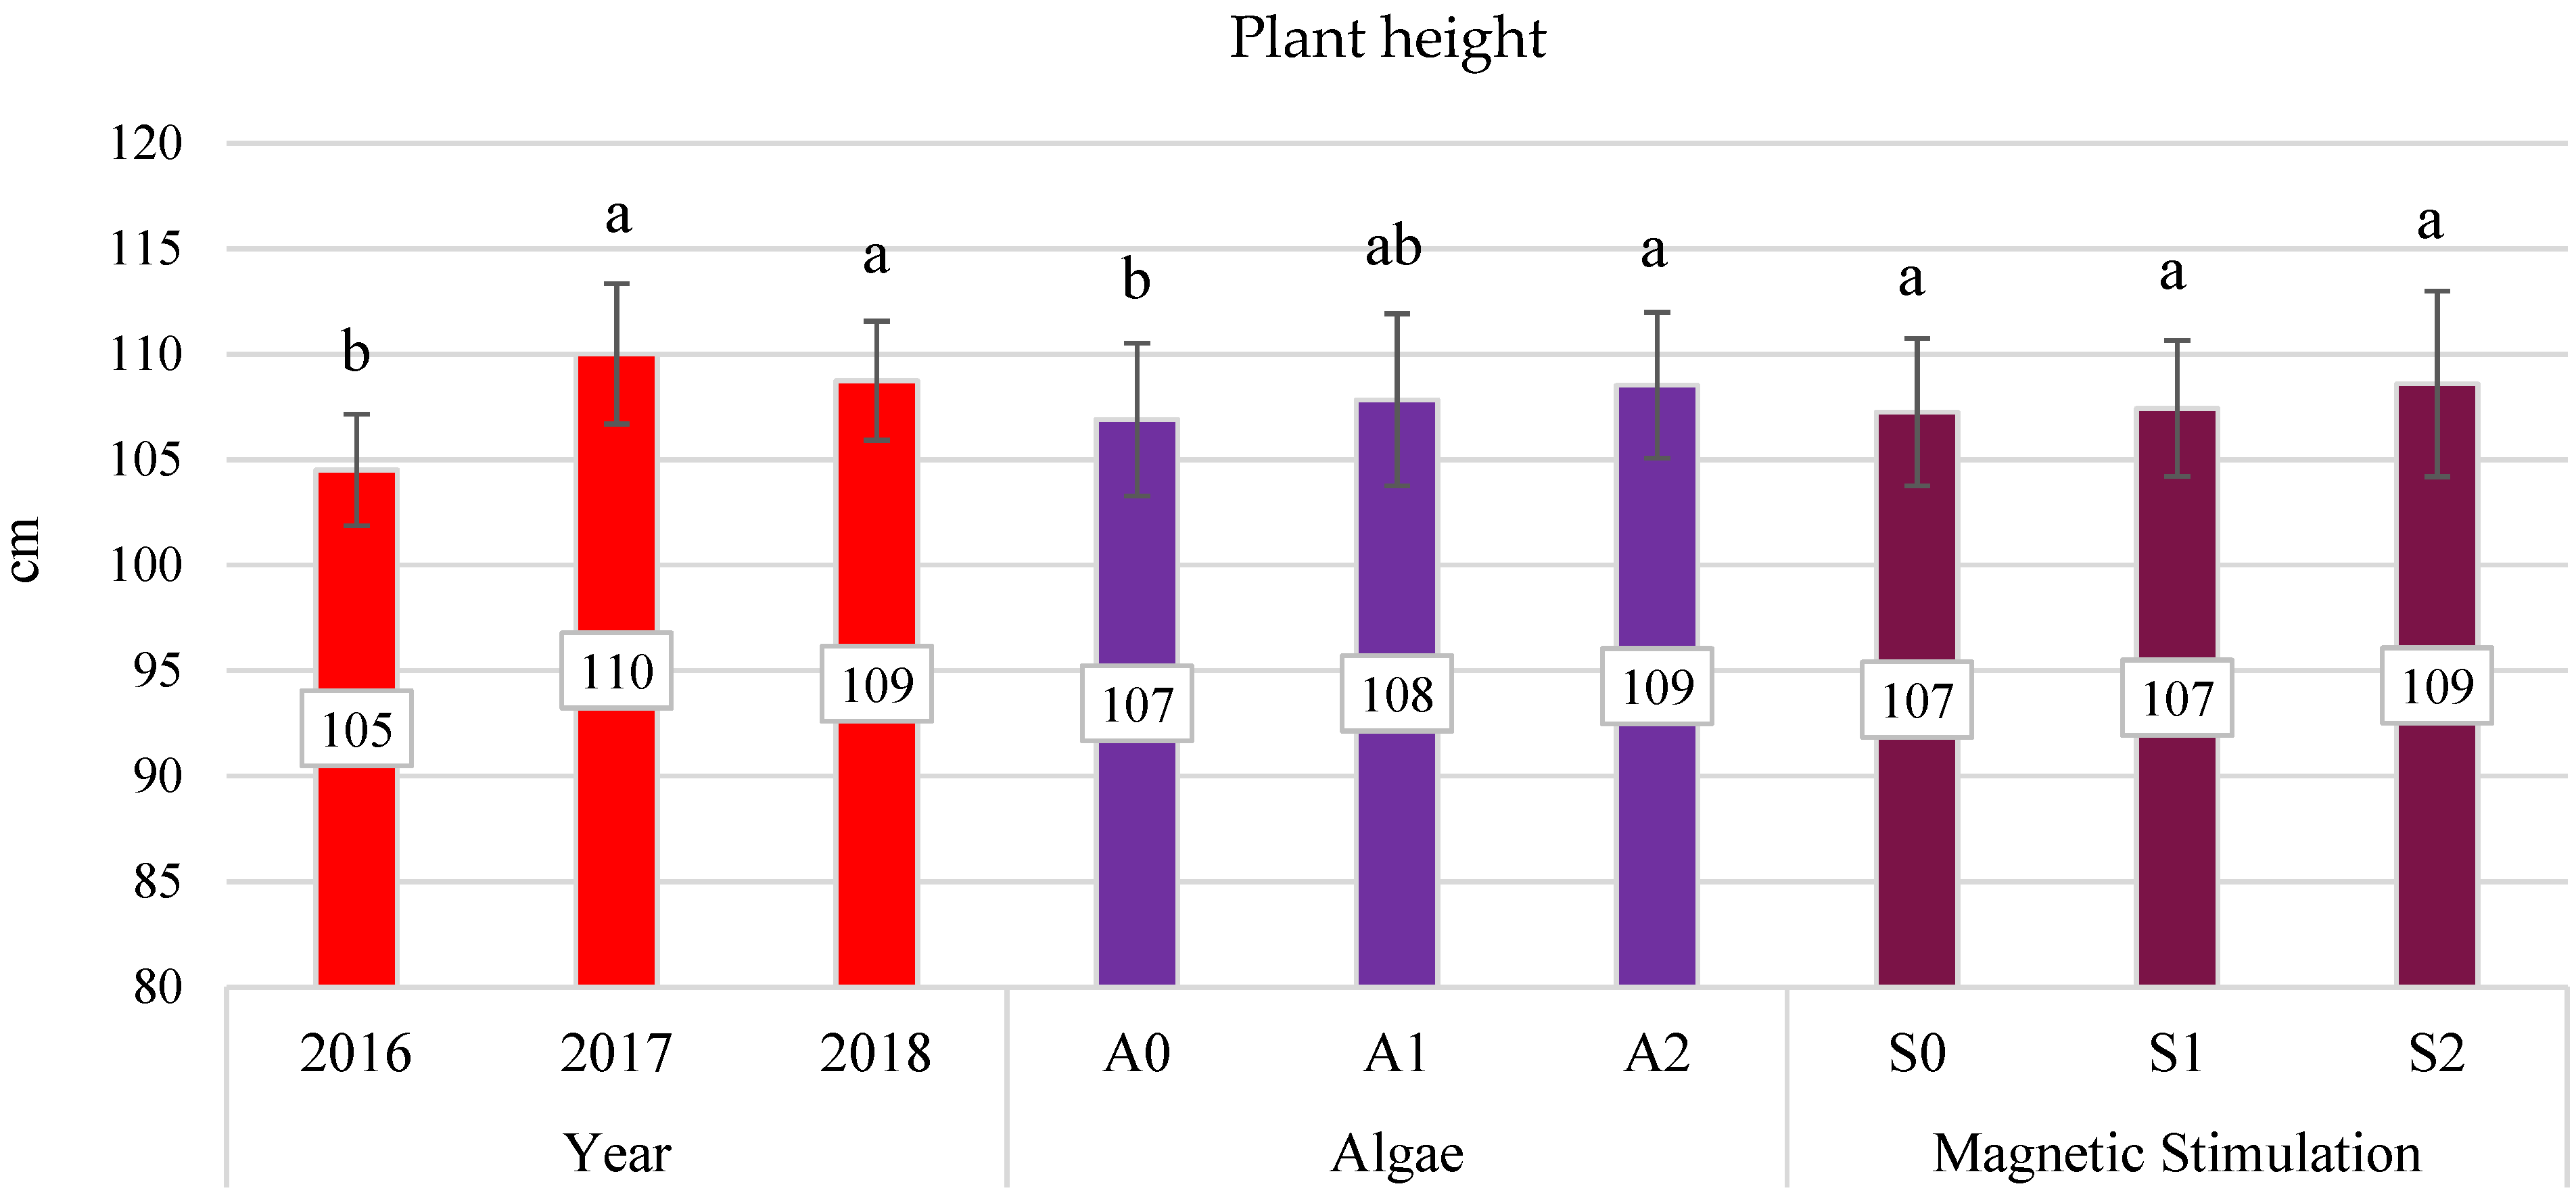
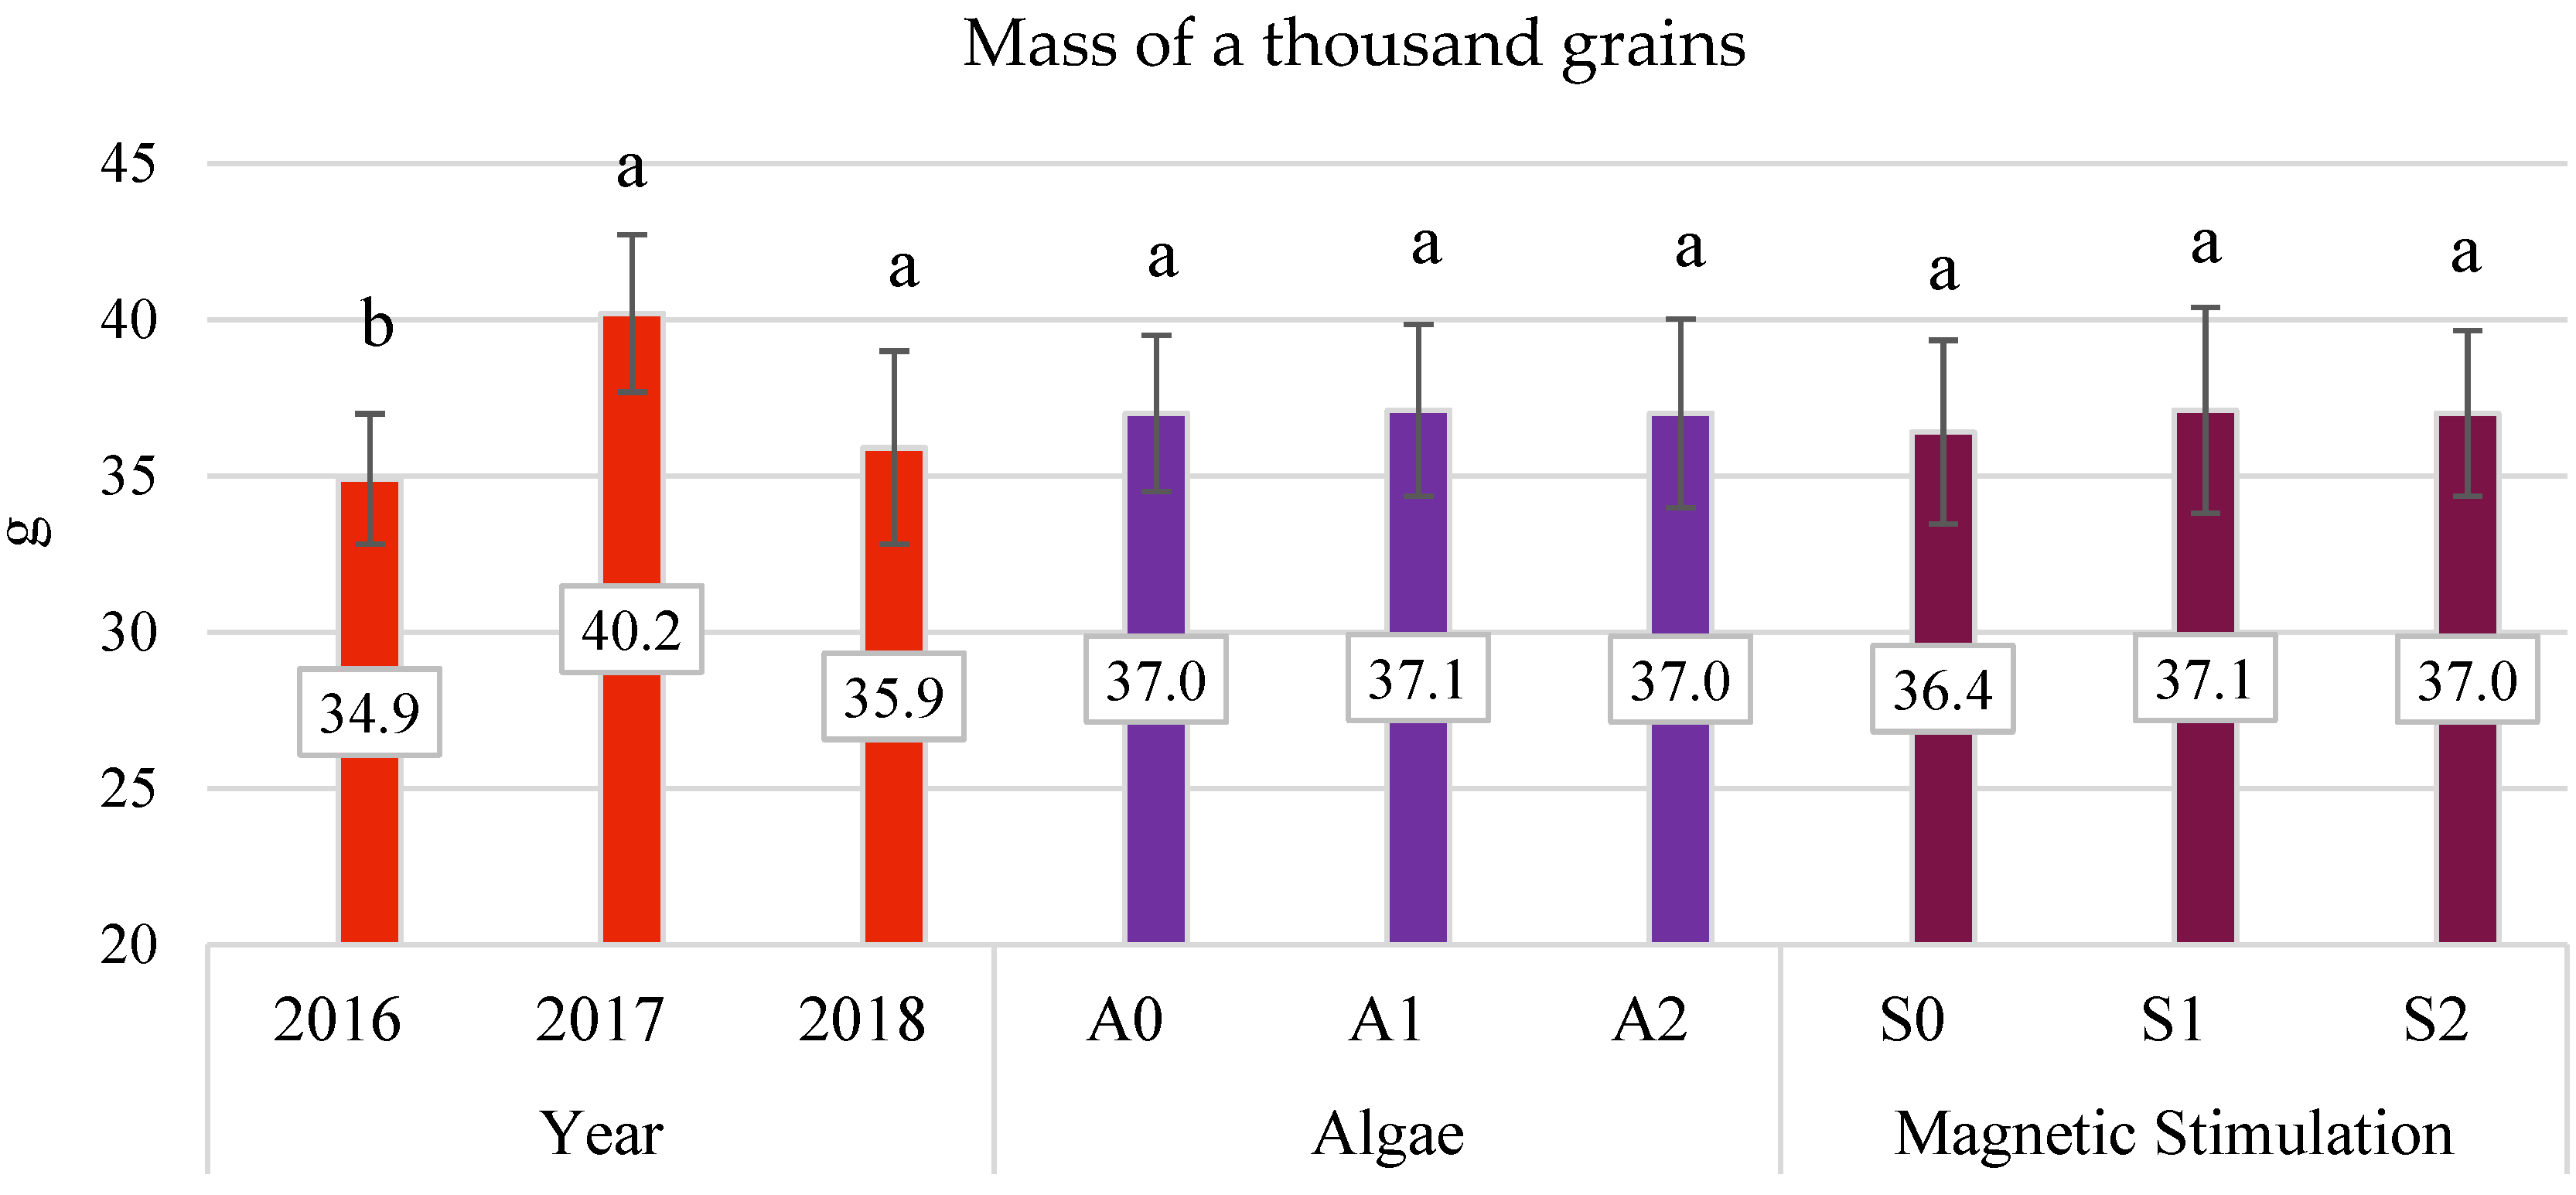
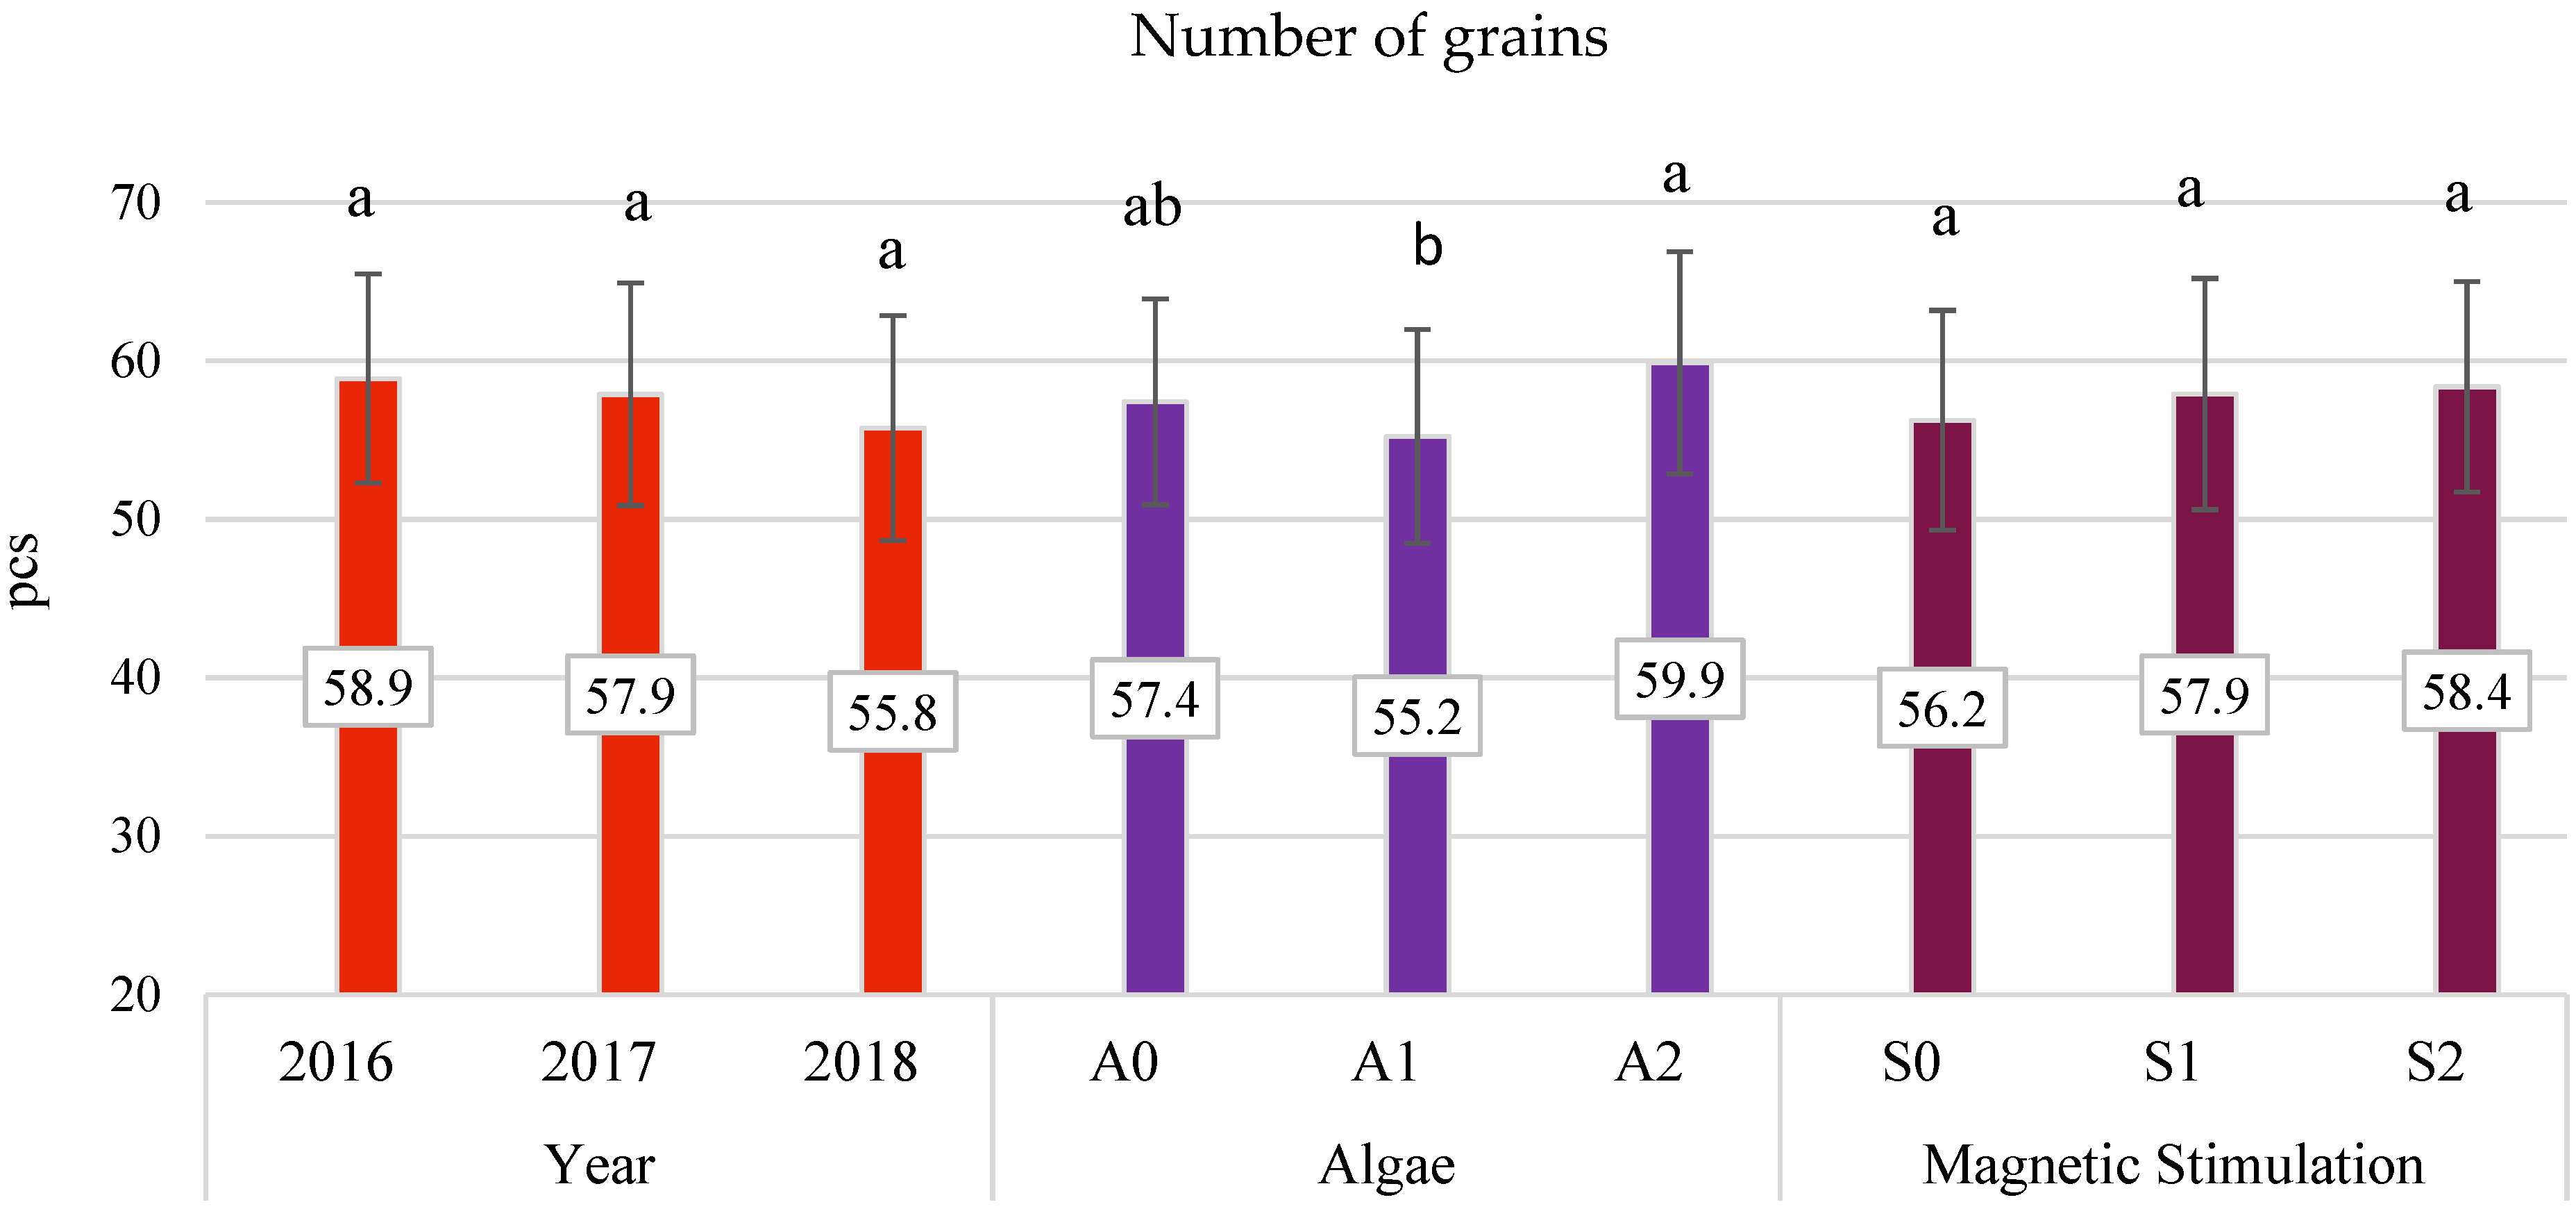
3.4. Yield Components

Figure 10, Figure 11, Figure 12 and Figure 13 show the influence of the studied factors on the elements of oat crop structures.
The influence of the examined factors on the yield components was also analyzed. The application of algae significantly differentiated the weight of the grain in the panicle (Figure 10). However, pre-sowing magnetic stimulation of the grains did not affect the formation of the weight of the grain in the panicle plantlets. The weight of the grain in the panicle was significantly different between research years; the average value was 1.33 g for 2016, 1.47 g for 2017, and 1.5 g for 2018.
Experimental factors did not differentiate the thousand-grain weight in the studied objects (Figure 11). The average thousand-grain weight was higher in 2017, by 5.26 g, than the average for 2016, and by 4.25 g for 2018.
The average height of the plants from 2016 to 2018 (Figure 12) was 108 cm. A tendency for the development of shorter plants in 2016 (104.5 cm), as compared to 2017 (by 5.5 cm) and 2018 (by 4.3 cm), was observed. There were no interactions between experimental factors in shaping plant height or any effects of the magnetic stimulation factor. The algae application factor’s effect was demonstrated at the highest dose (A2) on the growth of oat plants, which, on average, were 1.62 cm higher than the control.
The influence of the experimental factors on the number of panicle grains, which averaged 57.6 in the study years, was also examined.
The addition of algae significantly differentiated the number of grains from oat plants in the experiment (Figure 13). Treatment with algae at the highest dose (A2) resulted in an increase in the average number of panicle grains by 4.65 pcs, as compared to the control. There was no significant influence of the MF interaction between factors on the number of panicle grains. No statistically significant influence of the year of research on this parameter was found.

4. Discussion

Dmytryk at al. [9] examined the stimulating effect of seed coating with algal homogenate formulations (experiment with experience with winter wheat) in the initial growth phase [9]. Dried seaweeds Enteromorpha sp. and Cladophora sp., originating from the Baltic Sea, were homogenized, and emulsion concentrates were then prepared. Applied formulations were proven to affect both sprout and root development. No statistically significant differences between experimental and control series were shown. The greatest results of sprouting were given by the samples treated with the pure algae homogenate formulation, while mineral enrichment promoted higher root growth. Tissue water content was comparable in all the experimental cultivations. Active compounds contained in seed-coating formulations stimulated seed germination [9]. The study by Witkowicz et al. [42] confirmed a significant effect of biological control agents and plant growth promoters on the contents of basic nutrients, crude fiber, and dietary fiber fractions in buckwheat sprouts. Soaking the seeds in a solution containing Ecklonia maxima algae extract promoted the accumulation of dry matter in sprouts (Witkowicz et al. 2019 [42]). Soaking in the algae suspension affected the germination, metabolism, and chemical composition of oat microgreens. The plants from seeds that were soaked in suspensions showed higher absorbance values for the sugar-building and protein-building functional groups than the control oat microgreens. No differences in lipid content were found. The experiments that we conducted also showed that the application of algae affected the oat grains, seeds, and microgreens.
The analysis of the results took into account meteorological data from three growing seasons, soil and habitat conditions, and environmental factors that could influence plant vegetation and yield. Over the years of the experiment, total precipitation (from March to August, i.e., from the month preceding sowing to the end of the vegetation) was approximately 50% lower than the multi-annual average. The average air temperatures were higher (by 1.12 °C), which indicates that the growing seasons were relatively dry during the experiment. According to the Sielianinov hydrothermal coefficient, the growing seasons in 2016 and 2017 were dry (k = 0.94 and 0.89), while the 2018 season was very wet (k = 2.26). However, attention should be paid to a low k factor value, which indicated a dry period in April 2018. This phenomenon is very unfavorable for oat growth, which has a significant water demand due to the need to develop an extensive root system. In the experiment years, the hydrothermal coefficient showed lower values than the multi-annual average in all the months. Significant variability in the humidity conditions of particular months of vegetation was observed. The most unfavorable conditions (measured by the lowest hydrothermic k factor) were found during May–August 2016, April 2017 (key month for root system formation), and April and June 2018. Precipitation in the growing seasons (in their initial periods) in 2016 and 2017 was at an average level (from several to several dozen millimeters), and too little rainfall (only 7 mm) occurred in April 2018. There were good germination conditions in 2016 and 2017. In 2018, sowing was delayed due to heavy rainfall, making it difficult for agricultural machines to enter the field. In 2018, the grains were sown on 11 April, and their emergence was delayed, as compared to previous years, because early sowing and an adequate water supply are crucial for oats.
The dates of subsequent growth phases and their duration depended primarily on the weather conditions in the research years.
Algae application positively affected oat yield, which was statistically significant for 2016, 2018, and the three-year average. The yield of oat grains under the influence of algae increased by 3.5%, as compared to the control in dose A1 and 6.38% compared to dose A2. This influence was particularly important in the years of unfavorable hydrometeorological conditions. In 2016, these values were 7.94% for dose A1 and 9.28% for dose A2. In 2018, the increase in oat grain yield was 2.29% for dose A1 and 10.21% for dose A2. The year 2016 also saw a positive correlation between factors A and S in oat grain yield formation. At 3.66 t·h−1, the lowest grain yield was obtained in 2018, which can be explained by a dry growing season, insufficient water supply at key growth stages, and a delayed sowing date. Statistically, a significantly higher yield was obtained in 2017 and amounted to 5.92 t·h−1. The average yield from the whole three-year experiment was 4.48 t·h−1, which was very close to the average yield obtained by Tobiasz-Salach and Bobrecka-Jamro [43] in the same experimental field.
In the experiment years (except 2016), a decreasing yield tendency of plants with no algae application was observed, namely A0S0 (control), A0S1, and A0S2. Relatively higher yields were recorded for A1S2, A2S0, A2S1, and A2S2 (except for 2018), although their yields varied in particular years. The yield, under the influence of the combination of A1S0 and A1S1, reached similar values in 2016 and 2018.
Many authors have proven that various extracts from A. nodosum improve plant growth, alleviate the effects of abiotic and biotic stresses, and improve plant defenses by regulating physiological and biochemical molecular processes [44]. In several reports, A. nodosum extracts improved agricultural productivity by regulating some plants’ nutrient use efficiency [7,44]. The mechanism that leads to increased tolerance to stress is the regulation of specific metabolic pathways. For instance, in an experiment with Brassica napus, one of the commercial preparations based on A. nodosum stimulated nitrogen and sulfur bioaccumulation by regulating the expression of genes involved in nitrogen sulfur metabolism [44]. In another previous study, a plant biostimulant produced from A. nodosum was applied to rapeseed in order to reduce pod shattering, leading to a higher harvestable seed yield in some varieties of rapeseed. It was shown that the application of this biostimulant led to the downregulation of a major regulator of pod shattering expression [45].
Furthermore, A. nodosum can also act as a multi-component conditioner in order to improve soil properties, e.g., soil enzyme activity, increasing potassium availability, total porosity, and available water capacity [46]. In general, the effect of A. nodosum extracts on plants is attributed to their hormonal content, their micronutrient value, and/or the presence of algae-specific polysaccharides, betaines, polyamines, and phenolic compounds; these compounds, separately or in concert, bring about phenotypic effects. Nevertheless, only a few of these hypotheses have been verified at the molecular level [45]. Yakin et al. [46] suggested that biostimulant research should mainly focus on proving their efficacy, safety, and wide mechanisms of action (without specifying a specific mode of action). According to these researchers, there is also an irresistible argument for the scientific development and experimentation of biostimulants, because this could lead to the identification of new biological molecules and phenomena, pathways, and processes that would not have been discovered if the category of biostimulants did not exist or was not recognized as valid [46].
Additionally, Caradonia argued that, to be considered a biostimulant, something must improve at least one of the following characteristics: nutrient use efficiency, tolerance to abiotic stresses, the availability of confined nutrients in the soil and rhizosphere, crop quality traits, or the humification and degradation of organic compounds in the soil [47].
In the present study, the application of algae was shown to improve plant yields under unfavorable hydrometeorological conditions, while with optimal weather conditions, it was less significant. Based on these observations, it can be concluded that there was no benefit of algae application under more stable conditions, but this factor had a positive effect in years when all the yields were generally lower. The yield of the oat pattern in the experiments of the Registered Varietal Experimentation in 2018 was approximately 6 tonnes per hectare, which was lower than 2017 and 2016 [48]. The lower yield was due to the fact that oats are the most drought-sensitive spring cereal species, and 2018 was a dry year across the whole country. According to COBORU, the Bingo cultivar was ranked sixth among the oat varieties with the highest yield in 2018.
The application of algae significantly differentiated the weight of panicle seeds, which increased by 4.59% for dose A1 and by 14.01% for dose A2. The weight of the grains from the panicle was also significantly different from year to year. The average weight for 2016, 2017, and 2018 was 1.33, 1.47, and 1.5 g, respectively. Algal application and MF stimulation did not differentiate the thousand-grain weight in the studied objects. The average thousand-grain weight was higher in 2017 by 5.26 g than the average in 2016 and by 4.25 g compared to 2018. This research showed an effect of the highest algae dose (A2) on oat growth. These plants were 1.62 cm higher on average than the control. Plant growth was lower on average in 2016 at 104.5 cm—the difference was compared to the years 2017 and 2018 and was approximately 4.9% on average. No interactions between experimental factors in terms of plant height formation were found during the years of the field studies. The addition of algae significantly differentiated the number of grains from the oat plants in the experiment. The highest algae dose (A2) resulted in an increase in the average number of grains in the panicle by 4.65 units, as compared to the control. Similar results were found by Tobiasz-Salach et al., who found an increase in the number of grains in the panicle after applying a preparation containing A. nodosum [49]. No significant influence of pre-sowing MF or interaction between factors on this parameter’s development was demonstrated. No statistically significant influence of the year of research on this parameter was found either. The higher yield after algae application resulted mainly from an increase in the number and weight of the panicle seeds.
In the conducted experiment, the lodging of plants depended on the course of the weather conditions, and the factors used in the experiment had no impact on the degree of oat lodging, but slightly impacted the intensification of plant lodging at full ripeness (BBCH 95), as compared to the milk ripe phase (BBCH 77). The plants were resistant to lodging.

5. Conclusions

  • Soaking in the algae suspension affected the germination, metabolism, and chemical composition of oats. The plants from grains that were soaked in suspensions showed higher absorbance values for the sugar-building and protein-building functional groups than the control oat microgreens. No differences in the lipid content were found.
  • The average three-year oat grain yield increased under the influence of algae application, especially after the highest dose of A2 (by 6.38% compared to the control). This effect was particularly significant in the years with less favorable hydrometeorological conditions. In 2016, the increase was 9.28%, and in 2018, it was 10.21%.
  • No beneficial effect of pre-sowing stimulation with a low-frequency magnetic field on the yield of oats was found.
  • The application of algae in dose A2 improved the characteristics of oats, such as panicle grain weight and the number of grains in the panicle by 14.01% and 4.3%, respectively.
  • The interaction of the experimental factors (algae application × pre-sowing magnetic field stimulation) in shaping yield, structure, and oat grain composition was not relevant from 2016 to 2018.
  • A. nodosum can stimulate the growth and yield of oats.

Author Contributions

Important contributions to the design and preparation of the manuscript, B.D.; contribution to sample and analysis experiments, B.D. and J.D.; analysis of the experimental data, B.D. and J.D.; critical revision for important intellectual content, B.D.; supervision, C.P.; writing—original draft, B.D.; writing—review and editing, B.D., J.D. and C.P. All authors helped prepare the paper and approved the final version. All authors have read and agreed to the published version of the manuscript.

Funding

The project is financed by the program of the Minister of Science and Higher Education named “Regional Initiative of Excellence” in the years 2019–2022, project number 026/RID/2018/19, the amount of financing PLN 9 542 500.00.

Institutional Review Board Statement

Not applicable.

Informed Consent Statement

Not applicable.

Data Availability Statement

Data available from the author.

Conflicts of Interest

The authors declare no conflict of interest.

References

  1. Edmondson, J.L.; Davies, Z.G.; Gaston, K.J.; Leake, J.R. Urban cultivation in allotments maintains soil qualities adversely affected by conventional agriculture. J. Appl. Ecol. 2014, 51, 880–889. [Google Scholar] [CrossRef]
  2. Pretty, J.N.; Noble, A.D.; Bossio, D.; Dixon, J.; Hine, R.E.; de Vries, F.W.T.P.; Morison, J.I.L. Resource-Conserving Agriculture Increases Yields in Developing Countries. Environ. Sci. Technol. 2005, 40, 1114–1119. [Google Scholar] [CrossRef] [PubMed] [Green Version]
  3. Pretty, J.; Bharucha, Z.P. Sustainable intensification in agricultural systems. Ann. Bot. 2014, 114, 1571–1596. [Google Scholar] [CrossRef] [PubMed]
  4. Pretty, J.; Benton, T.G.; Bharucha, Z.P.; Dicks, L.V.; Flora, C.B.; Godfray, H.C.J.; Goulson, D.; Hartley, S.; Lampkin, N.; Morris, C.; et al. Global assessment of agricultural system redesign for sustainable intensification. Nat. Sustain. 2018, 1, 441–446. [Google Scholar] [CrossRef]
  5. Araújo, S.D.S.; Epaparella, S.; Edondi, D.; Ebentivoglio, A.; Ecarbonera, D.; Balestrazzi, A.; Araújo, S.D.S.; Epaparella, S.; Edondi, D.; Ebentivoglio, A.; et al. Physical Methods for Seed Invigoration: Advantages and Challenges in Seed Technology. Front. Plant Sci. 2016, 7, 646. [Google Scholar] [CrossRef] [PubMed] [Green Version]
  6. Aladjadjiyan, A. Physical factors for plant growth stimulation improve food quality. In Food Production—Approaches, Challenges and Tasks; IntechOpen: London, UK, 2012; Volume 270, pp. 145–168. [Google Scholar]
  7. Shukla, P.S.; Mantin, E.; Adil, M.; Bajpai, S.; Critchley, A.T.; Prithiviraj, B. Ascophyllum nodosum-Based Biostimulants: Sustainable Applications in Agriculture for the Stimulation of Plant Growth, Stress Tolerance, and Disease Management. Front. Plant Sci. 2019, 10, 655. [Google Scholar] [CrossRef] [Green Version]
  8. Kahane, R.; Hodgkin, T.; Jaenicke, H.; Hoogendoorn, C.; Hermann, M.; Keatinge, J.D.H.; Hughes, J.D.; Padulosi, S.; Looney, N. Agrobiodiversity for food security, health and income. Agron. Sustain. Dev. 2013, 33, 671–693. [Google Scholar] [CrossRef] [Green Version]
  9. Dmytryk, A.; Michalak, I.; Wilk, R.; Chojnacka, K.; Górecka, H.; Górecki, H. Innovative Seed Treatment with Algae Homog-enate. Waste Biomass Valorization 2015, 6, 441–448. [Google Scholar] [CrossRef]
  10. Halpern, M.; Bar-Tal, A.; Ofek, M.; Minz, D.; Muller, T.; Yermiyahu, U. The Use of Biostimulants for Enhancing Nutrient Uptake. Adv. Agron. 2015, 130, 141–174. [Google Scholar] [CrossRef]
  11. Du Jardin, P. Plant biostimulants: Definition, concept, main categories and regulation. Sci. Hortic. 2015, 196, 3–14. [Google Scholar] [CrossRef] [Green Version]
  12. EIBC. European Biostimulant Industry Council. Available online: https://biostimulants.eu/ (accessed on 29 December 2020).
  13. Du Jardin, P. The Science of Plant Biostimulants—A Bibliographic Analysis, Ad Hoc Study Report; European Commission: Brussels, Belgium, 2012; Available online: http://hdl.handle.net/2268/169257 (accessed on 20 December 2020).
  14. Dz.U.2020.796 t.j. Available online: https://sip.lex.pl/akty-prawne/dzu-dziennik-ustaw/nawozy-i-nawozenie-17370471 (accessed on 20 May 2021).
  15. Craigie, J.S. Seaweed extract stimuli in plant science and agriculture. J. Appl. Phycol. 2011, 23, 371–393. [Google Scholar] [CrossRef]
  16. Khan, W.; Rayirath, U.P.; Subramanian, S.; Jithesh, M.N.; Rayorath, P.; Hodges, D.M.; Critchley, A.; Craigie, J.S.; Norrie, J.; Prithiviraj, B. Seaweed Extracts as Biostimulants of Plant Growth and Development. J. Plant Growth Regul. 2009, 28, 386–399. [Google Scholar] [CrossRef]
  17. Eris, A.; Sivritepe, H.; Sivritepe, N. The effect of seaweed (Ascophyllum nodosum) extract on yield and quality criteria in peppers. ISHS Acta Hortic. 412 1995, 185–192. [Google Scholar] [CrossRef]
  18. Norrie, J.; Branson, T.; Keathley, P. Marine plant extracts impact on grape yield and quality. Acta Hortic. 2002, 594, 315–319. [Google Scholar] [CrossRef]
  19. Sabir, A.; Yazar, K.; Sabir, F.; Kara, Z.; Yazici, M.A.; Goksu, N. Vine growth, yield, berry quality attributes and leaf nutrient content of grapevines as influenced by seaweed extract (Ascophyllum nodosum) and nanosize fertilizer pulverizations. Sci. Hortic. 2014, 175, 1–8. [Google Scholar] [CrossRef]
  20. Fornes, F.; Sánchez-Perales, M.; Guardiola, J.L. Effect of a Seaweed Extract on the Productivity of ‘de Nules’ Clementine Mandarin and Navelina Orange. Bot. Mar. 2002, 45, 486–489. [Google Scholar] [CrossRef]
  21. Abdel-Mawgoud, A.M.R.; Tantaway, A.S.; Hafez, M.M.; Habib, H.A. Seaweed extract improves growth, yield and quality of different watermelon hybrids. Res. J. Agric. Biol. Sci. 2010, 6, 161–168. [Google Scholar]
  22. Spinelli, F.; Fiori, G.; Noferini, M.; Sprocatti, M.; Costa, G. A novel type of seaweed extract as a natural alternative to the use of iron chelates in strawberry production. Sci. Hortic. 2010, 125, 263–269. [Google Scholar] [CrossRef]
  23. Fan, D.; Hodges, D.M.; Critchley, A.; Prithiviraj, B. A Commercial Extract of Brown Macroalga (Ascophyllum nodosum) Affects Yield and the Nutritional Quality of SpinachIn Vitro. Commun. Soil Sci. Plant Anal. 2013, 44, 1873–1884. [Google Scholar] [CrossRef]
  24. Hidangmayum, A.; Sharma, R. Effect of different concentrations of commercial seaweed liquid extract of Ascophyllum nodosum as a plant bio stimulant on growth, yield and biochemical constituents of onion (Allium cepa L.). J. Pharmacogn. Phytochem. 2017, 6, 658–663. [Google Scholar]
  25. Keleszade, E.; Patterson, M.; Trangmar, S.; Guinan, K.; Costabile, A. Clinical Efficacy of Brown Seaweeds Ascophyllum nodosum and Fucus vesiculosus in the Prevention or Delay Progression of the Metabolic Syndrome: A Review of Clinical Trials. Molecules 2021, 26, 714. [Google Scholar] [CrossRef] [PubMed]
  26. Wally, O.S.D.; Critchley, A.T.; Hiltz, D.; Han, X.; Zaharia, L.I.; Abrams, S.R.; Prithiviraj, B. Regulation of pytohormone bo-synthesis and accumulation in Arabidopsis following treatment with commercial contract from the Marine Macroalga Ascophyllum nodosum. J. Plant Growth Regul. 2013, 32, 324–339. [Google Scholar] [CrossRef]
  27. Sarraf, M.; Kataria, S.; Taimourya, H.; Santos, L.; Menegatti, R.; Jain, M.; Ihtisham, M.; Liu, S.; Sarraf, M.; Kataria, S.; et al. Magnetic Field (MF) Applications in Plants: An Overview. Plants 2020, 9, 1139. [Google Scholar] [CrossRef] [PubMed]
  28. Gusta, L.V.; Kirkland, K.J.; Austenson, H.M. Effects of a brief magnetic exposure on cereal germination and seedling growth. Can. J. Plant Sci. 1978, 58, 79–86. [Google Scholar] [CrossRef]
  29. Radhakrishnan, R. Magnetic field regulates plant functions, growth and enhances tolerance against environmental stresses. Physiol. Mol. Biol. Plants 2019, 25, 1107–1119. [Google Scholar] [CrossRef] [PubMed]
  30. Index Mundi. Available online: https://www.indexmundi.com/ (accessed on 30 August 2020).
  31. Ebert, A.W. Sprouts, Microgreens, and Edible Flowers: The Potential for High Value Specialty Produce in Asia. In Proceedings of the SEAVEG Regional Symposium. High Value Vegetables in Southeast Asia: Production, Supply and Demand, Chiang Mai, Thailand, 24–26 January 2012. [Google Scholar]
  32. Benincasa, P.; Falcinelli, B.; Lutts, S.; Stagnari, F.; Galieni, A. Sprouted Grains: A Comprehensive Review. Nutrients 2019, 11, 421. [Google Scholar] [CrossRef] [Green Version]
  33. Di Gioia, F.; Renna, M.; Santamaria, P. Sprouts, Microgreens and “Baby Leaf” Vegetables; Springer: Boston, MA, USA, 2017; pp. 403–432. [Google Scholar] [CrossRef]
  34. Singh, N.; Verma, P.; Pandey, B.R. Therapeutic potential of organic Triticum aestivum linn. (wheat grass) in prevention and treatment of chronic diseases: An overview. Int. J. Pharm. Sci. Drug Res. 2012, 4, 10–14. [Google Scholar]
  35. Mitchell, A.L.; Gajjar, K.B.; Theophilou, G.; Martin, F.L.; Martin-Hirsch, P.L. Vibrational spectroscopy of biofluids for disease screening or diagnosis: Translation from the laboratory to a clinical setting. J. Biophotonics 2014, 7, 153–165. [Google Scholar] [CrossRef]
  36. Calabrò, E.; Magazù, S. The helix alignment of proteins in water solution toward a high-frequency electromagnetic field: A FTIR spectroscopy study. Electromagn. Biol. Med. 2017, 36, 279–288. [Google Scholar] [CrossRef]
  37. Baker, M.; Trevisan, J.; Bassan, P.; Bhargava, R.; Butler, H.; Dorling, K.M.; Fielden, P.R.; Fogarty, S.W.; Fullwood, N.J.; A Heys, K.; et al. Using Fourier transform IR spectroscopy to analyze biological materials. Nat. Protoc. 2014, 9, 1771–1791. [Google Scholar] [CrossRef] [Green Version]
  38. Grdadolnik, J. ATR-FTIR spectroscopy: Its advantages and limitations. Acta Chim. Slov. 2002, 49, 631–642. [Google Scholar]
  39. Lasch, P. Spectral pre-processing for biomedical vibrational spectroscopy and micro spectroscopic imaging. Chemom. Intell. Lab. Syst. 2012, 117, 100–114. [Google Scholar] [CrossRef] [Green Version]
  40. Gracia, M.-B.; Armstrong, P.R.; Rongkui, H.; Mark, S. Quantification of betaglucans, lipid and protein contents in whole oat groats (Avena sativa L.) using near infrared reflectance spectroscopy. J. Near Infrared Spectrosc. 2017, 25, 172–179. [Google Scholar] [CrossRef]
  41. Grube, M.; Marauska, M.; Bekers, M. Quantitative analysis of oat by Infrared spectroscopy. In Spectroscopy of Biological Molecules: New Directions; Springer: Berlin/Heidelberg, Germany, 1999; pp. 617–618. [Google Scholar] [CrossRef]
  42. Witkowicz, R.; Biel, W.; Chłopicka, J.; Galanty, A.; Gleń-Karolczyk, K.; Skrzypek, E.; Krupa, M.; Witkowicz, R.; Biel, W.; Chłopicka, J.; et al. Biostimulants and Microorganisms Boost the Nutritional Composition of Buckwheat (Fagopyrum esculentum Moench) Sprouts. Agronomy 2019, 9, 469. [Google Scholar] [CrossRef] [Green Version]
  43. Tobiasz-Salach, R.; Bobrecka-Jamro, D. The effect of nitrogen fertilization on the grain yield, content and elements of the oat yield structure. Bull. Plant Breed. Acclim. Inst. 2006, 239, 41–47. (In Polish) [Google Scholar]
  44. Pereira, L.; Morrison, L.; Shukla, P.S.; Critchley, A.T. A concise review of the brown macroalga Ascophyllum nodosum (Linnaeus) Le Jolis. J. Appl. Phycol. 2020, 32, 3561–3584. [Google Scholar] [CrossRef]
  45. De Seager, J.; Van Praet, S.; Vareecke, D.; Park, J.; Jacques, S.; Han, T.; Depuydt, D. Toward the molecular understanding of the action mechanism of Ascophyllum nodosum extracts on plants. J. Appl. Phycol. 2020, 32, 573–597. [Google Scholar] [CrossRef] [Green Version]
  46. Yakhin, O.; Lubyanov, A.; Yakhin, I.; Brown, P. Biostimulants in Plant Science: A Global Perspective. Front. Plant Sci. 2017, 7, 2049. [Google Scholar] [CrossRef] [Green Version]
  47. Caradonia, F.; Battaglia, V.; Righi, L.; Pascali, G.; La Torre, A. Plant Biostimulant Regulatory Framework: Prospects in Europe and Current Situation at International Level. J. Plant Growth Regul. 2018, 38, 438–448. [Google Scholar] [CrossRef]
  48. Artyszak, A. The Best-Yielding Oat Varieties in 2018 Agropolska.pl (In Polish). Available online: https://www.agropolska.pl/uprawa/zboza/najlepiej-plonujace-odmiany-owsa-w-2018-roku,315.html (accessed on 12 October 2019).
  49. Tobiasz-Salach, R.; Bobrecka-Jamro, D.; Pyrek-Bajcar, E.; Buczek, J. Response of hulled and naked oat to foliar fertilization. Acta Sci. Pol. Agric. 2016, 15, 77–78. [Google Scholar]
Figure 1. Air temperature from 2016 to 2018.
Agronomy 11 01446 g001
Figure 2. Rainfall distribution from 2016 to 2018.
Agronomy 11 01446 g002
Figure 3. Fourier-transform infrared (FTIR) spectra of microgreens: (a) control, (b) without water, (c) with 0.5% of algae, (d) with 1% of algae, (e) with 5% of algae, and (f) with 10% of algae.
Agronomy 11 01446 g003
Figure 4. Principal component analysis (PCA) analysis of the FTIR spectra of oats: (a) control, (b) without water, (c) with 0.5% of algae, (d) with 1% of algae, (e) with 5% of algae, and (f) with 10% of algae. The PCA analysis was done in the IR region between 800 and 1800 cm−1.
Agronomy 11 01446 g004
Figure 5. FT–Raman spectrum of control oat grains (seeds).
Agronomy 11 01446 g005
Figure 6. PCA (a) and HCA (b) analysis of: control (1) and treated with different concentrations of algae: 0.01 (2); 0.025 (3); 0.05 (4); 0.1 (5); 0.25 (6); 0.5 (7); 1 (8); 2.5 (9); 5 (10); 10 (11); 15 (12). Two-dimensional (2D) scores plot of samples with differences in chemical compositions, as presented through all the spectral regions.
Agronomy 11 01446 g006
Figure 7. Plots predicted for FT–Raman region (a), which could be used to separate oat grains treated with different algae concentrations. VIP values plot for all the analyzed FT–Raman ranges with 0.8 VIP thresholds (b), where the numbers stand for the following samples: 0.01 (2); 0.025 (3); 0.05 (4); 0.1 (5); 0.25 (6); 0.5 (7); 1 (8); 2.5 (9); 5 (10); 10 (11); 15 (12).
Agronomy 11 01446 g007
Figure 8. Average oat grain yield depending on the combination of algae application and magnetic field stimulation in 2016–2018. A (algae) and S (magnetic stimulation), factors of experience; factor levels 1, 2, and 3; A0S0, control. According to Tukey’s HSD (honest significant difference) test, the means marked with the same letter were not significantly different at α ≤ 0.05.
Agronomy 11 01446 g008
Figure 9. Effect of the algae dose and the MF exposure dose on oat grain yield (t·h−1) from 2016 to 2018. According to Tukey’s HSD (honest significant difference) test, the means marked with the same letter were not significantly different at α ≤ 0.05.
Agronomy 11 01446 g009
Figure 10. Effect of the alga dose and the MF exposure dose on oat grain weight in the panicle (in grams) from 2016 to 2018. According to Tukey’s HSD (honest significant difference) test, the means marked with the same letter were not significantly different at α ≤ 0.05.
Agronomy 11 01446 g010
Figure 11. Effect of the alga dose and the MF exposure dose per mass of a thousand grains from 2016 to 2018. According to Tukey’s HSD (honest significant difference) test, the means marked with the same letter were not significantly different at α ≤ 0.05.
Agronomy 11 01446 g011
Figure 12. Effect of the alga dose and the MF exposure dose per oat plant height (in centimeters) from 2016 to 2018. According to Tukey’s HSD (honest significant difference) test, the means marked with the same letter were not significantly different at α ≤ 0.05.
Agronomy 11 01446 g012
Figure 13. Effect of the alga dose and the MF exposure per number of grains from oat panicle (pieces) from 2016 to 2018. According to Tukey’s HSD (honest significant difference) test, the means marked with the same letter were not significantly different at α ≤ 0.05.
Agronomy 11 01446 g013
Table 1. Composition of the applied algae biomass doses.
g⋅ha−1kg⋅ha−1
BMnCuZnFe
A0-----
A13.22.52.16.20.43
A26.454.212.40.86
A0 = zero dose-no algae; A1 = lower dose of algae; A2 = higher dose of algae.
Table 2. Summary of the field experiment conditions.
LocationKrasne (50°30′ N and 22°06′ E), Poland
Tested species, cultivarOat (Avena sativa) cv. Bingo
System of experimentSplit-block
16 m2
Seeding density550 grains⋅m2
SoilHeavy, brown, in class IIIa
ForecropSpring barley (Hordeum vulgare) in 2015 and spring wheat (Triticum L.) in 2016 and 2017
Sowing dates5 May 2016, 4 April 2017, 11 April 2018
Harvest dated18 August 2016, 10 August 2017, and 8 August 2018
NPK constant fertilization (ha−1)80 kg N⋅ha−1
80 kg P2O5⋅ha−1
100 kg K2O⋅ha−1
Nutrient previous contentModerate manganese and iron contents and low boron, zinc, and copper contents
Table 3. Moisture characteristics of the months of the growing season (2016–2018) depending on the value of the Sielianinov hydrothermal coefficients.
Yeark Value for Month
IIIIVVVIVIIVIII
20161.61.70.460.730.530.63
20171210.360.830.13
20188.610.160.310.861.920.56
Notes: extremely dry k ≤ 0.4; very dry 0.4 < k ≤ 0.7; dry −0.7 < k ≤ 1.0; quite dry 1.0 < k ≤ 1.3; optimal 1.3 < k ≤ 1.6; quite humid 1.6 < k ≤ 2.0; humid 2.0 < k ≤ 2.5; very humid 2.5 < k ≤ 3.0; extremely humid 2.5 < k ≤ 3.0.
Publisher’s Note: MDPI stays neutral with regard to jurisdictional claims in published maps and institutional affiliations.

