Article

Identification and Characterization of SPL Transcription Factor Family Reveals Organization and Chilling-Responsive Patterns in Cabbage (Brassica oleracea var. capitata L.)

1
Zhenjiang Agricultural Research Institute, Jurong 212400, China
2
Jiangsu Key Laboratory for Horticultural Crop Genetic Improvement, Institute of Vegetable Crops, Jiangsu Academy of Agricultural Sciences, Nanjing 210014, China
3
School of Life Sciences, Jiangsu University, Zhenjiang 212013, China
4
China Vegetable Seed Technology Co., Ltd., Beijing 100081, China
*
Author to whom correspondence should be addressed.
These authors contributed equally.
Agronomy 2021, 11(7), 1445; https://doi.org/10.3390/agronomy11071445
Submission received: 9 June 2021 / Revised: 14 July 2021 / Accepted: 16 July 2021 / Published: 20 July 2021
(This article belongs to the Special Issue Insights from Genetic Bioinformatics of Crops)

Abstract

:
Squamosa promoter-binding protein-like (SPL) is a major family of plant-specific transcription factor, which is involved in multiple biological processes, such as plant growth and development, hormone response, light response and stress response. Therefore, it has been profoundly significant to systematically analyze the SPL Transcription Factors family in Brassica oleracea. In this study, a total of 33 BoSPLs were identified in the B. oleracea genome, and they were further divided into six subgroups based on the phylogenetic tree constructed from the SPL proteins of B. oleracea, B. rapa and Arabidopsis thaliana. The expression profile of BoSPLs in different organs/tissues showed that a large number of BoSPLs were expressed in the callus, root, stem, leaf, bud, flower and silique. In addition, the expression levels of two BoSPLs (BoSPL9b and BoSPL10b) were up-regulated in chilling tolerance cabbage ‘CT-923’ at 6 h after chilling stress when compared with normal treatment (mock), while two BoSPLs (BoSPL9b and BoSPL15a) in chilling sensitive cabbage ‘CS-D9’, five BoSPLs (BoSPL1, -9a, -9b, -10b, -11b) in ‘CT-923’ and two BoSPLs (BoSPL9b and BoSPL16a) in ‘CS-D9’ were up-regulated after 24 h chilling stress, indicated that these genes may play an important role in the chilling-tolerance of cabbage. We analyzed the characteristics of BoSPLs and provided the basis for further functional research.

1. Introduction

Squamosa promoter-binding protein-like (SPL) is a plant-specific transcription factor family, which plays an important role in plant growth and development [1], plant architecture [2], primary and secondary metabolism [3], signaling [4] and biotic stresses [5]. SPL genes were first discovered in Antirrhinum majus [6], subsequently, several SPL families were identified in other species, such as Arabidopsis thaliana [7], rice [8,9], Chinese cabbage [10] and tomato [11]. The SPL protein contains a highly conserved DNA binding region, the SBP domain. The SBP domain is a typical zinc finger structure consisting of eight His or Cys residues, the C-terminus is Cys-Cys-His-Cys, the N-terminus is Cys-Cys-Cys-His or Cys-Cys-Cys-Cys [12]. These amino acid residues can bind to a single zinc ion, when zinc ion is absent, the SBP domain does not have the ability to bind to DNA. The SPL genes mainly regulate the expression of downstream genes by binding to the complementary sequence of the promoter region of the downstream genes, thereby affecting the growth and development of the plants [13].
SPL genes were usually regulated by microRNA156 (miRNA156) in the regulatory network of plant growth and development [14], miRNA156 also targeted SPL genes to regulate the Arabidopsis response to environmental stress [15]. A total of ten SPL genes in A. thaliana [16], ten in tomato [11] and seventeen in soybean [17] were the targets of miRNA156, respectively. In rice, the OsmiRNA156-OsSPL3/OsSPL12 module directly activates the nodes in OsMADS50 to regulate the development of the rice crown root [18]. The miRNA156-SPL4 module in switchgrass mainly regulates the germination of the aerial bud, SPL4 inhibits the formation of the aerial bud and the basal bud, the genetic manipulation of SPL4 could change the plant structure and increase yields [2]. The analysis of the spatiotemporal expression profile in wheat showed that TaSPL16 expressed highly in young developing panicles, and its expression is almost undetectable in vegetative tissues; the ectopic expression of TaSPL16 in A. thaliana leads to a delayed emergence of vegetative leaves, and promotes flowering early [19].
SPL genes also play an important role in temperature-sensitive flowering. The overexpression of AtSPL1 and AtSPL12 enhanced the tolerance to high temperature in Arabidopsis florescence [20]. In grapes, the expression of VvSPL3 and VvSPL5 were up-regulated, while VvSPL4 and VvSPL7 were significantly down-regulated under low temperature conditions (5 °C), indicating that VvSPL3 and VvSPL5 were involved in the low temperature stress [21]. The miRNA156 expression in A. thaliana increased under drought or salt stress, which decreased the expression of downstream target genes AtSPL9 and AtDFR, which delayed the flowering of A. thaliana [5]. In contrast, in Betula platyphylla, the expression of BpSPL9 in roots and leaves was induced, suggesting that it may be involved in drought and salt stress [22]. These findings indicate that SPL genes can respond to abiotic stresses in different plants, improve the disorder caused by stress in the metabolic balance system and, finally, improve the survival rate of plants.
Low temperature is a major environmental factor that limits plant growth, development and geographical distribution [23], and may significantly reduce crop yields, including vegetable crops. Cabbage (Brassica oleracea var. capitata L.) is a widely distributed cruciferous vegetable crop in the world. If cabbage encounters low temperatures before the heading stage, or seedlings meet their vernalization conditions, afterwards, they are easy to bolt in the long day light, resulting in the failure to form tight and leafy heads, which serves as a storage organ and edible product. If the temperature is lower than the tolerance of cabbage, the seedlings will freeze to death, which can cause serious economic losses. In Arabidopsis, the overexpression of miRNA156 causes delayed flowering at lower ambient temperatures, which is probably associated with the reduced levels of SPL3 mRNA [24], while six SPLs were highly expressed in apices in response to vernalization in Arabis alpine [25]. Thus far, the analysis of the SPL family has focused on A. thaliana, rice and other plants, while the function and expression pattern of SPL genes in B. oleracea are little known. In this study, we systematically identified the SPL gene family at the whole genome level of B. oleracea. The results obtained from this study provide a theoretical foundation for further revealing the molecular characterization of the SPL family members of B. oleracea.

2. Materials and Methods

2.1. Identification of BoSPL Genes in B. oleracea

The whole genome sequences of B. oleracea [26], B. rapa and A. thaliana were downloaded from the Brassica Database (http://brassicadb.cn, accessed on 2 January 2021) [27] and the Arabidopsis Information Resource (TAIR) database (http://www.arabidopsis.org/, accessed on 2 January 2021), respectively. The SBP protein domain (PF03110) was used to search for the protein sequences of B. oleracea, B. rapa and A. thaliana using the hidden Markov model (Hmmer 3.0 software), with the E-value set to ≤1.0, and the candidate SPL proteins were obtained. These candidate SPL proteins sequences were submitted to the Batch CD-Search (https://www.ncbi.nlm.nih.gov/Structure/bwrpsb/, accessed on 5 January 2021), Pfam (http://pfam.xfam.org/search, accessed on 5 January 2021) and SMART (http://smart.embl-heidelberg.de/, accessed on 5 January 2021) databases for conserved domain analysis, the candidate SPL proteins without an SBP domain will be discarded. The names of the SPL proteins of B. oleracea were according to the homology of the AtSPL1-16 protein sequences and the suffix was added (a, b, c..., etc.).

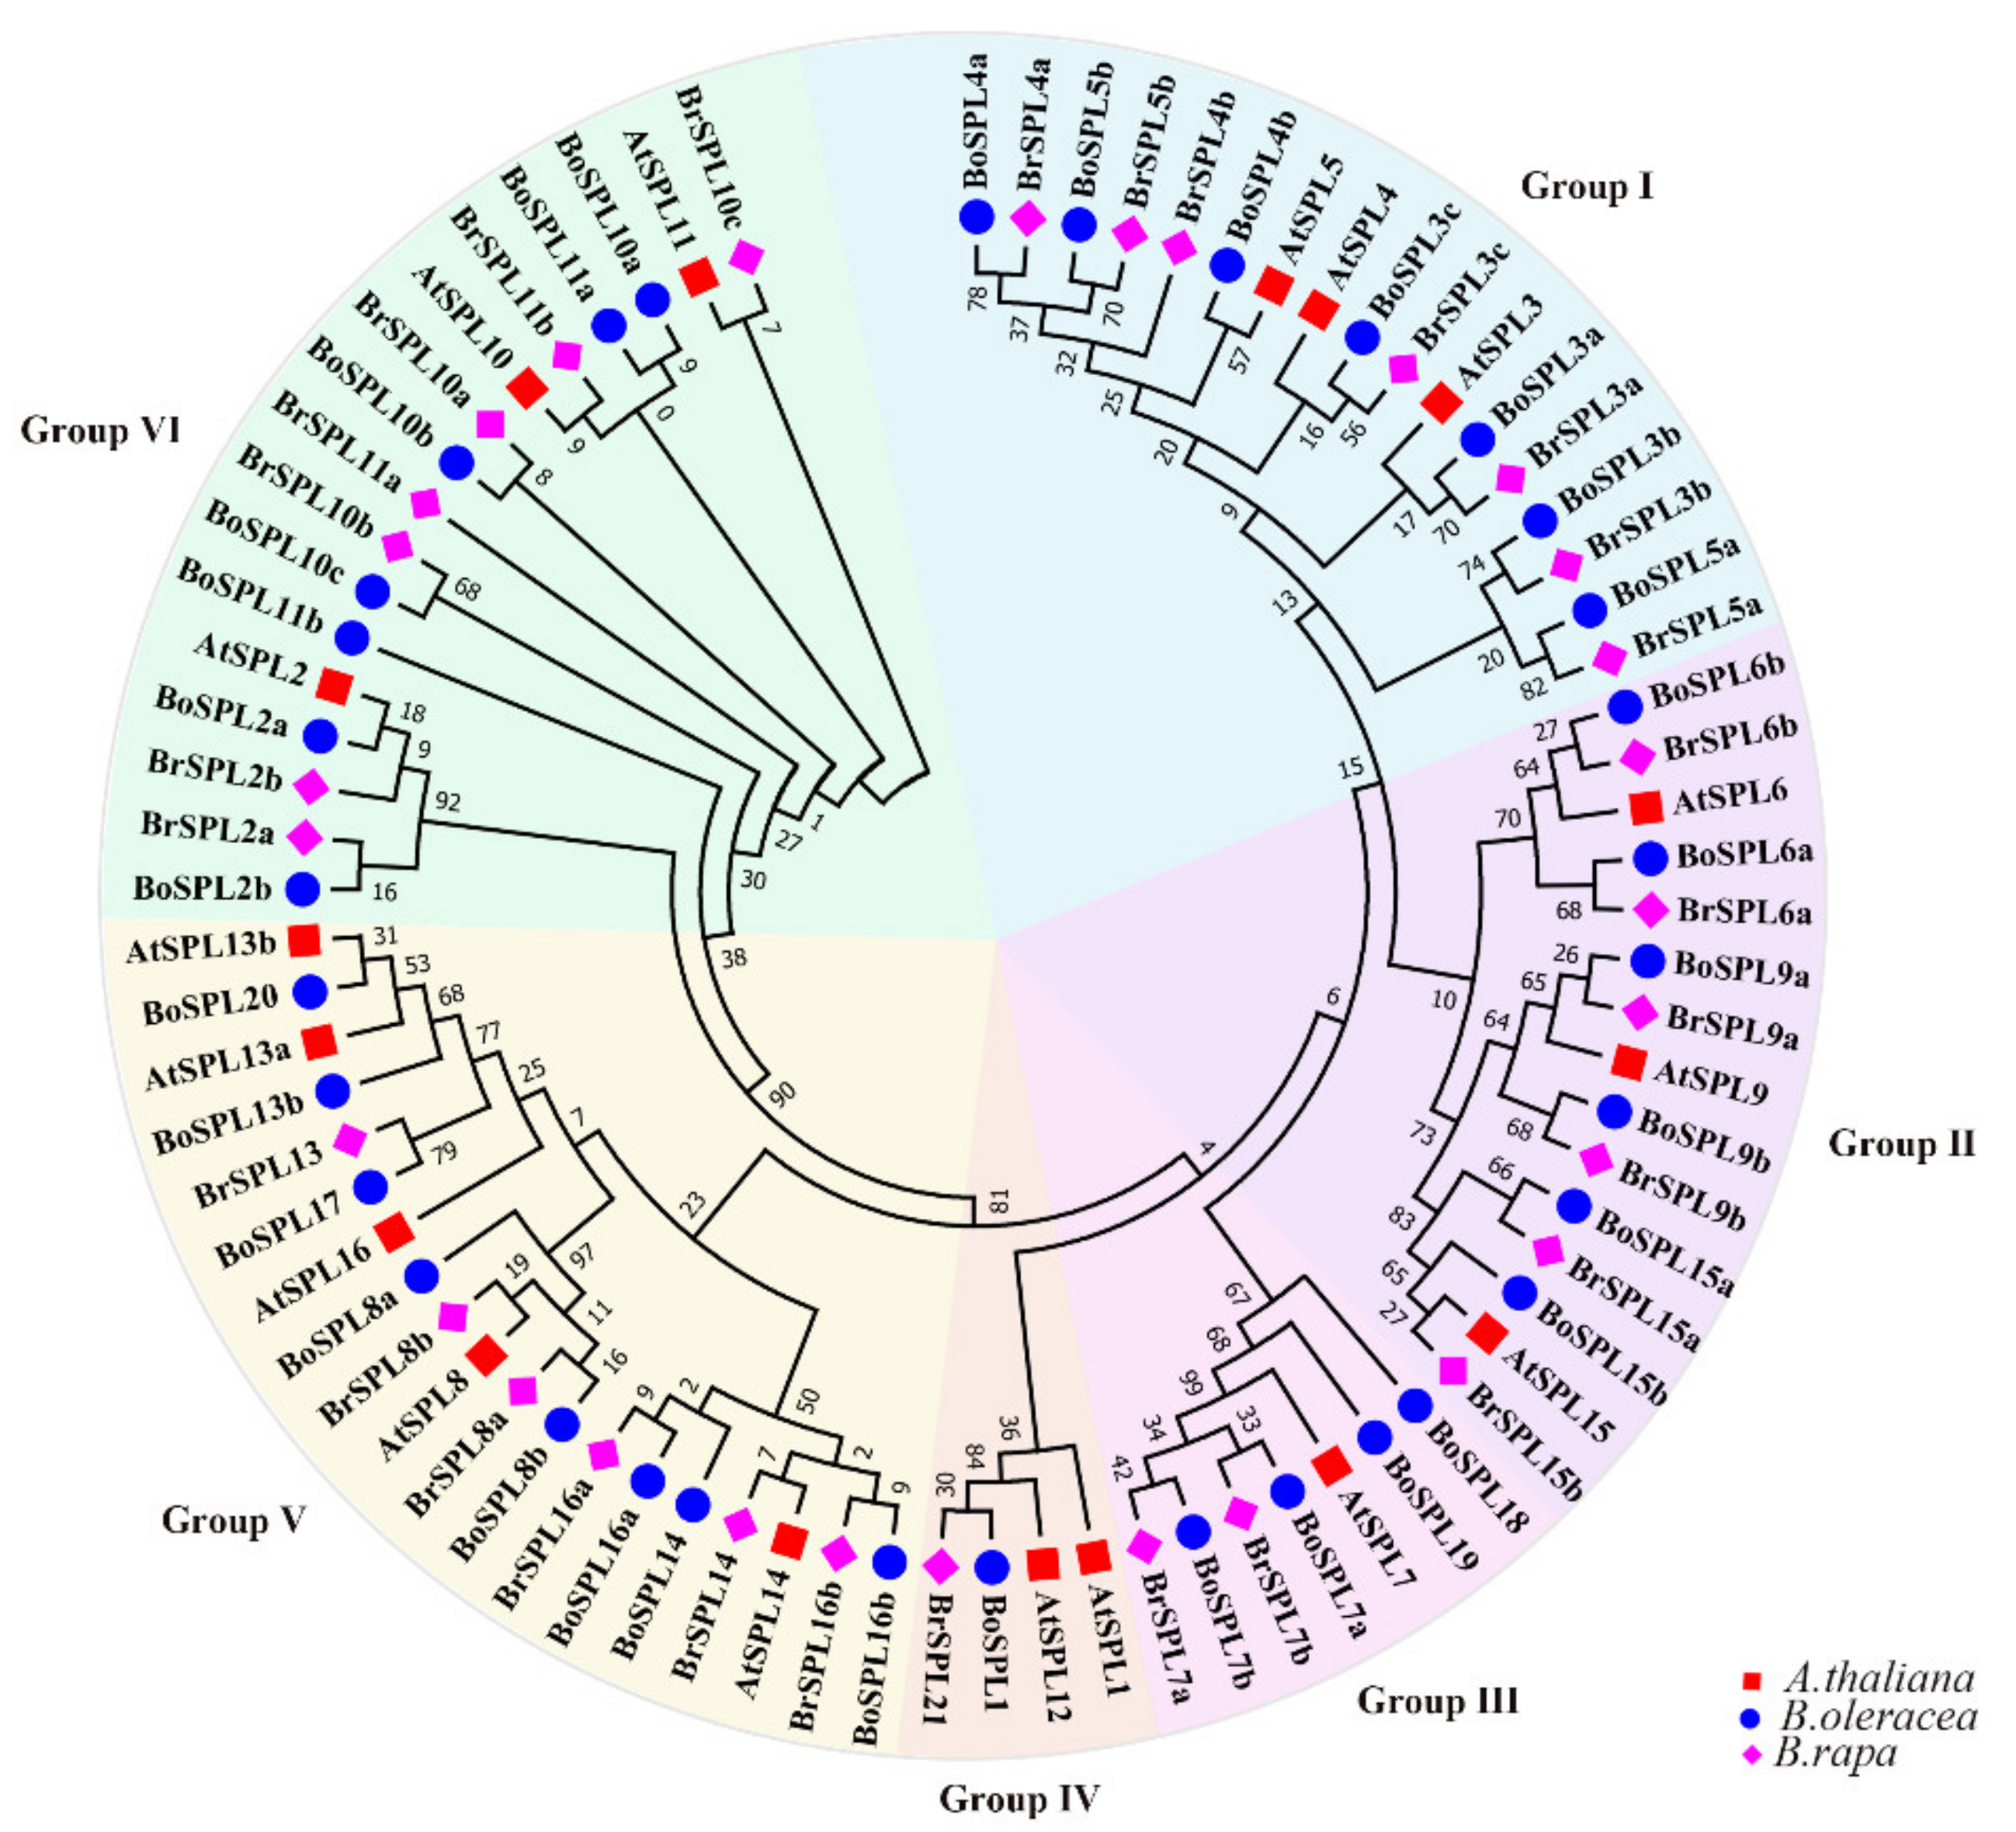
2.2. Characterization and Phylogenetic Analysis of BoSPL Proteins

The physical and chemical parameters of BoSPL proteins were predicted by the ProtParam tool (http://web.expasy.org/protparam/, accessed on 6 January 2021), including relative molecular weight, theoretical isoelectric point (pI), instability coefficient, aliphatic index and grand average of hydropathicity (GRAVY). By comparing the cDNA sequences of BoSPLs with their corresponding DNA genes, the exon-intron structure was determined using Display Server 2.0 (GSDS 2.0 http://gsds.cbi.pku.edu.cn/, accessed on 7 January 2021). In addition, the conservative motifs were analyzed using the MEME (http://meme-suite.org/tools/meme, accessed on 8 January 2021), the parameters were default values. The subcellular localization of SPL proteins was predicted using Plant-mPLoc (http://www.csbio.sjtu.edu.cn/bioinf/plant-multi/, accessed on 10 January 2021) and BaCelLo (http://gpcr2.biocomp.unibo.it/bacello/index.htm, accessed on 11 January 2021). The phylogenetic tree was constructed by MEGA7.0 [28] using the neighbor-joining (NJ) method, the remaining parameters were kept as the defaults, except that the bootstrap value was set to 1000.

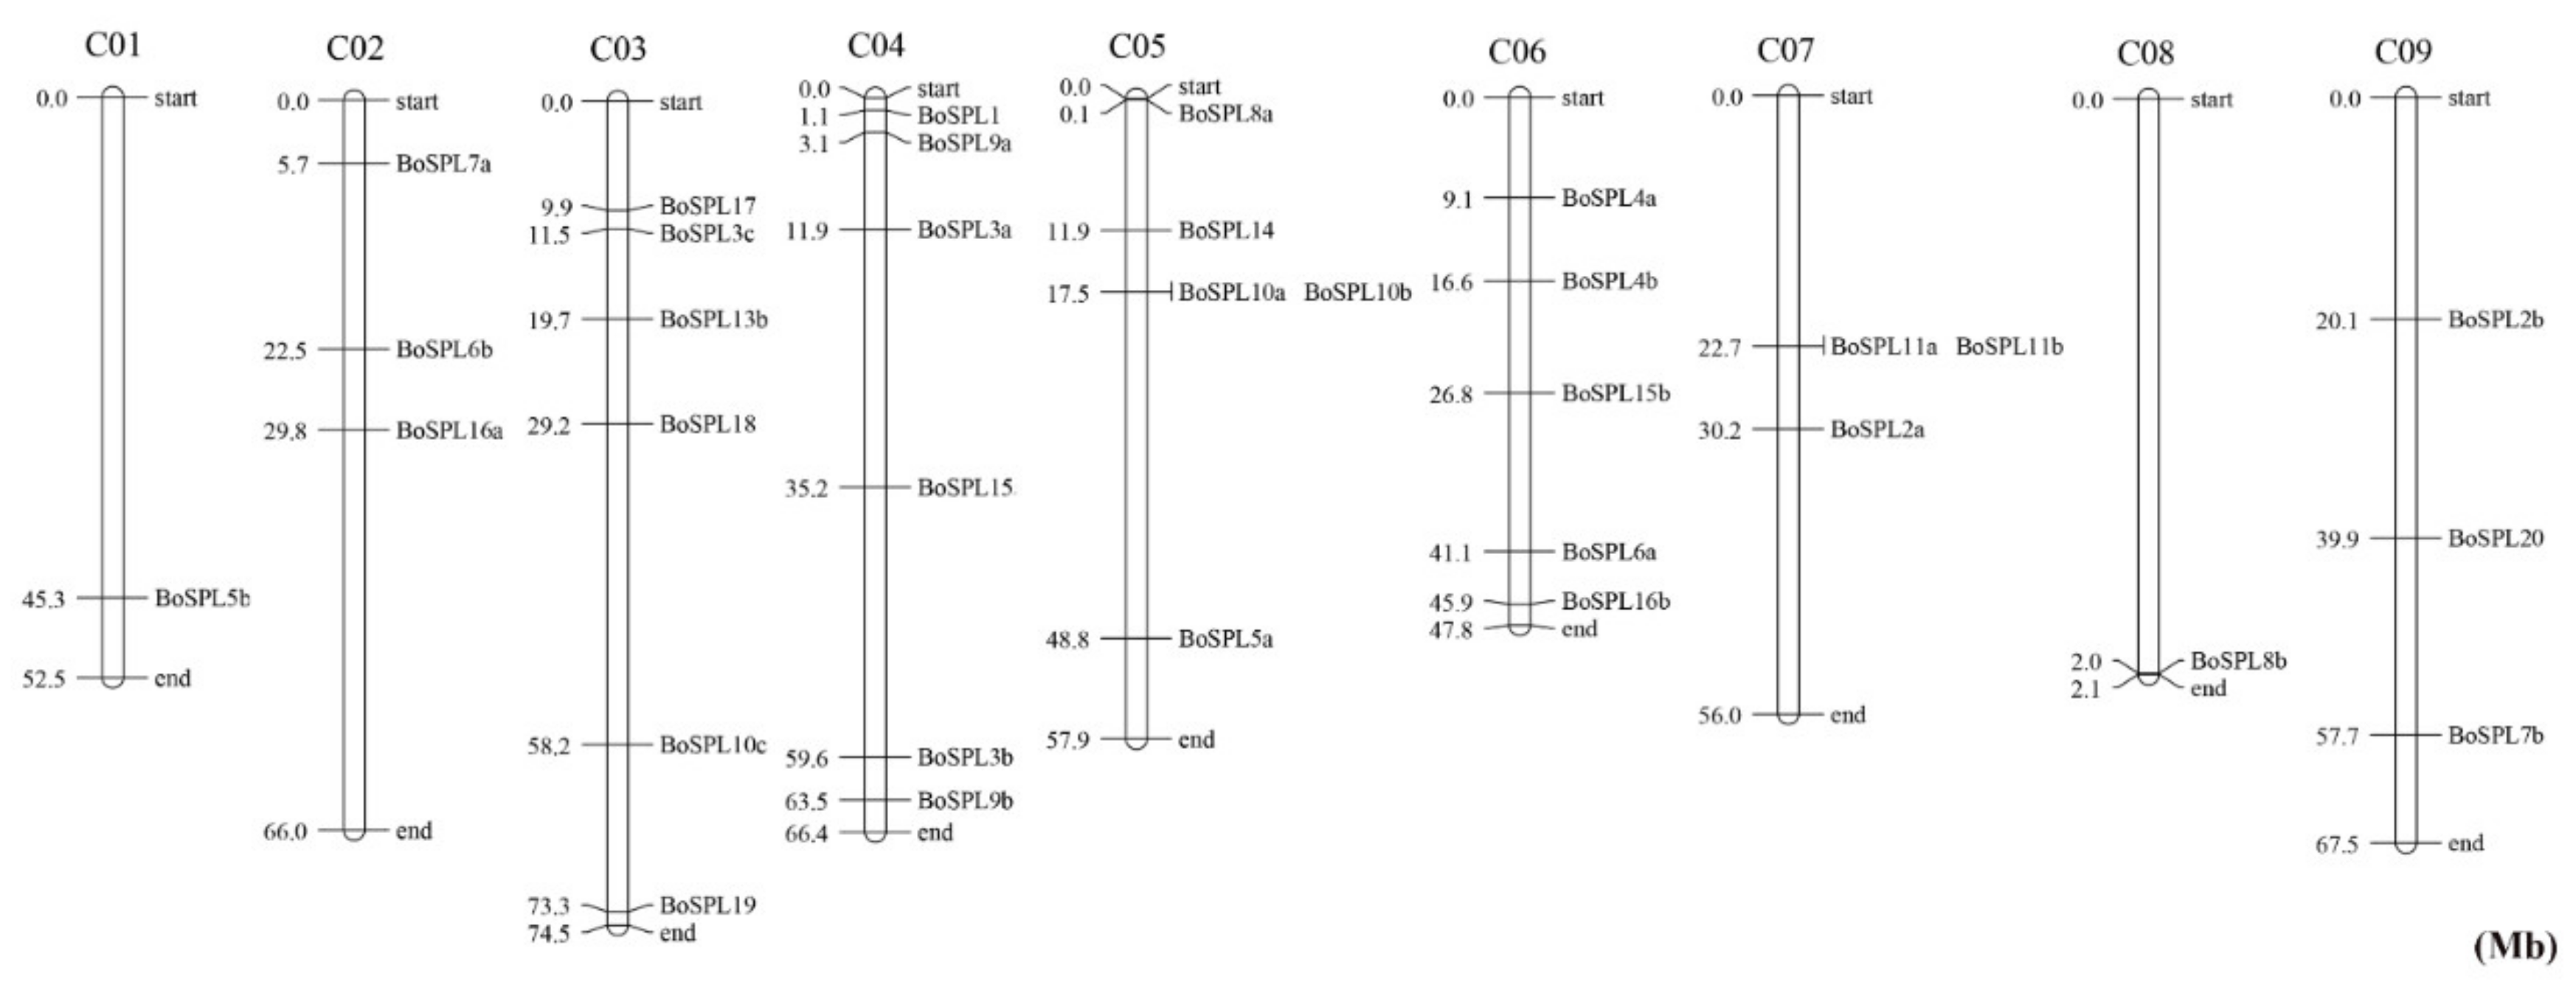
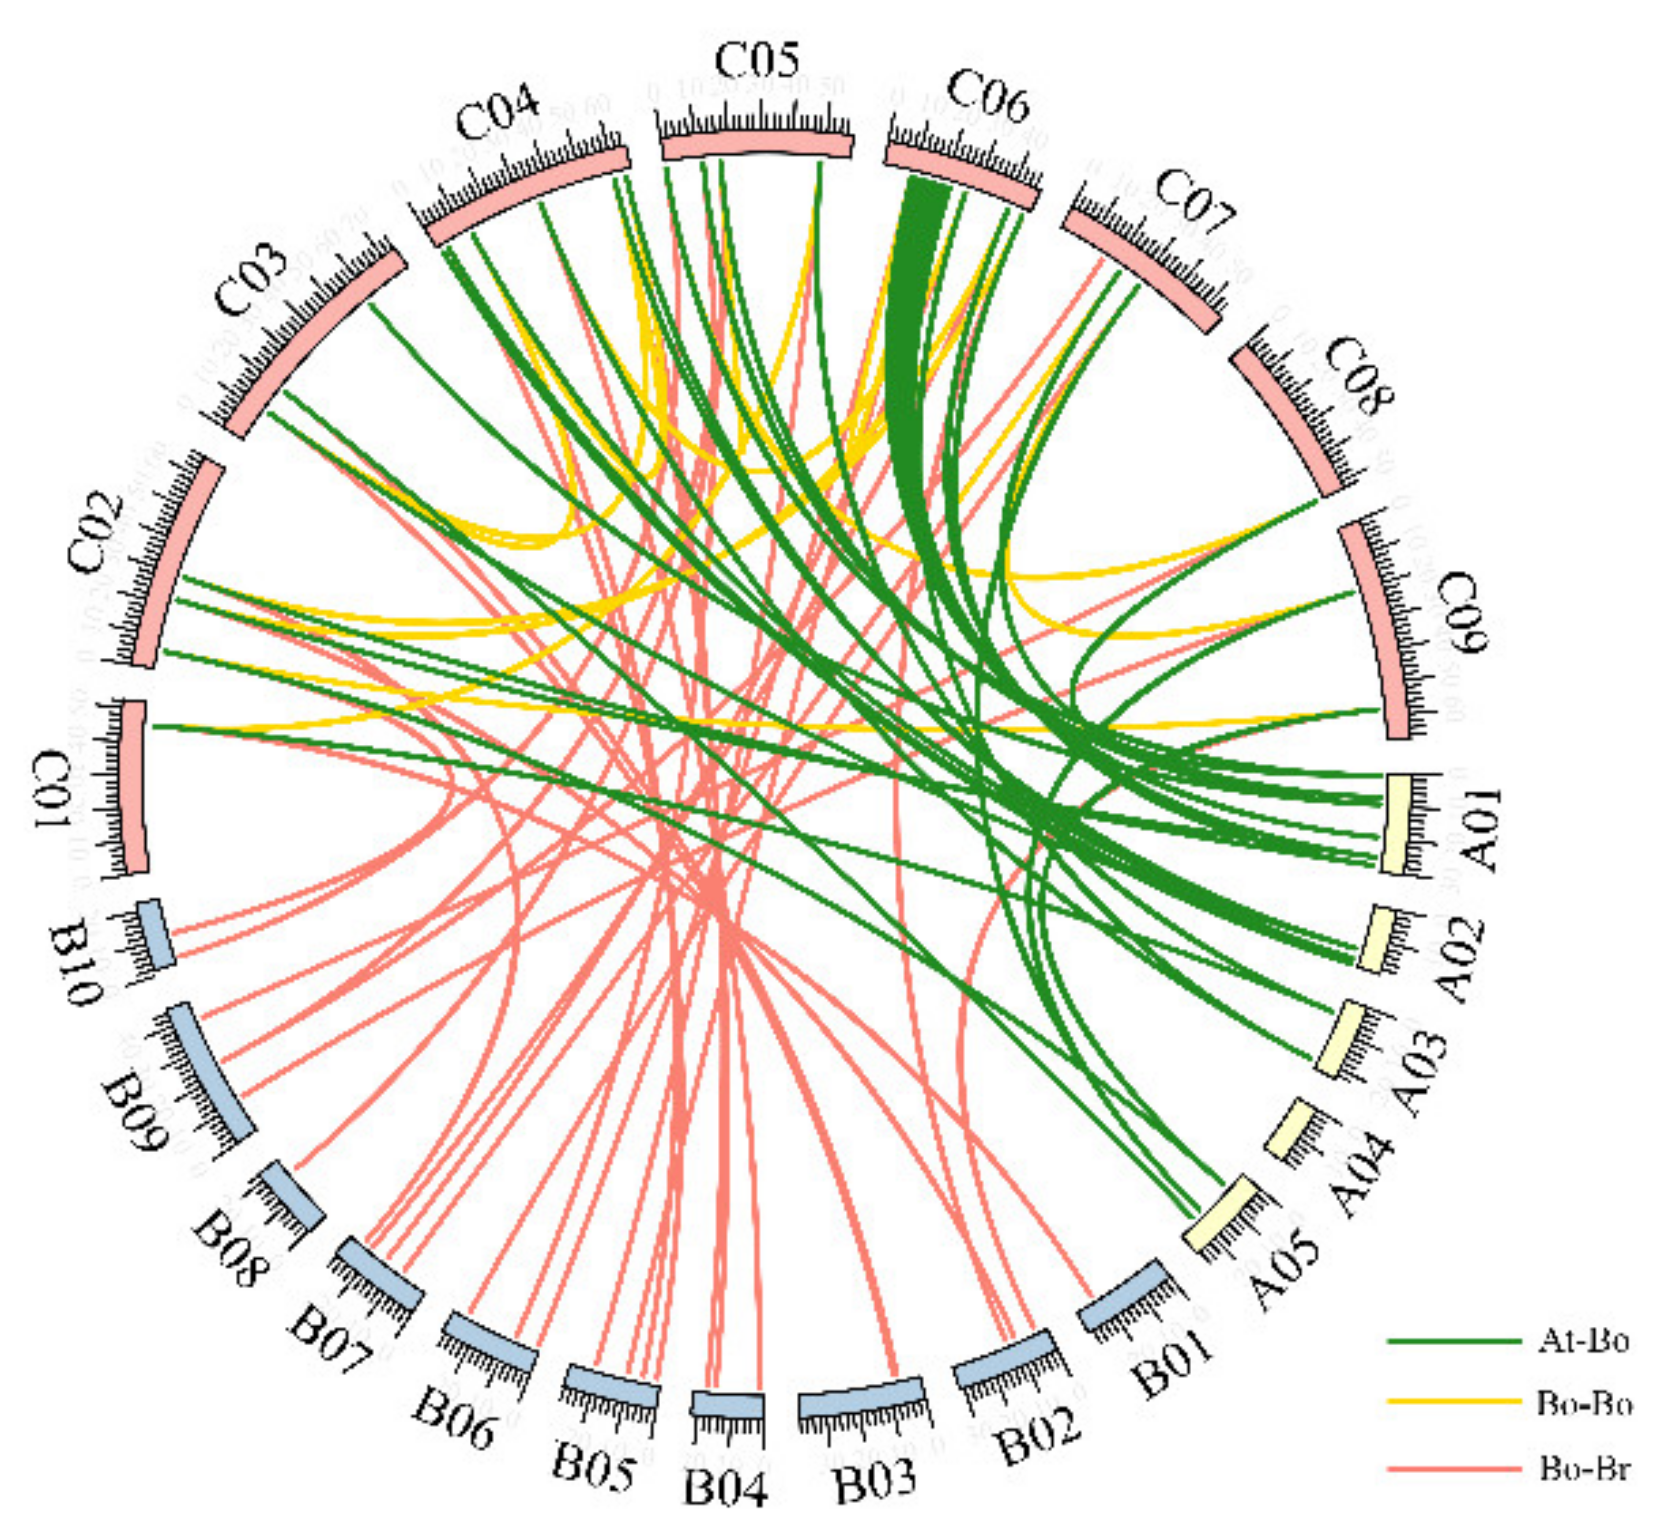
2.3. Chromosomal Distribution

Mapchart software was used to map the chromosomal distribution of the BoSPL genes on the nine chromosomes. The BRAD database was used to identify the orthologous and paralogous of the SPL genes in B. oleracea, B. rapa and A. thaliana [29]. The relationships of orthologous and paralogous among the three species were plotted using the TBtools software [30].

2.4. Cis-Acting Element Analysis

The 2000 bp genomic DNA sequences upstream of the start codon (ATG) of each BoSPL genes were detected using the PlantCare database (http://bioinformatics.psb.ugent.be/webtools/plantcare/html/, accessed on 13 January 2021) [31], which were regarded as putative promoter sequences. The specific cis-elements involved in hormone response, light response and stresses response were analyzed in this study.

2.5. Organs/Tissues Expression Analyses of BoSPLs

According to the obtained transcriptome data (NCBI GEO database: GSE42891) of B. oleracea in different organs/tissues (callus, root, stem, leaf, flower, bud and silique), the expression of BoSPLs in different organs/tissues of cabbage were evaluated using these transcriptome data. The FPKM (Fragments per kilobase of exon per million reads mapped) values were used to represent the expression abundance of BoSPLs. The expression heat map of BoSPLs was generated using TBtools based on log2 (FPKM + 1) values.

2.6. Chilling Stress, Sample Collection and RNA-Seq Analysis

The seeds of chilling-sensitive cabbage ‘CS-D9’ and chilling-tolerance cabbage ‘CT-923’were germinated and sown in sterilized soil, and placed in the artificial climate chamber for growing. The temperature was set to 25 °C during the day and 18 °C at night, and there was light for 14 h each day. When the seedlings grew to six true leaves, they were moved to the vernalization chamber for chilling stress, and the seedlings as the mock were still under normal conditions. After 6 h and 24 h stress, the seedlings of chilling stress and normal treatment (Mock) were sampled at the same time (three biological replicates). The third fully expanded true leaves from the top of the plants were harvested, frozen in liquid nitrogen and stored at −80 °C for RNA-Seq analysis. Sequencing of RNA-Seq libraries was performed on Illumina HiSeqTM 2500 platform.

3. Results

3.1. Identification and Phylogenetic Analysis of SPL Family Genes in B. oleracea

In this study, a total of 34 candidate SPL genes were identified in the B. oleracea genome through HMM profiles (Supplementary Tables S1 and S2). These 34 protein sequences were subjected to Batch CD-Search, Pfam and SMART analysis, and the sequence of BolC07g038540.2J was discarded without the SBP domain. These 33 BoSPL proteins were named BoSPL1 to BoSPL21 according to their homologs with A. thaliana (Table 1). The open reading frames (ORF) of BoSPLs ranged from 408 bp (BoSPL3c) to 4833 bp (BoSPL10c), and the corresponding proteins varied from 135 (BoSPL3c) to 1610 (BoSPL10c) amino acids, the predicted molecular weights ranged from 15.77 (BoSPL3c) to 178.85 (BoSPL10c) kDa. The isoelectric point (pI) varied from 5.80 (BoSPL1) to 9.67 (BoSPL19); there were 27 BoSPL proteins with pI values greater than 7.00, indicating that they are basic proteins; and the remaining proteins were acidic proteins with a pI value of less than 7.00. The instability index ranged from 46.11 (BoSPL19) to 111.81 (BoSPL3c). The Aliphatic Index and GRAVY of the BoSPL proteins ranged from 28.96 (BoSPL3c) to 78.89 (BoSPL7b), and −0.31 (BoSPL7b) to −1.52 (BoSPL3b and BoSPL3c), respectively. The results of the subcellular localization prediction showed that all the BoSPL proteins were in the nucleus, except for BoSPL19, which was in cytoplasm, and in secretory when Plant-mPLoc and BaCelLo were used, respectively (Table 1, Supplementary Table S3).
In order to investigate the evolutionary relationships of SPL proteins among B. oleracea, B. rapa and A. thaliana, an unrooted neighbor-joining phylogenetic tree was constructed using 79 full-length SPL protein sequences from B. oleracea (33), B. rapa (29) and A. thaliana (17) (Supplementary Table S4). The phylogenetic tree showed the group I, II, III, IV, V and VI contained seven, six, four, one, eight and seven BoSPL proteins, respectively (Figure 1).

3.2. Chromosomal Distribution of BoSPL Genes

The chromosomal distributions of BoSPLs were analyzed using Mapchart software. Among them, a total of 33 BoSPLs were randomly distributed, anchored on nine chromosomes (C01-C09) of B. oleracea (Figure 2; Supplementary Table S4). The chromosomes C03 and C04 contain the largest numbers of BoSPLs, which account for six, while chromosome C01 and C08 only contain one BoSPL. Chromosome C02, C05, C06, C07 and C09 contained three, five, five, three and three BoSPLs, respectively. In addition, we easily found that BoSPL10a and BoSPL10b, and BoSPL11a and BoSPL11b may have occurred in a tandem duplication event. However, whether these genes were accompanied by functional similarities remains to be determined; further research should look for the functional differences of these tandem duplication genes using molecular biology methods.
The orthologous and paralogous SPL genes relationships among B. oleracea, B. rapa and A. thaliana were analyzed using the BRAD database, the identified collinear and relationships of gene pairs in the SPLs are shown in Figure 3. A total of 27 orthologous SPL gene pairs between B. oleracea and B. rapa, 29 orthologous SPL gene pairs between B. oleracea and A. thaliana and 14 paralogous SPL gene pairs were identified in B. oleracea. Except for the loss of BoSPL12, all the BoSPLs were retained after the whole genome triplication event (WGT) and fractionation. Ten BoSPL genes (BoSPL2, 4, -5, 6, -7, -8, -9, -11, -15, -16,) retained double copies, BoSPL3 and BoSPL10 retained three copies.

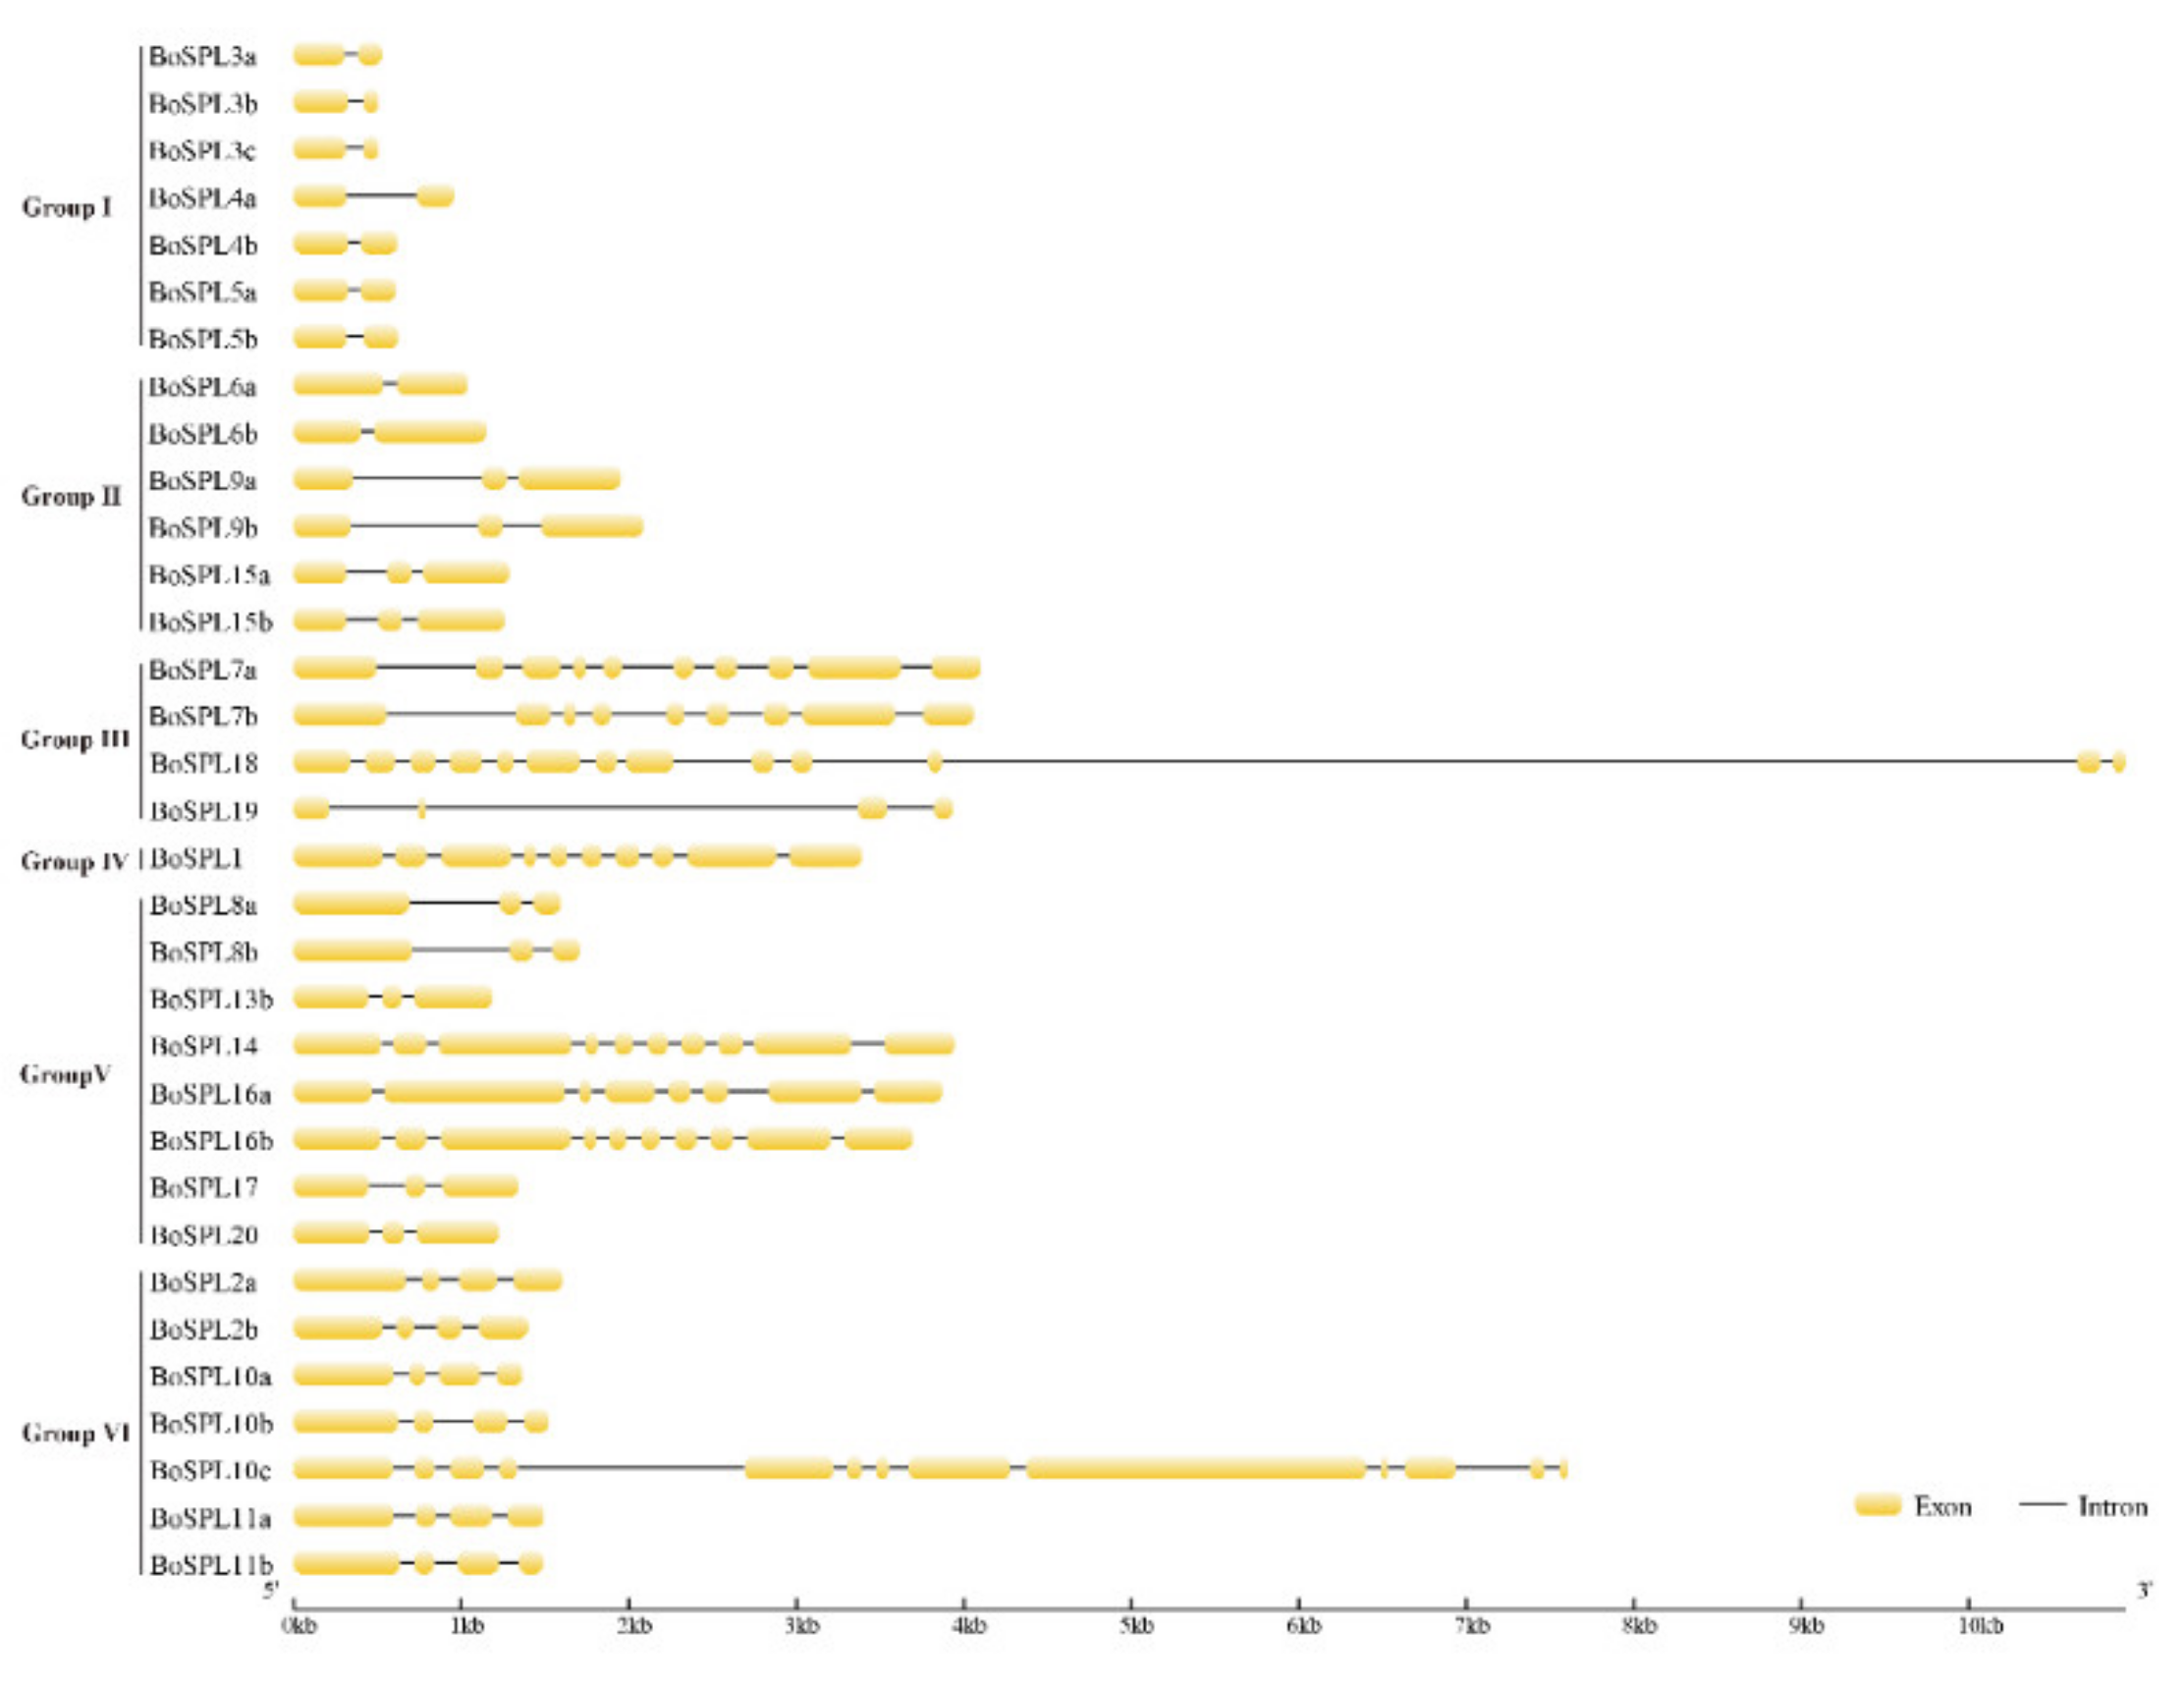
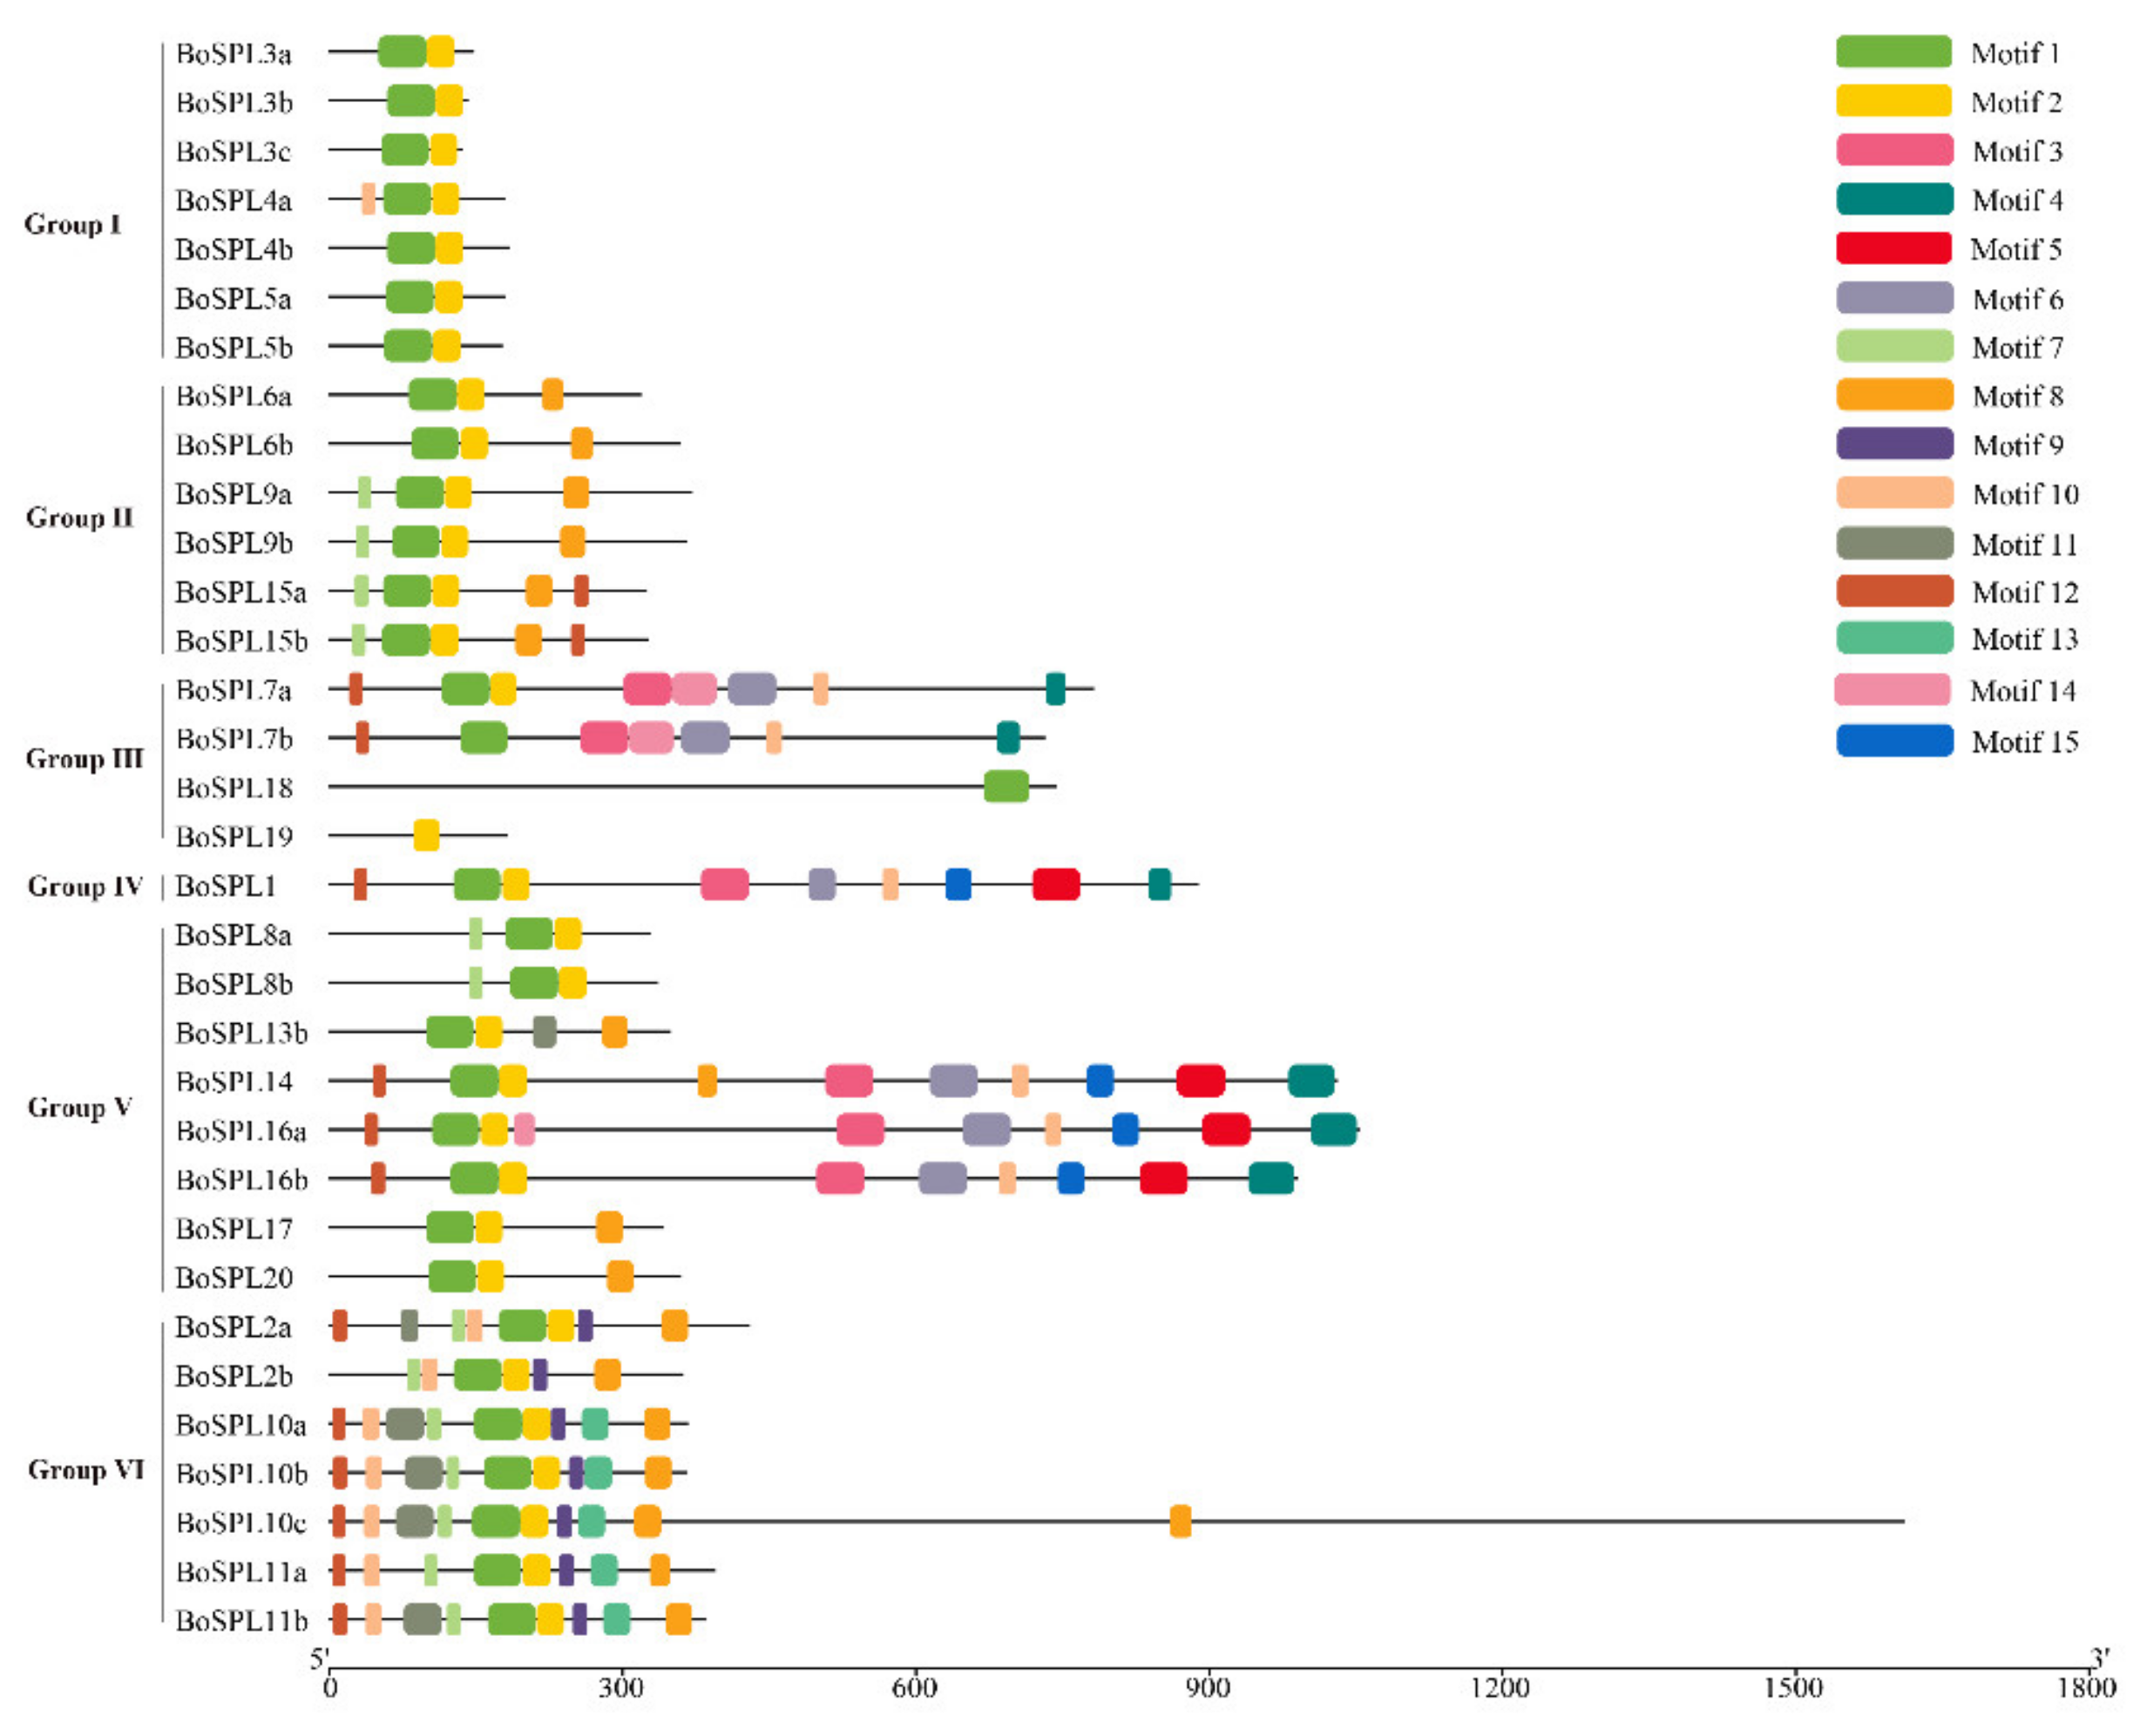
3.3. Gene Structure and Conserved Protein Motifs of BoSPL Genes

The exon-intron structure is considered to play important roles in the evolution of multiple gene families. The exon-intron structure of 33 BoSPLs were mapped by comparing the CDS sequences of BoSPLs and the corresponding genomic sequences. As shown in Figure 4, the number of exons varied greatly, which ranged from two (BoSPL-3a, -3b, -3c, 4a, -4b, -5a, -5b, -6a, -6b) to thirteen (BoSPL18). BoSPLs shared similar exon-intron structures in the same subgroup.
In order to further understand the composition and diversity of the motifs in our predicted BoSPL proteins, the conserved motifs were searched using the MEME program. A total of fifteen conservative motifs were set and named as motif 1 to motif 15. The details of these conservative motifs are shown in Figure 5. Moreover, the logos of these motifs were obtained in MEME (Supplementary Figure S1). In our results, the BoSPL protein motifs were highly specific in different subgroups. All the BoSPL proteins contained motif one and motif two, except for BoSPL19, which was without motif one, and BoSPL7b and BoSPL18, which were without motif two. In contrast, the amino acid sequences of motif one and motif two were both predicted to be the conserved SBP domain (Supplementary Table S5), which indicates that all the BoSPL proteins contain a highly conserved domain.

3.4. Analysis of Putative Promoter Regions in BoSPL Genes

The gene expression patterns of stress response and tissue-specific expression are mainly regulated by cis-acting elements [32], and the cis-acting elements in the promoter are closed to various stress-responsive genes [33,34]. We found a long list of cis-acting elements in BoSPLs. There are three main types of cis-acting elements, including hormone response (ABRE, ERE, P-box, TCA-element, TGACG-motif and TGA-element), light response (GT1-motif, G-Box and MRE) and stress response (MBS, LTR, STRE and TC-rich repeats) (Supplementary Table S6). A total of 19 BoSPLs contain TCA-elements (salicylic acid response), 13 BoSPLs contain TGA-elements (auxin response) and 21 BoSPLs contain TGACG-motif (Methyl jasmonate salicylic acid response); these hormones are usually involved in signaling pathways for senescence and stress response, suggesting that BoSPLs are involved in the maturation of cabbage seeds. A total of 19 BoSPLs contain LTR (low temperature stress), 28 BoSPLs contain STRE (drought/salt stress response) and 17 BoSPLs contain TC-rich repeats (defense and stress responsiveness); these regulatory elements associated with environmental stress indicate that BoSPLs may respond to environmental stress.

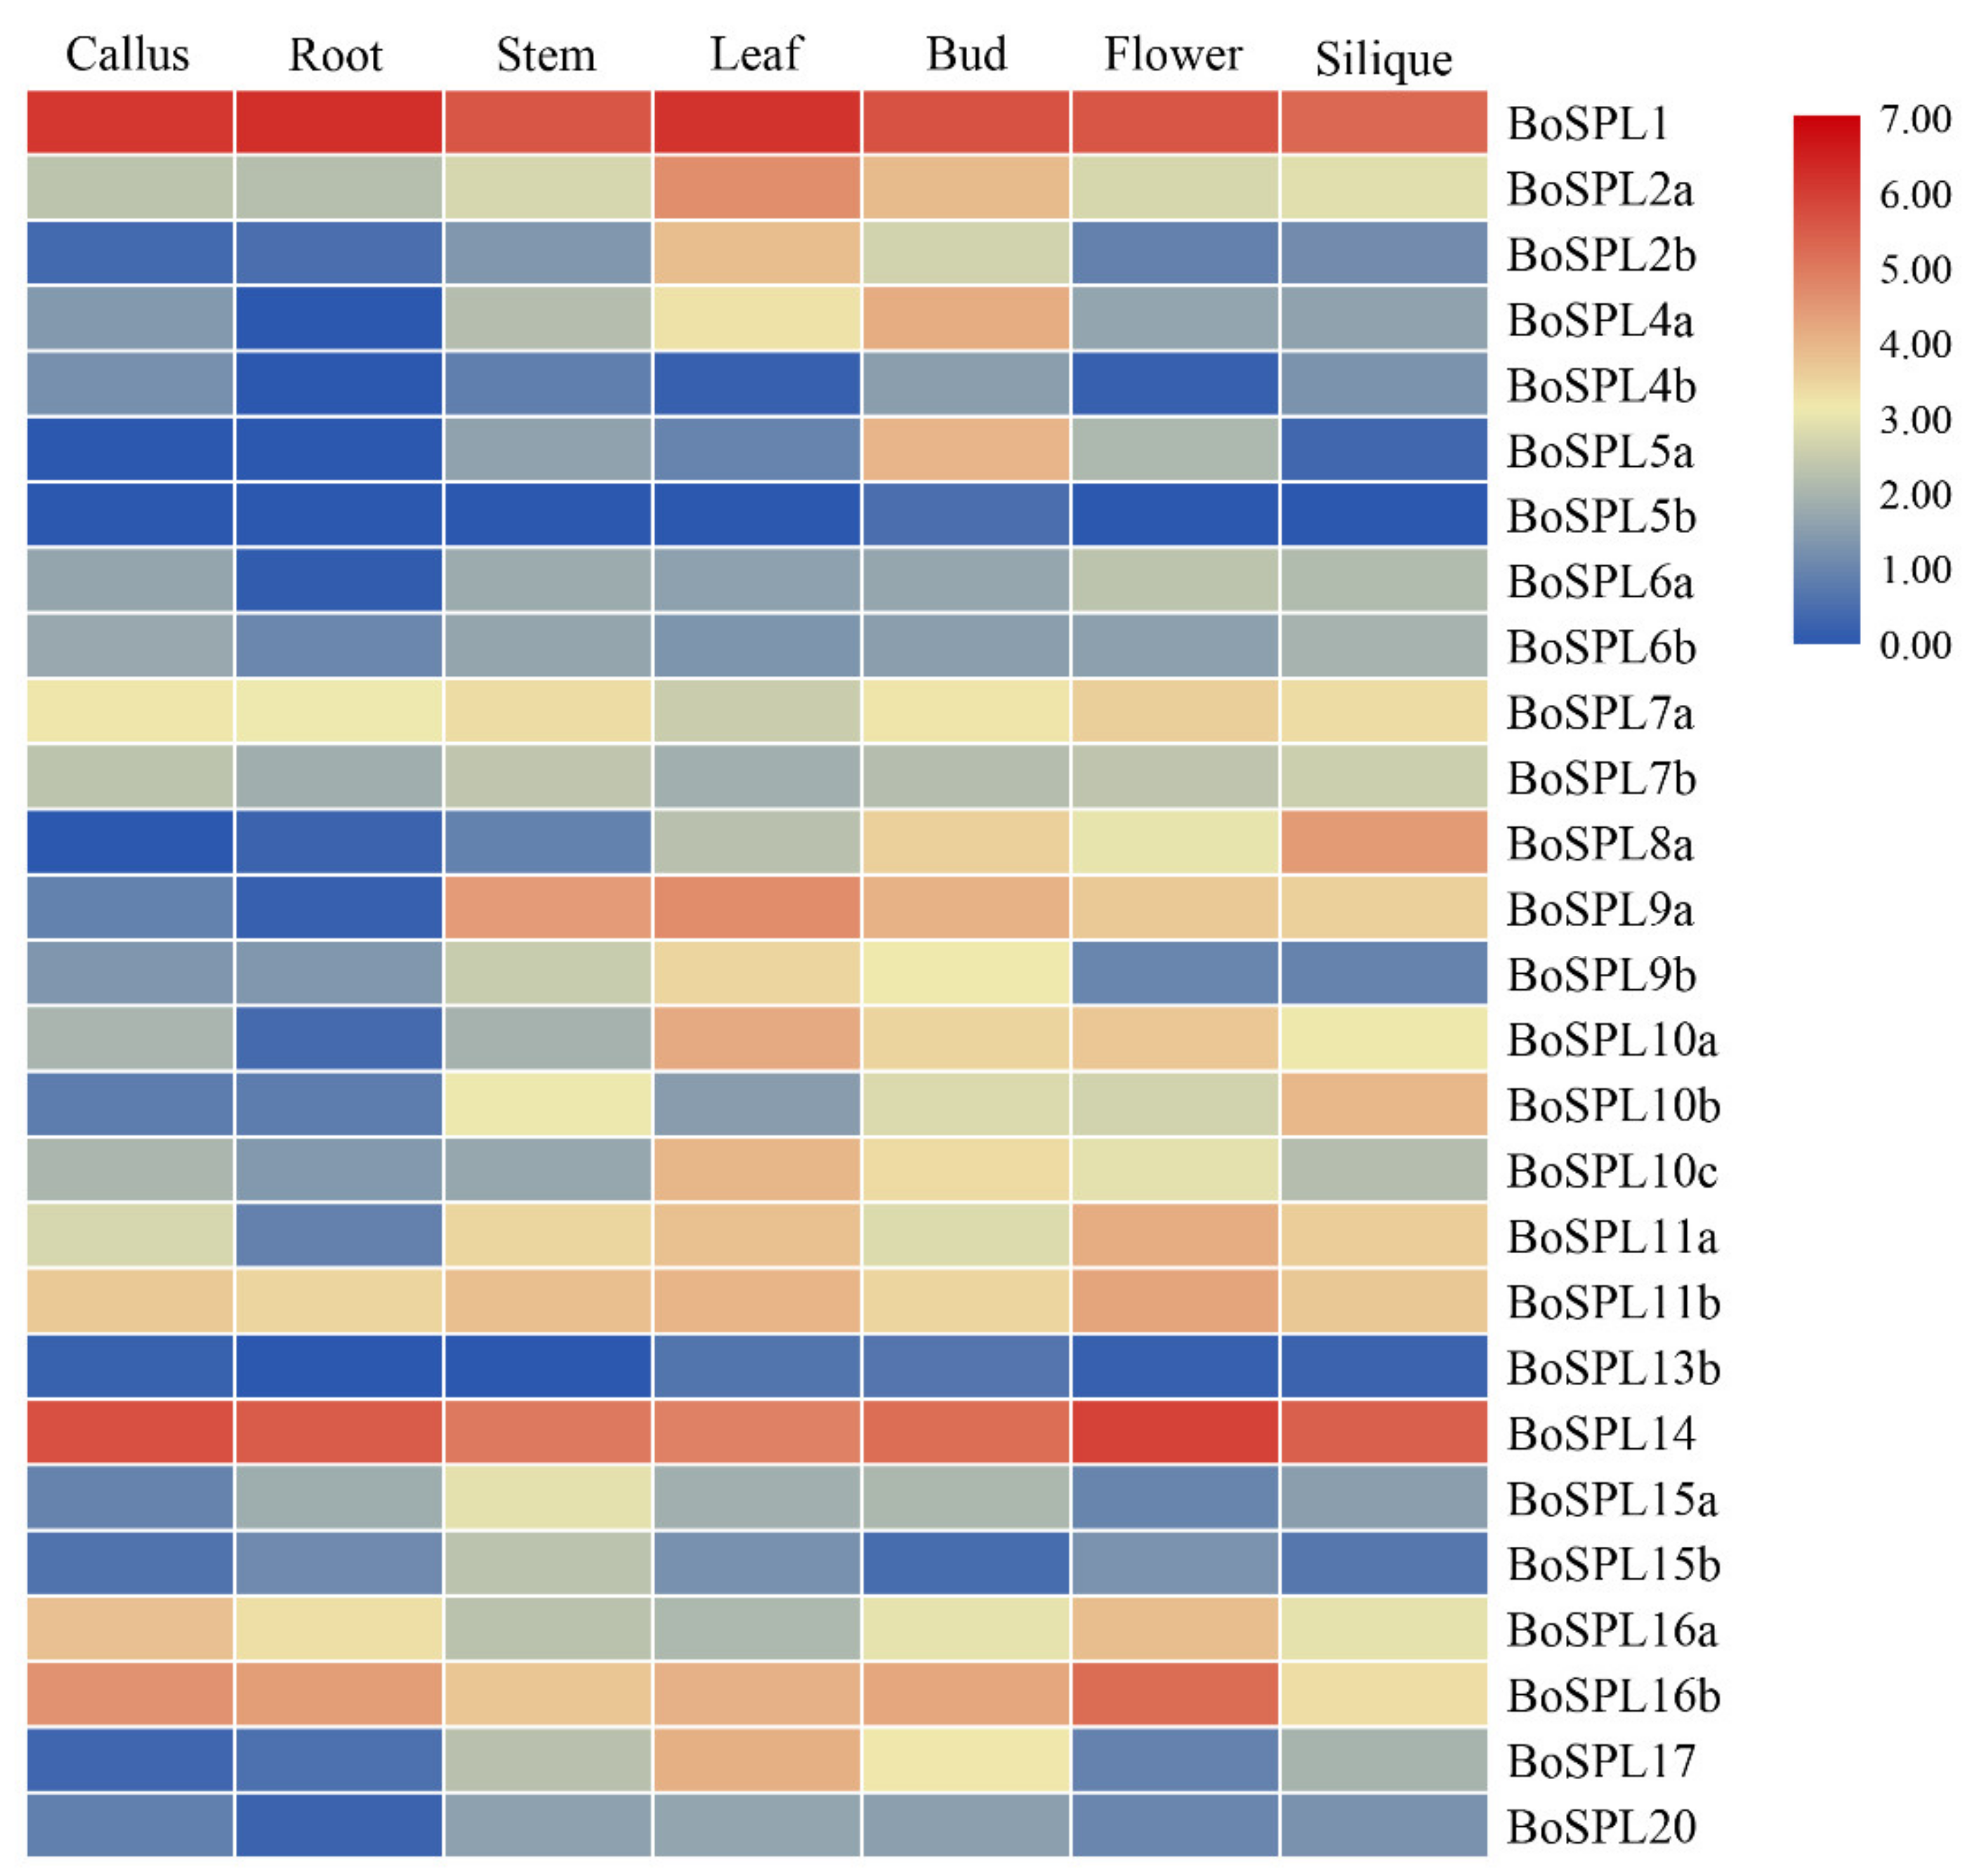
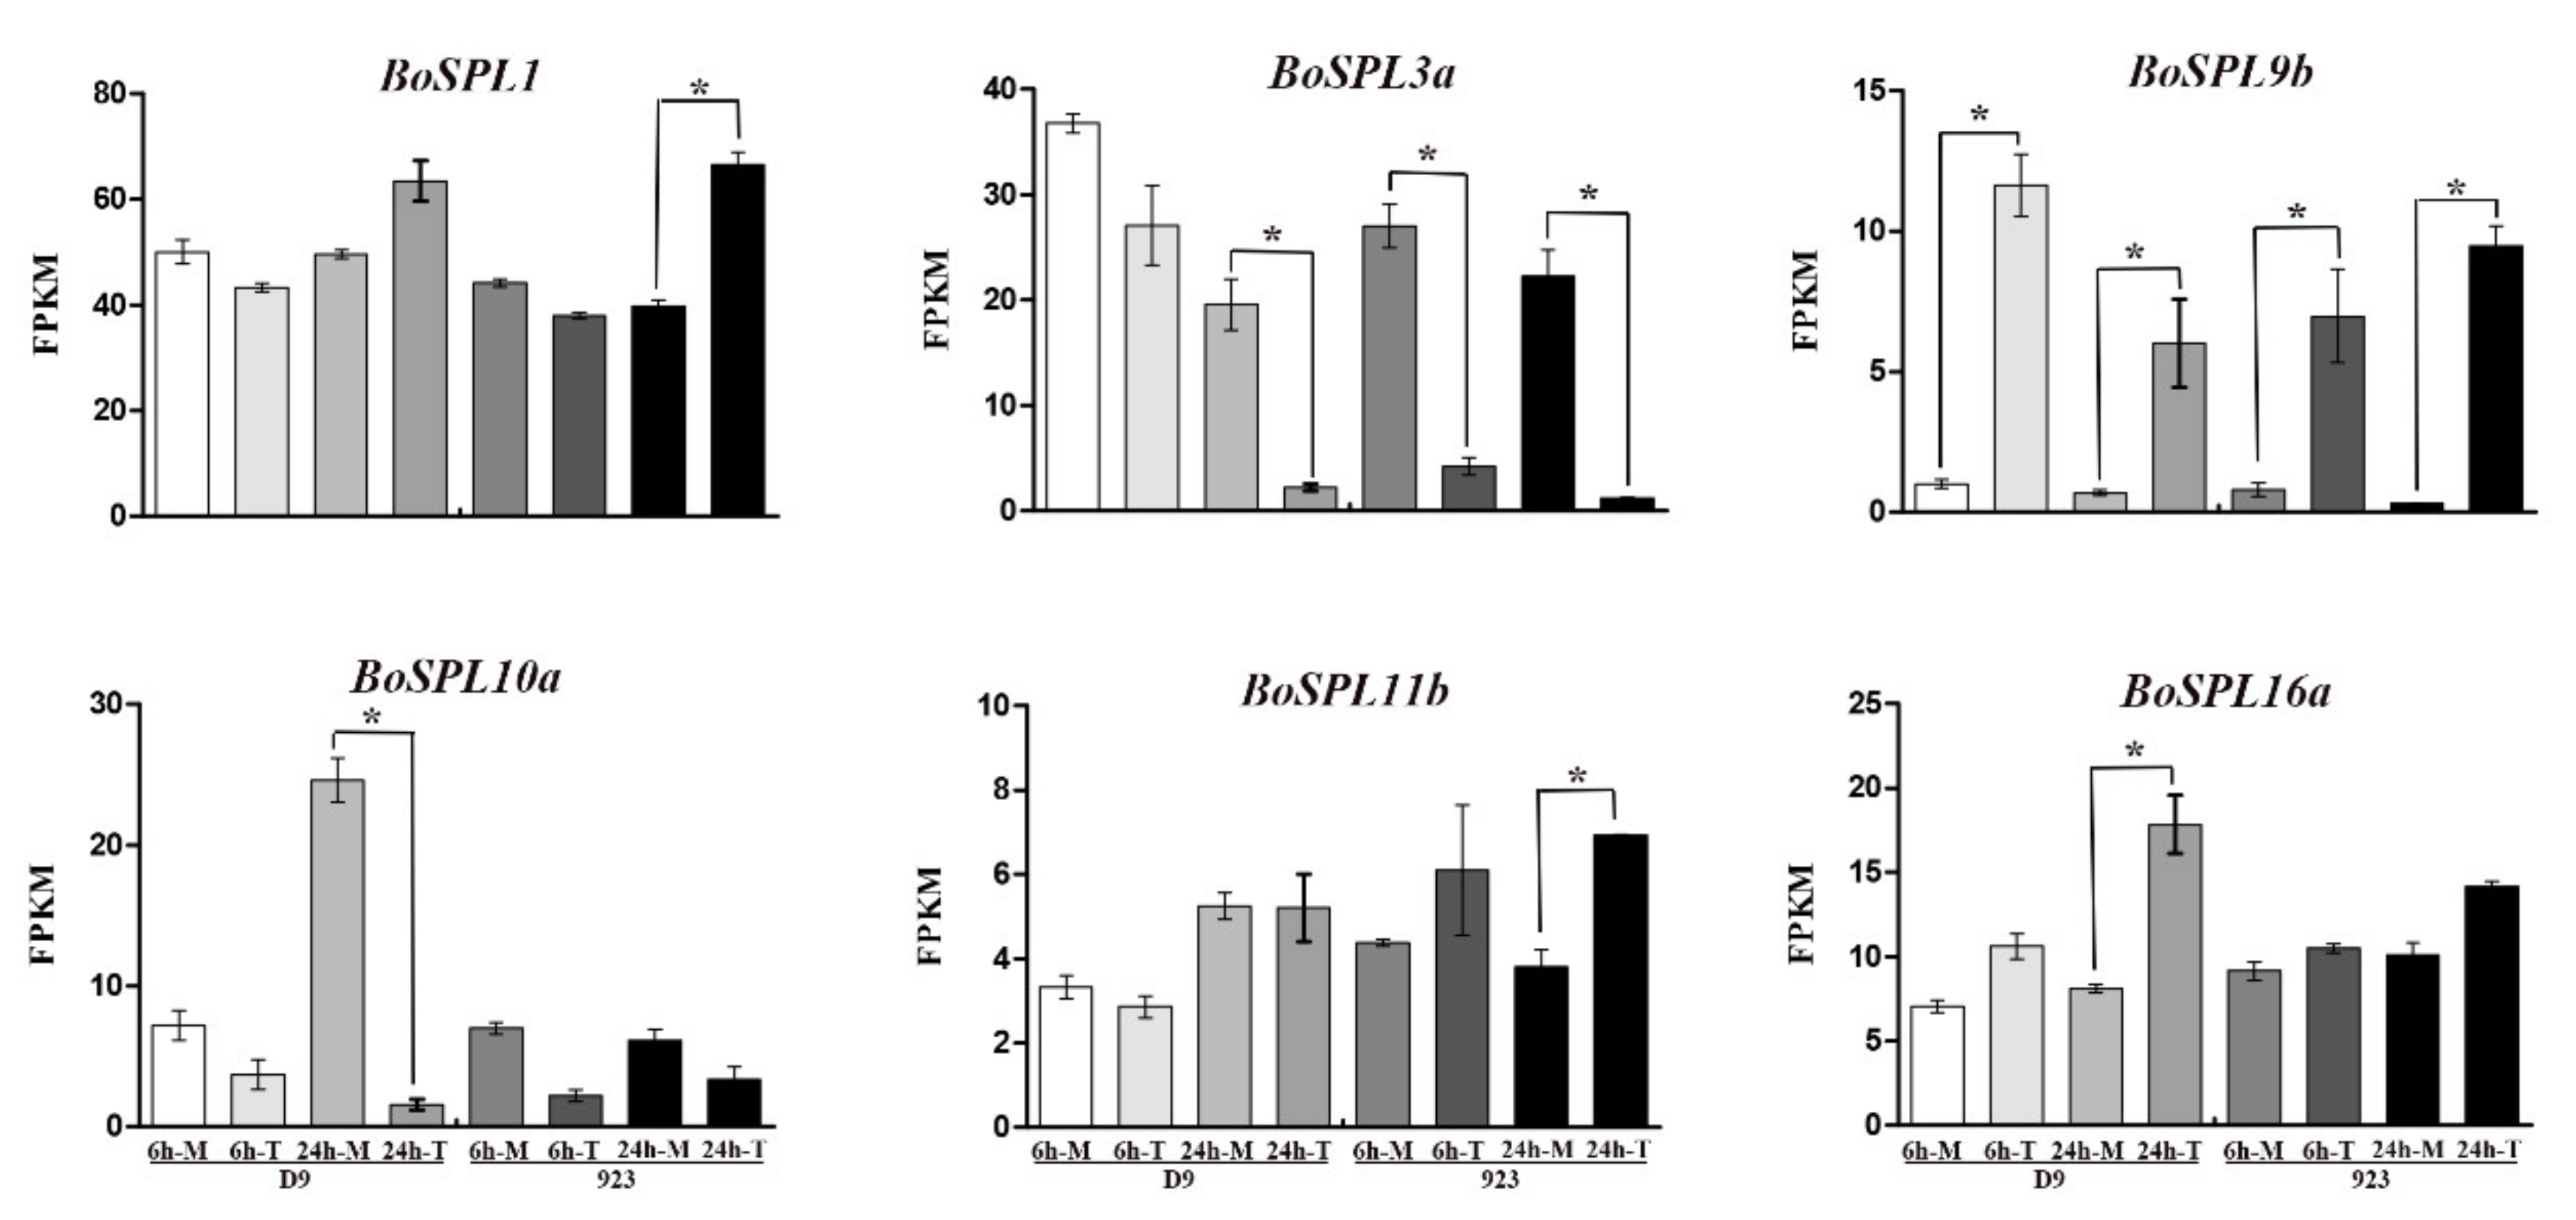
3.5. Expression Profile of BoSPLs

To identify the tissue-specific expression profiles of BoSPLs, we analyzed the different expression levels of BoSPLs in seven organs/tissues (callus, root, stem, leaf, bud, flower and silique) by using the RNA-Seq dataset (GSE42891). These expression profiles of BoSPLs are presented using a heatmap (Figure 6; Supplementary Table S7). Only BoSPL5b showed organs/tissues-specific expression, which expressed only in the bud. Three BoSPLs (BoSPL5a, BoSPL5b, BoSPL8a) were not detected in the callus, five BoSPLs (BoSPL4a, BoSPL4b, BoSPL5a, BoSPL5b, BoSPL13b) were not detected in the root, BoSPL5b and BoSPL13b were not detected in the stem, the remaining BoSPLs were expressed in all the tissues. A total of twenty-one BoSPLs were expressed in the seven organs/tissues. The diversity of this expression patterns indicates that BoSPLs have a wide range of biological functions during the growth and development of cabbage.
In addition, the expression patterns of BoSPLs in ‘CS-D9’ (chilling-sensitive cabbage) and ‘CT-923’ (chilling-tolerant cabbage) under 4 °C chilling stress were also analyzed (Figure 7; Supplementary Table S8; Supplementary Figure S2). A total of thirty-two BoSPL genes were detected in both ‘CS-D9’ and ‘CT-923’ under 6 h and 24 h chilling stress. In ‘CS-D9’, BoSPL9b and BoSPL15a were significantly up-regulated at 6 h, when compared with the mock-treated plants, and when chilling treated for 24 h, there were two BoSPLs (BoSPL9b and BoSPL16a) and three BoSPLs (BoSPL3a, BoSPL4b and BoSPL10a) significantly up- and down-regulated, respectively. In ‘CT-923’, compared with the mock-treated plants, two BoSPLs (BoSPL9b and BoSPL10b) and three BoSPLs (BoSPL2b, BoSPL3a and BoSPL4b) were significantly up- and down-regulated at 6 h, respectively, while five BoSPLs (BoSPL1, -9a, -9b, -10b, -11b) and two BoSPLs (BoSPL3a and BoSPL4b) were significantly up- and down-regulated at 24 h, respectively.

4. Discussion

The SPL gene family is a plant-specific transcriptional regulator that has important regulatory functions in plant growth and development. There is no homology in humans, animals and bacteria [35]. With the completion of the genome sequencing of more and more plants, the SPL gene family has been identified and studied in many plants, including A. thaliana, B. rapa [10], Betula platyphylla Suk. [22], Phaseolus vulgaris [36] and Castanea mollissima [37]. Almost all the members of the family were found to be related to plant growth, morphological variation [38] and stress response [39,40,41]. B. oleracea var. capitata is an important cruciferous crop, and no systematic identification of the SPL gene family in B. oleracea was found. Therefore, it is significant to identify the SPL gene family in B. oleracea and its expression analysis under chilling stress.
In this study, a total of 33 SPL genes were identified in the B. oleracea genome, while there were 29 BrSPLs and 17 AtSPLs in B. rapa and A. thaliana, respectively. The difference in the number of BoSPL, BrSPL and AtSPL genes may be due to the Brassica-specific WGT and fractionation events [27]. Gene duplication leads to the functional differentiation and diversification of genes, which is thought to be the primary driver of evolution [42,43]. Studies have shown that the SPL gene family moves toward to an increasingly conservative direction after the encoding of the SPL domain has experienced replication events, forming and retaining multiple SPLs homologous branches [44,45], and multiple gene duplications occurred during evolutions [46]. Accompanied by genome triplication, we found ten BoSPLs had two separate orthologous genes, and two BoSPLs had three separate orthologous genes. In addition, we found evidence of BoSPL gene fractionation in B. oleracea after the split with A. thaliana from the recent common ancestor, with BoSPL12 being lost. These results indicated that the functional redundancy in BoSPL genes may lead to the loss of some gene copy. The SPL genes in B. oleracea are closely related to the similarity and conservation of A. thaliana. According to the structural similarity of the SPL gene family, it could be divided into six subgroups (Figure 1). The number of each subgroup in B. oleracea, B. rapa and A. thaliana was various; these showed that in different branches of subgroup, their retention of duplicates was different.
The functional diversities of SPL genes during plant growth and development may be related to the varieties of their protein motifs. The motifs of BoSPL proteins in B. oleracea were similar in the same subgroup, and the differences between the different subgroups were relatively large. BoSPL proteins contained motif one and motif two (Figure 3), except for BoSPL7b, BoSPL18 and BoSPL19, they only contain motif one or motif two. Some motifs only appear in specific subgroups, motif nine only in Group VI. The specific motifs may have unique functions, which indicates that many BoSPL proteins may experience functional differentiation, resulting in differences in different subgroups [47]. The exon/intron structure map of B. oleracea shows that the introns ranged from two to thirteen, while the number of introns in pepper was zero to eleven [48], and in moso bomboo was zero to ten [35]. While the number of introns in the same subgroup was similar, the structural variation could provide information for the further research. The cis-acting elements of the promoter region are closely related to the specific expression of genes and the stress response. We found a number of regulatory elements involved in hormone response, light response and stress response in the BoSPLs promoter regions of B. oleracea. The cis-acting elements of BoSPLs promoter regions differed significantly in the same subgroup, suggesting that the divergences in BoSPLs’ function may be present in the promoter region and coding regions [47].
The SPL genes have essential roles in the regulation of plant growth and flowering, and exhibit species specificity. OsSPL8 regulates the development of auricles unique to Gramineae [49], while it regulates male flower differentiation in Juglandaceae [45,50]. In this study, BoSPL5b showed organs/tissues-specific expression, which expressed only in the bud. It has been reported that AtSPL14 has significant roles in plant architecture in Arabidopsis [51], while BoSPL14 has high expression in the callus, root, stem, leaf, bud, flower and silique (Figure 6), which indicated that BoSPL14 may also be involved in plant architecture. AtSPL9 and AtSPL15 have been reported to play redundant roles in reproductive transition and vegetative phase change [52]. In our study, BoSPL9 and BoSPL15 had two separate orthologous genes, BoSPL9b, BoSPL15a and BoSPL15b that had low expression in the flower and silique (Figure 6). Homology analysis is a relatively fast and effective way to understand the structure, function and evolution of unknown genes. We speculate that the homologous genes might have similar effects in B. oleracea through the function of A. thaliana, but the functions of these genes need further experimental verification.
Most of the SPL gene family had high expression levels at all stages of development [33]. In A. thaliana, AtSPLs were expressed in the roots, stems, leaves and floral organs (sepals, petals, carpels and stamens) [9]. Most of the OsSPLs were specifically expressed in young panicles in rice [8]. In B. rapa, more than half of the BrSPLs were expressed in the flowers more abundantly than in any other tissues [10], while in B. oleracea, the expression of only six BoSPLs (19.4%) was highest in the flower. It has been shown that SPL genes are involved in abiotic in several plants [53]. We found that BoSPL9b was up-regulated in both ‘CS-D9’ and CT-923 by chilling stress for 6 h and 24 h (Figure 7). In A. thaliana, sugar (such as glucose) was through inhibiting the expression abundance of miRNA156, to promote the transition of juvenile to adult stage; the expression of SPLs was then increased [48,54]. Whether the increase in BoSPL9b expression involved the chilling resistance of B. oleracea remains to be determined.

5. Conclusions

In this study, 33 BoSPLs were identified in the B. oleracea genome, according to the phylogenetic tree constructed with B. rapa and A. thaliana, they were further divided into six subgroups. After the WGT and fractionation, ten BoSPLs retained double copies. The BoSPLs in one group have similar gene structure and protein motifs, which implies a potential similarity in the plant’s biological functions. The expression patterns of seven organs/tissues showed that a large number of BoSPLs expressed in these organs/tissues. The RNA-Seq data analysis of chilling treatment indicated that the expression of BoSPL9b was up-regulated in ‘CT-923’ and ‘CS-D9’ at 6 h and 24 h chilling stress compared with the mock. The cis-acting elements analysis showed that BoSPL9b contained LTR in the upstream regions. Overall, this information will be important entry points for revealing potential candidate BoSPLs to participate in the response of cabbage to chilling stress.

Supplementary Materials

The following are available online at https://www.mdpi.com/article/10.3390/agronomy11071445/s1, Table S1. The genomic sequences of the 33 SPL genes of B. oleracea; Table S2. The coding sequences of the 33 SPL genes of B. oleracea; Table S3. Amino acid sequences of 79 SPL proteins from B. oleracea, B. rapa and A. thaliana; Table S4. The characteristics of the 33 SPLs of B. oleracea; Table S5. Different motifs commonly observed in BoSPL proteins; Table S6. Known hormone-responsive, light-responsive and stress-responsive cis-acting elements in the promoter regions of BoSPL genes; Table S7. Expression of BoSPL genes in different organs/tissues of bud, callus, flower, leaf, root, silique and stem in B. oleracea; Table S8. Expression of BoSPL genes in leaves of chilling-sensitive (‘CS-D9’) and -tolerance (‘CT-923’) cabbage lines at chilling treat; Figure S1. Sequence logos of BoSPL proteins domains; Figure S2. Expression patterns of the thirty-two BoSPL genes under chilling stress.

Author Contributions

Z.D. conceived and supervised the work. X.S. and W.Z. performed the bioinformatics analysis and drafted the manuscript. F.Y., J.H., W.Q., J.L. and S.W. provided guidance and manuscript reviews. All authors have read and agreed to the published version of the manuscript.

Funding

This work was in part supported by the National Natural Science Foundation of China (31902009), the Zhenjiang Science and Technology Project (NY2020001), Key Research and Development Program of Jiangsu Province (BE2020403, BE2019422), Agricultural Project of Jiangsu Province (2019-SJ-015, 2020-SJ-012).

Institutional Review Board Statement

Not applicable.

Informed Consent Statement

Not applicable.

Data Availability Statement

Not applicable.

Conflicts of Interest

The authors declare no conflict of interests.

References

  1. Chen, X.; Zhang, Z.; Liu, D.; Kai, Z.; Li, A.; Long, M. SQUAMOSA promoter-binding protein-like transcription factors: Star players for plant growth and development. J. Integr. Plant Biol. 2010, 52, 946–951. [Google Scholar] [CrossRef] [PubMed]
  2. Gou, J.; Fu, C.; Liu, S.; Tang, C.; Debnath, S.; Flanagan, A.; Ge, Y.; Tang, Y.; Jiang, Q.; Larson, P.; et al. The miR156-SPL4 module predominantly regulates aerial axillary bud formation and controls shoot architecture. New Phytol. 2017, 216, 829–840. [Google Scholar] [CrossRef] [PubMed] [Green Version]
  3. Gou, J.; Felippes, F.; Liu, C.; Weigel, D.; Wang, J. Negative regulation of anthocyanin biosynthesis in Arabidopsis by a miR156-targeted SPL transcription factor. Plant Cell 2011, 23, 1512–1522. [Google Scholar] [CrossRef] [PubMed] [Green Version]
  4. Yu, S.; Galvão, V.; Zhang, Y.; Horrer, D.; Zhang, T.; Hao, Y. Gibberellin regulates the Arabidopsis floral transition through miR156-targeted SQUAMOSA promoter binding-like transcription factors. Plant Cell 2012, 24, 3320–3332. [Google Scholar] [CrossRef] [Green Version]
  5. Cui, L.; Shan, J.; Shi, M.; Gao, J.; Lin, H. The miR156-SPL9-DFR pathway coordinates the relationship between development and abiotic stress tolerance in plants. Plant J. 2014, 80, 1108–1117. [Google Scholar] [CrossRef]
  6. Klein, J.; Saedler, H.; Huijser, P. A new family of DNA binding proteins includes putative transcriptional regulators of the Antirrhinum majus floral meristem identity gene SQUAMOSA. Mol. Gen. Genet. 1996, 250, 7–16. [Google Scholar]
  7. Cardon, G.; Höhmann, S.; Klein, J.; Nettesheim, K.; Saedler, H.; Huijser, P. Molecular characterisation of the Arabidopsis SBP-box genes. Gene 1999, 237, 91–104. [Google Scholar] [CrossRef]
  8. Xie, K.; Wu, C.; Xiong, L. Genomic organization, differential expression, and interaction of SQUAMOSA promoter-binding like transcription factors and microRNA156 in rice. Plant Physiol. 2006, 142, 280–293. [Google Scholar] [CrossRef] [Green Version]
  9. Yang, Z.; Wang, X.; Gu, S.; Hu, Z.; Xu, H.; Xu, C. Comparative study of SBP-box gene family in Arabidopsis and rice. Gene 2008, 407, 1–11. [Google Scholar] [CrossRef]
  10. Tan, H.; Song, X.; Duan, W.; Wang, Y.; Hou, X. Genome-wide analysis of the SBP-box gene family in Chinese cabbage (Brassica rapa ssp. pekinensis). Genome 2015, 58, 463–477. [Google Scholar] [CrossRef]
  11. Salinas, M.; Xing, S.; Höhmann, S.; Berndtgen, R.; Huijser, P. Genomic organization, phylogenetic comparison and differential expression of the SBP-box family of transcription factors in tomato. Planta 2012, 235, 1171–1184. [Google Scholar] [CrossRef]
  12. Yamasaki, K.; Kigawa, T.; Inoue, M.; Tateno, M.; Yamasaki, T.; Yabuki, T.; Aoki, M.; Seki, E.; Matsuda, T.; Nunokawa, E. A novel zinc-binding motif revealed by solution structures of DNA-binding domains of Arabidopsis SBP-family transcription factors. J. Mol. Biol. 2004, 337, 49–63. [Google Scholar] [CrossRef]
  13. Matthew, W.; Brenda, J.; Lee, P. Prediction of plant microRNA targets. Cell 2002, 110, 513–520. [Google Scholar]
  14. Jeyakumar, J.; Ali, A.; Wang, W.M.; Thiruvengadam, M. Characterizing the Role of the miR156-SPL Network in Plant Development and Stress Response. Plants 2020, 9, 1206. [Google Scholar] [CrossRef] [PubMed]
  15. Stief, A.; Altmann, S.; Hoffmann, K.; Pant, B.D.; Scheible, W.R.; Bäurle, I. Arabidopsis miR156 regulates tolerance to recurring environmental stress through SPL transcription factors. Plant Cell 2014, 26, 1792. [Google Scholar] [CrossRef] [PubMed] [Green Version]
  16. Gandikota, M.; Birkenbihl, R.; Höhmann, S.; Cardon, G.; Saedler, H.; Huijser, P. The miRNA156/157 recognition element in the 3′UTR of the Arabidopsis SBP box gene SPL3 prevents early flowering by translational inhibition in seedlings. Plant J. 2007, 49, 683–693. [Google Scholar] [CrossRef] [PubMed] [Green Version]
  17. Tripathi, R.; Goel, R.; Kumari, S.; Kumari, S.; Dahuja, A. Genomic organization, phylogenetic comparison, and expression profiles of the SPL family genes and their regulation in soybean. Dev. Genes Evol. 2017, 227, 101–119. [Google Scholar] [CrossRef]
  18. Shao, Y.; Zhou, H.; Wu, Y.; Zhang, H.; Lin, J.; Jiang, X.; He, Q.; Zhu, J.; Li, Y.; Yu, H.; et al. OsSPL3, a SBP-domain protein, regulates crown root development in rice. Plant Cell 2019, 31, 1257–1275. [Google Scholar] [CrossRef] [Green Version]
  19. Cao, R.; Guo, L.; Ma, M.; Zhang, W.; Liu, X.; Zhao, H. Identification and Functional characterization of squamosa promoter bindingprotein-like Gene TaSPL16 in Wheat (Triticum aestivum L.). Front. Plant Sci. 2019, 10, 212. [Google Scholar] [CrossRef]
  20. Chao, L.; Liu, Y.; Chen, D. Arabidopsis transcription factors SPL1 and SPL12 confer plant thermotolerance at reproductive stage. Mol. Plant 2017, 10, 735–748. [Google Scholar] [CrossRef]
  21. Hou, H.; Li, J.; Gao, M. Genomic organization, phylogenetic comparison and differential expression of the SBP-box family genes in grape. PLoS ONE 2013, 8, e59358. [Google Scholar] [CrossRef]
  22. Ning, K.; Chen, S.; Huang, H. Molecular characterization and expression analysis of the SPL gene family with BpSPL9 transgenic lines found to confer tolerance to abiotic stress in Betula platyphylla Suk. Plant Cell Tiss. Organ Cult. 2017, 130, 469–481. [Google Scholar] [CrossRef]
  23. Thomashow, M.F. Plant cold acclimation: Freezing tolerance genes and regulatory mechanisms. Annu. Rev. Plant Biol. 1999, 50, 571–599. [Google Scholar] [CrossRef] [PubMed] [Green Version]
  24. Kim, J.J.; Lee, J.H.; Kim, W.; Jung, H.S.; Huijser, P.; Ahn, J.H. The microRNA156-squamosa promoter binding protein-like3 module regulates ambient temperature-responsive flowering via flowering locust in Arabidopsis. Plant Physiol. 2012, 159, 461–478. [Google Scholar] [CrossRef] [PubMed] [Green Version]
  25. Bergonzi, S.; Albani, M.C.; van Themaat, E.V.L.; Nordstrom, K.J.V.; Wang, R.H.; Schneeberger, K.; Coupland, G. Mechanisms of age-dependent response to winter temperature in perennial flowering of Arabis alpina. Science 2013, 340, 1094–1097. [Google Scholar] [CrossRef]
  26. Cai, X.; Wu, J.; Liang, J.; Lin, R.; Zhang, K.; Cheng, F.; Wang, X. Improved Brassica oleracea JZS assembly reveals significant changing of LTR-RT dynamics in different morphotypes. Theor. Appl. Genet. 2020, 133, 3187–3199. [Google Scholar] [CrossRef] [PubMed]
  27. Wang, X.; Wang, H.; Wang, J. The genome of the mesopolyploid crop species Brassica rapa. Nat. Genet. 2011, 43, 1035–1039. [Google Scholar] [CrossRef] [Green Version]
  28. Kumar, S.; Stecher, G.; Tamura, K. MEGA7: Molecular evolutionary genetics analysis version 7.0 for bigger datasets. Mol. Biol. Evol. 2016, 33, 1870–1874. [Google Scholar] [CrossRef] [PubMed] [Green Version]
  29. Cheng, F.; Wu, J.; Fang, L.; Wang, X. Syntenic gene analysis between Brassica rapa and other Brassicaceae species. Front. Plant Sci. 2012, 3, 198. [Google Scholar] [CrossRef] [PubMed] [Green Version]
  30. Chen, C.; Xia, R.; Chen, H.; He, Y. TBtools, a toolkit for biologists integrating various HTS-data handling tools with a user-friendly interface. BioRxiv 2018, 289660. [Google Scholar] [CrossRef]
  31. Lescot, M. PlantCARE, a database of plant cis-acting regulatory elements and a portal to tools for in silico analysis of promoter sequences. Nucleic Acids Res. 2002, 30, 325–327. [Google Scholar] [CrossRef]
  32. Saeed, A.; Bhagabati, N.; Braisted, J.; Wei, L.; Sharov, V.; Howe, E. TM4 microarray software suite. Methods Enzymol. 2006, 411, 134–193. [Google Scholar]
  33. Le, D.; Nishiyama, R.; Watanabe, Y.; Vankova, R.; Tanaka, M.; Seki, M. Identification and expression analysis of cytokinin metabolic genes in soybean under normal and drought conditions in relation to cytokinin levels. PLoS ONE 2012, 7, e42411. [Google Scholar] [CrossRef] [Green Version]
  34. Walther, D.; Brunnemann, R.; Selbig, J. The regulatory code for transcriptional response diversity and its relation to genome structural properties in A. thaliana. PLoS Genet. 2007, 3, e11. [Google Scholar] [CrossRef]
  35. Pan, F.; Wang, Y.; Liu, H.; Wu, M.; Chu, W.; Chen, D. Genome-wide identification and expression analysis of SBP-like transcription factor genes in Moso Bamboo (Phyllostachys edulis). BMC Genom. 2017, 18, 486. [Google Scholar] [CrossRef] [PubMed]
  36. Ilhan, E. Genome-wide characterization and analysis of SBP transcription factor family in common bean (Phaseolus vulgaris L.). Appl. Ecol. Environ. Res. 2018, 16, 5467–5480. [Google Scholar] [CrossRef]
  37. Chen, G.; Li, J.; Liu, Y.; Zhang, Q.; Gao, Y.; Fang, K.; Cao, Q.; Qin, L.; Xing, Y. Roles of the GA-mediated SPL Gene Family and miR156 in the floral development of Chinese Chestnut (Castanea mollissima). Int. J. Mol. Sci. 2019, 20, 1577. [Google Scholar] [CrossRef] [PubMed] [Green Version]
  38. Lu, Z.; Yu, H.; Xiong, G.; Wang, J.; Jiao, Y.; Liu, G.; Jing, Y.; Meng, X.; Hu, X.; Qian, Q.; et al. Genome wide binding analysis of the transcription activator IDEAL PLANT ARCHITECTURE1 reveals a complex network regulating rice plant architecture. Plant Cell 2013, 25, 3743–3759. [Google Scholar] [CrossRef] [Green Version]
  39. Wang, J.; Zhou, L.; Shi, H.; Chern, M.; Yu, H.; Yi, H.; He, M.; He, M.; Yin, J.; Zhu, X.; et al. A single transcription factor promotes both yield and immunity in rice. Science 2018, 361, 1026–1028. [Google Scholar] [CrossRef] [Green Version]
  40. Cai, C.; Guo, W.; Zhang, B. Genome-wide identification and characterization of SPL transcription factor family and their evolution and expression profiling analysis in cotton. Sci. Rep. 2018, 8, 762. [Google Scholar] [CrossRef] [PubMed]
  41. Tripathi, R.; Bregitzer, P.; Singh, J. Genome-wide analysis of the SPL/miR156 module and its interaction with the AP2/miR172 unit in barley. Sci. Rep. 2018, 8, 7085. [Google Scholar] [CrossRef]
  42. Lynch, M.; Conery, J. The evolutionary fate and consequences of duplicate genes. Science 2000, 290, 1151–1155. [Google Scholar] [CrossRef] [Green Version]
  43. Moore, R.; Purugganan, M. The early stages of duplicate gene evolution. Proc. Natl. Acad. Sci. USA 2003, 100, 15682–15687. [Google Scholar] [CrossRef] [Green Version]
  44. Preston, J.C.; Hileman, L.C. Functional evolution in the plant squamosa-promoter binding protein-like (spl) gene family. Front. Plant Sci. 2013, 4, 80. [Google Scholar] [CrossRef] [Green Version]
  45. Wu, D.; Luo, J.; Chen, J.; Zhang, L.S.; Lim, J.K.; Wang, Z.J. Selection pressure causes differentiation of the SPL gene family in the Juglandaceae. Mol. Genet. Genom. 2019, 294, 1037–1048. [Google Scholar] [CrossRef] [PubMed] [Green Version]
  46. Kaufmann, K.; Wellmer, F.; Muino, J.M.; Ferrier, T.; Wuest, S.; Kumar, V.; Serrano-Mislata, A.; Madueño, F.; Krajewski, P.; Meyerowitz, E.M.; et al. Orchestration of Floral Initiation by APETALA1. Science 2010, 328, 85–89. [Google Scholar] [CrossRef] [PubMed] [Green Version]
  47. Li, X.; Lin, E.; Huang, H.; Niu, M.; Tong, Z.; Zhang, J. Molecular characterization of SQUAMOSA PROMOTER BINDING PROTEIN-LIKE (SPL) gene family in Betula luminifera. Front. Plant Sci. 2018, 9, 608. [Google Scholar] [CrossRef] [Green Version]
  48. Zhang, H.; Jin, J.; He, Y.; Lu, B.; Li, D.; Chai, W. Genome-wide identification and analysis of the SBP-box family genes under Phytophthora capsici stress in pepper (Capsicum annuum L.). Front. Plant Sci. 2016, 7, 504. [Google Scholar] [CrossRef] [PubMed] [Green Version]
  49. Lee, J.; Park, J.J.; Kim, S.L.; Yim, J.; An, G. Mutations in the rice liguleless gene result in a complete loss of the auricle, ligule, and laminar joint. Plant Mol. Biol. 2007, 65, 487–499. [Google Scholar] [CrossRef]
  50. Xie, J. Study on the Florescence Biology of Carya Illinoinensis. Master’s Thesis, Nanjing Forestry University, Nanjing, China, 2013. [Google Scholar]
  51. Stone, J.M.; Liang, X.; Nekl, E.R.; Stiers, J.J. Arabidopsis AtSPL14, a plant-specific SBP-domain transcription factor, participates in plant development and sensitivity to fumonisin B1. Plant J. 2005, 41, 744–754. [Google Scholar] [CrossRef] [Green Version]
  52. Schwarz, S.; Grande, A.V.; Bujdoso, N.; Saedler, H.; Huijser, P. The microRNA regulated SBP-box genes SPL9 and SPL15 control shoot maturation in Arabidopsis. Plant Mol. Biol. 2008, 67, 183–195. [Google Scholar] [CrossRef] [PubMed] [Green Version]
  53. Hyun, Y.; Vincent, C.; Tilmes, V.; Bergonzi, S.; Kiefer, C.; Richter, R.; Rafael, M.; Edouard, S.; George, C. A regulatory circuit conferring varied flowering response to cold in annual and perennial plants. Science 2019, 363, 409–412. [Google Scholar] [CrossRef] [PubMed]
  54. Yu, S.; Lian, H.; Wang, J. Plant developmental transitions: The role of microRNAs and sugars. Curr. Opin. Plant Biol. 2015, 27, 1–7. [Google Scholar] [CrossRef] [PubMed]
Figure 1. Phylogenetic tree of B. oleracea, B. rapa and A. thaliana SPL proteins. Phylogenetic analysis of 79 SPL proteins from B. oleracea (33), B. rapa (29) and A. thaliana (17) showing similar groups in the three species. Six groups were marked with different background colors.
Agronomy 11 01445 g001
Figure 2. Distribution of BoSPL genes on nine B. oleracea chromosomes.
Agronomy 11 01445 g002
Figure 3. Syntenic relationship of SPL genes shown on chromosome maps among B. oleracea, B. rapa and A. thaliana.
Agronomy 11 01445 g003
Figure 4. Gene structures of BoSPL genes. The structures of BoSPL genes were plotted using yellow boxes representing exons, black lines representing introns. The scale on the bottom is in the unit of kilobase (Kb).
Agronomy 11 01445 g004
Figure 5. SPL proteins motifs. The motifs are shown as colored boxes. The scale on the bottom may be used to estimate the length of the motif (unit: amino acid).
Agronomy 11 01445 g005
Figure 6. Expression profiles of BoSPL genes. Heat map representation of BoSPL genes in various organs/tissues, included callus, roots, stems, leaves, buds, flowers and siliques. Expression levels of the BoSPL genes are shown as the log2 (FPKM+1), transformed FPKM values obtained from the RNA-Seq data.
Agronomy 11 01445 g006
Figure 7. Expression profiles of six BoSPL genes under chilling stress. * indicates that the p-value was less than 0.05. Expression patterns of the thirty-two BoSPL genes under chilling stress are in Supplementary Figure S2.
Agronomy 11 01445 g007
Table 1. SPL family genes in Brassica oleracea.
Gene NamePL (aa)MW (kD)pIInstability IndexAliphatic IndexGRAVYSubcellular Localization Prediction
BoSPL188898.895.8052.7678.52−0.44Nucleus
BoSPL2a42947.737.9957.4356.15−0.70Nucleus
BoSPL2b36140.558.8351.9559.97−0.72Nucleus
BoSPL3a14717.017.05105.6934.63−1.38Nucleus
BoSPL3b14116.486.25108.7031.21−1.52Nucleus
BoSPL3c13515.778.17111.8128.96−1.52Nucleus
BoSPL4a17920.429.5951.6549.55−1.19Nucleus
BoSPL4b18321.109.2673.7746.28−1.24Nucleus
BoSPL5a17920.719.4567.6750.17−1.17Nucleus
BoSPL5b17620.489.6052.3944.94−1.22Nucleus
BoSPL6a31836.038.3360.8657.04−0.81Nucleus
BoSPL6b35840.588.8460.6359.61−0.70Nucleus
BoSPL7a78187.386.7150.6478.35−0.41Nucleus
BoSPL7b73181.556.0051.8478.89−0.31Nucleus
BoSPL8a32836.548.8556.3748.17−0.81Nucleus
BoSPL8b33537.189.0155.7751.31−0.77Nucleus
BoSPL9a37040.398.6255.7945.84−0.86Nucleus
BoSPL9b36540.147.6760.3348.60−0.84Nucleus
BoSPL10a36640.718.8956.2250.82−0.82Nucleus
BoSPL10b36440.729.0148.6158.87−0.71Nucleus
BoSPL10c1610178.856.0459.1858.22−0.88Nucleus
BoSPL11a39444.448.5151.2561.85−0.67Nucleus
BoSPL11b38443.168.5049.4055.31−0.81Nucleus
BoSPL13b34838.287.6461.8952.41−0.67Nucleus
BoSPL141030113.988.7362.8174.03−0.50Nucleus
BoSPL15a32436.139.1455.2257.50−0.64Nucleus
BoSPL15b32536.479.1955.9957.63−0.72Nucleus
BoSPL16a1053116.618.5554.3977.30−0.38Nucleus
BoSPL16b989109.028.8055.5375.01−0.47Nucleus
BoSPL1734137.488.2974.1454.57−0.66Nucleus
BoSPL1874384.896.4751.7378.51−0.64Nucleus
BoSPL1918120.159.6746.1168.40−0.57Cytoplasm
BoSPL2035939.028.4574.2159.50−0.52Nucleus
Note: PL: Protein length; MW: Molecular weight; aa: amino acid; pI: Isoelectric point; GRAVY: Aliphatic index and grand average of hydropathicity; SPL: Squamosa promoter-binding protein-like.
Publisher’s Note: MDPI stays neutral with regard to jurisdictional claims in published maps and institutional affiliations.

