Article

Controlled Grazing of Maize Residues Increased Carbon Sequestration in No-Tillage System: A Case of a Smallholder Farm in South Africa

1
Department of Agroecology, Bayreuth Center of Ecology and Environmental Research (BayCEER), University of Bayreuth, 95440 Bayreuth, Germany
2
Environment, Natural Resources and Desertification Research Institute, Khartoum 11111, Sudan
3
School of Agricultural, Earth & Environmental Sciences, University of KwaZulu-Natal, Pietermaritzburg 3201, South Africa
4
Agricultural Research Council-Agricultural Engineering, Pretoria 0001, South Africa
5
African Plant Nutrition Institute UM6P Experimental Farm, Benguérir 41350, Morocco
6
Institut de Recherche pour le Développement (IRD), Laboratoire d’Océanographie et du Climat (LOCEAN), UMR 6159 CNRS/IRD/UPMC/MNHN, 75480 Paris, France
*
Author to whom correspondence should be addressed.
Agronomy 2021, 11(7), 1421; https://doi.org/10.3390/agronomy11071421
Submission received: 19 May 2021 / Revised: 7 July 2021 / Accepted: 12 July 2021 / Published: 15 July 2021
(This article belongs to the Section Farming Sustainability)

Abstract

:
Despite the positive impact of no-tillage (NT) on soil organic carbon (SOC), its potential to reduce soil CO2 emission still needs enhancing for climate change mitigation. Combining NT with controlled-grazing of crop residues is known to increase nutrient cycling; however, the impacts on soil CO2 effluxes require further exploration. This study compared soil CO2 effluxes and SOC stocks from conventional tillage with free grazing (CTFG), NT with free grazing (NTFG), NT without grazing (NTNG), NT without crop residues (NTNR) and NT with controlled-grazing (NTCG), in South Africa. Soil CO2 effluxes were measured 1512 times over two years using LI-COR 6400XT, once to thrice a month. Baseline SOCs data were compared against values obtained at the end of the trial. Overall, NTCG decreased soil CO2 fluxes by 55 and 29% compared to CTFG and NTNR, respectively. NTCG increased SOCs by 3.5-fold compared to NTFG, the other treatments resulted in SOC depletion. The increase in SOCs under NTCG was attributed to high C input and also low soil temperature, which reduce the SOC mineralization rate. Combining NT with postharvest controlled-grazing showed high potential to increase SOCs, which would help to mitigate climate change. However, it was associated with topsoil compaction. Therefore, long-term assessment under different environmental, crop, and soil conditions is still required.

1. Introduction

Increased greenhouse gases (GHGs) concentrations in the atmosphere have contributed to the dramatic increase in global surface temperature (by 0.8–1.5 °C) since the late nineteenth century [1]. Carbon dioxide (CO2) is one of the major GHGs in the atmosphere. The atmospheric CO2 accumulated to 545 ± 55 Pg C (1 Pg = 1015 g = 1 billion tonnes) over the years from 1870 to 2014 [2]. This quantity is in the same order of magnitude as the amount of carbon (C) in the biosphere (620 Pg C) and the atmosphere (720 Pg C). Two thirds of the atmospheric CO2 originated from the combustion of fossil fuels [2]. The rest is linked to agricultural malpractices such as deforestation, improper land use and land mismanagement, which lead to low soil C input from litter and high soil C losses, i.e., mineralization and soil erosion [3,4,5].
There is strong interest in reducing, or at least stabilizing, GHG emissions to the atmosphere to combat global warming, which was the main agenda of the December 2015 Conference of Parties (COP21) in Paris, France. At the COP21, an ambitious international program, “4 per 1000 initiative: Soil for Food Security and Climate” was launched. The initiative aimed to increase global soil organic C (SOC) by 0.4% per year in the top 40 cm layer to compensate for global GHGs emissions induced anthropogenically (http://4p1000.org). To achieve a 0.4% increase per year, a 30 to 40% increase in C inputs to soil is required for 30 years, i.e., in SOC-unsaturated croplands soil, France [6]. However, increasing SOC stocks need an optimum balance between C inputs, i.e., C translocation by plants, residues, manure and C outputs, i.e., harvests, SOC mineralization and leaching, which is challenging and requires a drastic change in the management practices [7,8,9].
Soil management practices such as no-tillage (NT), mulching with crop residues, fertilizer application and crop rotations have shown potential to sequester organic C into soils over the long term [10,11,12]. While there is a consensus on NT benefits for soil C sequestration [13,14,15], some studies have reported limited benefits [16,17,18], others reported no effect [19,20] or even a negative effect [21,22]. As a result of the existing discrepancies, several recent studies [14,23] sought to promote both conservation and climate-smart agriculture as a comprehensive management practice that delivers adaptation, mitigation and productivity instead of NT only [24,25]. For example, combining NT, residue retention and crop rotation to increase soil infiltration rate, reduce soil erosion and maintain a favorable environment for soil macrofauna for residue incorporation [26,27]. For example, in a global meta-analysis, [13] reported 23% reduction in soil CO2 effluxes under NT with crop residue mulching than NT without crop residue retention. Additionally, organic manure, i.e., manure and liquid fertilizer, are commonly used to increase NT potential for C sequestration [23,28,29]. However, smallholder farmers usually hesitate to adopt conservation agriculture that requires complete crop residues retention because of the need for the residue as livestock feed [30].
Integrating postharvest crop residues free grazing with NT provides low-cost fodder for livestock, diversifying agricultural systems, and organic inputs by animal excreta enhancing soil C sequestration. However, postharvest grazing is found to contribute positively to SOC, but also increases topsoil (0–0.05 m depth) compaction [31]. Time-controlled postharvest grazing, i.e., 14 days grazing followed by 101 days resting time, increased SOC and ground litter accumulation with no effect on soil compaction in southeast Queensland Australia [32]. Such a result was explained by the long resting period following the high stocking rate grazing for a few days, allowing the soil to recover from hoof damage and enabling litter incorporation and SOC accumulation. Integrating postharvest controlled grazing with NT to increase C input to soils has intensively been studied. Yet, little has been carried out in terms of investigating the C outputs as soil CO2 emissions, with particular focus on the underlying mechanisms by which this combination can alter soil C sequestration need a further appraisal. Hence, a high-density stocking rate for short-duration previously showed a great potential to rehabilitate degraded grassland by replenishing SOC by 7.4% year−1 and increasing aboveground grass biomass by a maximum of 900% in the study area [33]. The current study hypothesized that controlled crop residue grazing (i.e., high stocking rate for few days per year) maximizes C input into the NT soil (i.e., through animal excreta and ground litter) and minimizing the C outputs by mineralization of native SOC (and erosion) leading to greater net C accumulation than the conventional residue managements. Therefore, the main objective of the study was to evaluate soil CO2 effluxes and topsoil SOCs under NT associated with different crop residue management practices in smallholder farmers in KwaZulu-Natal province, South Africa.

2. Materials and Methods

2.1. Study Site

The study site was located in Potshini community (long: 29°21′; lat: −28°81′, 1305 m a.s.l.), 10 km south of Bergville town, Kwazulu-Natal, South Africa. Based on the Köppen classification system, the climate of the area was sub-tropical humid characterized by hot and wet seasons, representing summers and autumns (October to April), and cold and dry seasons, representing winters and springs (May to September). The mean annual temperature and precipitation of the area were 13 °C and 684 mm, respectively [34]. The upslope area of Potshini, characterized by shallow soils, was used for livestock grazing, whereas the downslope area, with deep soils (>1.5 m) on 0–10% slopes, was used for rain-fed crop production, mainly maize production [35].
Maize (Zea mays) was the main crop planted in early January every year on lands tilled with plows. Planting, weeding and harvesting were carried out manually. Little to no fertilizer was applied due to a lack of required funds to purchase the fertilizers. The parent materials were mainly sandstone and mudstone, while the soils were classified as acidic Acrisols [36]. The soil is deep (>1.2 m), acidic (pH 4.5–5.2), has a low cation exchange capacity (2–4 cmol+ kg−1), and SOC content of 9–12 g C kg−1 [37]. The A-horizon was approximately 0.35 m deep, with a sandy-loam texture (55–68% sand and 17–19% clay content, respectively) and fine granular structure [35,37]. Arable land is a limited resource in the area due to a combination of high population and demand for land, and shallow soils and steep slopes (e.g., the hillslopes had gradients exceeding 50%). The farmland where the experiment is conducted was cultivated and managed traditionally, i.e., conventional ox-drawn plow-tilled, rain-fed monoculture maize production and allowing postharvest free grazing of the crop residues, for a long time before the trial was set up in 2011.

2.2. Experimental Design and Treatments

The experiment was performed on an area of 450 m2 given by the community, with homogeneous soil which was utilized before by Mchunu et al. [37] and Chaplot et al. [26] to study the impact of NT on soil and C losses by water erosion. This area was divided into five plots of 90-m2 size each and each plot was divided into three subplots (30-m2 each). Each plot was subjected to specific tillage and crop residue management; namely (i) NTCG; no-tillage with controlled grazing, (ii) NTFG; no-tillage with free grazing, (iii) NTNG; no-tillage with no grazing (approx. 100% crop residue mulching), (iv) NTNR; no-tillage without crop residues mulching, and (v) CTFG; conventional tillage with free grazing were applied. No-tillage (NT) practice was a manual operation performed using a wooden wedge to open narrow slots of sufficient width and depth (approx. 0.05 m × 0.05 m) to guarantee proper maize seed cover with minimum soil disturbance. Controlled grazing at a stocking rate equivalent to 1200 heads of cattle per hectare was practiced for three consecutive days per year in NTCG. The NTFG plot was open to free livestock grazing after grain harvest every year. The other NT plots were fenced to control grazing. There was no grazing in NTNG (i.e., approximately 100% crop residue retention). Crop residues were removed from NTNR (0% crop residue retention). CTFG was the traditional practice where soil was tilled using an ox-drawn plow, and cattle were allowed to graze the crop residues freely immediately after harvesting, mimicking the commonly used practice in the area. In all cases, the plant spacing adopted approximated 1.0 m between rows and 0.3 m within the rows. Three 1-m2 quadrants adopted in each subplot (nine per treatment) served as pseudoreplication for measurements of soil CO2 emissions, soil properties and aboveground biomass production.

2.3. Soil CO2 Efflux Measurement

Soil CO2 effluxes were measured from January 2013 to May 2015, once a month in the dry season and twice a month in the wet season, except for the tilling month, where the CO2 effluxes were measured three to four times per month. Three polyvinyl chloride (PVC) collars with 0.05 m height and 0.12 m diameter were inserted 0.03 m into the soil in each 1-m2 quadrant (nine per treatment). The collars were inserted between the plant rows during the first week of January 2013. The collars were kept in their positions during the trial period and were only moved in CTFG to allow tillage and in NTCG to avoid damage during high-density livestock stocking in the controlled grazing system. Any plants in the collars were picked by hand. The LI-COR 6400XT gas exchange system (LI-COR, Lincoln, NE, USA) attached with a LI-COR 6400-09 soil respiration chamber was used to measure CO2 effluxes from the soil. The chamber covered a soil surface area of 71.6 cm2 and had an internal volume of 991 cm3. It was inserted into the PVC collars during soil CO2 efflux measurements. First measurements were carried out one week after inserting the collars into soils to eliminate the effects of soil disturbance [38]. Measurements were carried out between 10.00 and 13.00 h to limit the effects of diurnal temperature variations [39,40].

2.4. Soil Temperature and Water Content

Soil temperature was measured using a thermocouple connected to the LI-COR chamber (LI-COR 6400-09). The thermocouple was 0.15 m long; however, it was inserted only 0.05 m into the soil close to CO2 measurement points within the 1-m2 quadrants to measure topsoil temperature. The soil temperature was measured at the same time as the CO2 measurements. Nine soil temperature measurements were also made per treatment, which was similar to soil CO2 measurements. Soil water content measurements were also performed close to the collars using a portable Hydrosense soil moisture meter (Campbell Scientific, Inc., Logan, UT, USA). Due to shipping delays and malfunctioning of the probe, soil water content data collection only covered the period from December 2014 to April 2015. The Hydrosense was calibrated by noting the meter responses on saturated soils in the study area. Precipitation and air temperature data were obtained from a Duncan weather station located at the same altitude, about 500 m from the trial site.

2.5. Soil Sampling and Analysis

Soil samples were collected using a metallic cylinder with a size of 0.075 m diameter and 0.05 m height. The soil samples were collected from the topsoil (0–0.05 m) layer in all treatments for evaluation of SOC content (SOCc) and soil N content (Nc). The results were compared against soil analysis results from 2012 when the experiment began. Three soil sampling positions from around the PVC collars were used per subplot in each treatment. The soil samples were air-dried for 48 h, sieved through 2 mm sieves and ground for chemical analysis. Total C and N were measured using LECO CNS-2000 Dumas dry matter combustion analyzer (LECO Corp., St. Joseph, MI, USA). The total soil C was considered equivalent to SOC content when no more reaction with HCl was obtained. SOC and N stocks (SOCs and Ns) were calculated following [41]:
SOCs or Ns = SOCc or Nc × ρb × t (1 − (pf/100))
where SOCs or Ns was the soil organic C stock (kg C m−2) or nitrogen stocks (kg N m−2); SOCc or Nc are the soil organic C content or nitrogen content in ≤2 mm soil material (g C kg−1 soil); ρb was the bulk density of the soil (kg m−3); t the thickness of the soil layer (m); pf the proportion (%) of fragments >2 mm; and b a constant equal to 0.001.
Soil bulk density (ρb) was determined from undisturbed soil samples collected using the metallic cylinders (0.075 m diameter and 0.05 m height). The samples were also collected from around the PVC collars resulting in nine undisturbed soil samples per treatment. The soils were stored and transported in airtight plastic bags. The samples were dried in an oven until a constant weight was attained. The soil ρb was determined using the ratio of water content corrected mass to volume of the soil following [42]:
ρ b = ( odw r f cw ) / ( c v ( r f / dr ) )
where ρb was the bulk density of <2 mm soil material (g cm−3); odw the oven-dry weight (g); rf the weight of rock fragments (g); cw the empty core weight (g); cv the core volume (cm−3); and dr the density of the rocks fragments (g cm−3).

2.6. Penetration Resistance

Penetration resistance, a proxy for soil compaction of the topsoil (0–0.05 m) layer, was measured using a cone penetrometer [43]. Fifteen random measurements were taken in each demarcated 1-m2 subplot, resulting in 45 points for each treatment. The penetration resistance was measure in 2014 and 2015 at the beginning of the seasons before any grazing and/or tillage occurred.

2.7. Dry Maize Biomass

Maize plants (grain and vegetative biomass) were entirely harvested from the demarcated 1-m2 quadrats (approx. 8 plants per m2) in each subplot. The fresh harvest was weighed in the field, and subsamples representing the whole plants were taken to the laboratory and dried in an oven at 60 °C until constant weight was achieved. The moisture content of the subsamples was used in the calculations of total aboveground dry biomass for each treatment. All the plant materials, except for NTNR, were returned to the respective plots to ensure the best application of the treatments.

2.8. Data Analysis

While the Pseudoreplication design is not ideal for most ecological trials, using such an approach is justified considering the values of this experiment, i.e., natural landscape for local community demonstration, in a region scarcely studied in this sense so far, and potential statistical solutions [44,45]. Hence, restricted maximum likelihood mixed (RMEL) was used in the current study, where the treatments were considered fixed effects while the subplots (pseudo-replicates) were the random effects. Therefore, a repeated- analysis of variance (repeated-ANOVA) was used to test the effects of treatments, time of sampling on the soil CO2 flux, soil temperature and soil water content. The effect of seasons and treatments on soil CO2 effluxes were analyzed using RMEL repeated-measures because the measurements were repeated at the exact locations over time. Likewise, soil temperature and soil water content were analyzed using RMEL repeated analysis. This analysis used the time series covariance in the repeated analysis model, where the correlation decreased with time.
Soil properties data (SOCs, SOCc, Nc, Ns, ρb and penetration resistance), average CO2 flux (overall average, wet, and dry seasons and aboveground biomass production were analyzed using a linear mixed model, where the treatments were considered as fixed effects and the sub-plot as the random effects. The treatment means of all the parameters were compared using Tukey test for multiple comparisons, at p < 0.05, unless otherwise specified. The means variation was documented using standard error. The principal component analysis was used to evaluate the multiple relationships between soil CO2 efflux and the factors of control. All the statistical analysis were conducted using Genstat (version 14, VSN International, Hemel Hempstead, UK, 2011), and the figures were generated using Sigma Plot software (version 10.0, Systat Software Inc., San Jose, CA, USA).

3. Results

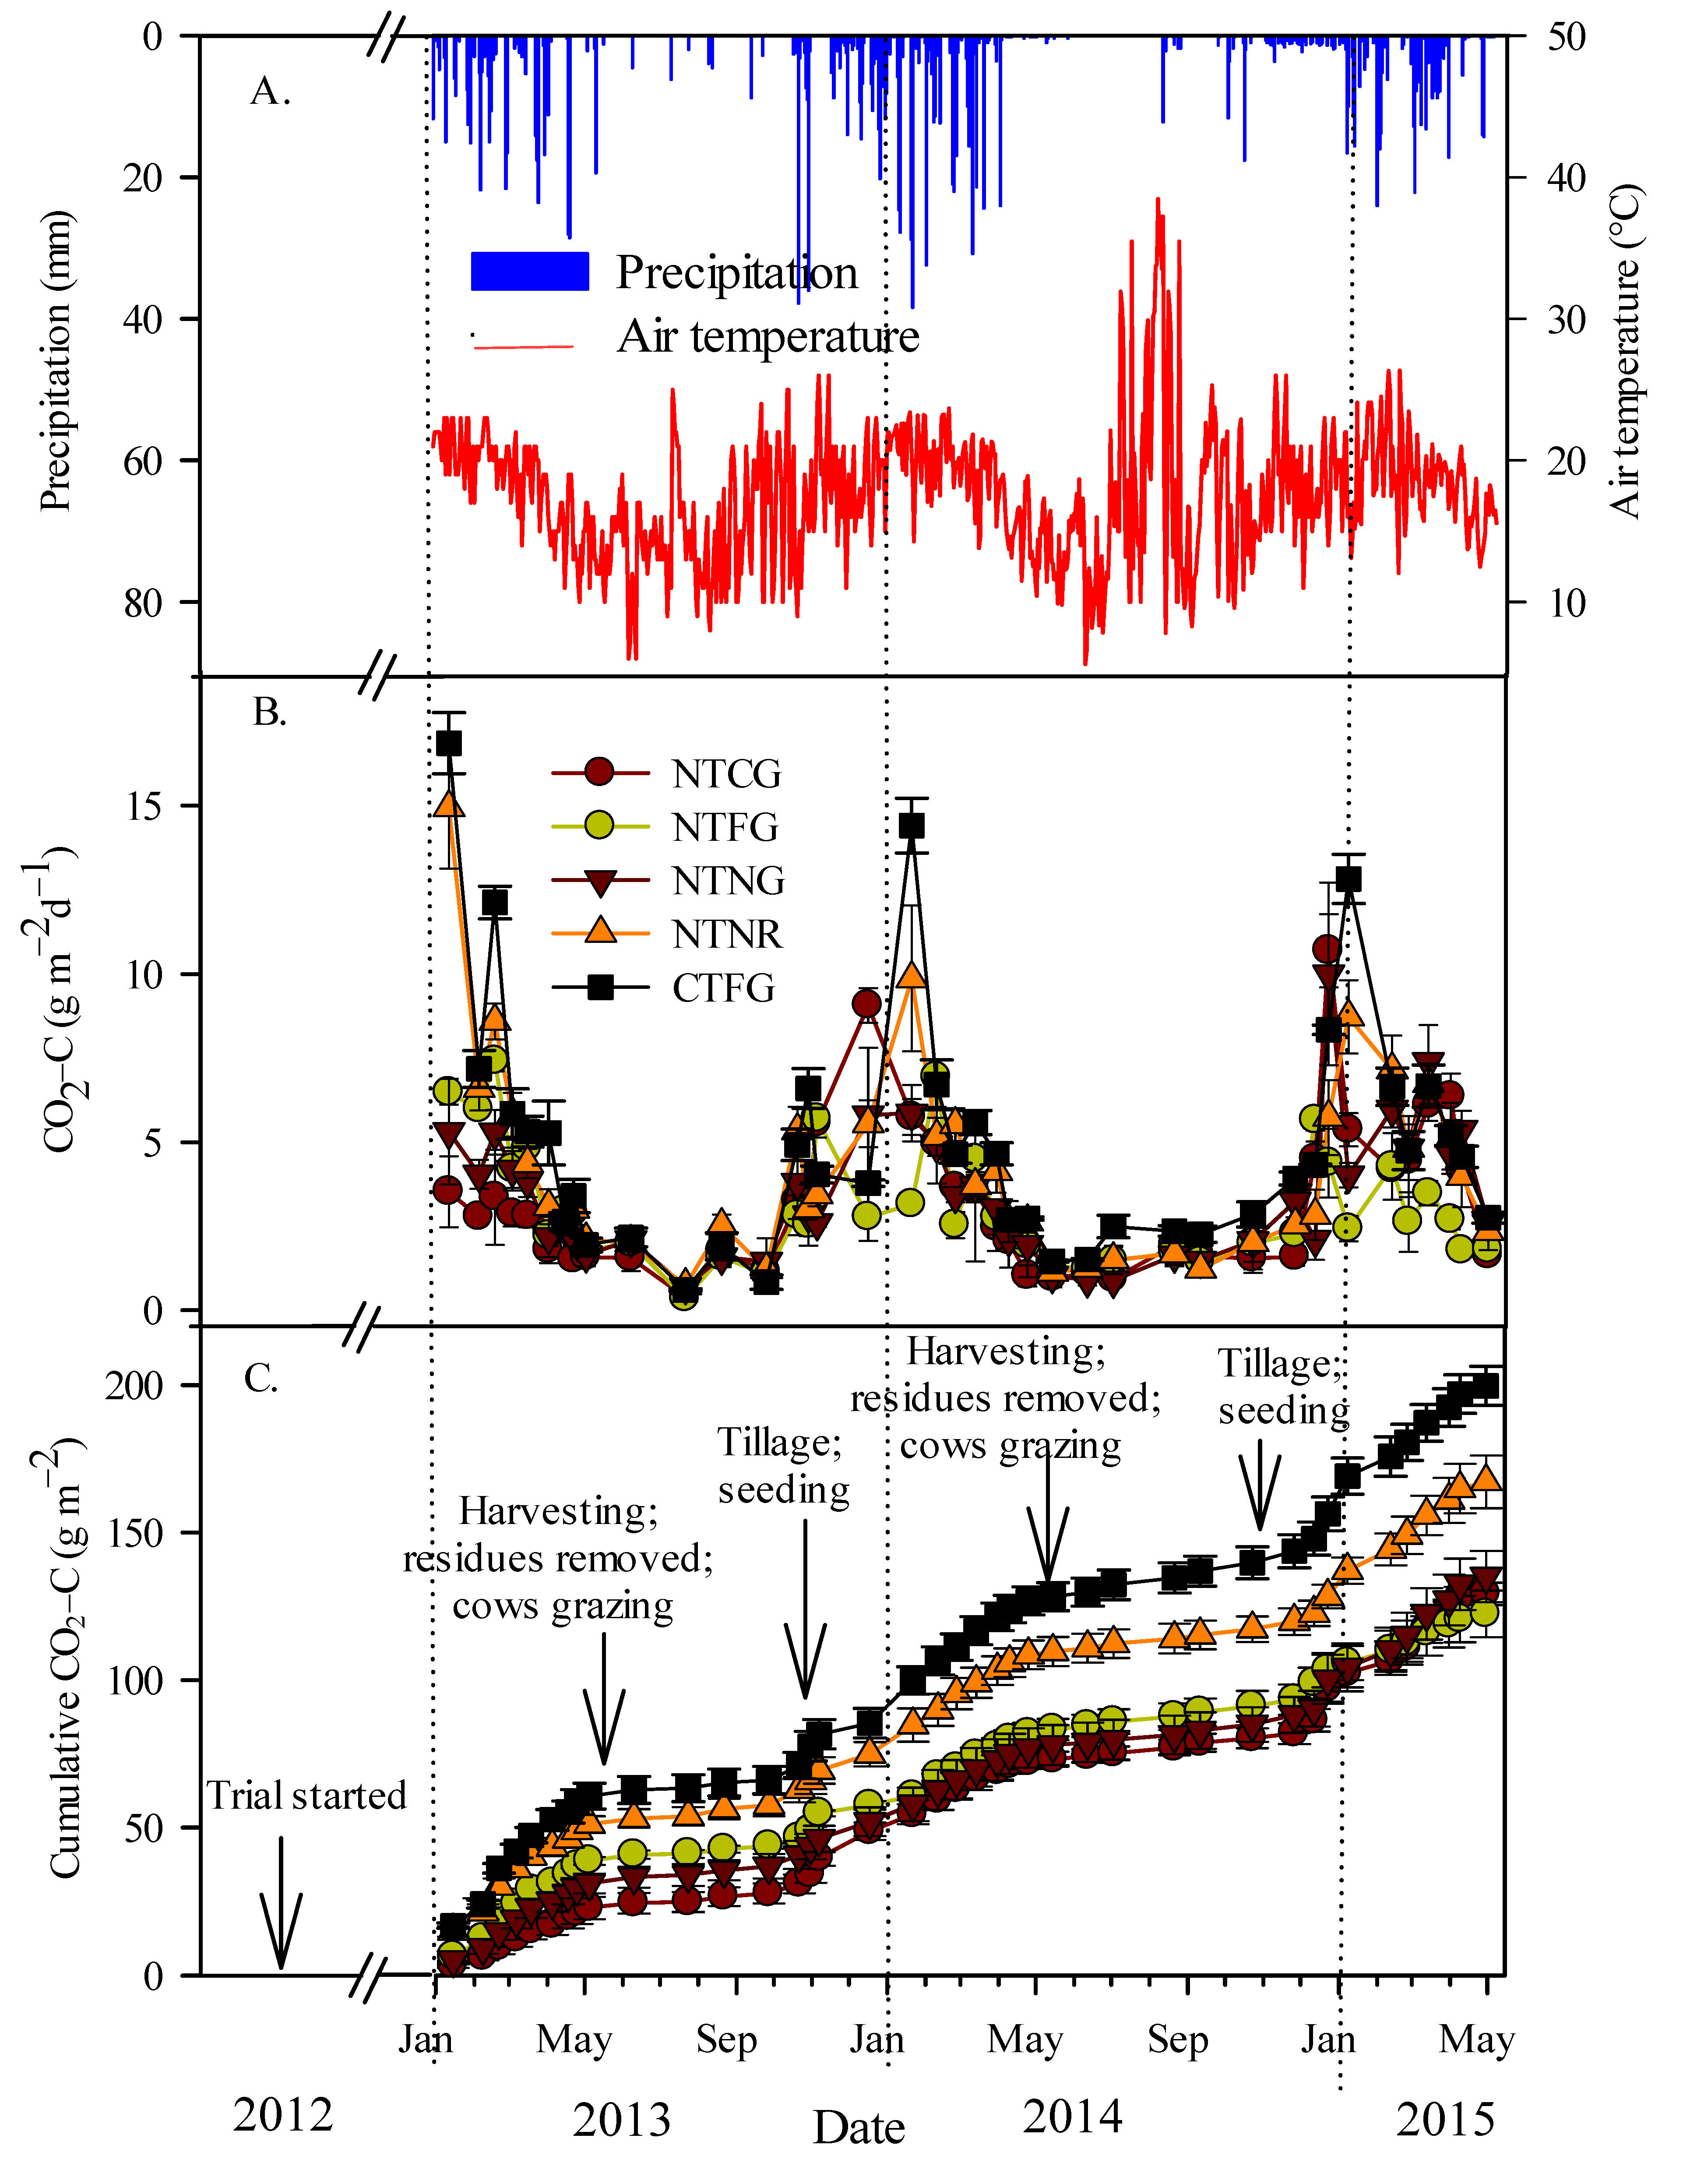
3.1. Precipitation and Air Temperature

The total annual precipitation was 718 and 562 mm in 2013 and 2014, respectively, with 90% of the rainfall in each year occurring in the hot and wet period (i.e., from November to April) (Figure 1A). The average annual air temperature was 17 and 18 °C in 2013 and 2014, respectively. The highest daily average air temperature of 38 °C was recorded in September 2014 and the lowest of 13 °C in June in both 2013 and 2014. The daily average air temperature of 33 °C for July–September 2014 was much higher than the same period in 2013.

3.2. Temporal and Special Variations in Soil CO2 Efflux

The results of repeated-ANOVA showed that treatments, date of CO2 measurement and their interactions had significant (p < 0.001) effects on soil CO2 emissions from the treatments (Table 1). Likewise, soil temperature and soil water content were also significantly affected by the treatments, sampling date, and their interaction.
The overall average of CO2-C flux was significantly greater in conventional tillage with free grazing (CTFG) than all other NT treatments (Table 2). Compared to CTFG, no-tillage with controlled grazing (NTCG) reduced soil CO2-C by 55% (3.2 ± 0.4 vs. 5.1 ± 0.6 g m−2 d−1). Furthermore, CTFG also emitted significantly greater soil CO2-C by 21, 49 and 65% than no-tillage without crop residues mulching (NTNR), no-tillage with no grazing (NTNG) and no-tillage with free grazing (NTFG), respectively. The soil CO2-C effluxes differed amongst the treatments during the wet seasons (October to April) but were not significantly different during the dry seasons (May to September). For example, they showed up to 36% lower CO2-C in NTCG than CTFG during the wet seasons.
Soil CO2-C effluxes under the treatments changed markedly over time but were always much higher in CTFG, followed by NTNR, than other treatments during the first month (January) after soil tillage (Figure 1B). Furthermore, the variations amongst the treatments mostly occurred in the hot and wet periods. However, CTFG showed much higher cumulative CO2-C values than NTNR in the period after April 2014 (Figure 1C). The final cumulative soil CO2-C effluxes were 36 and 23% higher in CTFG and NTNR, respectively, than the average of the other treatments, which were significant at p < 0.05.

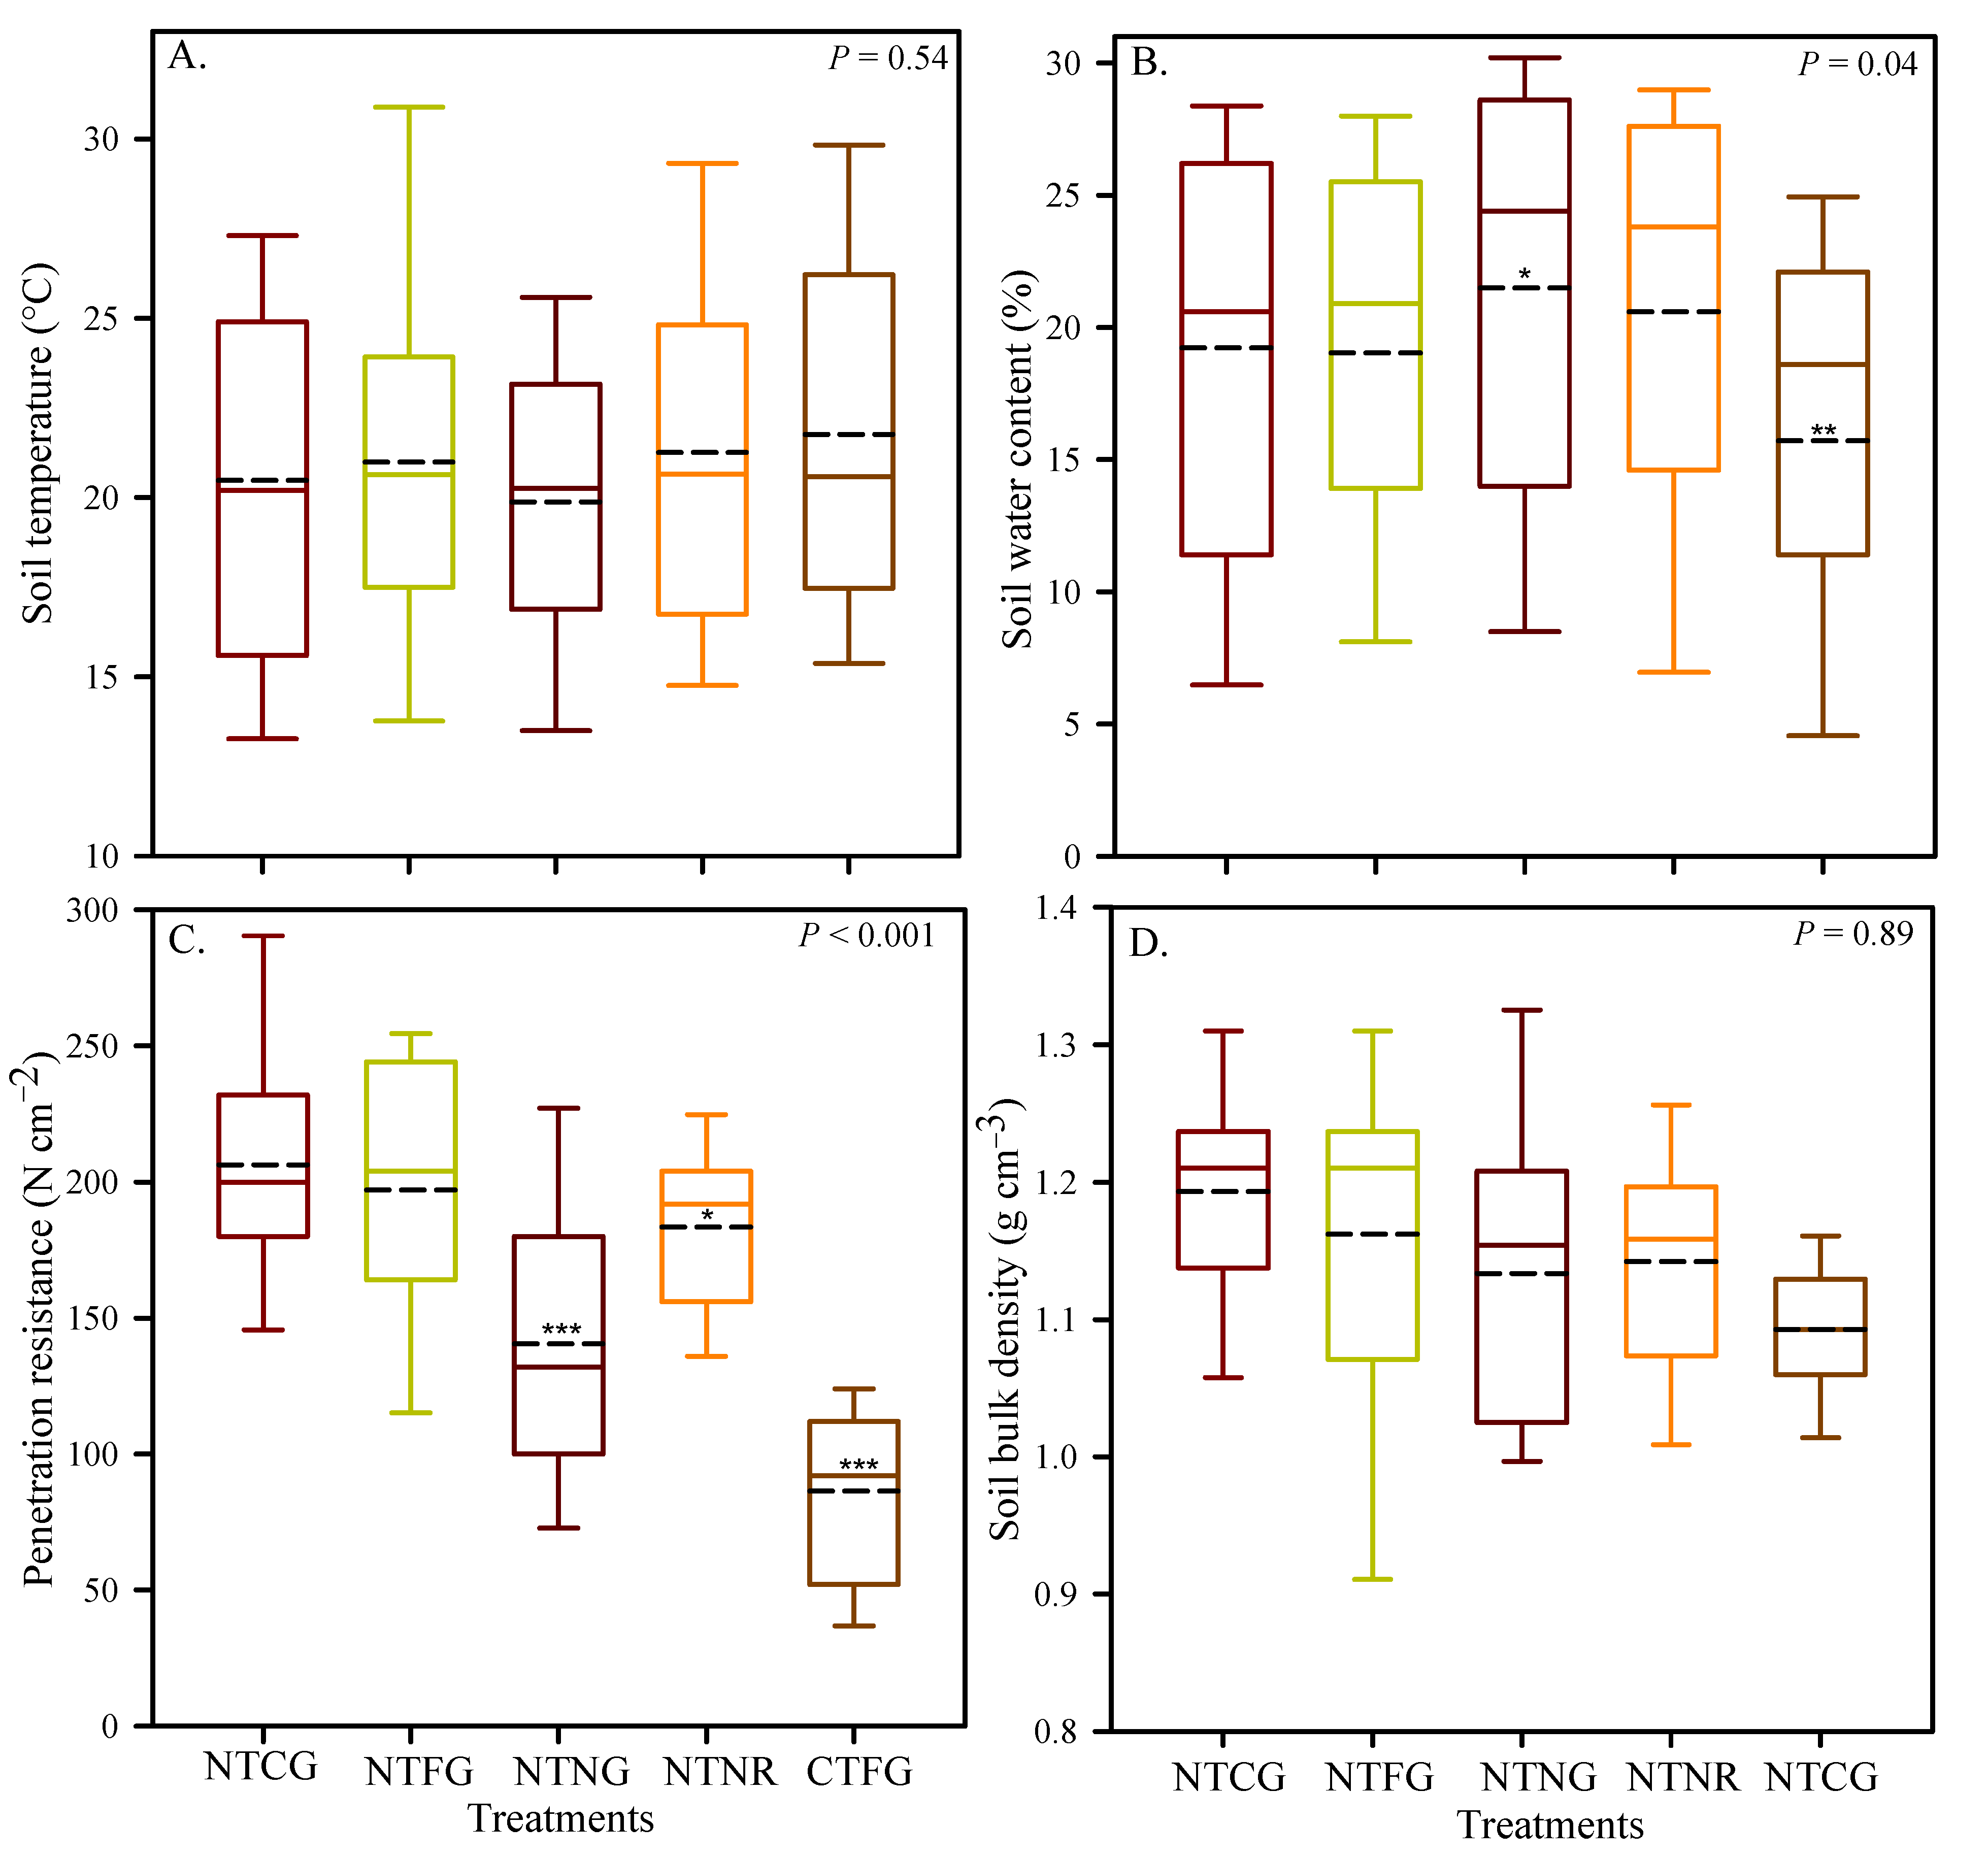
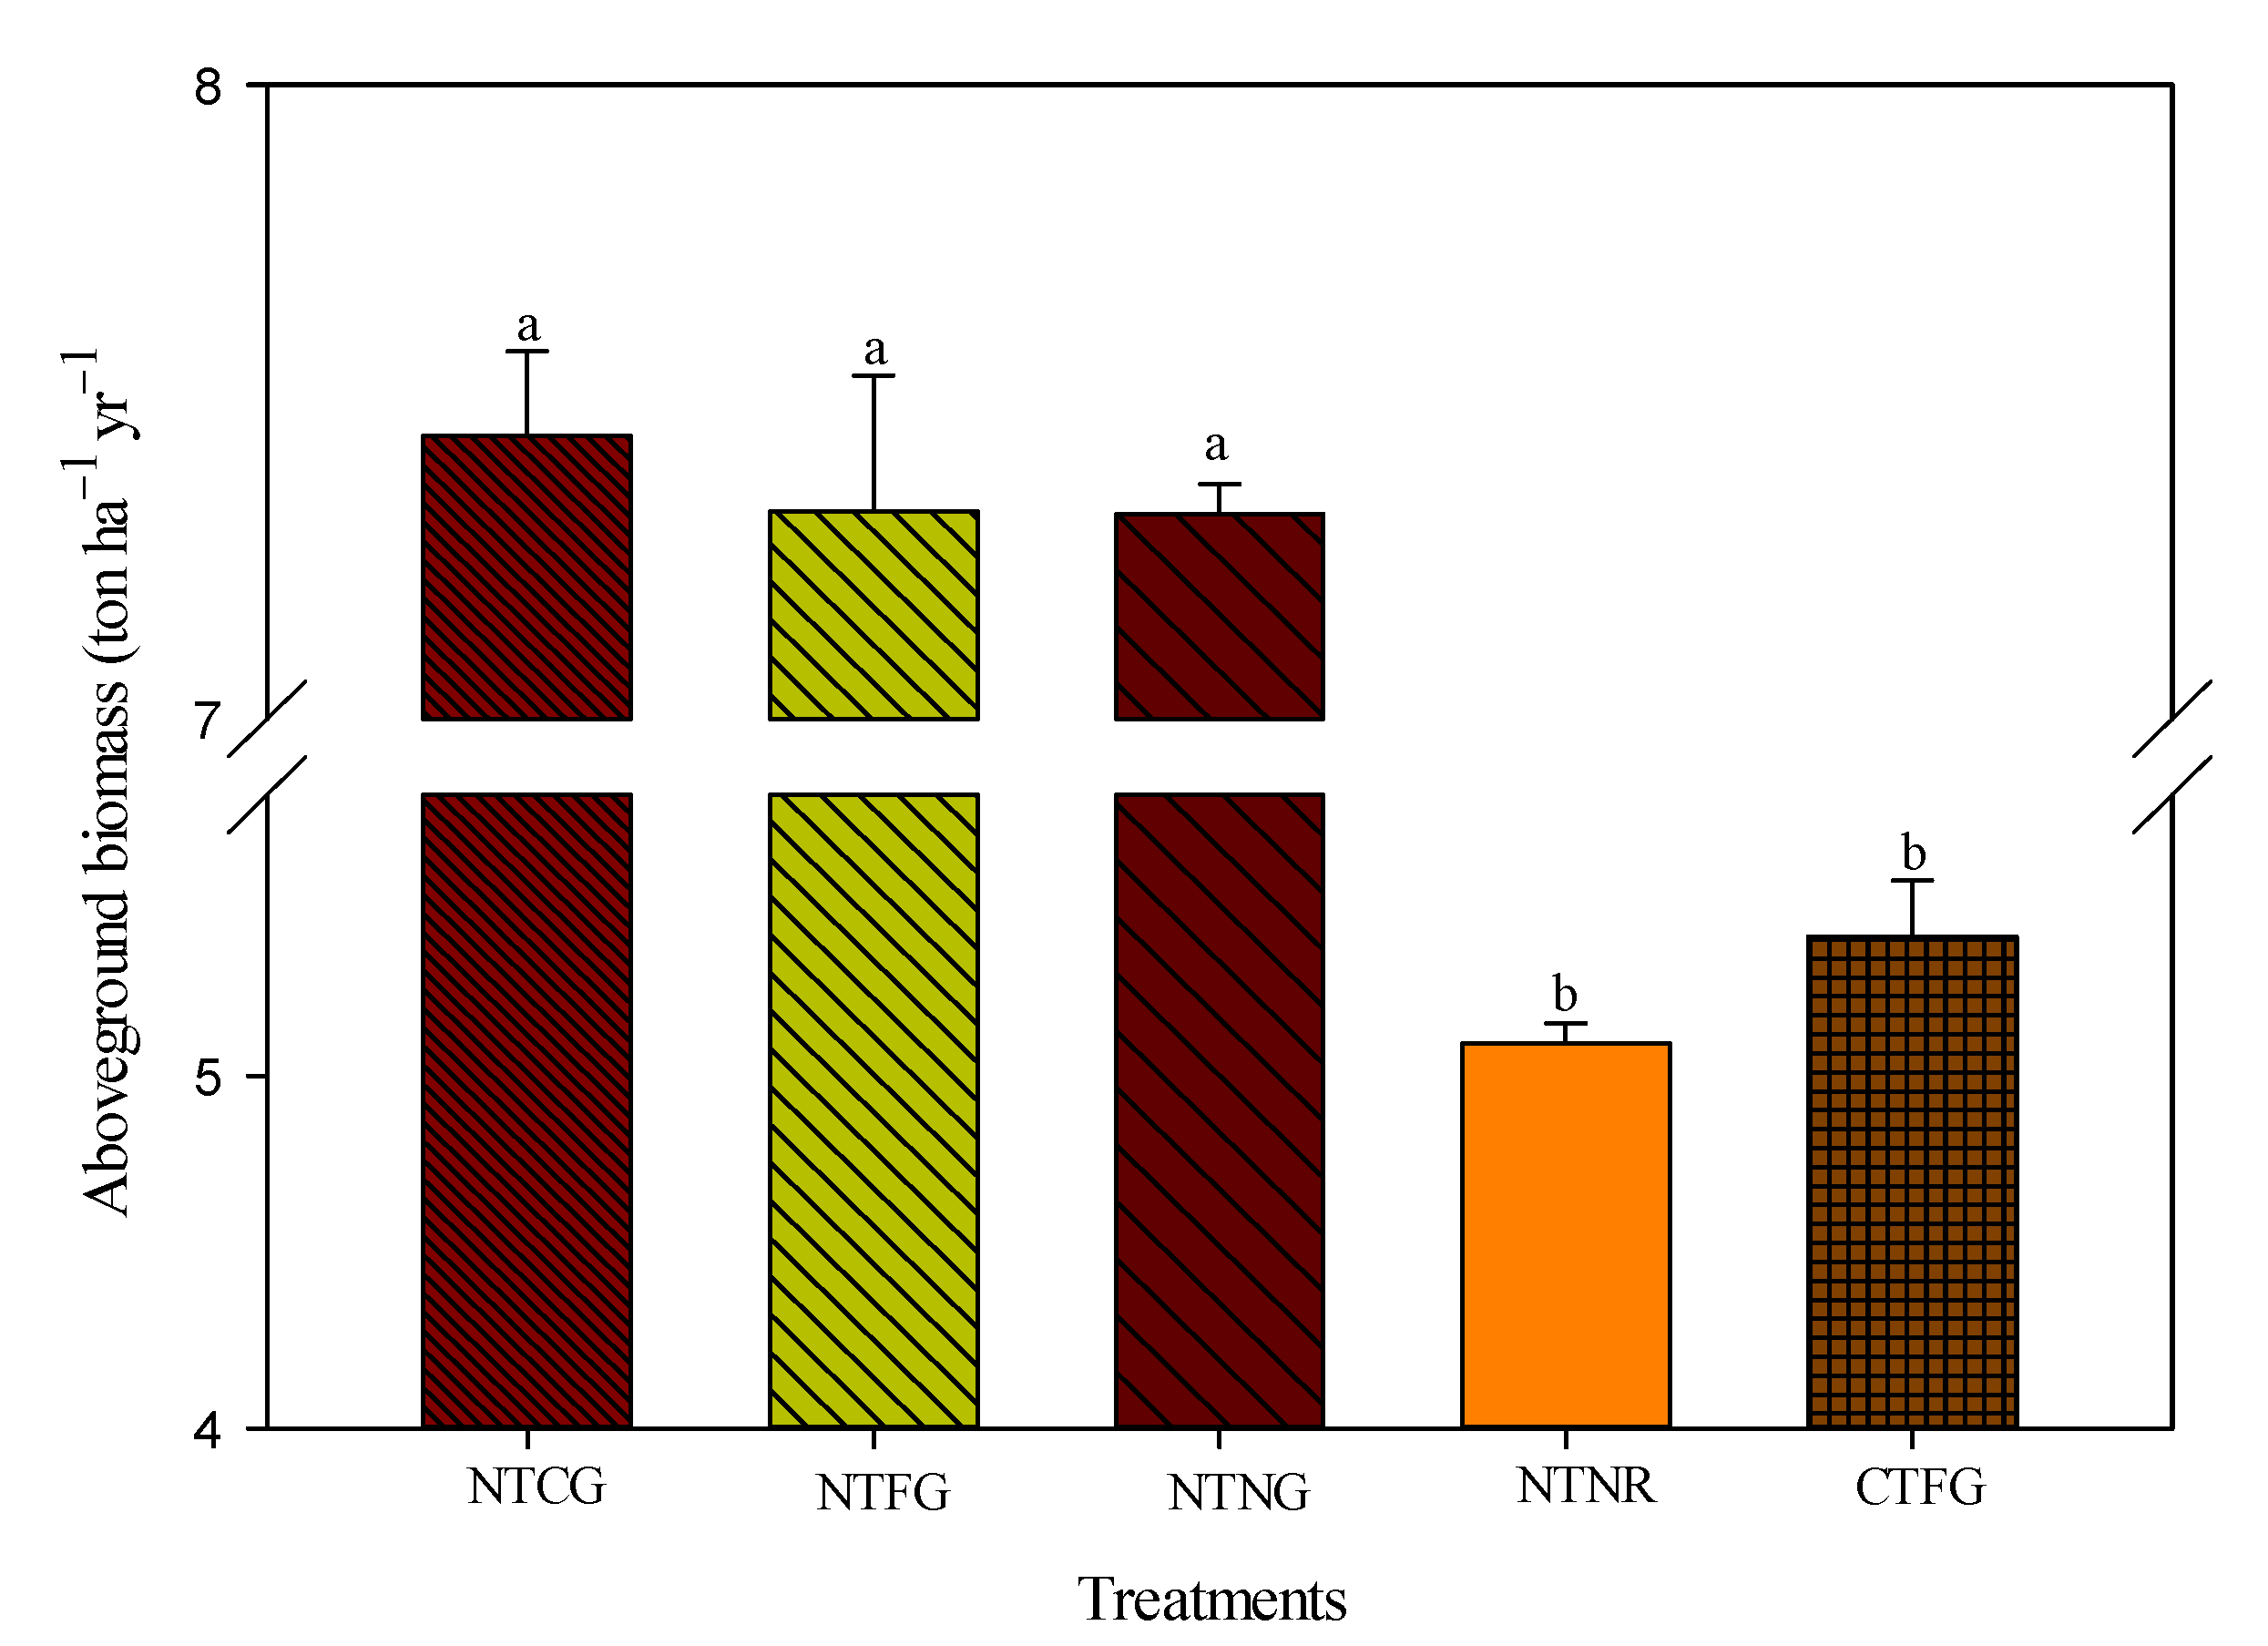
3.3. Effects of Management Practices on Soil Properties and Aboveground Biomass

As expected, SOCc, SOCs, Nc and Nc did not differ significantly amongst the treatments at the start of the trial in 2012 (Table 3). However, SOCc was 40% higher under NTCG (30.2 ± 1.0 g kg−1) than NTFG (21.6 ± 0.4 g kg−1) in 2015. NTCG and NTFG had 52 and 9% higher SOCc than CTFG (19.7 ± 0.3 g kg−1), respectively; there were no significant differences among NTNG, NTNR and CTFG. The corresponding SOCs were 57% higher in NTCG (18.8 ± 0.4 Mg C ha−1) than CTFG (12.5 ± 0.7 Mg C ha−1). On average, the SOCs increased at 1.4 Mg C ha−1 yr−1 in NTCG and at only 0.4 Mg C ha−1 yr−1 in NTFG. While the decrease in SOCs in CTFG was anticipated, it was surprising that NTNG and NTNR also experienced declines in SOCs. NTNR experienced the fastest loss of SOCs at −0.4 Mg C ha−1 yr−1. At the end of the study in 2015, NTNG (1.9 ± 0.1 g kg−1) had the highest soil Nc, followed by NTCG (1.89 ± 0.1 g kg−1) and it was lowest in CTFG (1.6 ± 0.1 g kg−1). However, there were no significant differences amongst these treatments.
Penetration resistance was higher under NTCG and NTFG than under the other treatments (Figure 2C). Surprisingly, CTFG had the lowest topsoil penetration resistance, which was even lower than NTNG. NTNR also showed high penetration resistance. Soil bulk density was less variable (Figure 2D). Overall, it was highest under NTCG and lowest under CTFG (1.09 ± 0.02 g cm−3). However, the difference was not significant (p < 0.05). Aboveground dry biomass was significantly lower in CTFR (5.4 ± 0.6 t ha−1 yr−1) and NTNR (5.1 ± 0.8 t ha−1 yr−1) than the other treatments (Figure 3). NTCG, NTFG and NTNG had much higher aboveground biomass production than CTFG.

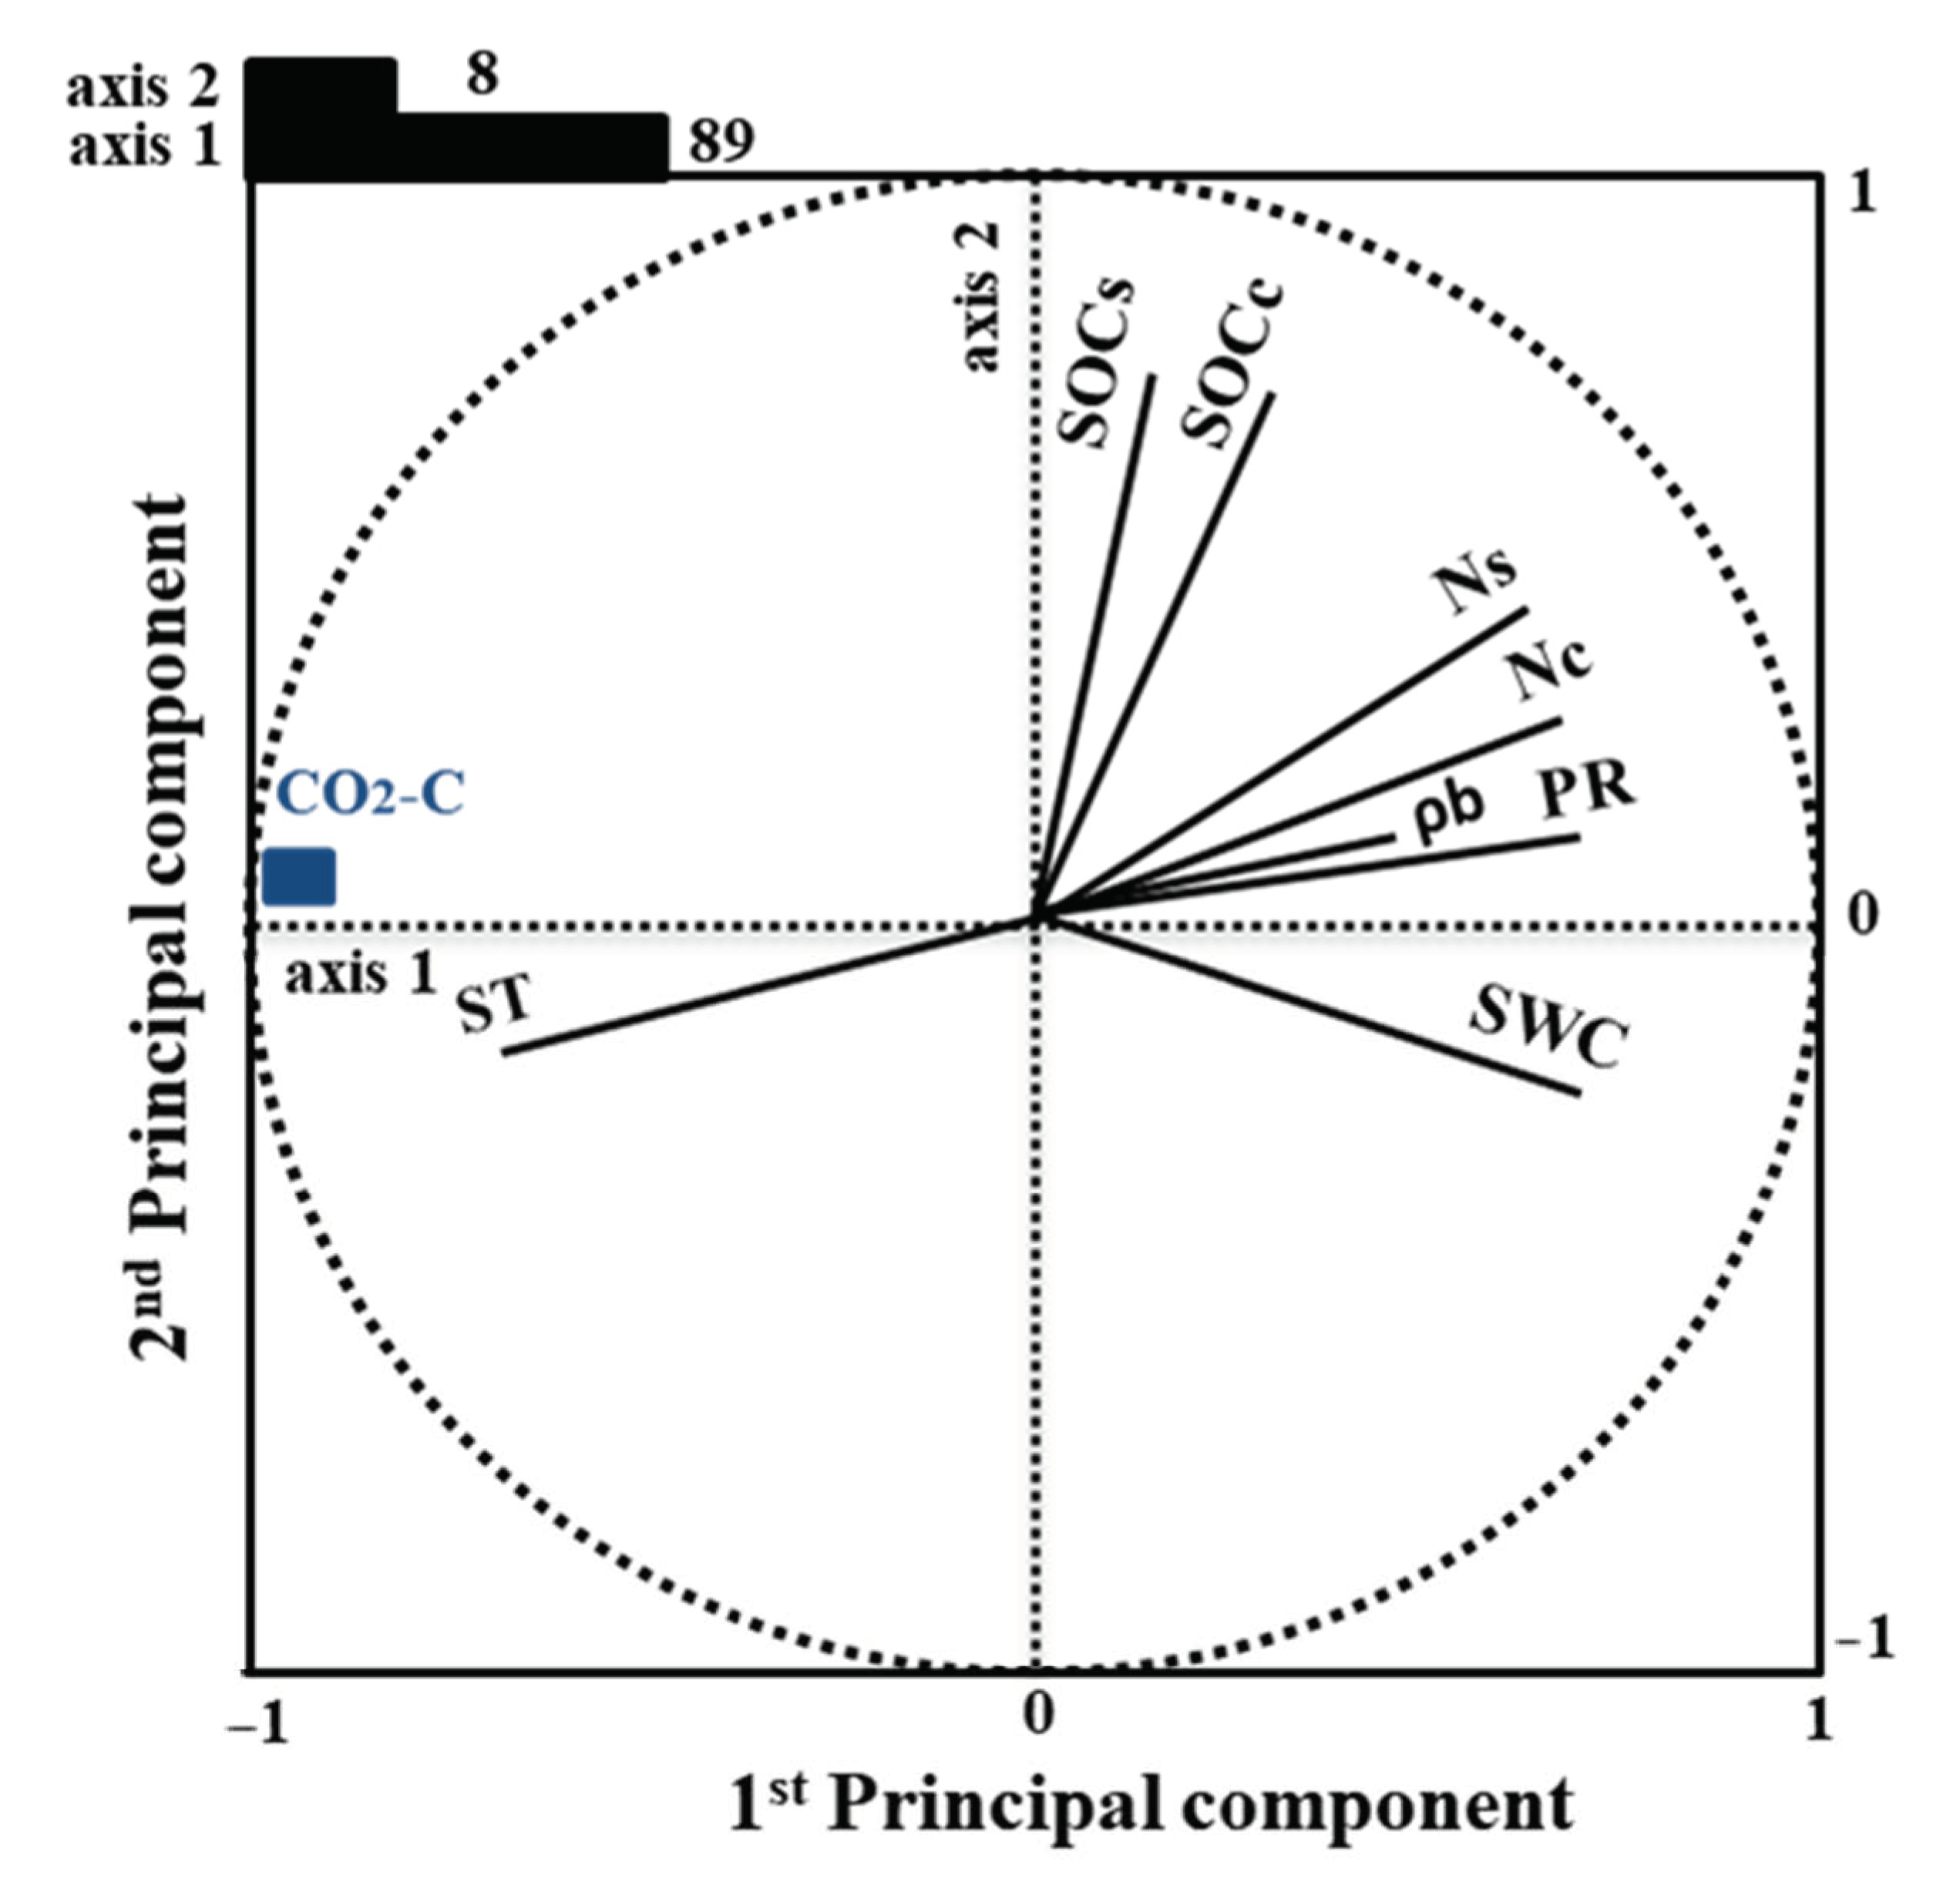
3.4. The Main Controls of Soil CO2 Efflux

The first two axes (axis 1 and 2) of the principal component analysis (PCA), showing the multiple relationships between soil CO2 effluxes and soil factors, explained 97% of the total variation in soil CO2 emissions (Figure 4). Axis 1 accounted for 89% of the variance, while axis 2 accounted for the rest (8%). Axis 1 correlated positively to penetration resistance and soil water content but negatively correlated to soil temperature. Axis 2 correlated positively to SOC content and stocks. The PCA results show tendencies of CO2-C to increase with soil temperature and to decrease with the other studied soil properties.

4. Discussion

The results showing significantly higher soil CO2 effluxes from a freely grazed conventionally tilled system (CTFG) than other practices (Table 2 and Figure 1) implied higher C losses to the atmosphere under conventional tillage practices. Conventional tillage stimulates soil CO2 effluxes, which increases climate change severity, leading to negative consequences on land productivity [24]. Several studies explained that tillage accelerates SOC oxidation through increased soil aeration, putting crop residues in direct contact with soils and exposing the aggregate-protected SOC to decomposers [18,46,47]. However, the effect of tillage on soil CO2 efflux varies greatly worldwide. For example, while La Scala et al. [48] reported 73% higher soil CO2 efflux in tilled compared to no-tilled soils in Brazil, Sainju et al. [49] reported a difference of only 2% in the USA. Such large variations could be explained by the different soil properties, climatic conditions and residue managements [13].
No-tillage with no residues (NTNR) induced significantly greater soil CO2 fluxes than no-tillage with controlled grazing (NTCG) (Table 1), which could be explained by the lower soil temperature under NTCG (Figure 2). The lower soil temperature could, thus, have deaccelerated the soil organic matter mineralization rate [50,51]. Crop residue mulching under NTCG decreased the topsoil temperature because crop residue layers were reported to increase the reflection of solar radiation, which acted as insulation between the soil surfaces and the warmer (or cooler) atmospheric air [52,53]. This explanation is consistent with the present study result showing an increase in soil CO2 effluxes with soil temperature, and also a decrease in soil CO2 effluxes with soil water content (Figure 4), which agreed with other study results [54,55,56,57]. These studies explained that the increase in soil temperature at optimum soil moisture content stimulated soil microbial activities, which subsequently increase CO2 emissions from the soil. Although the current study did not investigate soil microbial activity, decreasing moisture tends to improve soil aeration, promoting soil microorganism growth. However, the lower soil temperature under NTCG and other NT systems with crop residue retention than that with CTFG and NTNR in this study could also be attributed to the low thermal conductivity of the residue mulch [58].
Soil compaction also reducing soil organic matter mineralization [35,59] due to limited gaseous exchanges between the soil and the atmosphere. Topsoil compaction also reduces dissolved soil C losses due to limited water infiltration rates [60,61]. In the current study, topsoil compaction was more pronounced in NTCG and NTFG systems, which involved livestock grazing. Coincidentally, these two systems showed tremendous potential to sequester C. Soil compaction increases soil particle aggregation and physical protection of SOC against decomposers [59,62]. The current study results are consistent with Silva et al. [59], who reported 29% lower CO2 effluxes from compacted compared to less compacted soils, while Torber et al. [62] reported a difference of up to 65%. Interestingly, the greatest C sequestration rate occurred in the NTCG system, characterized by high crop residues (leftover after trampling and soiling by the livestock) and higher topsoil compaction. The elimination of soil aggregate disturbance through no-tillage has positive effects on the physical protection of SOC and the potential addition of C through livestock excreta are also important attributes of the NTCG system with a significant impact on sequestering C into the soil.
Since the high stocking rate was associated with topsoil compaction in the current and other studies [63,64], it follows that slight topsoil (0–0.05 m) compaction might help to positively modify soil nutrient cycling and improve soil quality after all. However, soil compaction using livestock could degrade the physical quality of many soils as it affects soil properties such as penetration resistance, soil bulk density, infiltration rate, soil moisture and soil temperature [60,65,66]. The impact of livestock trampling on soil compaction seems to depend on the soil properties because other studies actually reported higher soil bulk density and penetration resistance on tilled compared to non-tilled soils [66,67]. Moreover, the depth of trampling-induced soil compaction varies between 0.05 and 0.2 m, depending on animal weight and soil moisture content [64].
The current study showed no significant change of topsoil SOC in the NTNG system, which agreed with several other studies [13,68,69], suggesting that crop residue retention alone might have little to no positive impact on SOCs in the short term. Singh et al. [69] reported a limited increase in topsoil C in reduced tillage systems after 30 years of experimenting with different straw management in the boreal region of Southern Finland. In a global meta-analysis, Abdalla et al. [13] reported only 12% lower SOCc in tilled compared to non-tilled systems when no crop residues were retained, and only a difference of 5% when crop residues were retained. In contrast, other studies still pointed to great soil C sequestration benefits of crop residue retention in non-tilled systems [54,57,70].
The study results pointed to greater benefits of integrating controlled grazing in NT to soil C sequestration than other agricultural land management practices. The benefits were explained, mainly, by low soil temperature (due to high crop residue retention following soiling of the residues by the livestock) and, to some extent, by topsoil (0–0.05 m) compaction. The lower CO2 effluxes from the compacted plots confirmed the laboratory finding by Chaplot et al. [35] using soils from the same experimental site. Chaplot et al. [35] compacted the soils manually to different levels and incubated them before evaluating CO2 emissions.
Overall, this study demonstrates that faster C sequestration rates than reported by some previous studies [57,71] could potentially be achieved in the short term. In a review article based on 254 data points directly comparing soil C between NT and tillage, Six et al. [71] reported that significant C sequestration could only be realized in the second decade. The current study results suggest that NTCG can achieve significant C sequestration over a shorter period of time, as demonstrated by the accelerated topsoil C sequestration rate after only three years of implementation. The calculated mean C sequestration rate of 1.4 Mg C ha−1 yr−1 (Table 3) was four times greater than the achieved by direct sowing trials (i.e., 0.34 Mg C ha−1 yr−1) in tropical Brazilian [72] and temperate North American soils [73]. However, it is not very judicious to directly compare the C sequestration rates for the Brazilian and North American trials result soils cannot be directly compared against the results of the current study because they are based on data from different soil types, depths and crop types. Assuming a constant C sequestration rate from the soil surface to one-meter depth, NTCG from the current study could store as much as 28 Mg C ha−1 yr−1. Therefore, adopting NTCG could be one of the available solutions to offset the annual net CO2 emissions to the atmosphere, estimated at 11 Pg in 2014 [12]. However, care would still be required to limit the potentially negative effects of topsoil compaction, especially with regard to root growth and soil erosion.

5. Conclusions

The current study was conducted on a smallholder farming system in South Africa. The main aim was to compare soil CO2 effluxes and SOC stocks among different tillage types combined with different maize residue management practices. The first conclusion based on the current study results is that no-tillage combined with controlled grazing of maize residues has potential to greatly decrease soil CO2 effluxes from cropping systems. The study showed 55% lower soil CO2 effluxes from no-tillage combined with controlled grazing of residues than conventional tillage combined with free grazing of residues. The second conclusion is that no-tillage combined with controlled grazing of residues can potentially achieve faster soil C sequestration rates in cropping systems than widely reported by studies across the world. Results from many reduced tillage studies performed across the world suggested that significant soil C sequestration can only be achieved in the long-term (i.e., after about 20 years of continuous practice); but the current study demonstrated a possibility of significantly increasing soil C sequestration rates in the short term, by practicing a combination of no-tillage and controlled grazing of the crop residues. The current study recorded a soil C sequestration rate of 1.4 Mg C ha−1 year−1 following only three years of continuous practice of the no-tillage combined with controlled residue grazing technique. This result was contrary to the negative sequestration rates observed in no-tillage combined with no crop residue retention and conventional tillage combined with free grazing, which was also characterized by significantly lower aboveground biomass production than no-tillage combined with controlled grazing of the residues. Therefore, integrating controlled livestock grazing of crop residues (i.e., high-density stocking rate for short duration) in no-tillage systems could be the best agricultural land management strategy to mitigate climate change because it increases SOC stocks and aboveground biomass production while at the same time reducing CO2 effluxes. However, there is a need to overcome the potentially negative effects of soil compaction due to the high stocking rate involved. Further research is also still needed to evaluate the potential effect of this technique on soil C sequestration in deep soil depths, other environmental and soil conditions, as well as the emission of other GHGs such as N2O and CH4. It is also important to implement true randomization of the treatments in future trials.

Author Contributions

Conceptualization, K.A., P.C. and V.C.; methodology, K.A.; formal analysis, K.A.; investigation; data curation, K.A.; writing—original draft preparation, K.A.; writing—review and editing, K.A., M.M., P.C. and V.C.; supervision, P.C. and V.C.; project administration, P.C. and V.C.; funding acquisition, P.C. and V.C. All authors have read and agreed to the published version of the manuscript.

Funding

The fieldwork and laboratory analysis was funded by the Water Research Commission (WRC), South Africa, “project number K5/2266”. The open-access funding was provided by the German research foundation (DFG) and the University of Bayreuth through Projekt DEAL program.

Data Availability Statement

All data generated or analyzed during this study are presented in the form of tables or figures.

Acknowledgments

We would like to acknowledge the Centre for Water Resources Research and Department of Soil Science, University of KwaZulu-Natal; Agricultural Research Council-Agricultural Engineering, the Institut de Recherche pour le Développement (IRD), Department of Agroecology, the University of Bayreuth for the facilities and support. We are grateful to Alexander von Humboldt Foundation for financially supporting the first author. Special thanks to the Potshini community for allowing us to experiment on their land.

Conflicts of Interest

The authors declare no conflict of interest.

References

  1. IPCC Summary for Policymakers. Global Warming of 1.5 °C. An IPCC Special Report on the Impacts of Global Warming of 1.5 °C above Pre-Industrial Levels and Related Global Greenhouse Gas Emission Pathways, in the Context of Strengthening the Global Response to the Threat of Climate Change, Sustainable Development, and Efforts to Eradicate Poverty; Masson-Delmotte, V., Zhai, P., Pörtner, H.-O., Roberts, D., Skea, J., Shukla, P.R., Pirani, A., Moufouma-Okia, W., Péan, C., Pidcock, R., et al., Eds.; World Meteorological Organization: Geneva, Switzerland, 2018; 32p. [Google Scholar]
  2. Le Quéré, C.; Moriarty, R.; Andrew, R.M.; Peters, G.P.; Ciais, P.; Friedlingstein, P.; Jones, S.; Sitch, S.; Tans, P.P.; Arneth, A.; et al. Global carbon budget 2014. Earth Syst. Sci. Data 2015, 7, 47–85. [Google Scholar] [CrossRef] [Green Version]
  3. Abdalla, K.; Mutema, M.; Hill, T. Soil and organic carbon losses from varying land uses: A global meta-analysis. Geogr. Res. 2020, 58, 167–185. [Google Scholar] [CrossRef]
  4. An, S.; Zheng, F.; Zhang, F.; Van Pelt, S.; Hamer, U.; Makeschin, F. Soil quality degradation processes along a deforestation chronosequence in the Ziwuling area, China. Catena 2008, 75, 248–256. [Google Scholar] [CrossRef]
  5. Guillaume, T.; Damris, M.; Kuzyakov, Y. Losses of soil carbon by converting tropical forest to plantations: Erosion and decomposition estimated by δ 13 C. Glob. Chang. Biol. 2015, 21, 3548–3560. [Google Scholar] [CrossRef]
  6. Martin, M.P.; Dimassi, B.; Dobarco, M.R.; Guenet, B.; Arrouays, D.; Angers, D.A.; Blache, F.; Huard, F.; Soussana, J.; Pellerin, S. Feasibility of the 4 per 1000 aspirational target for soil carbon: A case study for France. Glob. Chang. Biol. 2021, 27, 2458–2477. [Google Scholar] [CrossRef]
  7. Jacobs, A.; Poeplau, C.; Weiser, C.; Fahrion-Nitschke, A.; Don, A. Exports and inputs of organic carbon on agricultural soils in Germany. Nutr. Cycl. Agroecosyst. 2020, 118, 249–271. [Google Scholar] [CrossRef]
  8. Lal, R. Digging deeper: A holistic perspective of factors affecting soil organic carbon sequestration in agroecosystems. Glob. Chang. Biol. 2018, 24, 3285–3301. [Google Scholar] [CrossRef]
  9. Riggers, C.; Poeplau, C.; Don, A.; Frühauf, C.; Dechow, R. How much carbon input is required to preserve or increase projected soil organic carbon stocks in German croplands under climate change? Plant Soil 2021, 460, 417–433. [Google Scholar] [CrossRef]
  10. Bhattacharyya, R.; Ghosh, B.N.; Mishra, P.K.; Mandal, B.; Rao, C.S.; Sarkar, D.; Das, K.; Anil, K.S.; Lalitha, M.; Hati, K.M.; et al. Soil Degradation in India: Challenges and Potential Solutions. Sustainability 2015, 7, 3528–3570. [Google Scholar] [CrossRef] [Green Version]
  11. Feng, J.; Li, F.; Zhou, X.; Xu, C.; Ji, L.; Chen, Z.; Fang, F. Impact of agronomy practices on the effects of reduced tillage systems on CH4 and N2O emissions from agricultural fields: A global meta-analysis. PLoS ONE 2018, 13, e0196703. [Google Scholar] [CrossRef] [Green Version]
  12. Lal, R. Cover cropping and the “4 per Thousand” proposal. J. Soil Water Conserv. 2015, 70, 141A. [Google Scholar] [CrossRef]
  13. Abdalla, K.; Chivenge, P.; Ciais, P.; Chaplot, V. No-tillage lessens soil CO2 emissions the most under arid and sandy soil conditions: Results from a meta-analysis. Biogeosciences 2016, 13, 3619–3633. [Google Scholar] [CrossRef] [Green Version]
  14. Gong, Y.; Li, P.; Sakagami, N.; Komatsuzaki, M. No-tillage with rye cover crop can reduce net global warming potential and yield-scaled global warming potential in the long-term organic soybean field. Soil Tillage Res. 2021, 205, 104747. [Google Scholar] [CrossRef]
  15. Lu, X.; Lu, X.; Liao, Y. Conservation tillage increases carbon sequestration of winter wheat-summer maize farmland on Loess Plateau in China. PLoS ONE 2018, 13, e0199846. [Google Scholar] [CrossRef] [PubMed]
  16. Baker, J.M.; Ochsner, T.; Venterea, R.T.; Griffis, T.J. Tillage and soil carbon sequestration—What do we really know? Agric. Ecosyst. Environ. 2007, 118, 1–5. [Google Scholar] [CrossRef]
  17. Dimassi, B.; Cohan, J.-P.; Labreuche, J.; Mary, B. Changes in soil carbon and nitrogen following tillage conversion in a long-term experiment in Northern France. Agric. Ecosyst. Environ. 2013, 169, 12–20. [Google Scholar] [CrossRef]
  18. Haddaway, N.R.; Hedlund, K.; Jackson, L.E.; Kätterer, T.; Lugato, E.; Thomsen, I.K.; Jørgensen, H.B.; Isberg, P.-E. How does tillage intensity affect soil organic carbon? A systematic review. Environ. Évid. 2017, 6, 30. [Google Scholar] [CrossRef] [Green Version]
  19. Aslam, T.; Choudhary, M.; Saggar, S. Influence of land-use management on CO2 emissions from a silt loam soil in New Zealand. Agric. Ecosyst. Environ. 2000, 77, 257–262. [Google Scholar] [CrossRef]
  20. Li, C.-F.; Kou, Z.-K.; Yang, J.-H.; Cai, M.-L.; Wang, J.-P.; Cao, C.-G. Soil CO2 fluxes from direct seeding rice fields under two tillage practices in central China. Atmos. Environ. 2010, 44, 2696–2704. [Google Scholar] [CrossRef]
  21. Barreto, R.C.; Madari, B.E.; Maddock, J.E.; Machado, P.L.O.D.A.; Torres, E.; Franchini, J.; Costa, A.R. The impact of soil management on aggregation, carbon stabilization and carbon loss as CO2 in the surface layer of a Rhodic Ferralsol in Southern Brazil. Agric. Ecosyst. Environ. 2009, 132, 243–251. [Google Scholar] [CrossRef]
  22. Smith, D.R.; Ramirez, G.H.; Armstrong, S.D.; Bucholtz, D.L.; Stott, D. Fertilizer and Tillage Management Impacts on Non-Carbon-Dioxide Greenhouse Gas Emissions. Soil Sci. Soc. Am. J. 2011, 75, 1070–1082. [Google Scholar] [CrossRef] [Green Version]
  23. Krauss, M.; Berner, A.; Perrochet, F.; Frei, R.; Niggli, U.; Mäder, P. Enhanced soil quality with reduced tillage and solid manures in organic farming—A synthesis of 15 years. Sci. Rep. 2020, 10, 1–12. [Google Scholar] [CrossRef] [PubMed] [Green Version]
  24. Paustian, K.; Lehmann, J.; Ogle, S.; Reay, D.; Robertson, G.; Smith, P. Climate-smart soils. Nature 2016, 532, 49–57. [Google Scholar] [CrossRef] [PubMed] [Green Version]
  25. Thierfelder, C.; Chivenge, P.; Mupangwa, W.; Rosenstock, T.S.; Lamanna, C.; Eyre, J.X. How climate-smart is conservation agriculture (CA)—Its potential to deliver on adaptation, mitigation and productivity on smallholder farms in southern Africa. Food Secur. 2017, 9, 537–560. [Google Scholar] [CrossRef] [Green Version]
  26. Chaplot, V.; Mchunu, C.; Manson, A.; Lorentz, S.; Jewitt, G. Water erosion-induced CO2 emissions from tilled and no-tilled soils and sediments. Agric. Ecosyst. Environ. 2012, 159, 62–69. [Google Scholar] [CrossRef]
  27. Thierfelder, C.; Wall, P.C. Effects of conservation agriculture techniques on infiltration and soil water content in Zambia and Zimbabwe. Soil Tillage Res. 2009, 105, 217–227. [Google Scholar] [CrossRef]
  28. Rodrigues, L.A.T.; Giacomini, S.J.; Aita, C.; Lourenzi, C.R.; Brunetto, G.; Bacca, A.; Ceretta, C.A. Short- and long-term effects of animal manures and mineral fertilizer on carbon stocks in subtropical soil under no-tillage. Geoderma 2021, 386, 114913. [Google Scholar] [CrossRef]
  29. Schuster, M.Z.; Harrison, S.K.; de Moraes, A.; Sulc, R.M.; Carvalho, P.C.F.; Lang, C.R.; Anghinoni, I.; Lustosa, S.B.C.; Gastal, F. Effects of crop rotation and sheep grazing management on the seedbank and emerged weed flora under a no-tillage integrated crop-livestock system. J. Agric. Sci. 2018, 156, 810–820. [Google Scholar] [CrossRef]
  30. Hellin, J.; Erenstein, O.; Beuchelt, T.D.; Camacho, C.; Flores, D. Maize stover use and sustainable crop production in mixed crop–livestock systems in Mexico. Field Crops Res. 2013, 153, 12–21. [Google Scholar] [CrossRef] [Green Version]
  31. Díaz-Zorita, M.; Duarte, G.A.; Grove, J.H. A review of no-till systems and soil management for sustainable crop production in the subhumid and semiarid Pampas of Argentina. Soil Tillage Res. 2002, 65, 1–18. [Google Scholar] [CrossRef]
  32. Sanjari, G.; Ghadiri, H.; Ciesiolka, C.A.A.; Yu, B. Comparing the effects of continuous and time-controlled grazing systems on soil characteristics in Southeast Queensland. Soil Res. 2008, 46, 348–358. [Google Scholar] [CrossRef] [Green Version]
  33. Chaplot, V.; Dlamini, P.; Chivenge, P. Potential of grassland rehabilitation through high density-short duration grazing to sequester atmospheric carbon. Geoderma 2016, 271, 10–17. [Google Scholar] [CrossRef] [Green Version]
  34. Peel, M.C.; Finlayson, B.L.; McMahon, T.A. Updated World Map of the Köppen-Geiger Climate Classification. Hydrol. Earth Syst. Sci. Discuss. 2007, 4, 439–473. [Google Scholar]
  35. Chaplot, V.; Abdalla, K.; Alexis, M.; Bourennane, H.; Darboux, F.; Dlamini, P.; Everson, C.; Mchunu, C.; Muller-Nedebock, D.; Mutema, M.; et al. Surface organic carbon enrichment to explain greater CO2 emissions from short-term no-tilled soils. Agric. Ecosyst. Environ. 2015, 203, 110–118. [Google Scholar] [CrossRef]
  36. WRB Soil Classification. ISBN 978-92-5-108369-7 (Print). E-ISBN 978-92-5-108370-3 (PDF). Available online: http://www.fao.org/3/i3794en/I3794en.pdf (accessed on 13 November 2020).
  37. Mchunu, C.N.; Lorentz, S.; Jewitt, G.; Manson, A.; Chaplot, V. No-Till Impact on Soil and Soil Organic Carbon Erosion under Crop Residue Scarcity in Africa. Soil Sci. Soc. Am. J. 2011, 75, 1503–1512. [Google Scholar] [CrossRef]
  38. Healy, R.W.; Striegl, R.G.; Russell, T.F.; Hutchinson, G.L.; Livingston, G.P. Numerical Evaluation of Static-Chamber Measurements of Soil-Atmosphere Gas Exchange: Identification of Physical Processes. Soil Sci. Soc. Am. J. 1996, 60, 740–747. [Google Scholar] [CrossRef]
  39. Mielnick, P.; Dugas, W.A. Soil CO2 flux in a tallgrass prairie. Soil Biol. Biochem. 2000, 32, 221–228. [Google Scholar] [CrossRef]
  40. Rey, A.; Pegoraro, E.; Oyonarte, C.; Were, A.; Escribano, P.; Raimundo, J. Impact of land degradation on soil respiration in a steppe (Stipa tenacissima L.) semi-arid ecosystem in the SE of Spain. Soil Biol. Biochem. 2011, 43, 393–403. [Google Scholar] [CrossRef]
  41. Batjes, N.H. Total carbon and nitrogen in the soils of the world. Eur. J. Soil Sci. 2014, 65, 10–21. [Google Scholar] [CrossRef]
  42. Grossman, R.B.; Reinsch, T.G. Bulk Density and Linear Extensibility. In Methods of Soil Analysis: Part 4. Physical Methods; Dane, J.H., Topp, G.C., Eds.; Soil Science Society of America Inc.: Madison, WI, USA, 2002; pp. 201–225. [Google Scholar]
  43. Herrick, J.E.; Jones, T.L. A dynamic cone penetrometer for measuring soil penetration resistance. Soil Sci. Soc. Am. J. 2002, 66, 1320–1324. [Google Scholar] [CrossRef]
  44. Davies, G.; A Bodart, J. Changes in vegetation diversity and composition following livestock removal along an upland elevational gradient. iForest Biogeosci. For. 2015, 8, 582–589. [Google Scholar] [CrossRef] [Green Version]
  45. Liebig, M.; Kronberg, S.; Hendrickson, J.; Dong, X.; Gross, J. Carbon dioxide efflux from long-term grazing management systems in a semiarid region. Agric. Ecosyst. Environ. 2013, 164, 137–144. [Google Scholar] [CrossRef]
  46. Beare, M.; Hendrix, P.F.; Cabrera, M.L.; Coleman, D. Aggregate-Protected and Unprotected Organic Matter Pools in Conventional- and No-Tillage Soils. Soil Sci. Soc. Am. J. 1994, 58, 787–795. [Google Scholar] [CrossRef]
  47. Six, J.; Elliott, E.; Paustian, K. Soil macroaggregate turnover and microaggregate formation: A mechanism for C sequestration under no-tillage agriculture. Soil Biol. Biochem. 2000, 32, 2099–2103. [Google Scholar] [CrossRef]
  48. La Scala, N.; Bolonhezi, D.; Pereira, G.T. Short-term soil CO2 emission after conventional and reduced tillage of a no-till sugar cane area in southern Brazil. Soil Tillage Res. 2006, 91, 244–248. [Google Scholar] [CrossRef]
  49. Sainju, U.M.; Stevens, W.B.; Caesar-Tonthat, T.; Jabro, J.D. Land Use and Management Practices Impact on Plant Biomass Carbon and Soil Carbon Dioxide Emission. Soil Sci. Soc. Am. J. 2010, 74, 1613–1622. [Google Scholar] [CrossRef]
  50. Sarkar, S.; Skalicky, M.; Hossain, A.; Brestic, M.; Saha, S.; Garai, S.; Ray, K.; Brahmachari, K. Management of Crop Residues for Improving Input Use Efficiency and Agricultural Sustainability. Sustainability 2020, 12, 9808. [Google Scholar] [CrossRef]
  51. Shen, Y.; McLaughlin, N.; Zhang, X.; Xu, M.; Liang, A. Effect of tillage and crop residue on soil temperature following planting for a Black soil in Northeast China. Sci. Rep. 2018, 8, 4500. [Google Scholar] [CrossRef] [Green Version]
  52. Li, R.; Hou, X.; Jia, Z.; Han, Q.; Ren, X.; Yang, B. Effects on soil temperature, moisture, and maize yield of cultivation with ridge and furrow mulching in the rainfed area of the Loess Plateau, China. Agric. Water Manag. 2013, 116, 101–109. [Google Scholar] [CrossRef]
  53. Davin, E.L.; Seneviratne, S.; Ciais, P.; Olioso, A.; Wang, T. Preferential cooling of hot extremes from cropland albedo management. Proc. Natl. Acad. Sci. USA 2014, 111, 9757–9761. [Google Scholar] [CrossRef] [Green Version]
  54. Al-Kaisi, M.M.; Yin, X. Tillage and Crop Residue Effects on Soil Carbon and Carbon Dioxide Emission in Corn-Soybean Rotations. J. Environ. Qual. 2005, 34, 437–445. [Google Scholar] [CrossRef] [PubMed]
  55. Fortin, M.-C.; Rochette, P.; Pattey, E. Soil Carbon Dioxide Fluxes from Conventional and No-Tillage Small-Grain Cropping Systems. Soil Sci. Soc. Am. J. 1996, 60, 1541–1547. [Google Scholar] [CrossRef]
  56. Mathiba, M.; Awuah-Offei, K.; Baldassare, F.J. Influence of elevation, soil temperature and soil moisture content on reclaimed mine land soil CO2 fluxes. Environ. Earth Sci. 2015, 73, 6131–6143. [Google Scholar] [CrossRef]
  57. Ussiri, D.A.; Lal, R. Long-term tillage effects on soil carbon storage and carbon dioxide emissions in continuous corn cropping system from an alfisol in Ohio. Soil Tillage Res. 2009, 104, 39–47. [Google Scholar] [CrossRef]
  58. Duiker, S.W.; Lal, R. Carbon Budget Study Using CO2 Flux Measurements from a No till System in Central Ohio. Soil Tillage Res. 2000, 54, 21–30. [Google Scholar] [CrossRef]
  59. Silva, S.R.; da Silva, I.R.; de Barros, N.F.; de Sá Mendonça, E. Effect of Compaction on Microbial Activity and Carbon and Nitrogen Transformations in Two Oxisols with Different Mineralogy. Rev. Bras. Ciênc. Solo 2011, 35, 1141–1149. [Google Scholar] [CrossRef]
  60. Agostini, M.D.L.A.; Studdert, G.; Martino, S.S.; Costa, J.; Balbuena, R.; Ressia, J.; Mendivil, G.; Lazaro, L. Crop residue grazing and tillage systems effects on soil physical properties and corn (Zea mays L.) performance. J. Soil Sci. Plant Nutr. 2012, 12, 271–282. [Google Scholar] [CrossRef] [Green Version]
  61. Adekalu, K.; Okunade, D.; Osunbitan, J. Compaction and mulching effects on soil loss and runoff from two southwestern Nigeria agricultural soils. Geoderma 2006, 137, 226–230. [Google Scholar] [CrossRef]
  62. Torbert, H.; Wood, C. Effects of soil compaction and water-filled pore space on soil microbial activity and N losses. Commun. Soil Sci. Plant Anal. 1992, 23, 1321–1331. [Google Scholar] [CrossRef]
  63. Greenwood, K.L.; McKenzie, B.M. Grazing effects on soil physical properties and the consequences for pastures: A review. Aust. J. Exp. Agric. 2001, 41, 1231. [Google Scholar] [CrossRef]
  64. Hamza, M.; Anderson, W. Soil compaction in cropping systems: A review of the nature, causes and possible solutions. Soil Tillage Res. 2005, 82, 121–145. [Google Scholar] [CrossRef]
  65. Piva, J.T.; Dieckow, J.; Bayer, C.; Zanatta, J.A.; de Moraes, A.; Tomazi, M.; Pauletti, V.; Barth, G.; Piccolo, M.D.C. Soil gaseous N2O and CH4 emissions and carbon pool due to integrated crop-livestock in a subtropical Ferralsol. Agric. Ecosyst. Environ. 2014, 190, 87–93. [Google Scholar] [CrossRef]
  66. Silva, V.R.; Reinert, D.J.; Reichert, J.M. Densidade do solo, atributos químicos e sistema radicular do milho afetados pelo pastejo e manejo do solo. Rev. Bras. Ciênc. Solo 2000, 24, 191–199. [Google Scholar] [CrossRef] [Green Version]
  67. Díaz-Zorita, M.; Grove, J.H. Crop Sequence Effects on the Properties of a Hapludoll under Continuous No-Tillage Management. In Proceedings of the Annual Southern Conservation Tillage Conference for Sustainable Agriculture, Tifton, GA, USA, 6–8 July 1999. [Google Scholar]
  68. Lemke, R.; VandenBygaart, A.; Campbell, C.; Lafond, G.; Grant, B. Crop residue removal and fertilizer N: Effects on soil organic carbon in a long-term crop rotation experiment on a Udic Boroll. Agric. Ecosyst. Environ. 2010, 135, 42–51. [Google Scholar] [CrossRef]
  69. Singh, P.; Heikkinen, J.; Ketoja, E.; Nuutinen, V.; Palojärvi, A.; Sheehy, J.; Esala, M.; Mitra, S.; Alakukku, L.; Regina, K. Tillage and crop residue management methods had minor effects on the stock and stabilization of topsoil carbon in a 30-year field experiment. Sci. Total Environ. 2015, 518–519, 337–344. [Google Scholar] [CrossRef]
  70. West, T.; Post, W.M. Soil Organic Carbon Sequestration Rates by Tillage and Crop Rotation. Soil Sci. Soc. Am. J. 2002, 66, 1930–1946. [Google Scholar] [CrossRef] [Green Version]
  71. Six, J.; Ogle, S.M.; Jay Breidt, F.; Conant, R.T.; Mosier, A.R.; Paustian, K. The potential to mitigate global warming with no-tillage management is only realized when practised in the long term. Glob. Chang. Biol. 2004, 10, 155–160. [Google Scholar] [CrossRef] [Green Version]
  72. Bayer, C.; Martin-Neto, L.; Mielniczuk, J.; Pavinato, A.; Dieckow, J. Carbon sequestration in two Brazilian Cerrado soils under no-till. Soil Tillage Res. 2006, 86, 237–245. [Google Scholar] [CrossRef]
  73. West, T.; Marland, G. A synthesis of carbon sequestration, carbon emissions, and net carbon flux in agriculture: Comparing tillage practices in the United States. Agric. Ecosyst. Environ. 2002, 91, 217–232. [Google Scholar] [CrossRef]
Figure 1. Precipitation and air temperature (A), daily fluxes (B) and cumulative (C) of gross soil CO2-C efflux (g CO2-C m−2) conventional tillage with free grazing (CTFG), no-tillage with free grazing (NTFG), no-tillage with no grazing (NTNG), no-tillage without crop residue mulching (NTNR) and no-tillage with controlled grazing (NTCG). Error bars represent the standard error of the mean. N = 9.
Agronomy 11 01421 g001
Figure 2. Box-whisker plots for soil temperatures (A), soil water content (B), penetration resistance (C) and soil bulk density (D) at 0.05 m soil depth from conventional tillage with free grazing (CTFG), no-tillage with free grazing (NTFG), no-tillage with no grazing (NTNG), no-tillage without crop residue mulching (NTNR) and no-tillage with controlled grazing (NTCG). Plain lines correspond to 10th, 25th, median, 75th, and 90th percentiles; short dash lines to the mean. Significant differences from NTCG mean as a control to the other treatments indicated by *, **, ***, representing p value of < 0.05, <0.01, 0.001, respectively. N = 120, 27, 45, for soil temperatures, soil water content, penetration resistance, and soil bulk density, respectively.
Agronomy 11 01421 g002
Figure 3. Aboveground dry biomass from conventional tillage with free grazing (CTFG), no-tillage with free grazing (NTFG), no-tillage with no grazing (NTNG), no-tillage with no residues (NTNR) and no-tillage with controlled grazing (NTCG). Error bars represent the standard error of the mean. N = 9.
Agronomy 11 01421 g003
Figure 4. Principal components analysis (PCA) scatter diagrams for soil CO2-C from one side and selected soil factors (soil organic carbon content and stocks (SOCc; SOCs), nitrogen content and stocks (Nc; Ns), soil temperature (ST), soil water content (SWC), penetration resistance (PR) and soil bulk density (ρb) on the other side. N = 15.
Agronomy 11 01421 g004
Table 1. Repeated-measures ANOVA for the effects of treatments, date of sampling and their interaction on soil CO2-C emissions, soil temperature (ST) and soil water content (SWC).
Soil CO2-CSTSWC
(g m−2 d−1)(°C)(%)
Source of VariationsDFMSF pr.MSF pr.MSF pr.
Treatment482.0<0.00145.3<0.001130.6<0.001
Date4070.0<0.001356.9<0.001870.5<0.001
Treatment × date1608.7<0.0016.0<0.0018.5<0.001
DF: degree of freedom, MS: mean squares.
Table 2. Mean ± SE (standard error) of soil CO2-C effluxes (CO2-C) under conventional tillage with free grazing (CTFG), no-tillage with free grazing (NTFG), no-tillage with no grazing (NTNG), no-tillage without crop residue mulching (NTNR) and no-tillage with controlled grazing (NTCG). N = 120, 90, 30, for overall average, wet and dry period, respectively.
No-TillTill
VariableTimeNTCGNTFGNTNGNTNRCTFG
Soil CO2-C
(g m−2 d−1)
Overall 3.2 ± 0.4 d3.1 ± 0.3 d3.4 ± 0.3 c4.2 ± 0.5 b5.1 ± 0.6 a
Wet season3.9 ± 0.5 cd3.6 ± 0.3 d4.1 ± 0.4 c5.1 ± 0.5 b6.0 ± 0.6 a
Dry season1.3 ± 0.2 a1.2 ± 0.1 a1.2 ± 0.2 a1.4 ± 0.2 a1.6 ± 0.2 a
Means on the same row followed by different letters are significantly different at p < 0.0.
Table 3. Mean ± SE of soil organic carbon content and stocks (SOCc and SOCs) and soil nitrogen content and stocks (Nc and Ns) at topsoil (0–0.05 m) under conventional tillage with free grazing (CTFG), no-tillage with free grazing (NTFG), no-tillage with no grazing (NTNG), no-tillage without crop residue mulching (NTNR) and no-tillage with controlled grazing (NTCG) before (January 2012) and after three years of the treatments’ implementation (May 2015). N = 9.
SOCc (g kg−1)SOCs (Mg C ha−1)Nc (g kg−1)Ns (Mg N ha−1)Sequestration Rate/Year
Treatments20122015201220152012201520122015RankSOCs
(Mg C ha−1)
RankNs
(Mg N ha−1)
NTCG18.3 ± 0.530.2 ± 1.0 a12.2 ± 0.718.8 ± 0.4 a1.5 ± 0.11.9 ± 0.1 ab10.1 ± 0.311.2 ± 0.411.4 a10.3 a
NTFG18. 3 ± 0.321.6 ± 0.4 b11.0 ± 1.012.5 ± 0.1 b1.5 ± 0.11.8 ± 0.1 ab10.0 ± 0.410.4 ± 0.620.4 b30.1 b
NTNG19. 2 ± 0.519.7 ± 0.3 c11.9 ± 0.411.1 ± 0.2 c1.6 ± 0.11.9 ± 0.1 a10.0 ± 0.510.9 ± 0.24−0.2 c20.2 a
NTNR18.8 ± 0.618.8 ± 0.5 c12.2 ± 1.110.7 ± 0.1 c1.6 ± 0.11.7 ± 0.1 ab10.2 ± 0.49.8 ± 0.45−0.4 c5−0.1 b
CTFG19.9 ± 0.919.9 ± 0.3 c12.5 ± 0.712.0 ± 0.1 c1.6 ± 0.11.6 ± 0.04 b10.4 ± 0.59.4 ± 0.23−0.1 c4−0.2 b
Means on the same column followed by different letters are significantly different at p < 0.05 level.
Publisher’s Note: MDPI stays neutral with regard to jurisdictional claims in published maps and institutional affiliations.

