Article

Identifying Suitable Genotypes for Different Cassava Production Environments—A Modeling Approach

by
Phanupong Phoncharoen
1,
Poramate Banterng
1,2,*,
Nimitr Vorasoot
1,
Sanun Jogloy
1,2,
Piyada Theerakulpisut
3 and
Gerrit Hoogenboom
4,5
1
Department of Agronomy, Faculty of Agriculture, Khon Kaen University, Khon Kaen 40002, Thailand
2
Plant Breeding Research Center for Sustainable Agriculture, Faculty of Agriculture, Khon Kaen University, Khon Kaen 40002, Thailand
3
Department of Biology, Faculty of Science, Khon Kaen University, Khon Kaen 40002, Thailand
4
Institute for Sustainable Food Systems, University of Florida, Gainesville, FL 32611, USA
5
Department of Agricultural and Biological Engineering, University of Florida, Gainesville, FL 32611, USA
*
Author to whom correspondence should be addressed.
Agronomy 2021, 11(7), 1372; https://doi.org/10.3390/agronomy11071372
Submission received: 5 May 2021 / Revised: 29 June 2021 / Accepted: 1 July 2021 / Published: 6 July 2021
(This article belongs to the Section Crop Breeding and Genetics)

Abstract

:
Crop simulation models can be used to identify appropriate genotypes and growing environments for improving cassava yield. The aim of this study was to determine the best genotypes for different cassava production environments using the cropping system model (CSM)–MANIHOT–Cassava. Data from cassava experiments that were conducted from 2009–2011 and 2014–2015 at Khon Kaen, Thailand, were used to evaluate the model. Simulations were then conducted for different scenarios using four cassava genotypes (Kasetsart 50, Rayong 9, Rayong 11, and CMR38–125–77), twelve planting dates (at monthly intervals starting in January and ending in December), and ten locations in Thailand under fully irrigated and rainfed conditions using 30 years of historical weather data. Model evaluation with the experimental data for total biomass and storage root yield indicated that the model classified well for relative productivity among different planting dates. The model indicated that growing cassava under irrigated conditions generally produced higher biomass and storage root yield than under rainfed conditions. The cassava genotype CMR38–125–77 was identified for high biomass, while the genotype Rayong 9 was identified as a good genetic resource for high yield. The December planting date resulted in the highest biomass for all locations, while the February planting date produced the highest storage root yield for almost all locations. The results from this study suggest that the CSM–MANIHOT–Cassava model can assist in determining suitable genotypes for different cassava production environments for Thailand, and that this approach could be applicable to other cassava growing areas.

1. Introduction

Cassava (Manihot esculenta Crantz) is a commercial crop commonly used for human consumption, animal feed, and industrial products [1]. In addition, growth in the renewable fuel industries (bioethanol) has led to an increase in demand for cassava as a supply material. Thailand is recognized as an important cassava producer for the world market, and cassava can be grown all year round, primarily in the tropical wet or savanna climates of northeastern Thailand [2,3]. However, the average fresh storage root yield of cassava for the entire country is only about 23.1 t ha−1 [4], which is lower than the expected yield (80 t ha−1) [5]. Research into suitable cassava genotypes for particular growing environments would be a way to improve crop productivity and enhance farmers’ income, but it would require experimental data from many different environments.
The Decision Support System for Agrotechnology Transfer (DSSAT) is a computer program that comprises several crop models and allows researchers to simulate crop growth and development and predict potential yields for a range of production environments and management practices [6,7,8,9]. The models in DSSAT are physiologically based and simulate daily crop photosynthesis, respiration, biomass partitioning, growth, and crop development as a function of weather conditions, soil properties, management practices, and cultivar characteristics or genetic coefficients [7,10,11,12]. Potential applications of the DSSAT crop models for agricultural research have been reported for several approaches, for example, defining the suitable genotypes for peanut based on multienvironment yield trials [13,14,15], forecasting maize yield for the off-season in a subtropical environment [16], determining optimum management strategies for soybean [17], wheat [18], and rice [19], evaluating the impact of climate variability on wheat grain yield [20], examining the El Niño–Southern Oscillation effect on cotton yields at different planting dates and spatial aggregation levels [21], and estimating seasonal fragrant rice production in Thailand [22].
The cropping system model (CSM)–MANIHOT–Cassava model is one of the cassava models that has been incorporated into the cropping system model [8] of the DSSAT (www.dssat.net, accessed on 1 March 2021) and can be used as an innovative tool for strategic and tactical analysis [9,23]. The most recent, improved CSM–MANIHOT–Cassava model was released in DSSAT v 4.7.5 [24]. The model can be used to determine crop management for improving cassava productivity, and it has been used to determine the nitrogen requirements for cassava in Thailand [25]. It has also been evaluated on the basis of the growth and yield of cassava grown under upland conditions in Thailand for different planting dates [26] and for cassava grown in paddy fields following rice [27]. Although there are studies that have shown the potential of the CSM–MANIHOT–Cassava model, reports on the potential of this model to help identify suitable cassava genotypes and appropriate growing environment is limited. Additional research is still needed to confirm the model’s credibility in simulating the response of cassava in different environments. The objective of this study was to evaluate the CSM–MANIHOT–Cassava model in determining the most suitable genotypes for cassava production environments in northeastern Thailand.

2. Materials and Methods

2.1. Evaluation of the CSM–MANIHOT–Cassava Model

The input data required for the CSM–MANIHOT–Cassava model in DSSAT v 4.7.5 (DSSAT Foundation, Gainesville, Florida, USA) to simulate cassava growth and development include daily weather data, soil physical and chemical properties, crop management practices, and cultivar-specific information [28]. Experimental data from previous experiments conducted in Khon Kaen, Thailand, were used to evaluate the performance of the model. The experiments were carried out from 2009 until 2011. The cassava genotypes Kasetsart 50 and Rayong 9 were evaluated under irrigated conditions planted on November 2009, April 2010, and July 2010 [29]. The cassava genotypes Kasetsart 50, Rayong 9, and Rayong 11 were grown under rainfed conditions and with different rates of nitrogen application planted on December 2014 and June 2015 [30]. The genetic coefficients were obtained from a study by Phoncharoen et al. [26]. Model evaluation was performed by comparing the simulated values and observed values of total and storage root dry weights. The Pearson correlation coefficient (r), the index of agreement (d-index), and normalized root mean square error (nRMSE) were used to describe the agreement between the simulated and observed results. The r values were determined using Equation (1) [31]. The d-index values were calculated by Equation (2) [32]. The root mean square error values (RMSE) (Equation (3)) were computed and the values for the normalized root mean square error (nRMSE) were then calculated as the percentage values of the RMSE values divided by observed means (Equation (4)) [33]. The equations for the statistical parameters are the following:
r = i = 1 n ( P i P ¯ ) ( O i O ¯ ) i = 1 n ( P i P ¯ ) 2 i = 1 n ( O i O ¯ ) 2
d index = 1 [ i = 1 n ( P i O i ) 2 i = 1 n ( | P i | + | O i | ) 2 ]
RMSE = i = 1 n ( P i O i ) 2 n
n RMSE = RMSE   × 100 O ¯
where n is the number of observations. Pi and Oi are simulated values and observed values, respectively. Pi = Pi − Ō and Oi = Oi − Ō. P ¯ and Ō are the mean of the simulated and observed variables, respectively.
The r values range from −1 to 1, where the value of 1 indicates a perfect linear association between the simulated and observed data. The d-index values range from 0 to 1, and a value of 1 indicates a perfect match. A low nRMSE value indicates a good match between the simulated and observed values. An nRMSE value of less than 10% is considered as “perfect” agreement; “good” if the nRMSE value is more than 10% and less than 20%; “moderate” if between 20% to 30%; and “poor” if the nRMSE value is more than 30% [20,34,35].

2.2. Model Application

Following the evaluation of the CSM–MANIHOT–Cassava model, a scenario analysis was conducted by analyzing the performance of four genotypes for ten locations and twelve planting dates under both irrigated and rainfed conditions. For each location, 30 years of daily historical weather data from 1988 to 2018 were used, resulting in a total of 960 unique simulations (10 locations × 4 genotypes × 12 planting dates × 2 water managements). The selected ten locations are the most important cassava production regions in Thailand (Table 1 and Figure 1). Soil chemical and physical properties for the ten locations were obtained from the Department of Land Development, Thailand. At a soil depth of 0–30 cm, the soil bulk density varied from 1.37 to 1.70 g cm−3 and the soil pH ranged from 4.8 to 5.8.
The climatic data were obtained from the Meteorological Department, Thailand, and includes daily maximum and minimum temperatures and daily total rainfall. The daily solar radiation was estimated based on the information of latitude, longitude, elevation, and air temperature for all locations using the methodology developed by Phakamas et al. [36]. The climate in northeastern Thailand is classified as tropical wet or savanna [2]. The weather conditions during the hot season (mid-February to mid-May), rainy season (mid-May to mid-October), and cool season (mid-October to mid-February) in the years 1988 to 2018 for the ten selected locations are shown in Table 1. There was a small difference in the daily average maximum temperature among the three seasons, and the hot season showed the highest average maximum temperature (ranging from 35.0 to 35.8 °C). The lowest values for average maximum temperature were recorded during the cool season (ranging from 30.3 to 32.0 °C) (Table 1). The average values for minimum temperature for the rainy season (23.7 to 24.8 °C) were slightly higher than the hot season (22.9 to 24.1 °C). The values for solar radiation during the hot season were higher than the rainy and cool seasons. However, estimated solar radiation during the rainy season was slightly lower than the cool season. The average rainfall during the rainy season ranged from 810.3 to 1333.2 mm. There was also a small rainfall during the cool season and the hot season.
The four cassava genotypes were Kasetsart 50, Rayong 9, Rayong 11, and CMR38–125–77. The genetic coefficients of these four genotypes were obtained from a study by Phoncharoen et al. [26]. The planting dates were set at monthly intervals, starting on 1st January until 1st December. There were two water management conditions, including fully irrigated and rainfed. For the full irrigation scenario, we used the “fixed amount automatic” option of the DSSAT. A fixed amount of 20 mm of supplemental irrigation was applied when the total available soil water in the top 30 cm of the soil depth dropped below 80%. The total growing season length for all scenarios was set at 12 months. The simulated total biomass and yield were analyzed statistically using the analysis of variance technique. Treatment means comparisons were carried out by the least significant difference (LSD) method. All statistical analyses were performed by using Statistix 10 software [37], following Gomez and Gomez [31].

3. Results and Discussion

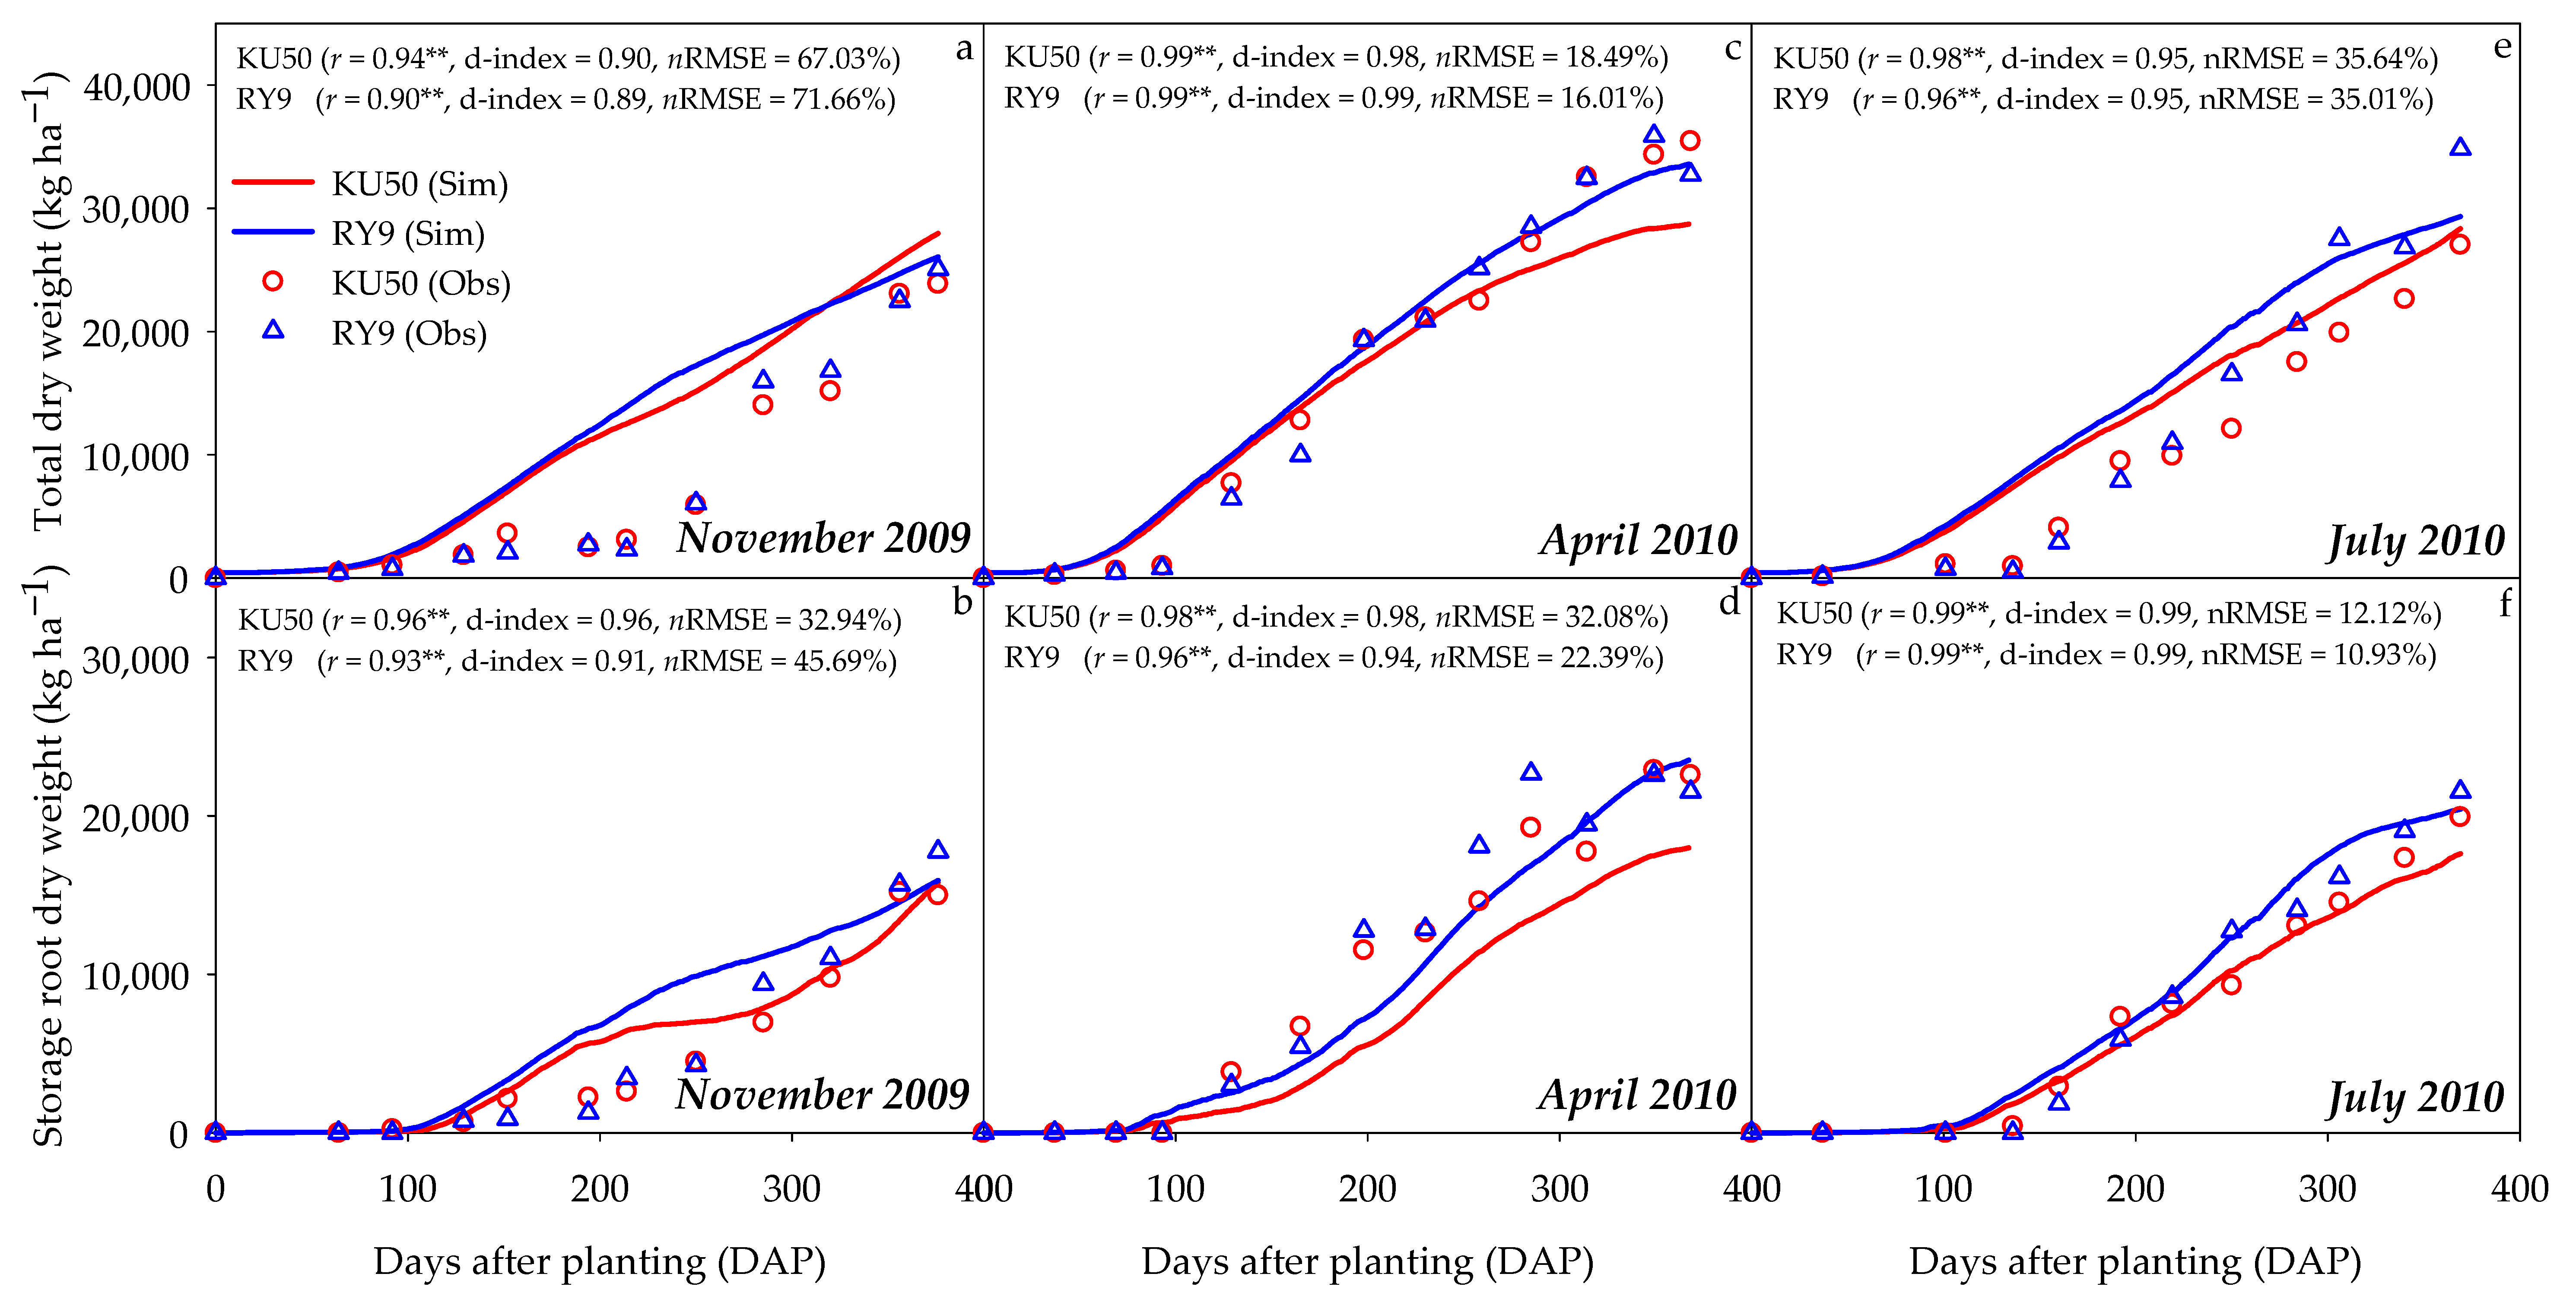
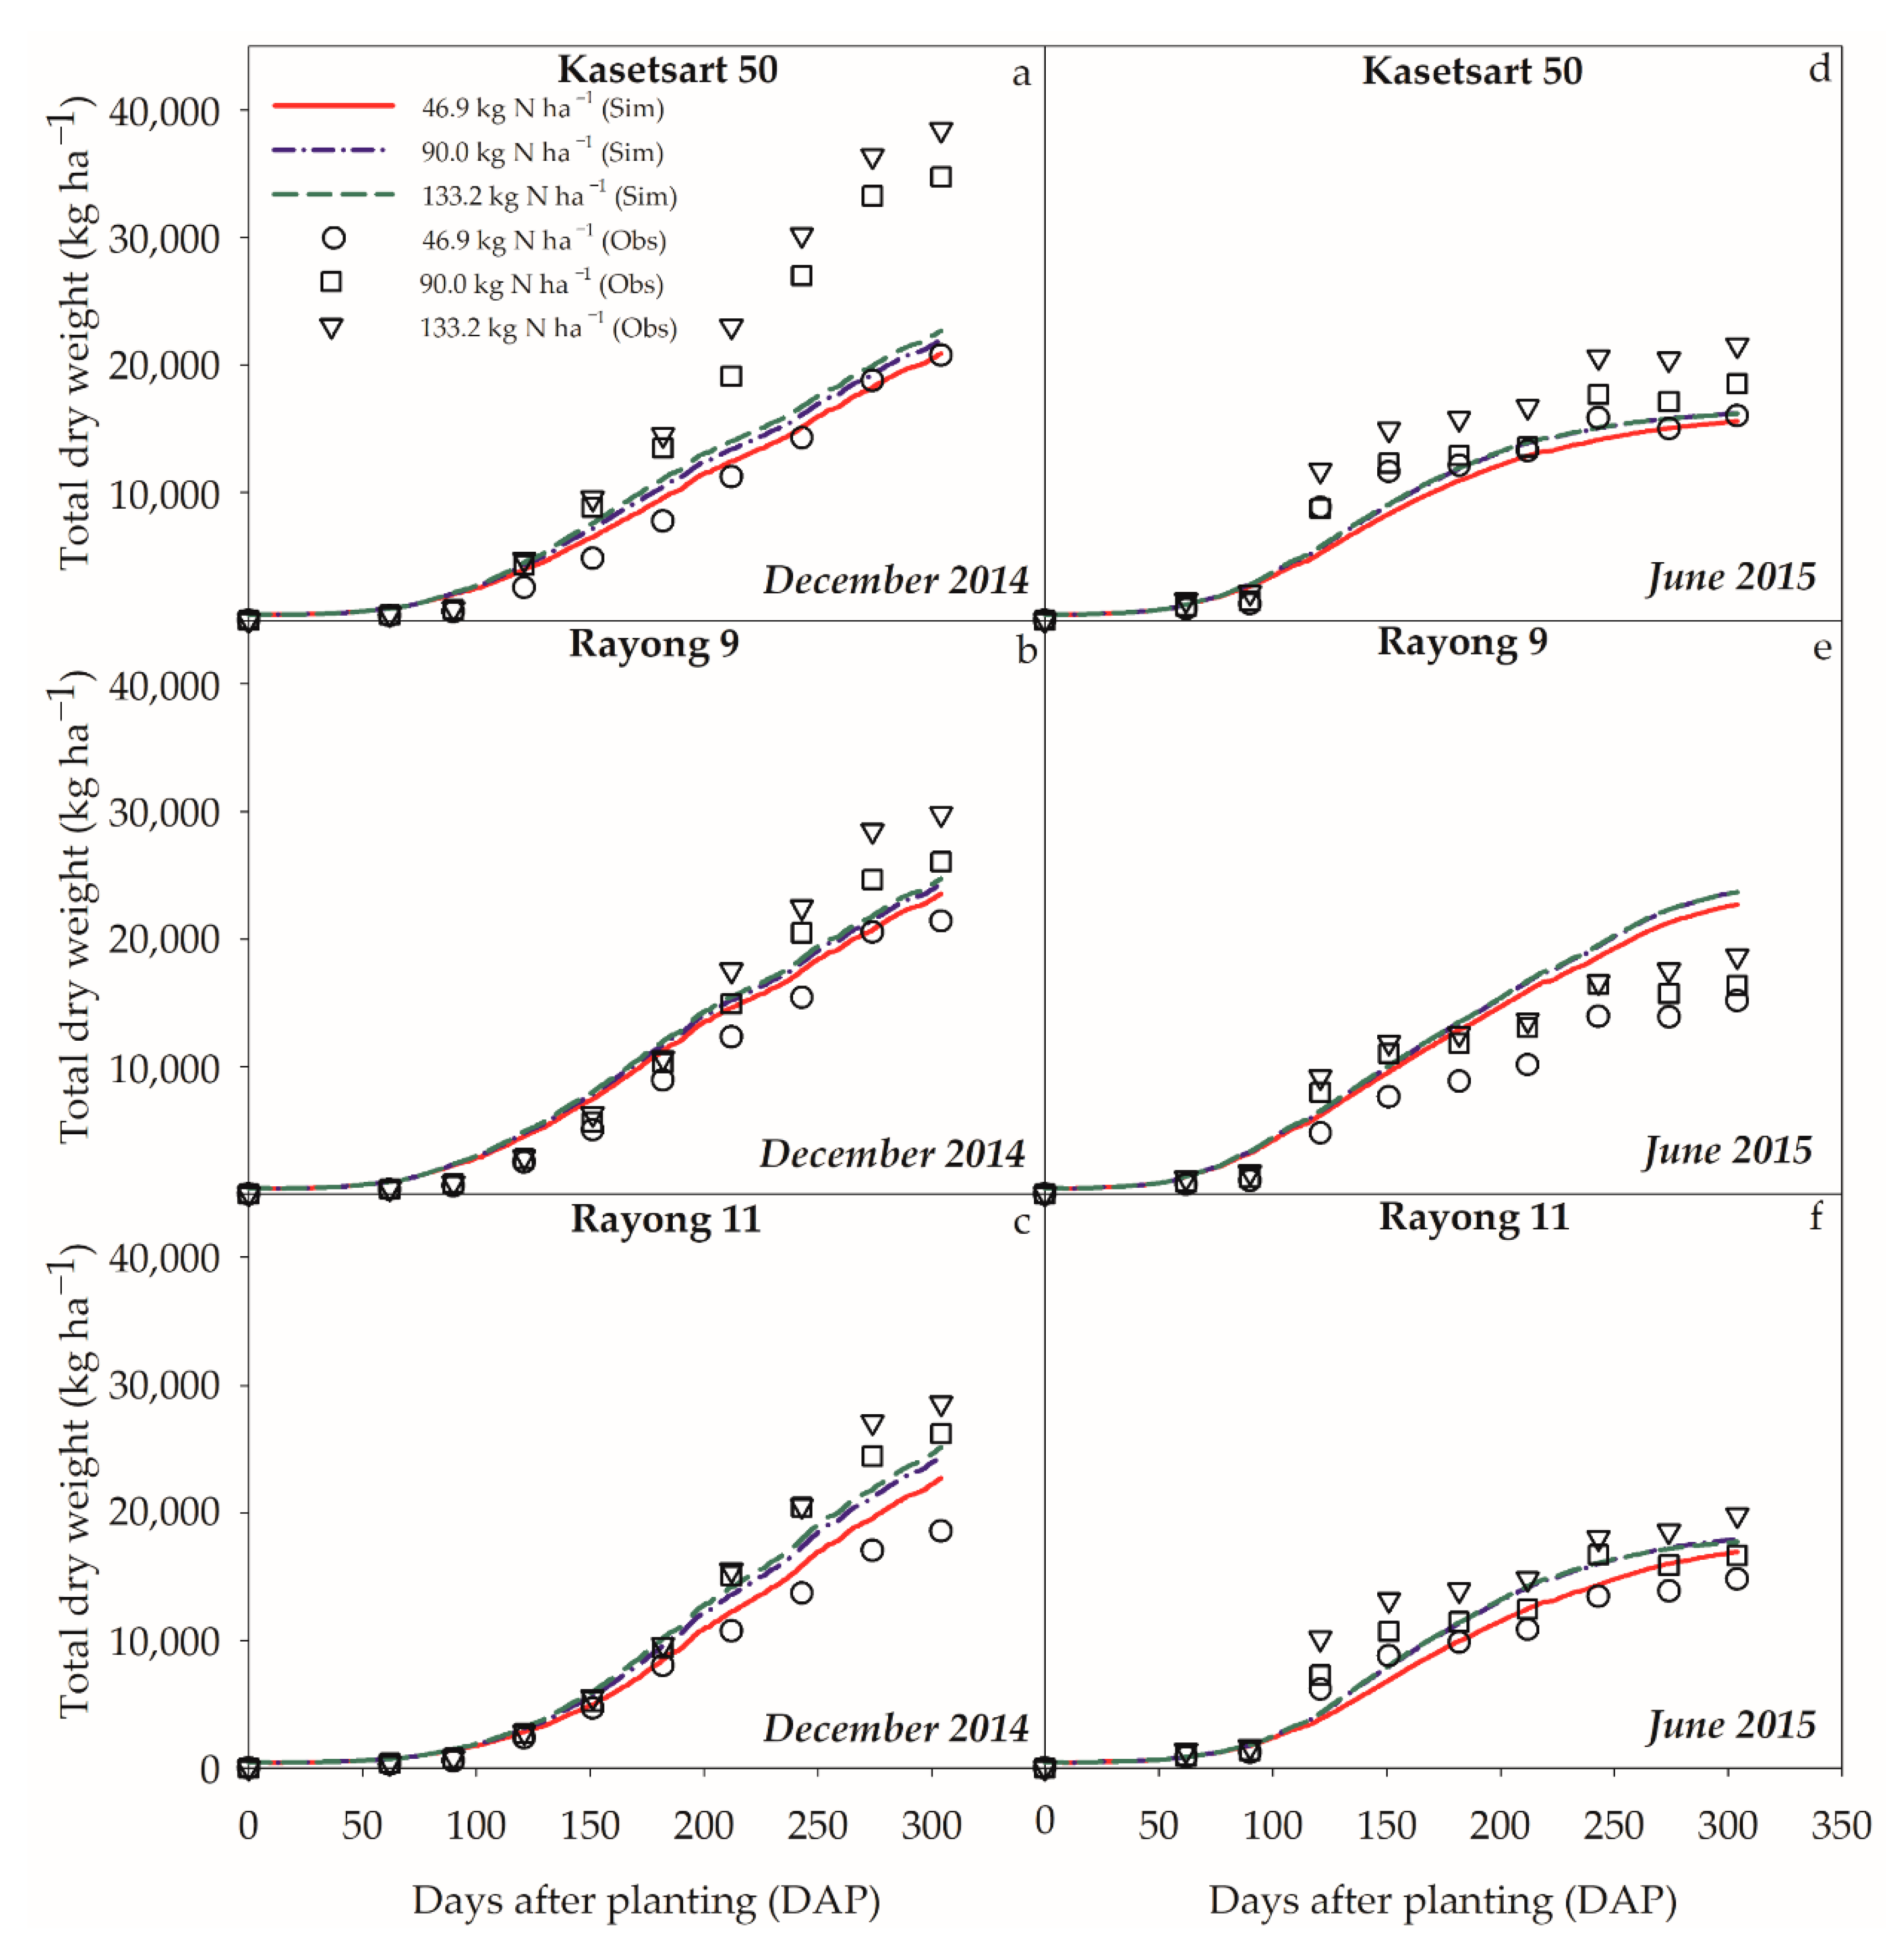
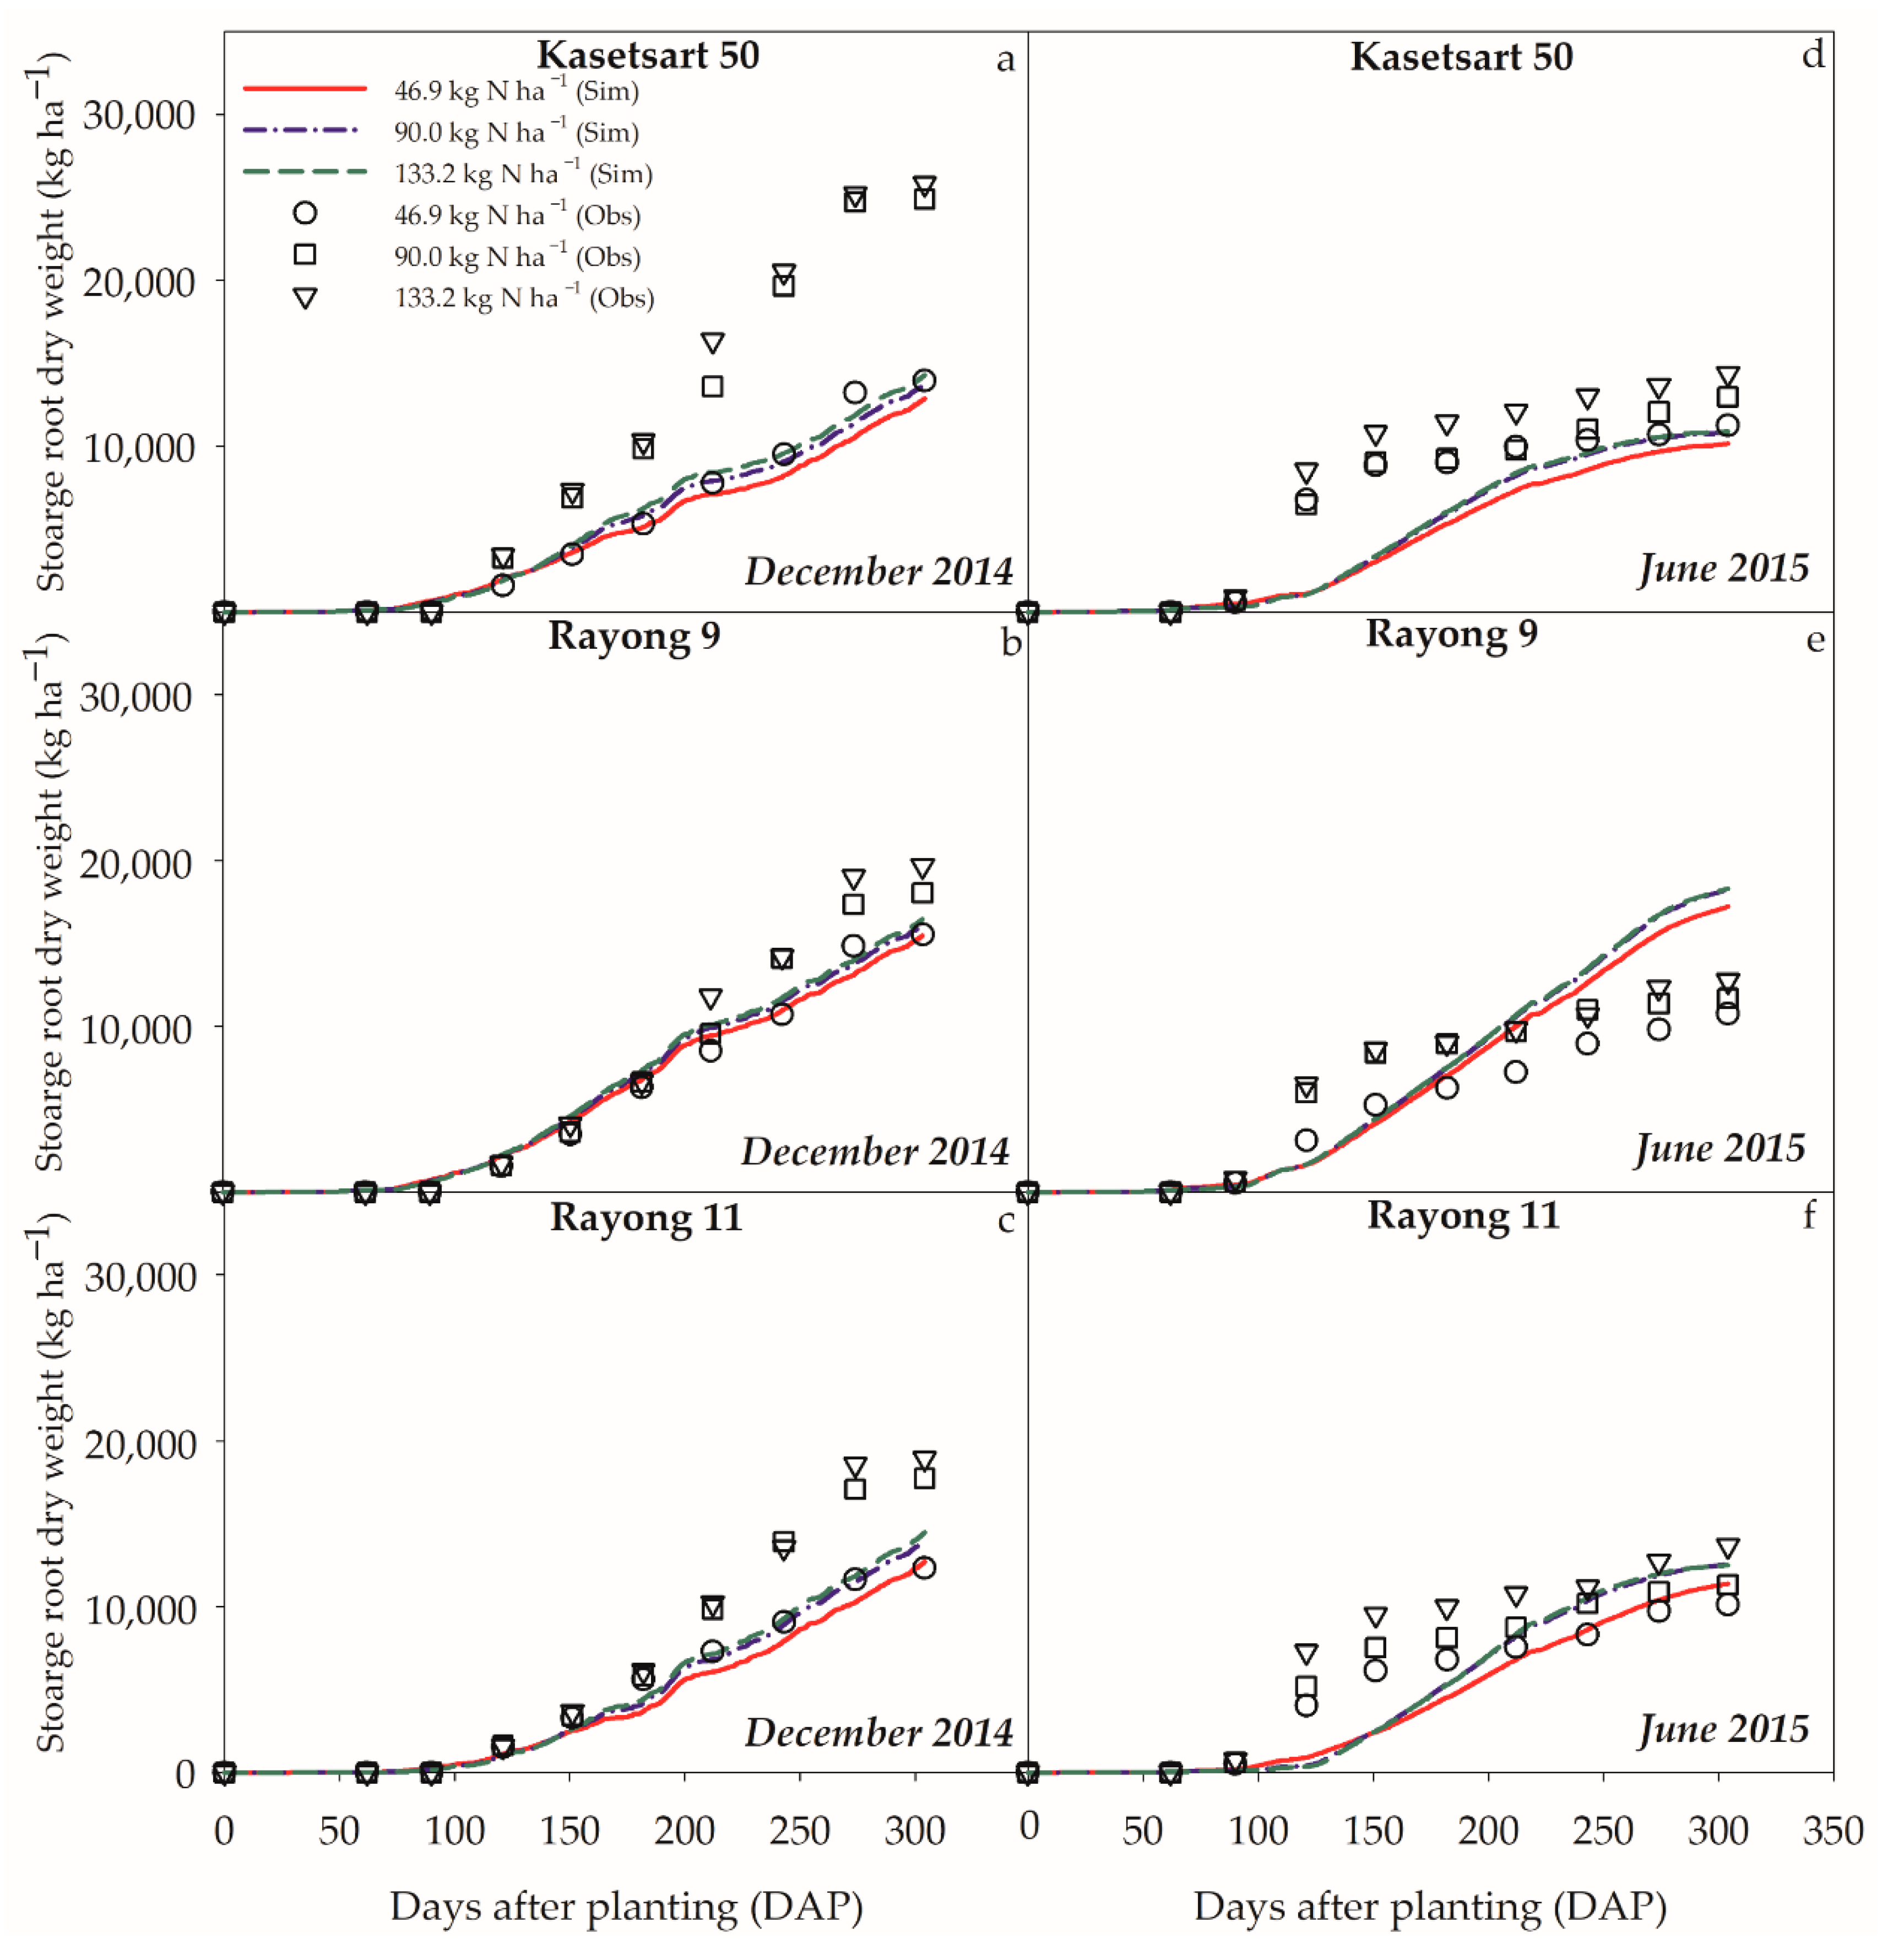
3.1. Model Evaluation

The performance of the CSM–MANIHOT–Cassava model was evaluated using datasets obtained from experiments conducted from 2009 until 2011 and from 2014 until 2015 in Khon Kaen, Thailand. Comparisons between simulated and observed data of total and storage root dry weights are shown in Figure 2, Figure A1 and Figure A2, and Table 2. Based on the experimental data conducted from 2009 until 2011 (Figure 2), good agreements between the simulated and observed total biomass and storage root dry weights were recorded for almost all comparisons, with r values ranging from 0.90–0.99, d-index values ranging from 0.88–0.95, and nRMSE values ranging from 14.30–70.04%. Although the model overestimated the total dry weight of the genotypes Kasetsart 50 and Rayong 9 for the November 2009 planting date and showed high nRMSE values, the simulated values for total crop dry weight matched the observed values for final harvest (Figure 2a). The differences between the simulations and field observations during 2009 to 2011 may have occurred due to certain environmental factors that were not simulated by the model, such as disruptions by pests and disease and some chemical and physical soil conditions [7]. Although the experiments were carefully managed, a minor pest distribution in the experimental field was observed. According to the comparison of the relative productivity based on final harvest data among the three different planting dates, however, both results from the model and field experiment indicated that the April planting date gave the highest total crop dry weights (31,146 and 34,083 kg ha−1 for simulation and field observations, respectively) and storage root dry weights (20,752 and 22,052 kg ha−1 for simulation and field observations, respectively), followed by the July and November planting dates, respectively (data not shown). The results from an actual experiment in Thailand by Phoncharoen et al. [38] indicated that the April and November planting dates also had high biomass accumulation as compared to the other planting dates. For relative performance based on final harvest data among the two genotypes, the model identified the genotype Rayong 9 as producing higher total crop and storage root dry weights (29,646 and 19,960 kg ha−1, respectively) when compared to Kasetsart 50 (28,338 and 17,132 kg ha−1, respectively), similar to the result from the actual experiment. The observed total crop and storage root dry weights for Rayong 9 were 30,867 and 20,266 kg ha−1, respectively, and for Kasetsart 50 were 28,787 and 19,164 kg ha−1, respectively.
For the experiments conducted from 2014 until 2015 for two different planting dates and three nitrogen application rates, there were good to poor agreements between the simulated and observed total crop and storage root dry weights for the genotypes Kasetsart 50, Rayong 9, and Rayong 11, with r values ranging from 0.85–1.00, the values of the d-index varying from 0.73–0.99, and the values of nRMSE ranging from 9.91–56.05% (Figure A1 and Figure A2, and Table 2). As previously mentioned, the effect of pests on cassava growth and yield that is not included in the model [7] contributed to the differences between the simulated and observed data. In addition, there were large differences between the simulation and field observations for genotype Kasetsart 50 with the December planting date with higher rates of nitrogen fertilizer (90 and 133.2 kg ha−1), and more model evaluation for these conditions is necessary (Figure A1a in Appendix A). For all genotypes and nitrogen fertilizer applications, however, the results from both the model and actual experiments indicate that the December planting date gave higher total crop and storge root dry weights at final harvest (data not shown) in comparison to the June planting date, indication the potential of the model to capture the response of cassava genotypes to different planting dates. Phoncharoen et al. [38] also reported that the December planting date had a higher biomass accumulation due to high temperature and solar radiation during the linear phase, while low values of temperature and solar radiation relate to a lower biomass accumulation for the linear phase for the June planting date. Regarding the comparison of the relative performances of the simulated and observed final harvest data for Kasetsart 50, Rayong 9, and Rayong 11, the top genotype for the model was not the genotype identified by the actual experiment. This might be due to the effect of the nitrogen fertilizer, which causes discrepancies in the responses of cassava genotypes obtained from the model and field observations. Therefore, the potential of the CSM–MANIHOT–Cassava model to capture the performances of cassava genotypes in different nitrogen fertilizer management conditions is of interest for further investigation.
The genotype CMR38–125–77 was not evaluated in this study, as this genotype was not included in these trials. However, the model’s performance for this genotype has been previously reported by Phoncharoen et al. [26]. They found that the CSM–MANIHOT–Cassava model was able to simulate total crop and storage root dry weights for the genotypes Kasetsart 50, Rayong 9, Rayong 11, and CMR38–125–77 for different planting dates. Based on the results of the evaluation, it can be concluded that the CSM–MANIHOT–Cassava model has the potential to accurately simulate the biomass and yield of cassava for different planting dates.

3.2. Scenario Analysis

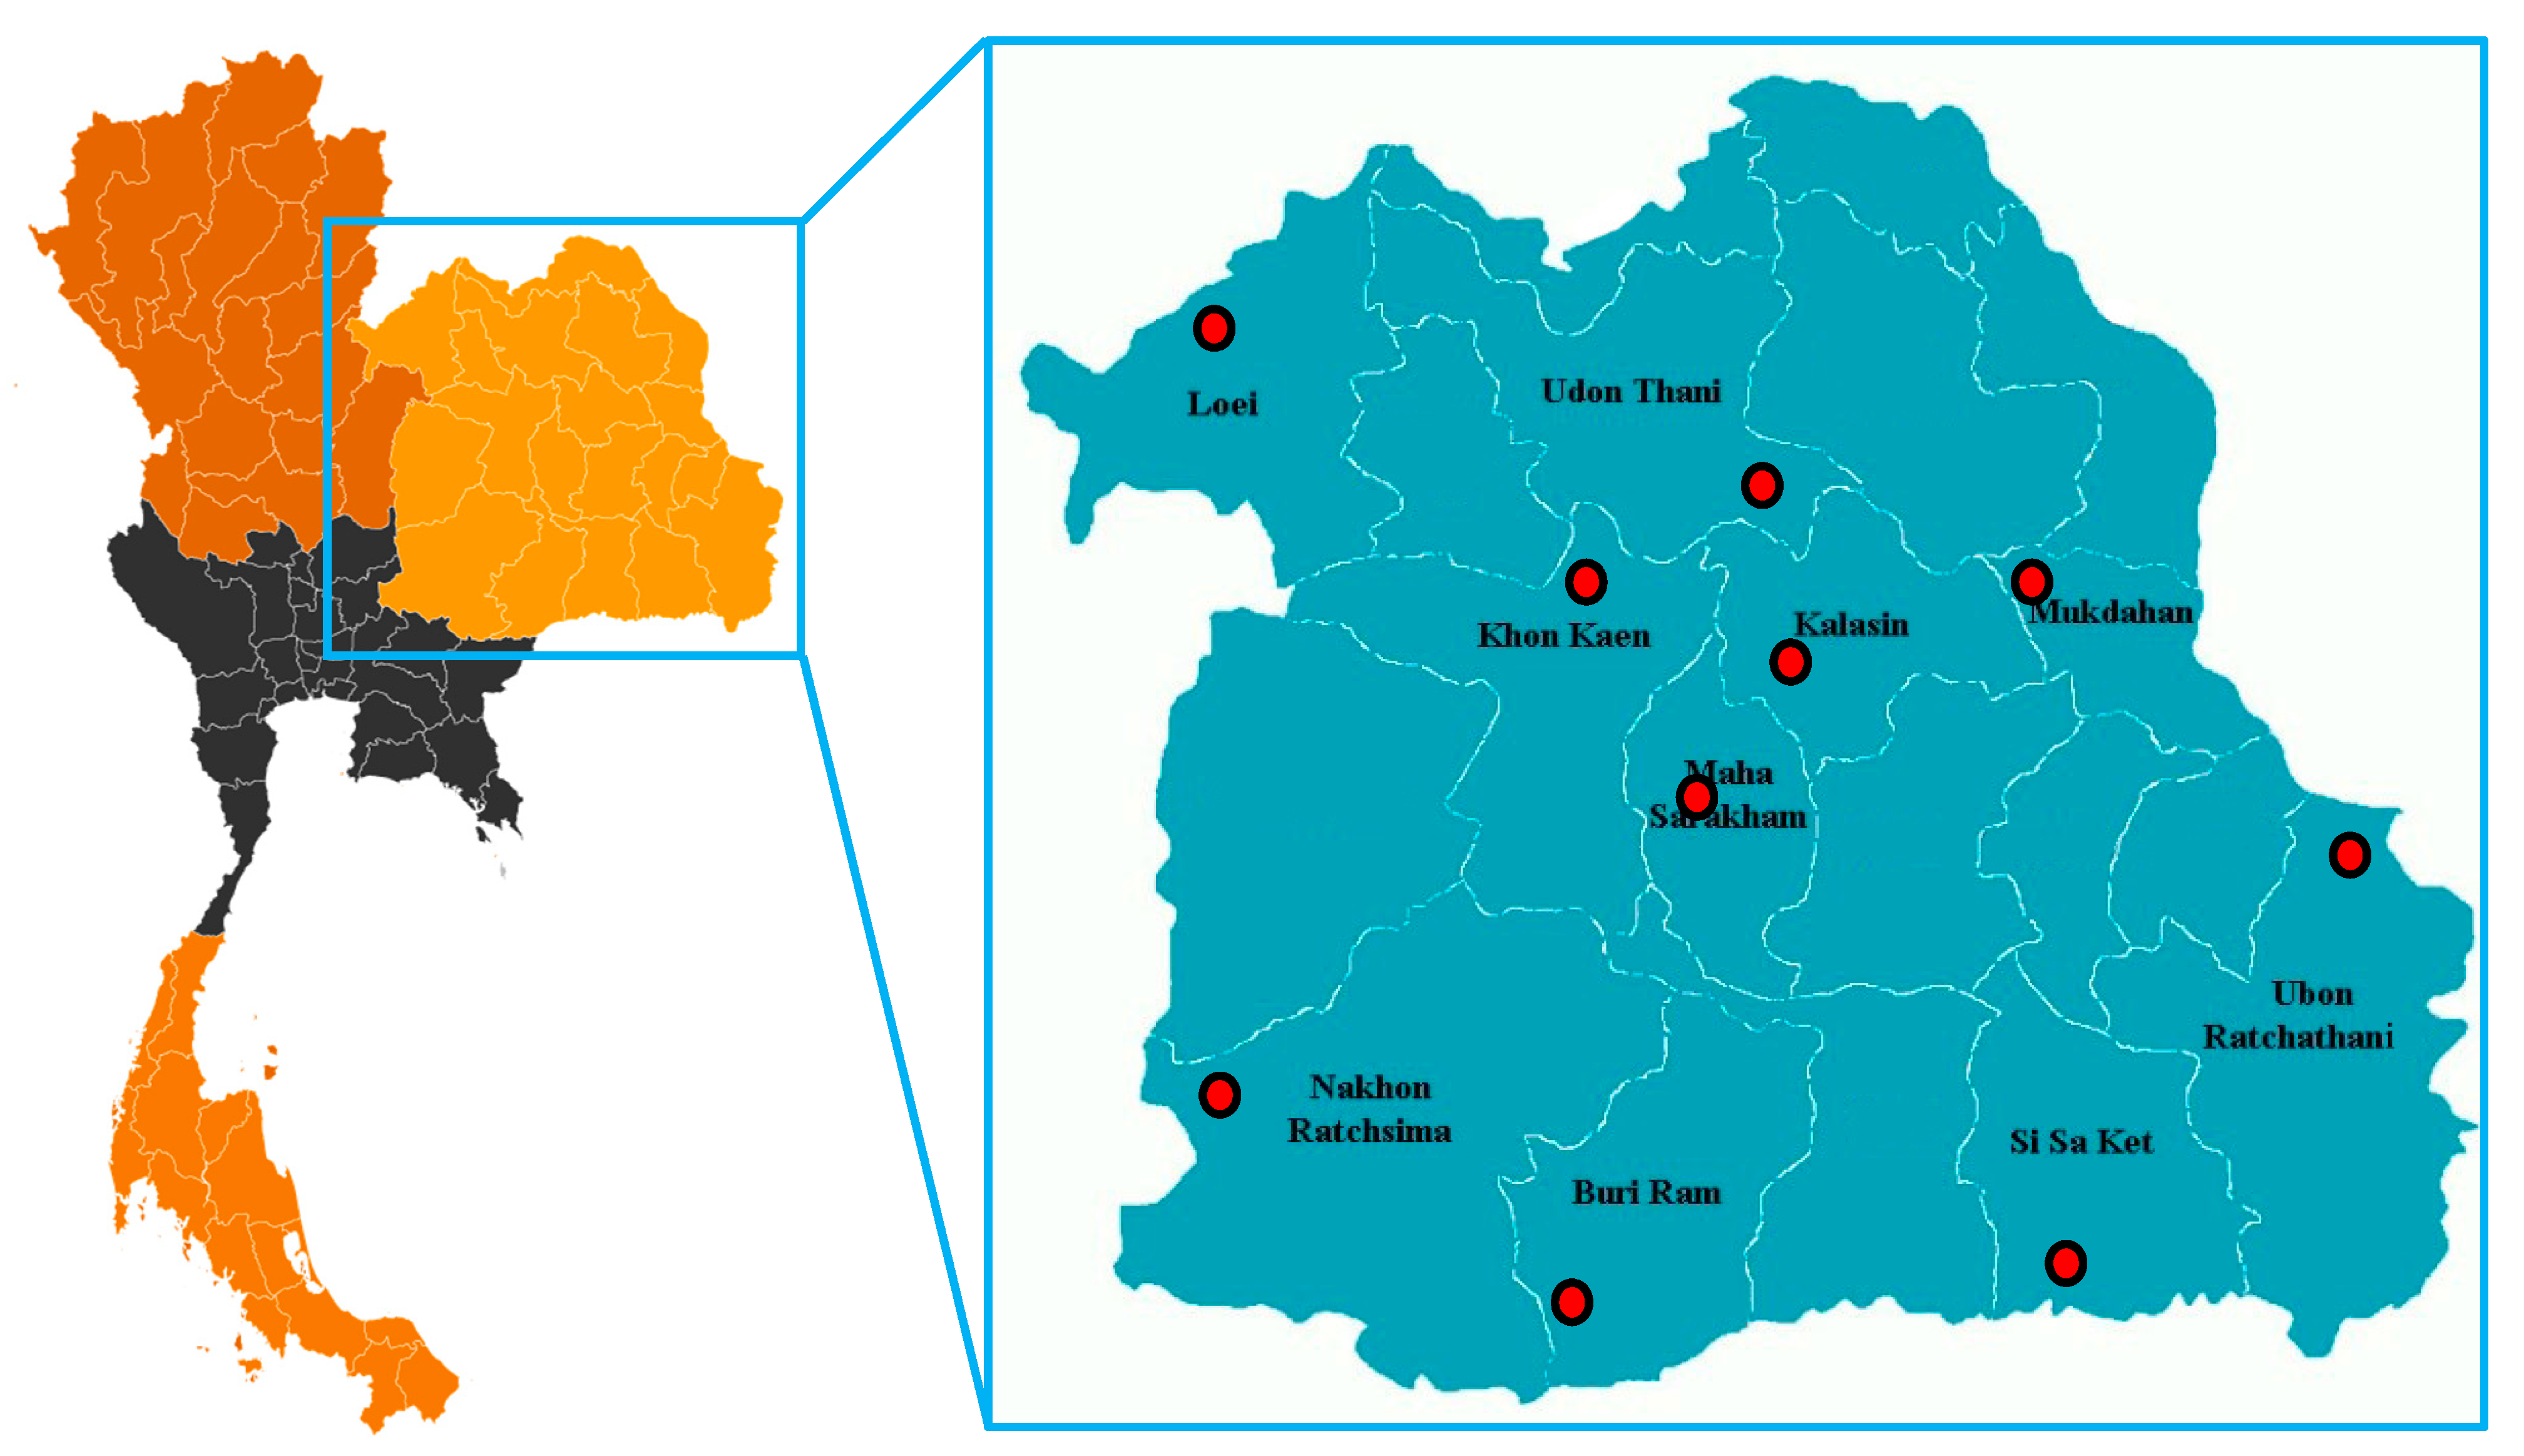
3.2.1. The Productivity among Locations

There were significant differences among the ten locations at p ≤ 0.05 (data not shown), with average total crop dry weights ranging from 30,656 to 33,670 kg ha−1 and average storage root dry weights ranging from 16,796 to 19,730 kg ha−1. The difference in certain input data for the model, i.e., saturated water content (SAT), drained upper limit of soil water content (DUL), lower limit of plant extractable plant extractable water (LL), solar radiation, temperature, and rainfall, caused the variation of the simulated output among locations. Low values of average solar radiation and maximum air temperature at Kalasin (17.2 MJ m−2 and 32.4 °C) (Table 1) seem to be related to lower average simulated total crop and storage root dry weights (30,656 and 16,796 kg ha−1) (Table 3 and Table 4) as compared to the other nine locations. The locations Loei, Maha Sarakham, and Ubon Ratchathani presented the highest average simulated total crop dry weights (33,567, 33,670, and 33,179 kg ha−1, respectively) and storage root dry weights (18,969, 19,730, and 19,511 kg ha−1, respectively), which can be explained by the higher values of average solar radiation observed (18.2 MJ m−2 for Loei, 18.5 MJ m−2 for Maha Sarakham, and 18.4 MJ m−2 for Ubon Ratchathani) (Table 1). Studies have shown that high solar radiation and air temperature during crop duration enhance cassava biomass and yield [30,39,40].

3.2.2. Yield Gap between Irrigated and Rainfed Conditions

Significant differences (p ≤ 0.05) for simulated total crop and storage root dry weights between rainfed and irrigated conditions were recorded (Table 3 and Table 4). Simulation under irrigated conditions showed higher total crop dry weights than under rainfed condition for all ten locations (Table 3). The simulated results revealed that growing under irrigated conditions increased crop total dry weight ranging from 18.3% to 28.9%. For simulated storage root dry weight, however, the differences between irrigated and rainfed conditions were small (Table 4). Irrigated conditions increased simulated storage root dry weights for almost all locations, with variations ranging between 2.5% to 6.6%. This variation indicates that the irrigation scenario for our study supports more simulated biomass accumulation for others plant parts rather than simulated storage root growth. In addition, simulation under rainfed conditions for locations at Kalasin, Khon Kaen, and Loie showed slightly higher simulated storage root dry weights than under irrigated conditions with the difference in values between rainfed and irrigated conditions being 0.6%, 2.8%, and 8.4%, respectively (Table 4). For these three locations, supplementary irrigation might not be an important strategy for improving cassava productivity. Overall, however, the long-term simulation results showed that irrigation generally resulted in more growth and provided high storage root dry weights for cassava, while rainfed conditions limited crop biomass and yield (Table 3 and Table 4).

3.2.3. Performances of the Four Cassava Genotypes

The differences between the four cassava genotypes (p ≤ 0.05) were observed for simulated total crop and storage root dry weights (Table 3 and Table 4). Since the storage root of cassava is normally used as the raw material for industry and the stem plays an important role as the source for next cultivation, not only storage root dry weight but total dry weight is also an important criterion for the cultivar selection. In addition, the other parts of cassava, such as leaves, petiole, and rhizome, can be also used as feed and bioenergy. The genotypes with the best photosynthate accumulation for both shoot and storage root organs, therefore, are the desirable genetic resources for this multipurpose cassava. The model presented that the genotype CMR38–125–77 had the highest values for simulated total crop dry weight with the second order in terms of simulated storage root dry weight. The preferable performances for the genotype CMR38–125–77 under growing conditions of upper paddy fields during the off-season of rice have been reported in terms of chlorophyll fluorescence [41] and based on crop growth rate [42]. Wongnoi et al. [43] also reported that the genotypes CMR38–125–77 had good physiology and total crop dry weight. Therefore, it is clear that the CMR38–125–77 genotype was the superior genotype for biomass production (Table 3).
The Rayong 9 genotype presented the highest values for simulated storage root dry weight when compared with the other three genotypes for both irrigated and rainfed conditions for all ten locations (Table 4). Phoncharoen et al. [44] also reported that the genotype Rayong 9 had high values of storage root yield and harvest index due to its high capability of partitioning photosynthates to sink. Santanoo et al. [45] indicated that the genotype Rayong 9 grown under irrigated conditions had a high net photosynthesis rate. The positive correlation between leaf net photosynthetic rate and storage root yield has been reported by El-Sharkawy [46,47].

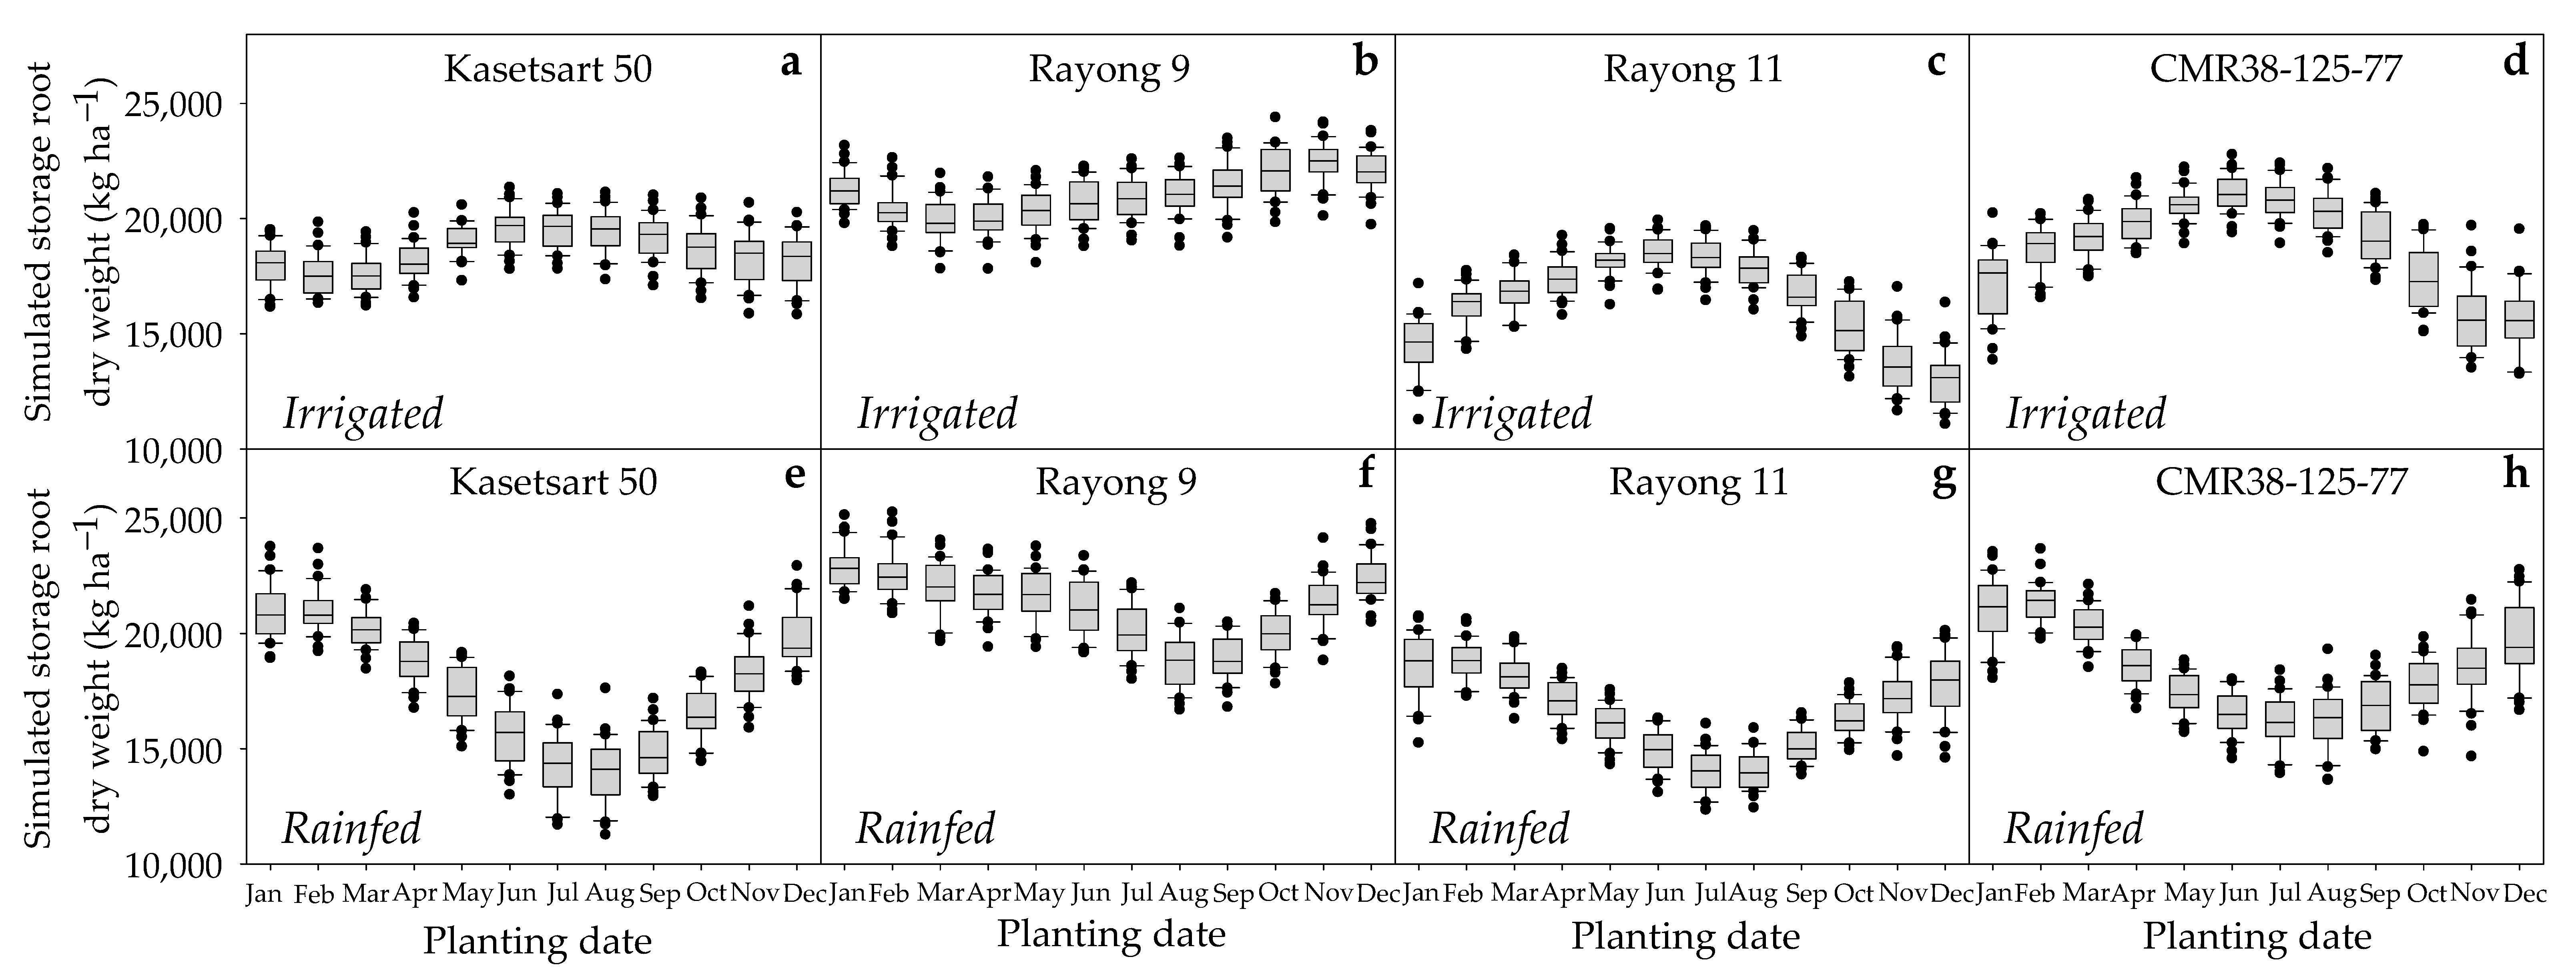
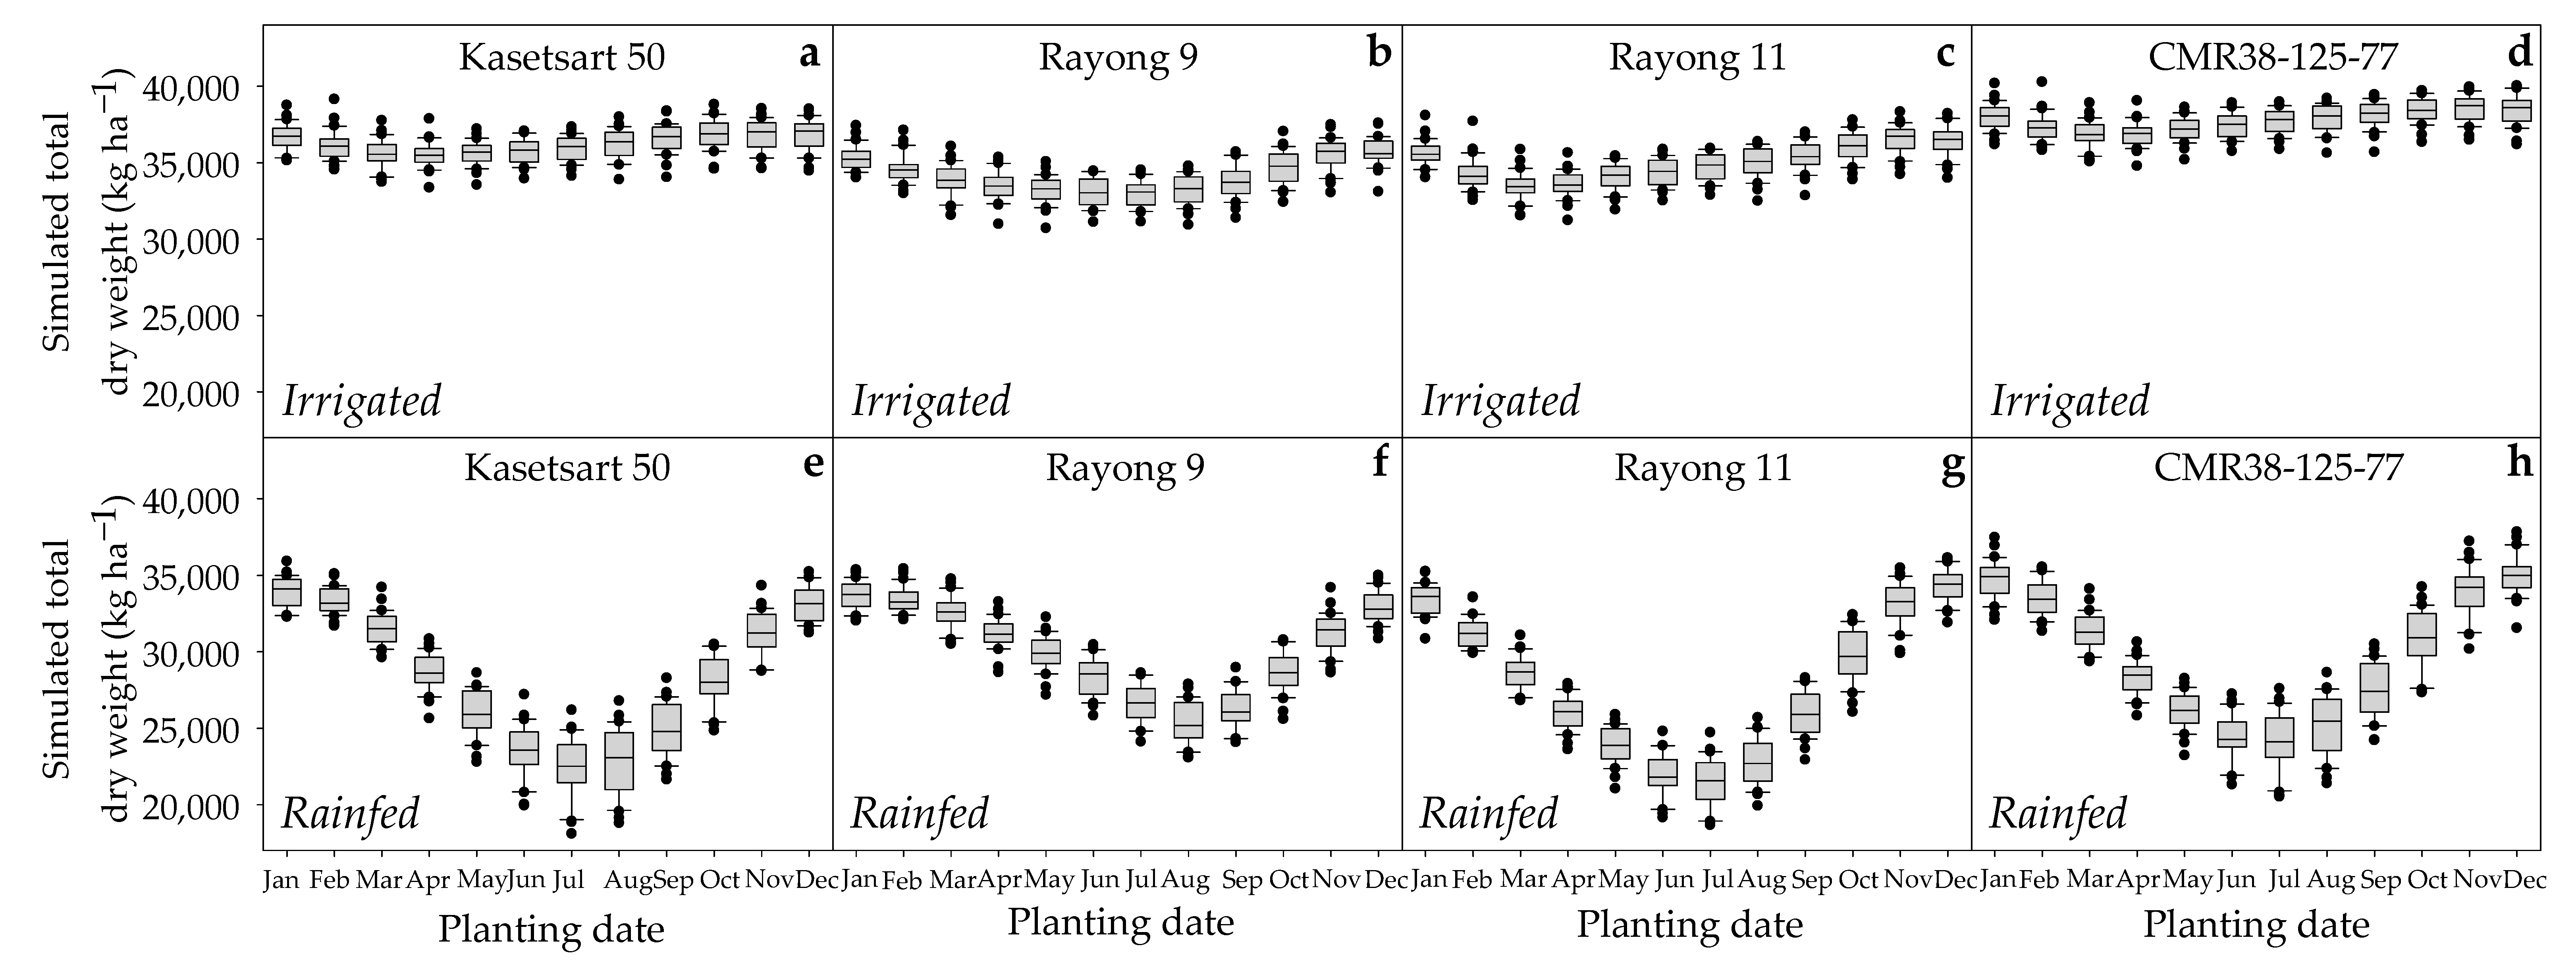
3.2.4. Variation of Cassava Productivity across Planting Dates

There were significant differences (p ≤ 0.05) for the simulated total crop and storage root dry weights between the 12 planting dates (Table 3 and Table 4). The December planting date resulted in the highest simulated total crop dry weight for all ten locations, and the January planting date showed a high simulated total crop dry weight for almost all locations, except for Maha Sarakham, Mukdahan, and Udon Thani (Table 3). The high mean values for the simulated total dry weights for the December planting date in our study correspond to a report based on actual experiments in Thailand by Phoncharoen et al. [38], who indicated that high temperature and solar radiation during the bulking period (linear phase) for the December planting date increased cassava growth and biomass. Keating et al. [39] also reported that crop growth rate increased with increasing temperatures and solar radiation. High values of solar radiation, mean annual temperature, and atmospheric humidity supported high photosynthesis and thus the growth of cassava [30,48]. Vongcharoen et al. [49,50] demonstrated that the highest photosynthesis capacity was found when the crop experienced warm temperatures during the rainy season in Thailand, during the bulking period of cassava planted in December. The higher net photosynthesis rate for cassava in warm, sub-humid climates as compared to cool, sub-humid climates was observed by El–Sharkawy et al. [51].
The February planting date was best to achieve the highest simulated storage root dry weight for almost all locations, except for Buri Ram (Table 4). The January planting date also showed the highest average values for simulated storage root dry weight for Maha Sarakham, Mukdahan, Nakhon Ratchasima, and Ubon Ratchathani. The model showed high simulated storage root dry weights in the March and April planting dates for the Buri Ram and Kalasin locations, and the March planting date was also suitable for the Loie location. Furthermore, the model showed the highest simulated storage root dry weight for the May planting date for Buri Ram. High temperature, solar radiation, and total amounts of rainfall during the growth stages of the high above-ground development and high carbohydrate translocation to the storage roots (Table 5) relate to high storage root yields for the January, February, and March planting dates.

3.2.5. The Interaction between Planting Dates and Water Regimes

The means were not much different among the 12 planting dates for the simulated total crop dry weights of each genotype under irrigated conditions at the ten locations over the 30-year period, but were for the simulated storage root dry weight (Figure 3 and Figure 4). This reveals that the different planting dates cause variation of the simulated storage root dry weights rather than simulated total crop dry weight, as reported previously by Phoncharoen et al. [26]. Under rainfed conditions, however, the model showed a large variation in crop performances among the 12 planting dates for both total crop and storage root dry weights (Figure 3 and Figure 4). The differences in the simulated biomass for different planting dates under irrigated conditions can be attributed to daily minimum and maximum temperatures and solar radiation. Under rainfed conditions, however, these climatic factors and rainfall were key in driving cassava growth and yields for the simulation [7]. The results from Figure 3 and Figure 4e–h also demonstrate the impact of rainfall for different planting dates on simulated crop growth. It was clearly evident that lower values of simulated total crop and storage root dry weights for planting dates in May, June, July, August, and September could be explained by lower total amounts of rainfall during the growth stages of high above-ground development and high carbohydrate translocation to the storage root (Table 5). In a recent field experiment in Thailand under rainfed conditions, Mahakosee et al. [52] found that a dry period during the late growing stages of cassava planted in May resulted in lower total crop biomass and storage root dry weights of the Rayong 9 genotype than for the December planting date.

3.2.6. The Interaction between Genotypes, Plating Dates, and Water Regimes

Different responses of cassava genotypes in different growing environment were observed (Figure 3 and Figure 4). A decrease in median was found in simulated storage root dry weights under rainfed conditions when planting was delayed until April, and this increased after the August planting date for the genotypes Kasetsart 50, Rayong 11, and CMR38–125–77 (Figure 4e,g,h). The planting dates from April to October showed an increased risk of low storage root dry weights for Kasetsart 50, Rayong 11, and CMR38–125–77. However, the Rayong 9 genotype under rainfed conditions showed a small decrease in storage root dry weight, and the results revealed that only the July to October planting dates seemed to be unsuitable for Rayong 9 (Figure 4f). High values of simulated storage root dry weights for plantings in May, June, July, and August under irrigated conditions for Rayong 11 and CMR38–125–77 (Figure 4c,d) indicate more partitioning from source rather than sink, which is a specific characteristic of the genotypes and related to high values of solar radiation and temperature during the late growing stages of cassava (Table 5).
In order to improve crop productivity, crop simulation models have been increasingly used to generate more datasets on crop responses to various growing environments and to help design strategic plans for crop cultivation, as these simulations involve less time and resources than an experimental approach. In addition, the models offer the opportunity to access the response of different genotypes to climatic conditions and soil properties, which are major concerns for researchers investigating potential genotypes for different growing seasons and soil types. Studies regarding the potential of crop models to identify suitable plating dates and genotypes have been undertaken with other crops such as wheat [18], peanut [13,54], soybean [17], rice [19], maize [16], and cotton [55]. The results from our study pointed to the potential of the CSM–MANIHOT–Cassava model to evaluate total crop and storage root dry weights and showed the ability of this model to determine suitable cassava genotypes and appropriate growing environments in Thailand. The CSM–MANIHOT–Cassava model might also be used as a supporting tool to select appropriate cassava genotypes and growing conditions for other areas that have weather conditions similar to Thailand.

4. Conclusions

The results of the CSM–MANIHOT–Cassava evaluation showed good agreement between simulated total crop biomass and storage root yields and their corresponding observed values, indicating the potential of the model as an additional tool to support decision making and strategic planning for cassava production. This study showed the potential of the CSM–MANIHOT–Cassava model to identify appropriate genotypes and growing environments in northeast Thailand. Model simulation under irrigated conditions resulted in high crop biomass for all environments and high storage root yields for almost all locations. The model indicated that the CMR38–125–77 genotype performed well in terms of crop biomass, and the Rayong 9 genotype had the highest values of storage root yield. The December planting date gave the highest values for the simulated total crop biomass for all locations, and the February planting date showed the highest simulated storage root yield for almost all environments.

Author Contributions

Conceptualization, P.P., P.B., N.V., S.J. and P.T.; data curation, P.P.; formal analysis, P.P. and P.B.; methodology, P.P., P.B., N.V., S.J. and P.T.; supervision, P.B.; investigation, P.P. and P.B.; writing—original draft preparation, P.P. and P.B.; writing—review and editing, P.P., P.B., N.V., S.J., P.T. and G.H.; software, G.H. All authors have read and agreed to the published version of the manuscript.

Funding

This research was supported by the Thai Royal Golden Jubilee Ph.D. Program (grant no. PHD/0012/2557) and the National Science and Technology Development Agency (NSTDA), Thailand. Assistance for conducting the field research was provided by the Plant Breeding Research Center for Sustainable Agriculture, Khon Kaen University, Thailand.

Institutional Review Board Statement

Not applicable.

Informed Consent Statement

Not applicable.

Data Availability Statement

Not applicable.

Acknowledgments

The authors appreciate the help provided by Carol J. Wilkerson.

Conflicts of Interest

The authors declare no conflict of interest.

Appendix A

Figure A1. Simulated (Sim) and observed (Obs) total dry weights for Kasetsart 50, Rayong 9, and Rayong 11 genotypes planted under three different rates of nitrogen application on December 2014 (ac), and June 2015 (d–f).
Agronomy 11 01372 g0a1
Figure A2. Simulated (Sim) and observed (Obs) storage root dry weights for Kasetsart 50, Rayong 9, and Rayong 11 genotypes planted under three different rates of nitrogen application on December 2014 (ac), and June 2015 (d–f).
Agronomy 11 01372 g0a2

References

  1. Howeler, R.H. Sustainable Soil and Crop. Management of Cassava in Asia; CIAT Publication: Hanoi, Vietnam, 2014. [Google Scholar]
  2. Kottek, M.; Grieser, J.; Beck, C.; Rudolf, B.; Rubel, F. World map of the Köppen-Geiger climate classification updated. Meteorol. Z. 2006, 15, 259–263. [Google Scholar] [CrossRef]
  3. Office of Agricultural Economics. Agricultural Statistics of Thailand, 2018; Office of Agricultural Economics: Bangkok, Thailand, 2018. [Google Scholar]
  4. FAO. FAOSTAT—Crops. 2020. Available online: http://www.fao.org/faostat/en/#data/QC (accessed on 14 October 2020).
  5. Howeler, R.H. Save and Grow: Cassava, a Guide to Sustainable Production Intensification; Food and Agriculture Organization of the United Nations: Rome, Italy, 2013. [Google Scholar]
  6. Hoogenboom, G.; Porter, C.H.; Boote, K.J.; Shelia, V.; Wilkens, P.W.; Singh, U.; White, J.W.; Asseng, S.; Lizaso, J.I.; Moreno, L.P.; et al. The DSSAT crop modeling ecosystem. In Advances in Crop Modeling for a Sustainable Agriculture; Boote, K.J., Ed.; Burleigh Dodds Science Publishing: Cambridge, UK, 2019; pp. 173–216. [Google Scholar]
  7. Hoogenboom, G.; Porter, C.H.; Shelia, V.; Boote, K.J.; Singh, U.; White, J.W.; Hunt, L.A.; Ogoshi, R.; Lizaso, J.I.; Koo, J.; et al. DSSAT—Decision Support System for Agrotechnology Transfer, version 4.7; DSSAT Foundation: Gainesville, FL, USA, 2019; Available online: www.DSSAT.net (accessed on 1 March 2021).
  8. Jones, J.W.; Hoogenboom, G.; Porter, C.H.; Boote, K.J.; Batchelor, W.D.; Hunt, L.A.; Wilkens, P.W.; Singh, U.; Gijsman, A.J.; Ritchie, J.T. The DSSAT cropping system model. Eur. J. Agron. 2003, 18, 235–265. [Google Scholar] [CrossRef]
  9. Tsuji, G.Y.; Hoogenboom, G.; Thornton, P.K. Understanding Options for Agricultural Production; Kluwer Academic Publishers: Dordrecht, The Netherlands, 1998. [Google Scholar]
  10. Jones, J.W.; Hoogenboom, G.; Wilkens, P.W.; Porter, C.H.; Tsuji, G.Y. Decision Support System for Agrotechnology Transfer, Version 4.5—DSSAT v.4.5: ICASA Tools; University of Hawaii: Honolulu, HI, USA, 2010; Volume 3. [Google Scholar]
  11. Jones, J.W.; Hoogenboom, G.; Wilkens, P.W.; Porter, C.H.; Tsuji, G.Y. Decision Support System for Agrotechnology Transfer, Version 4.0—DSSAT v.4.0: Crop. Model Documentation; University of Hawaii: Honolulu, HI, USA, 2010; Volume 4. [Google Scholar]
  12. Hoogenboom, G.; Jones, J.W.; Porter, C.H.; Wilkens, P.W.; Boote, K.J.; Batchelor, W.D.; Hunt, L.A.; Tsuji, G.Y. Decision Support System for Agrotechnology Transfer, Version 4—Overview; University of Hawaii: Honolulu, HI, USA, 2003; Volume 1. [Google Scholar]
  13. Banterng, P.; Patanothai, A.; Pannangpetch, K.; Jogloy, S.; Hoogenboom, G. Yield stability evaluation of peanut lines: A comparison of an experimental versus a simulation approach. Field Crops Res. 2006, 96, 168–175. [Google Scholar] [CrossRef]
  14. Putto, W.; Patanothai, A.; Jogloy, S.; Hoogenboom, G. Determination of mega-environments for peanut breeding using the CSM-CROPGRO-Peanut model. Crop Sci. 2008, 48, 973–982. [Google Scholar] [CrossRef]
  15. Phakamas, N.; Patanothai, A.; Pannangpetch, K.; Jogloy, S.; Hoogenboom, G. Determination of adaptive responses of peanut genotypes and patterns of genotype × location interaction using the CSM-CROPGRO-Peanut model. Int. J. Plant. Prod. 2010, 4, 223–234. [Google Scholar]
  16. Soler, C.M.T.; Sentelhas, P.C.; Hoogenboom, G. Application of the CSM-CERES-Maize model for planting date evaluation and yield forecasting for maize grown off-season in a subtropical environment. Eur. J. Agron. 2007, 27, 165–177. [Google Scholar] [CrossRef]
  17. Banterng, P.; Hoogenboom, G.; Patanothai, A.; Singh, P.; Wani, S.P.; Pathak, P.; Tongpoonpol, S.; Atichart, S.; Srihaban, P.; Buranaviriyakul, S.; et al. Application of the cropping system model (CSM)—CROPGRO-Soybean for determining optimum management strategies for soybean in tropical environments. J. Agron. Crop Sci. 2010, 196, 231–242. [Google Scholar] [CrossRef]
  18. Andarzian, B.; Hoogenboom, G.; Bannayan, M.; Shirali, M.; Andarzian, B. Determining optimum sowing date of wheat using CSM-CERES-Wheat model. J. Saudi Soc. Agric. Sci. 2015, 14, 189–199. [Google Scholar] [CrossRef] [Green Version]
  19. Vilayvong, S.; Banterng, P.; Patanothai, A.; Pannangpetch, K. CSM-CERES-Rice model to determine management strategies for lowland rice production. Sci. Agric. 2015, 72, 229–236. [Google Scholar] [CrossRef] [Green Version]
  20. Ahmed, M.; Akram, M.N.; Asim, M.; Aslam, M.; Hassan, F.; Higgins, S.; Stöckle, C.O.; Hoogenboom, G. Calibration and validation of APSIM-Wheat and CERES-Wheat for spring wheat under rainfed conditions: Models evaluation and application. Comput. Electron. Agric. 2016, 123, 384–401. [Google Scholar] [CrossRef]
  21. Paz, J.O.; Woli, P.; Garcia, A.G.; Hoogenboom, G. Cotton yields as influenced by ENSO at different planting dates and spatial aggregation levels. Agric. Syst. 2012, 111, 45–52. [Google Scholar] [CrossRef]
  22. Kaeomuangmoon, T.; Jintrawet, A.; Chotamonsak, C.; Singh, U.; Buddhaboon, C.; Naoujanon, P.; Kongton, S.; Kono, Y.; Hoogenboom, G. Estimating seasonal fragrant rice production in Thailand using a spatial crop modelling and weather forecasting approach. J. Agric. Sci. 2019, 157, 566–577. [Google Scholar] [CrossRef]
  23. Thornton, P.K.; Hoogenboom, G. A computer program to analyze single-season crop model outputs. Agron. J. 1994, 86, 860–868. [Google Scholar] [CrossRef]
  24. Moreno-Cadena, L.P.; Hoogenboom, G.; Fisher, M.J.; Ramirez-Villegas, J.; Prager, S.D.; Becerra Lopez-Lavalle, L.A.; Pypers, P.; Mejia de Tafur, M.S.; Wallach, D.; Muñoz-Carpena, R.; et al. Importance of genetic parameters and uncertainty of MANIHOT, a new mechanistic cassava simulation model. Eur. J. Agron. 2020, 115, 126031. [Google Scholar] [CrossRef] [PubMed]
  25. Kaweewong, J.; Tawornpruek, S.; Yampracha, S.; Yost, R.; Kongton, S.; Kongkeaw, T. Cassava nitrogen requirements in Thailand and crop simulation model predictions. Soil Sci. 2013, 178, 248–255. [Google Scholar] [CrossRef]
  26. Phoncharoen, P.; Banterng, P.; Moreno Cadena, L.P.; Vorasoot, N.; Jogloy, S.; Theerakulpisut, P.; Hoogenboom, G. Performance of the CSM-MANIHOT-Cassava model for simulating planting date response of cassava genotypes. Field Crop Res. 2021, 264, 108073. [Google Scholar] [CrossRef]
  27. Sawatraksa, N.; Banterng, P.; Jogloy, S.; Vorasoot, N.; Moreno Cadena, L.P.; Hoogenboom, G. Performance of a model in simulating growth and stability for cassava grown after rice. Agron. J. 2021. [Google Scholar] [CrossRef]
  28. Hoogenboom, G.; Jones, J.W.; Traore, P.C.S.; Boote, K.J. Experiments and data for model evaluation and application. In Improving Soil Fertility Recommendations in Africa Using the Decision Support Systems for Agrotechnology Transfers (DSSAT); Kihara, J., Fatondji, D., Jones, J.W., Hoogenboom, G., Tabo, R., Bationo, A., Eds.; Springer: Dordrecht, The Netherlands, 2012; pp. 9–18. [Google Scholar]
  29. Hinthong, Y.; Banterng, P. Evaluation of the potential of the CSM-CSCRP-Cassava model. Khon Kaen Agr. J. 2013, 41, 469–482. [Google Scholar]
  30. Phuntupan, K.; Banterng, P. Physiological determinants of storage root yield in three cassava genotypes under different nitrogen supply. J. Agric. Sci. 2017, 155, 978–992. [Google Scholar] [CrossRef]
  31. Gomez, K.A.; Gomez, A.A. Statistical Procedures for Agricultural Research; John Wiley and Sons: New York, NY, USA, 1984. [Google Scholar]
  32. Willmott, C.T. Some comments on the evaluation of model performance. Bull. Am. Meteorol. Soc. 1982, 63, 1309–1313. [Google Scholar] [CrossRef] [Green Version]
  33. Wallach, D.; Goffinet, B. Mean squared error of prediction as a criterion for evaluating and comparing system models. Ecol. Modell. 1989, 44, 299–306. [Google Scholar] [CrossRef]
  34. Yang, J.M.; Yang, J.Y.; Liu, S.; Hoogenboom, G. An evaluation of the statistical methods for testing the performance of a crop simulation model with observed data. Agric. Syst. 2014, 127, 81–89. [Google Scholar] [CrossRef]
  35. Li, Z.T.; Yang, J.Y.; Drury, C.F.; Hoogenboom, G. Evaluation of the DSSAT-CSM for simulating yield and soil organic C and N of a long-term maize and wheat rotation experiment in the Loess Plateau of Northwestern China. Agric. Syst. 2015, 135, 90–104. [Google Scholar] [CrossRef]
  36. Phakamas, N.; Jintrawet, A.; Patanothai, A.; Sringam, P.; Hoogenboom, G. Estimation of solar radiation based on air temperature and application with the DSSAT v4.5 peanut and rice simulation models in Thailand. Agric. For. Meteorol. 2013, 180, 182–193. [Google Scholar] [CrossRef]
  37. Analytical Software. Statistix, version 10; Analytical Software: Tallahassee, FL, USA, 2013. [Google Scholar]
  38. Phoncharoen, P.; Banterng, P.; Vorasoot, N.; Jogloy, S.; Theerakulpisut, P.; Hoogenboom, G. Growth rates and yields of cassava at different planting dates in a tropical savanna climate. Sci. Agric. 2019, 76, 376–388. [Google Scholar] [CrossRef] [Green Version]
  39. Keating, B.A.; Evenson, J.P.; Fukai, S. Environmental effects on growth and development of cassava (Manihot esculenta Crantz) II. Crop growth rate and biomass yield. Field Crop. Res. 1982, 5, 283–292. [Google Scholar] [CrossRef]
  40. Fukai, S.; Alcoy, A.B.; Llamelo, A.B.; Patterson, R.D. Effects of solar radiation on growth of cassava (Manihot esculenta crantz.). I. Canopy development and dry matter growth. Field Crop. Res. 1984, 9, 347–360. [Google Scholar] [CrossRef]
  41. Sawatraksa, N.; Banterng, P.; Jogloy, S.; Vorasoot, N.; Hoogenboom, G. Chlorophyll fluorescence and biomass of four cassava genotypes grown under rain-fed upper paddy field conditions in the tropics. J. Agron. Crop Sci. 2018, 204, 554–565. [Google Scholar] [CrossRef]
  42. Sawatraksa, N.; Banterng, P.; Jogloy, S.; Vorasoot, N.; Hoogenboom, G. Cassava growth analysis of production during the off-season of paddy rice. Crop Sci. 2019, 59, 760–771. [Google Scholar] [CrossRef]
  43. Wongnoi, S.; Banterng, P.; Vorasoot, N.; Jogloy, S.; Theerakulpisut, P. Physiology, growth and yield of different cassava genotypes planted in upland with dry environment during high storage root accumulation stage. Agronomy 2020, 10, 576. [Google Scholar] [CrossRef] [Green Version]
  44. Phoncharoen, P.; Banterng, P.; Vorasoot, N.; Jogloy, S.; Theerakulpisut, P.; Hoogenboom, G. The impact of seasonal environments in a tropical savanna climate on forking, leaf area index, and biomass of cassava genotypes. Agronomy 2019, 9, 19. [Google Scholar] [CrossRef] [Green Version]
  45. Santanoo, S.; Vongcharoen, K.; Banterng, P.; Vorasoot, N.; Jogloy, S.; Roytrakul, S.; Theerakulpisut, P. Canopy structure and photosynthetic performance of irrigated cassava genotypes growing in different seasons in a tropical savanna climate. Agronomy 2020, 10, 2018. [Google Scholar] [CrossRef]
  46. El-Sharkawy, M.A. Cassava biology and physiology. Plant. Mol. Biol. 2004, 53, 621–641. [Google Scholar] [CrossRef]
  47. El-Sharkawy, M.A. International research on cassava photosynthesis, productivity, eco-physiology, and responses to environmental stresses in the tropics. Photosynthetica 2006, 45, 399. [Google Scholar] [CrossRef]
  48. El-Sharkawy, M.A.; Cock, J.H.; Lynam, J.K.; Hernàndez, A.D.P.; Cadavid, L.F.L. Relationships between biomass, root-yield and single-leaf photosynthesis in field-grown cassava. Field Crops Res. 1990, 25, 183–201. [Google Scholar] [CrossRef]
  49. Vongcharoen, K.; Santanoo, S.; Banterng, P.; Jogloy, S.; Vorasoot, N.; Theerakulpisut, P. Seasonal variation in photosynthesis performance of cassava at two different growth stages under irrigated and rain-fed conditions in a tropical savanna climate. Photosynthetica 2018, 56, 1398–1413. [Google Scholar] [CrossRef]
  50. Vongcharoen, K.; Santanoo, S.; Banterng, P.; Jogloy, S.; Vorasoot, N.; Theerakulpisut, P. Diurnal and seasonal variations in the photosynthetic performance and chlorophyll fluorescence of cassava “Rayong 9” under irrigated and rainfed conditions. Photosynthetica 2019, 57, 268–285. [Google Scholar] [CrossRef] [Green Version]
  51. El-Sharkawy, M.A.; de Tafur, S.M.; Lopez, Y. Eco-physiological research for breeding improved cassava cultivars in favorable and stressful environments in tropical/subtropical bio-systems. Environ. Res. J. 2012, 6, 143–211. [Google Scholar]
  52. Mahakosee, S.; Jogloy, S.; Vorasoot, N.; Theerakulpisut, P.; Banterng, P.; Kesmala, T.; Holbrook, C.; Kvien, C. Seasonal variations in canopy size and yield of Rayong 9 cassava genotype under rainfed and irrigated conditions. Agronomy 2019, 9, 362. [Google Scholar] [CrossRef] [Green Version]
  53. Alves, A.A.C. Cassava botany and physiology. In Cassava: Biology, Production and Utilization; Hillocks, R.J., Thresh, J.M., Bellotti, A.C., Eds.; CABI Publishing: New York, NY, USA, 2002; pp. 67–89. [Google Scholar]
  54. Banterng, P.; Patanothai, A.; Pannangpetch, K.; Jogloy, S.; Hoogenboom, G. Determination and evaluation of genetic coefficients of peanut lines for breeding applications. Eur. J. Agron. 2004, 21, 297–310. [Google Scholar] [CrossRef]
  55. Rahman, M.H.; Ahmad, A.; Wajid, A.; Hussain, M.; Rasul, F.; Ishaque, W.; Islam, M.A.; Shelia, V.; Awais, M.; Ullah, A.; et al. Application of CSM-CROPGRO-Cotton model for cultivars and optimum planting dates: Evaluation in changing semi-arid climate. Field Crops Res. 2019, 238, 139–152. [Google Scholar] [CrossRef]
Figure 1. Location of selected study sites in northeast Thailand.
Agronomy 11 01372 g001
Figure 2. Simulated (Sim) and observed (Obs) total and storage root dry weights for Kasetsart 50 (KU50) and Rayong 9 (RY9) genotypes planted at November 2009 (a,b), April 2010 (c,d), and July 2010 (e,f). r = Pearson correlation coefficient, d–index = index of agreement, nRMSE = normalized root mean square error, ** = significant at p ≤ 0.01.
Agronomy 11 01372 g002
Figure 3. Means over ten locations and 30 years (1988–2018) of simulated total biomass for Kasetsart 50, Rayong 9, Rayong 11, and CMR38–125–77 at 12 different planting dates and under irrigated (ad) and rainfed conditions (eh). Box limits represent the 25th and 75th percentiles; box central line represents the median and the outliers represent the minimum and maximum values.
Agronomy 11 01372 g003
Figure 4. Means over ten locations and 30 years (1988–2018) of simulated storage root dry weight for Kasetsart 50, Rayong 9, Rayong 11, and CMR38–125–77 at 12 different planting dates and under irrigated (ad) and rainfed conditions (eh). Box limits represent the 25th and 75th percentiles; box central line represents the median and the outliers represent the minimum and maximum values.
Agronomy 11 01372 g004
Table 1. Geographical coordinate, soil type, and average over 30 years (1988–2018) for daily maximum air temperature (Max), minimum air temperature (Min), daily solar radiation, and total rainfall during the hot season (mid-February to mid-May), rainy season (mid-May to mid-October), and cool season (mid-October to mid-February) for the ten selected locations in Thailand.
LocationLatitude and LongitudeSoil TypeSoil TextureBulk Density
(g cm−3)
pHSeasonTemperature (°C)Solar Radiation
(MJ m−2)
Rainfall (mm)
0–30 cmMaxMin
Buri Ram14°24′ N, 102°36′ EChok Chai (Rhodic Kandiustox)Clay1.375.3Hot35.823.520.3212.5
Rainy31.723.716.21007.8
Cool30.918.917.380.5
Kalasin16°32′ N, 103°22′ EChom Phra (Paleustults)Loamy Sand1.704.8Hot35.123.319.9223.3
Rainy31.724.415.11145.1
Cool30.318.416.758.7
Khon Kaen16°47′ N, 102°41′ EBan Phai (Grossarenic Kandiustalf)Loamy Sand1.685.1Hot35.222.719.9207.8
Rainy32.723.817.3938.6
Cool31.018.316.964.1
Loie17°40′ N, 101°26′ ETha Li (Ultic Haplust)Loam1.505.8Hot35.021.320.6245.5
Rainy32.423.817.1946.9
Cool30.417.216.886.2
Maha Sarakham16°05′ N, 103°06′ EBan Phai (Grossarenic Kandiustalf)Loamy Sand1.685.1Hot35.823.520.4231.0
Rainy33.424.417.81034.3
Cool31.718.817.357.2
Mukdahan16°52′ N, 104°09′ EKorat (Paleustults)Sandy Clay Loam1.604.8Hot35.323.420.0202.1
Rainy32.724.616.31241.6
Cool30.818.717.044.2
Nakhon Ratchasima15°17′ N, 101°34′ EChum Phuang (Kandiustults)Sandy Loam1.684.8Hot35.724.119.9224.3
Rainy33.424.817.4810.3
Cool30.820.316.477.7
Si Sa Ket14°32′ N, 104°13′ EKorat (Paleustults)Sandy Clay Loam1.604.8Hot35.623.520.4196.1
Rainy32.524.716.01199.5
Cool31.219.417.156.1
Ubon Ratchathani16°03′ N, 105°09′ EChakkarat (Paleustults)Sandy Loam1.684.9Hot35.823.420.6209.6
Rainy32.724.316.91333.2
Cool32.019.517.664.6
Udon Thani17°05′ N, 103°24′ EKorat (Paleustults)Sandy Clay Loam1.604.8Hot35.322.920.2220.3
Rainy32.724.616.41169.4
Cool30.718.416.861.4
Table 2. The Pearson correlation coefficient (r), index of agreement (d-index), and normalized root mean square error (nRMSE) values for evaluation of the CSM–MANIHOT–Cassava model based on total and storage root dry weights for the three cassava genotypes under three different rates of nitrogen application on December 2014 and June 2015 planting dates.
GenotypeN Rate
(kg ha−1)
December 2014June 2015
Total Dry WeightStorage Root Dry WeightTotal Dry WeightStorage Root Dry Weight
rd-IndexnRMSErd-IndexnRMSErd-IndexnRMSErd-IndexnRMSE
Kasetsart 5046.91.00 **0.9913.260.99 **0.9815.780.96 **0.9716.910.86 **0.7939.44
90.00.99 **0.8648.360.99 **0.7056.050.97 **0.9717.130.90 **0.8335.93
133.20.99 **0.8353.580.99 **0.7055.610.97 **0.8931.020.88 **0.7345.03
Rayong 946.91.00 **0.9919.760.99 **0.999.910.99 **0.8756.010.97 **0.8555.34
90.00.99 **0.9916.190.99 **0.9718.740.96 **0.9236.610.88 **0.8444.64
133.20.99 **0.9725.370.99 **0.9523.170.96 **0.9526.440.90 **0.8640.54
Rayong 1146.91.00 **0.9817.570.99 **0.9815.870.98 **0.9817.570.93 **0.9229.12
90.01.00 **0.9915.180.99 **0.9034.800.97 **0.9815.180.90 **0.8933.88
133.21.00 **0.9922.990.99 **0.8935.910.96 **0.9522.990.85 **0.8041.48
** = significant at p ≤ 0.01.
Table 3. Simulated total dry weight (kg ha−1) for different treatment scenarios over 30 years (from 1988–2018) in ten locations in northeast Thailand.
TreatmentLocation
Buri RamKalasinKhon KaenLoeiMaha SarakhamMukdahanNakhon RatchasimaSi Sa KetUbon RatchathaniUdon Thani
Water
Irrigation35,395 A33,988 A36,436 A36,387 A37,748 A34,882 A35,921 A35,194 A36,558 A35,021 A
Rainfed29,007 B27,323 B29,082 B30,746 B29,592 B28,403 B27,863 B28,444 B29,800 B28,809 B
Genotype
Kasetsart 5032,213 B30,505 B32,482 C33,290 C33,561 B31,610 B31,963 B31,874 B33,218 B31,877 B
Rayong 931,910 C30,357 C32,687 B33,494 B33,410 C31,384 C31,419 C31,432 C32,937 C31,625 C
Rayong 1131,147 D29,748 D31,867 D32,647 D32,733 D30,580 D30,853 D30,790 D32,092 D30,856 D
CMR38–125–7733,534 A32,013 A34,000 A34,835 A34,977 A32,997 A33,335 A33,178 A34,469 A33,300 A
Planting date
January 34,416 A33,463 A35,526 A35,940 A36,560 B34,936 B34,174 A35,075 A36,741 A35,067 B
February 34,093 B32,612 C34,559 B35,043 C35,273 D33,683 D33,277 C34,048 C35,713 B33,914 D
March33,473 C31,440 D33,339 C33,777 E34,018 E32,079 F32,376 D32,638 D34,216 C32,478 F
April32,331 D29,986 E32,238 D32,749 F32,862 F30,588 G31,485 E31,129 F32,590 E30,974 G
May31,386 E28,957 G31,464 E31,971 G32,096 H29,507 H30,886 F30,030 H31,281 G29,928 I
Jun30,393 G28,061 I30,583 F31,285 I31,343 I28,633 J300,87 H29,035 I30,240 H28,965 K
July29,620 H27,758 J30,222 G31,178 I31,031 J28,426 K29,564 I28,542 J29,792 I28,738 L
August29,533 H28,300 H30,312 FG31,707 H31,281 I28,939 I29,507 I28,994 I30,193 H29,254 J
September30,764 F29,627 F31,371 E32,869 F32,440 G30,461 G30,633 G30,394 G31,502 F30,638 H
October32,414 D31,320 D33,151 C34,470 D34,246 E32,598 E32,382 D32,369 E33,469 D32,802 E
November33,709 C32,847 B34,793 B35,714 B36,048 C34,561 C33,918 B34,318 B35,608 B34,752 C
December34,281 AB33,496 A35,552 A36,094 A36,844 A35,302 A34,420 A35,255 A36,805 A35,465 A
Values followed by the same letter (in each column) are not significantly different by the least significant difference test (LSD) (p ≤ 0.05).
Table 4. Simulated storage root dry weight (kg ha−1) for different treatment scenarios over 30 years (from 1988–2018) in ten locations in northeast Thailand.
TreatmentLocation
Buri RamKalasinKhon KaenLoeiMaha SarakhamMukdahanNakhon RatchasimaSi Sa KetUbon RatchathaniUdon Thani
Water
Irrigation19,100 A16,742 B18,554 B18,141 B19,977 A18,488 A18,794 A18,678 A20,135 A18,477 A
Rainfed18,466 B16,850 A19,088 A19,797 A19,482 B17,801 B18,139 B17,707 B18,887 B17,924 B
Genotype
Kasetsart 5018,480 C16,369 C18,218 C18,530 B19,103 C17,758 C17,926 C17,854 C19,156 C17,825 C
Rayong 921,217 A19,421 A21,759 A22,236 A22,248 A20,531 A20,504 A20,443 A21,866 A20,668 A
Rayong 1116,567 D14,671 D16,678 D16,526 C17,765 D16,033 D16,595 D16,129 D17,407 D16,033 D
CMR38–125–7718,867 B16,723 B18,629 B18,584 B19,802 B18,256 B18,840 B18,342 B19,615 B18,274 B
Planting date
January 18,863 C17,249 C19,903 AB19,175 B21,103 A19,038 A19,282 A18,857 B20,632 A18,809 B
February 19,439 B17,700 A20,122 A19,758 A20,995 A19,172 A19,338 A19,178 A20,820 A19,085 A
March19,653 AB17,681 AB19,729 B19,608 A20,388 B18,733 B18,988 B18,855 B20,361 B18,792 B
April19,637 AB17,485 AB19,203 C19,357 B19,734 C18,463 C18,560 CD18,585 C19,973 C18,481 C
May19,716 A17,474 B18,920 D19,212 B19,393 D18,401 C18,422 DE18,660 C19,763 D18,486 C
Jun19,410 B17,077 C18,486 E18,847 C19,111 EF18,069 D18,145 F18,356 D19,306 E18,195 D
July18,740 C16,443 D18,109 F18,594 DEF18,853 GH17,509 E17,864 G17,698 FG18,691 F17,719 F
August17,983 E16,119 E17,793 G18,601 DEF18,782 H17,211 F17,616 H17,305 H18,323 G17,475 G
September17,856 E16,027 E17,862 FG18,740 CD19,034 FG17,278 F17,928 G17,347 H18,407 G17,490 G
October17,914 E15,914 E18,131 F18,706 CDE19,321 DE17,579 E18,324 EF17,598 G18,767 F17,714 F
November17,918 E15,993 E18,537 E18,480 F19,746 C17,908 D18,461 DE17,777 F19,257 E17,951 E
December18,263 D16,391 D19,057 CD18,549 EF20,297 B18,373 C18,668 C18,087 E19,831 CD18,203 D
Values followed by the same letter (in each column) are not significantly different by the least significant difference test (LSD) (p ≤ 0.05).
Table 5. Average values over ten locations and 30 years (1988–2018) for solar radiation, maximum temperature, minimum temperature, and total amount of rainfall for the four different growth stages of cassava.
Planting DateSolar Radiation (MJ−1 m−2)Maximum Temperature (°C)Minimum Temperature (°C)Rainfall (mm)
Growth StageGrowth StageGrowth StageGrowth Stage
1234123412341234
January18.919.216.216.533.234.832.030.519.724.723.818.863.3457.6822.022.1
February20.017.816.216.935.033.631.630.522.124.722.717.4139.2593.8621.210.7
March20.116.716.318.235.532.731.132.023.924.521.018.3315.6652.9374.821.7
April19.216.216.619.734.832.230.934.324.724.319.420.9457.6717.2132.957.2
May17.816.017.320.533.631.831.335.824.723.618.623.4593.8603.843.8123.6
June16.716.218.320.032.731.532.335.524.522.219.224.6652.9370.168.0274.0
July16.216.419.318.432.230.934.034.124.320.120.924.8717.2126.9145.3375.7
August16.016.819.817.031.830.734.933.023.618.322.824.7603.828.1331.2401.8
September16.217.619.416.331.531.335.032.422.218.124.124.4370.126.4499.3469.2
October16.418.918.516.030.933.234.332.020.119.724.624.1126.963.3675.8499.1
November16.820.017.316.030.735.033.231.718.322.124.623.228.1139.2844.9352.7
December17.620.116.516.431.335.532.531.318.123.924.421.426.4315.6900.8122.2
Growth stage 1 = leaf development and formation of root system (0–3 months after planting); Growth stage 2 = development of stems and leaves (3–6 months after planting); Growth stage 3 = high carbohydrate translocation to the roots (6–10 months after planting); Growth stage 4 = declining phase (10–12 months after planting); all four cassava growth stages were described by Alves [53].
Publisher’s Note: MDPI stays neutral with regard to jurisdictional claims in published maps and institutional affiliations.

