Article

Estimation of Nitrogen Supply for Summer Maize Production through a Long-Term Field Trial in China

1
Key Laboratory of Plant Nutrition and Fertilizer, Ministry of Agriculture and Rural Affairs, Institute of Agricultural Resources and Regional Planning, Chinese Academy of Agricultural Sciences, Beijing 100081, China
2
Hebei Fertilizer Technology Innovation Centre, Institute of Agricultural Resources and Environment, Hebei Academy of Agriculture and Forestry Sciences, Shijiazhuang 050051, China
*
Authors to whom correspondence should be addressed.
Agronomy 2021, 11(7), 1358; https://doi.org/10.3390/agronomy11071358
Submission received: 16 May 2021 / Revised: 27 June 2021 / Accepted: 30 June 2021 / Published: 2 July 2021

Abstract

:
Supplying adequate nitrogen (N) to meet crop demand is critical for enhancing agricultural sustainability. Not only fertilizer N, but also N from other available sources should be considered in N supply capacity. We conducted a 10-year farming experiment using a split-plot design with two different main fertilizer management approaches and three N application strategies as add-on sub-treatments. Based on the experiment, we estimated the total N supply (TNsupply) for the summer maize cropping system, through considering environmental, soil, crop residue, and fertilizer N sources. An appropriate TNsupply was established by correlating TNsupply with the relative yield (RY), N input and output, and N use efficiency (NUE). The results revealed a wide variation in TNsupply (from 88 to 755 kg ha−1). The RY, N input, and N output fitted well to TNsupply using linear-plateau, linear, and linear-plateau models, respectively. The lower limits of TNsupply for achieving the maximum RY and N output were 361 and 358 kg ha−1, respectively. The relationship between N input and N output was described as linear-plateau. We determined the slope of the linear curve (55.4%) as the lower limit of NUE, beyond which the upper limit of TNsupply was determined to be less than 497 kg ha−1. Thus, appropriate TNsupply values ranged from 325 to 497 kg ha−1 for summer maize production, which could ensure enough N supply for higher yields and avoid excessive N input for higher NUE and lower environmental N loss. Our findings highlight that TNsupply can be an alternative indicator for evaluating N management.

1. Introduction

Approximately 30% of synthetic nitrogen (N) fertilizers produced globally are used in China, with an N use efficiency (NUE) of 25%, compared to 52% in European countries and 68% in the United States of America [1,2]. Excessive application rate and low use efficiency of synthetic N fertilizers have caused serious environmental problems, such as nitrous gases emissions, soil nitrate accumulation, and groundwater pollution [3,4,5]. It is not realistic and is problematic to expect higher crop yields by increasing N fertilizer application rates.
Maize (Zea mays L.) is one of the leading grain crops for global food security [6,7]. In China, a summer maize–winter wheat rotation is a highly intensified cropping system [8], and the total sown area of summer maize (23.7 million hectares) accounts for 57.5% and 24.2% of the whole maize and cereal crops, respectively [9]. Maize production in China is dominated by small-scale farms with high N fertilizer inputs (200–300 kg N ha−1), low NUE (lower than 30%), and heavy environmental pollution (40.1% of N fertilizer lost via NH3 volatilization, leaching, and denitrification) [5,8,10]. Moreover, mineral N accumulating in the 0–1 m soil profile has exceeded 400 kg ha−1 [11,12]. The nitrate levels in the groundwater near these farms are dangerously high and cause a serious public health crisis for people acquiring their drinking water from these watersheds [12].
Residual mineral N in the soil profile can be used as an important N source for crops, and should be fully considered in N management practices [13,14]. Moreover, other sources of N, such as deposition N, irrigation N, and returned-straw (crop residue) N, should be also included [15,16,17]. Previous studies have focused on the response of grain yield or N uptake to N application [18,19]. However, the grain yields did not keep rising as the N fertilizer rates increased, especially when mineral N content in the top 20 cm of soil went above 20–30 mg kg−1 [20]. The nonfertilizer N sources, such as soil N, environmental N, and crop residue N, were utilized by crops. In 2015, China introduced a “Zero Growth of Chemical Fertilizer Use by 2020” plan to reduce N input from synthetic N fertilizers, improve crop N management, and maintain crop yields [21]. To achieve this goal, all N sources need to be taken into account in the N supply. In north-central China, it was reported that the deposition of N surpassed 50 kg N ha−1 year−1, which significantly affected the cropping systems [22]. Returning crop residue to the field has been widely adopted in China and could provide extra N for meeting subsequent crop demand via microbial decomposition [23]. Returned N from crop residues has been demonstrated, accounting for 14.1%, 27.5%, and 37.4% of the total N requirements for wheat, rice, and maize, respectively [24]. Therefore, balancing environmental, residual soil, organic inputs (crop residue), and fertilizer N is essential for improving N management and protecting the environment. However, to date, an exact quantification of total N supply (TNsupply) for maize production is still lacking, and an optimum N supply level for sustainable summer maize cropping is urgently needed.
For this purpose, we conducted a field experiment in a summer maize–winter wheat rotation system from 2009 to 2019. The experiment included two fertilizer management approaches and three N application strategies. Relationships among TNsupply level (involving environmental, soil, crop residue, and fertilizer Ns) and the crop yields, N input, and N output of maize crops were systematically examined. Our goals were (i) to assess the responses of the TNsupply to crop yield, N input, and N output, and (ii) to determine appropriate TNsupply levels that are needed for maintaining yields and achieving increased NUE for summer maize production.

2. Materials and Methods

2.1. Experimental Design

The long-term experiment started in 2009 at the Dahe Experimental Station (38°07′44″ N, 114°29′21″ E, under the WG-S84 geographic system) in Shijiazhuang city, Hebei Province, north-central China. The location is characterized by a semi-humid continental monsoon climate with 300–600 mm of annual precipitation and 14.3 °C average annual air temperature. The monthly precipitation and maximum and minimum temperatures in each season at the experimental station are shown in Figure 1. Maize was planted and harvested in mid-June and early October, respectively. Wheat was sowed and harvested in mid-October and in early June of the following year, respectively. Such maize–wheat rotations are typical for this and similar agricultural regions, which are characterized by fluvo-aquic soil type with sandy loam. The 20 cm topsoil layer in 2009 possessed pHH2O (soil:water 1:2.5) equal to 7.1, and organic matter and N contents equal to 16.4 and 1.14 g kg−1 respectively, while NO3-N, Olsen-phosphorus (P), and available potassium (K) contents were equal to 27.9, 13.6, and 96.6 mg kg−1, respectively.
The long-term experiment used a split-plot design, as reported by Huang et al. [16]. The main treatments contained Nutrient Expert (NE), a Nutrient Decision Support System (NDSS) [19] that combines 4R (right source, right place, right time, and right rate) nutrient management together with improved varieties and optimized plant density, and Farmers’ Practice (FP), which relies on the field managing practices of local farmers. Three different N addition strategies were used in subplots of each of the main plots, characterized by their treatments with different TNsupply levels, as follows:
(1) 0N (zero additional N was introduced).
(2) 2N (N fertilizers were introduced every two out of three years, with no fertilizer application during the first year).
(3) 3N (fertilizer was applied every year; in this case, one cycle lasted three years).
P and K applications were consistent in all three subplots. Thus, six treatments were marked as NE0N, NE2N, NE3N, FP0N, FP2N, and FP3N.
The FP fertilizer application rates were calculated using the data obtained for over 100 farmers collected in 2009–2012. A fixed rate was applied from 2013 to 2019 due to the widespread use of compound fertilizers (shown in Supplementary Table S1). We relied on the NDSS to determine the fertilizer rates for the NE treatments (Supplementary Table S1). The system was used to recommend location-specific fertilizer applications with the 4R strategy to help to meet the nutrient demand at different stages of crops and in combination with other optimal agronomic practices [19,25]. For maize, similar fertilizer application methods were applied in both NE and FP: 1/2 of the N, total P, and total K were applied as basal fertilizers and the remaining 1/2 of the N was top-dressed at the V12 stage [26] (lasting from approximately 25 July to 5 August each year). All fertilizers were applied and banded for both basal and top-dressing. We used ZhengDan958 maize variety for FP and NE planted at 60,000 ha−1 density in 2009–2019 and in 2009–2013. In 2014–2019, XianYu335 with higher yield potential was planted for NE treatments at a density of 75,000 ha−1 (Supplementary Table S1).

2.2. Sampling and Measurements

At wheat harvest, the N concentration of crop residue was determined by harvesting three 2 m2 areas in the middle of each plot. Three rows in the middle of each plot were manually harvested. The grains were dried to determine the yield (moisture content of 14%). Five succussive plants located in one spot were sampled to determine the nutrient concentrations. Before sowing and after harvesting, the soil was sampled at 0–5, 5–10, 10–20, 20–30, 30–60, and 60–100 cm layers, after which mineral N content was analyzed. The stock, foliage, and grains were separated and dried at 70 °C until no weight change was observed. The total N contents were obtained by the Kjeldahl automated method after the samples were subjected to wet digestion by the H2SO4 and H2O2 mixture [27]. For the residual mineral N content analysis, the fresh soil was extracted using 1 M KCl [28], and then analyzed by a high-resolution AA3 instrument (manufactured by Bran + Luebbe, Norderstedt, Germany).

2.3. Data Analysis

2.3.1. Agronomic Indices of Nitrogen Use Efficiency

Four indicators of NUE were calculated as follows [29]:
Recovery efficiency of N (REN, %) = (Nup − 0Nup)/Nrate × 100%,
Agronomic efficiency of N (AEN, kg kg−1) = (Nyield − 0Nyield)/Nrate,
Physiological efficiency of N (PEN, kg kg−1) = (Nyield − 0Nyield)/(Nup − 0Nup),
Partial factor productivity of N (PFPN, kg kg−1) = Nyield/Nrate,
where Nup and 0Nup indicate N uptake from 3N and 0N treatments in NE or FP plots (kg ha−1), Nyield and 0Nyield indicate grain yields from 3N and 0N treatments in NE or FP plots (kg ha−1) respectively, and Nrate were the corresponding N application rates in NE or FP plots (kg ha−1).

2.3.2. Total Nitrogen Supply and Nitrogen Budgets

To narrow the variations of the maize yield caused by climate differences during the 2000–2019 period, the relative grain yields (RY) were obtained using the formula below [16,30]:
RY = Ytreatment/Ymax × 100%,
where Ytreatment and Ymax are normal and maximum grain yields of the treatments in the same year (in kg ha−1).
The TNsupply (kg ha−1) was calculated as follows:
TNsupply = Nsoil + Nenv + Nstraw + Nfert,
where Nsoil is the mineral N content in the 0–1 m soil layer before planting, Nenv is the environmental N from irrigation and precipitation during the maize growing season, Nstraw is the returned-straw N from the preceding wheat crop (also equal to the N in the aboveground wheat straw), and Nfert is the N fertilizer applied during the maize growing. Nsoil is the theoretical end-product of mineralization and immobilization of soil organic matter, environmental N, crop residue, or previously applied fertilizer [14,31], and TNsupply and Nsoil comprise the residual N from the previous seasons.
NUE (in %), a popular indicator, was used to assess the crop system N efficiency, which was established by the EU Nitrogen Expert Panel [32]. In this case, crop uptake was the only N output, while inorganic, organic, and soil mineral N were the only inputs [15,16,33].
NUE = N output/N input × 100%,
N output = Nuptake,
N input = Nenv + Nstraw + Nfert + ΔNsoil,
where Nuptake is the N content in the maize grain and straw (in kg ha−1) and ΔNsoil is the change in soil mineral nitrogen content, which is the difference between residual soil N content in the samples collected before maize sowing and after maize harvesting (in kg ha−1).
RY, N output, and N input were plotted vs. TNsupply using SAS software (1993). Linear and linear-plateau models were used to fit the corresponding data [34]. The variance analyzed differences among the obtained data and the least significant difference (LSD0.05) tests via SPSS version 19.0 software (SPSS Inc., Chicago, IL, USA).

3. Results

3.1. Grain Yield and Agronomic Indices of NUE

There were no significant differences in grain yield between the NE3N and FP3N treatments (Table 1). NE management could maintain a high crop yield with reduced fertilizer N application. Compared with FP, NE increased the recovery efficiencies of the N applied by 10.3 percentage points, and improved agronomic efficiency, physiological efficiency, and partial productivity of the N applied by 54.8%, 10.3%, and 28.8%, respectively (Table 2).

3.2. Estimation of Total N Supply

A wide range of TNsupply (88–755 kg ha−1) was observed under different long-term management and N application strategies in 2010–2019 (Table 3). The soil residual mineral N content ranged from 21 to 448 kg ha−1, which was 12.1–82.6% (51.8% on average) of the TNsupply. The environmental N accounted for 3.7–41.3% of the TNsupply, with an average of 11.8%. The average crop residue N was 32.5 kg ha−1, which accounted for 10.2% of the TNsupply. Fertilizer N accounted for 0% to 65.0% of the TNsupply, with an average of 26.3%.

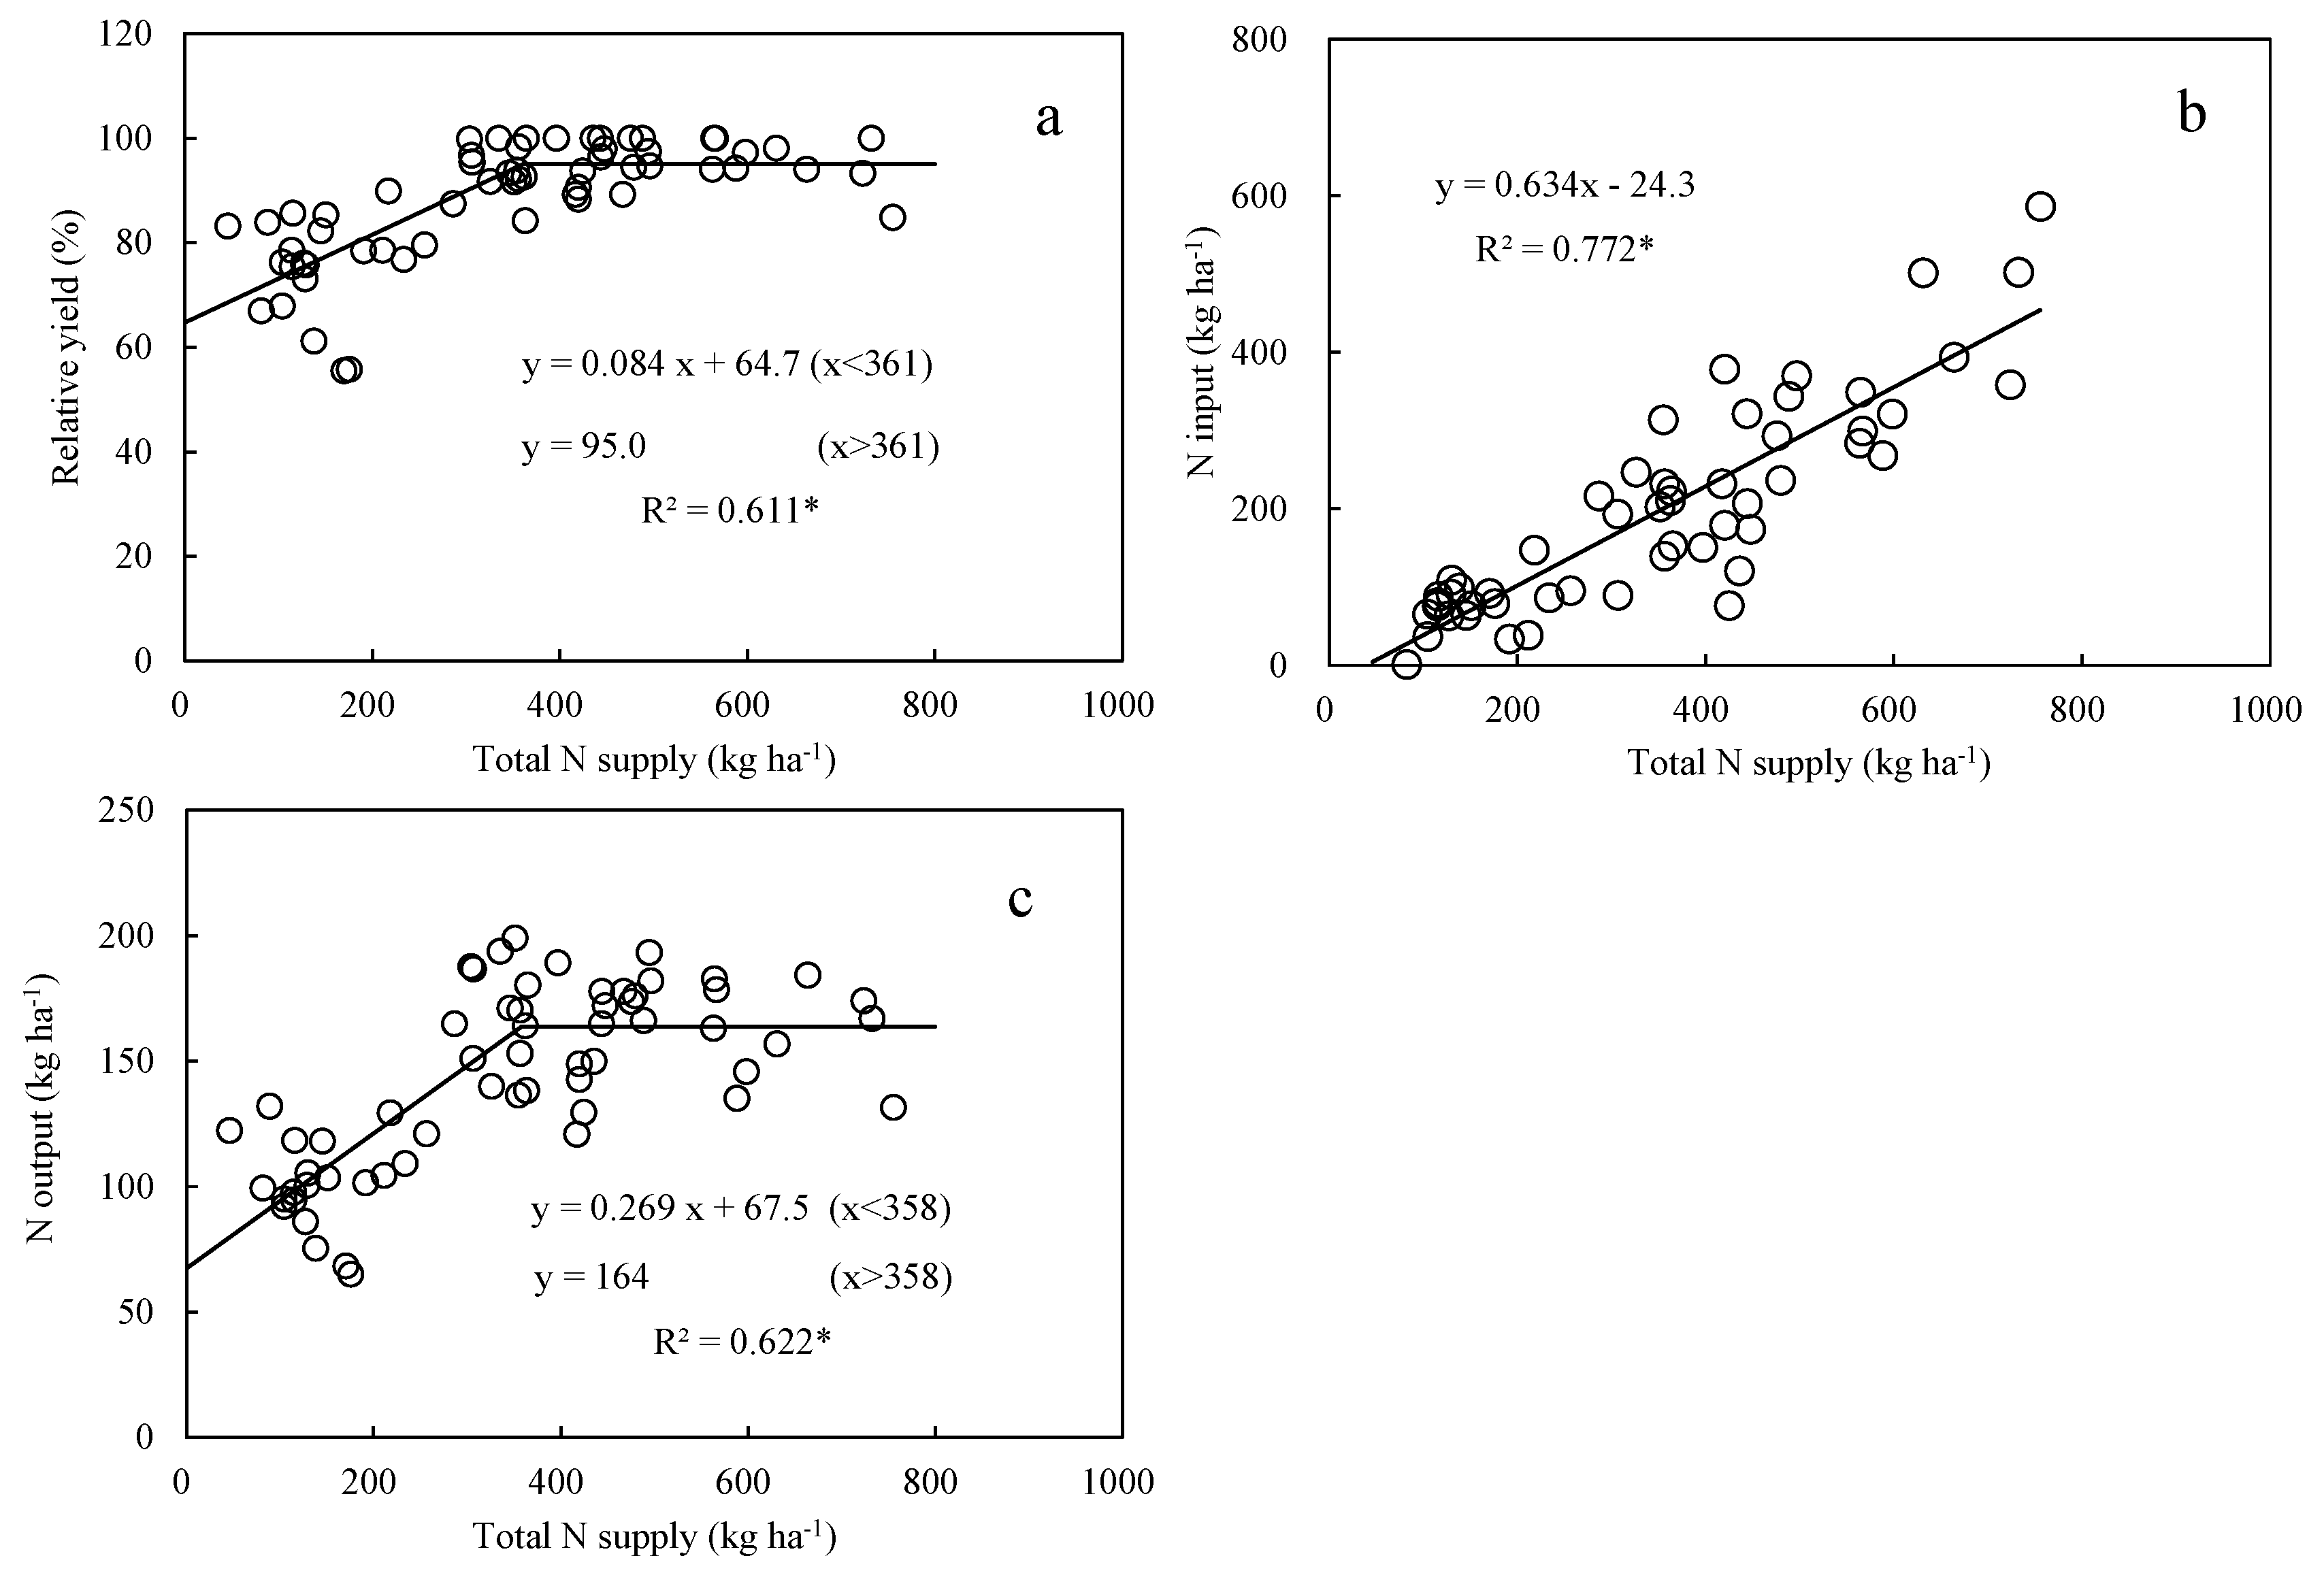
3.3. Relationships between Total N Supply and Relative Yields, N Output, and Input

The best fit of the relationship between TNsupply and RY was obtained using a linear-plateau model (shown in Figure 2a). The minimum TNsupply capable of providing the maximum RY (equal to 95.0%) was 361 kg ha−1. After that, the RY increased linearly (with a slope equal to 0.084). The relationship between TNsupply and N input was also linear (Figure 2b). Moreover, 63.4% (the slope) of the TNsupply was added to the system, while 36.6% was predicted to remain. The best fit of the N output plotted vs. TNsupply was obtained by the linear-plateau model (see Figure 2c). The minimum TNsupply level needed for maximum N output was 358 kg ha−1, and the maximum N output (maize N uptake) was 164 kg ha−1.

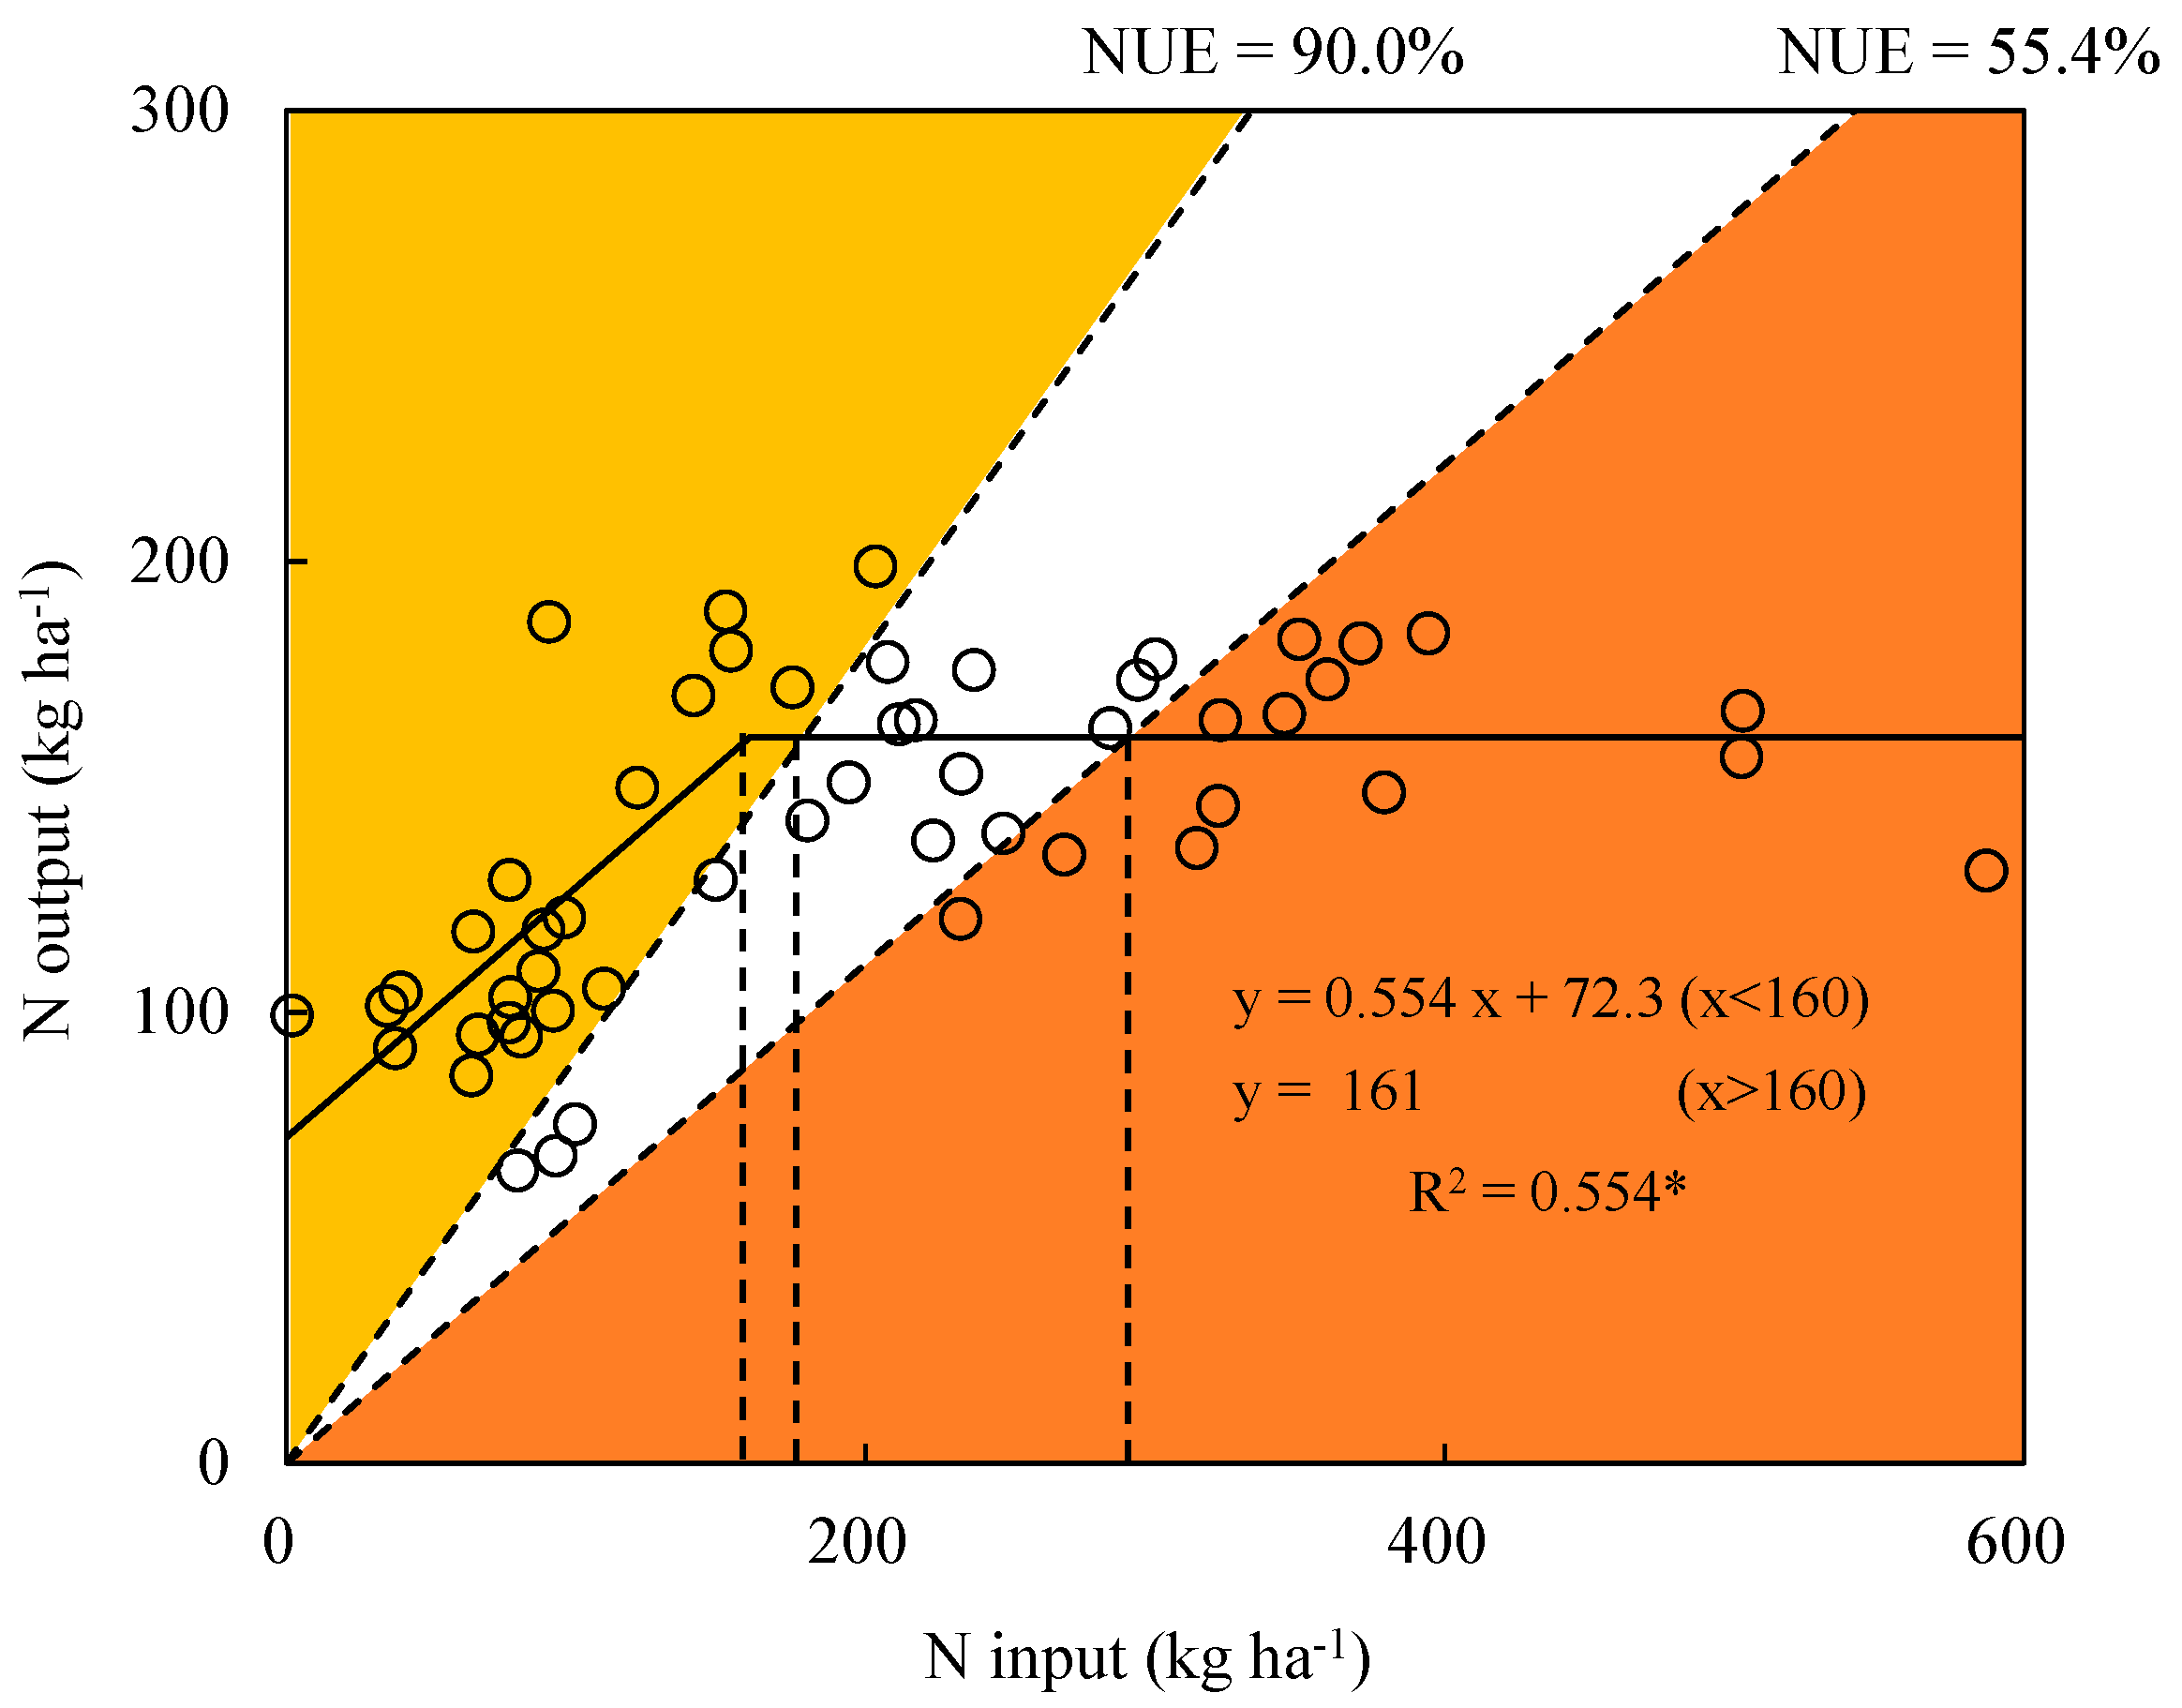
3.4. N Input vs. N Output and NUE

The N input and output demonstrated a linear-plateau relationship (Figure 3). The minimum input that could achieve the maximum N output (161 kg ha−1, similar to the values observed in Figure 2c) was 160 kg ha−1. Using the NUE conceptual framework developed by the EU Nitrogen Expert Panel, we added the upper and lower limits of NUE in Figure 3. The slope of the linear curve was determined to be the lower limit of NUE (55.4%), and the upper limit was 90.0%. We added two auxiliary lines that represented those NUE values in Figure 3. The points where the NUE lines intersected the plateau line were the thresholds of N input within the NUE targets (55.4–90.0%), which were 179–291 kg ha−1. Considering that N input tendency on TNsupply could be expressed as y = 0.634x − 24.3 (see Figure 2b), the TNsupply ranged from 321 to 497 kg ha−1, within which the system would achieve a sustainable NUE value.

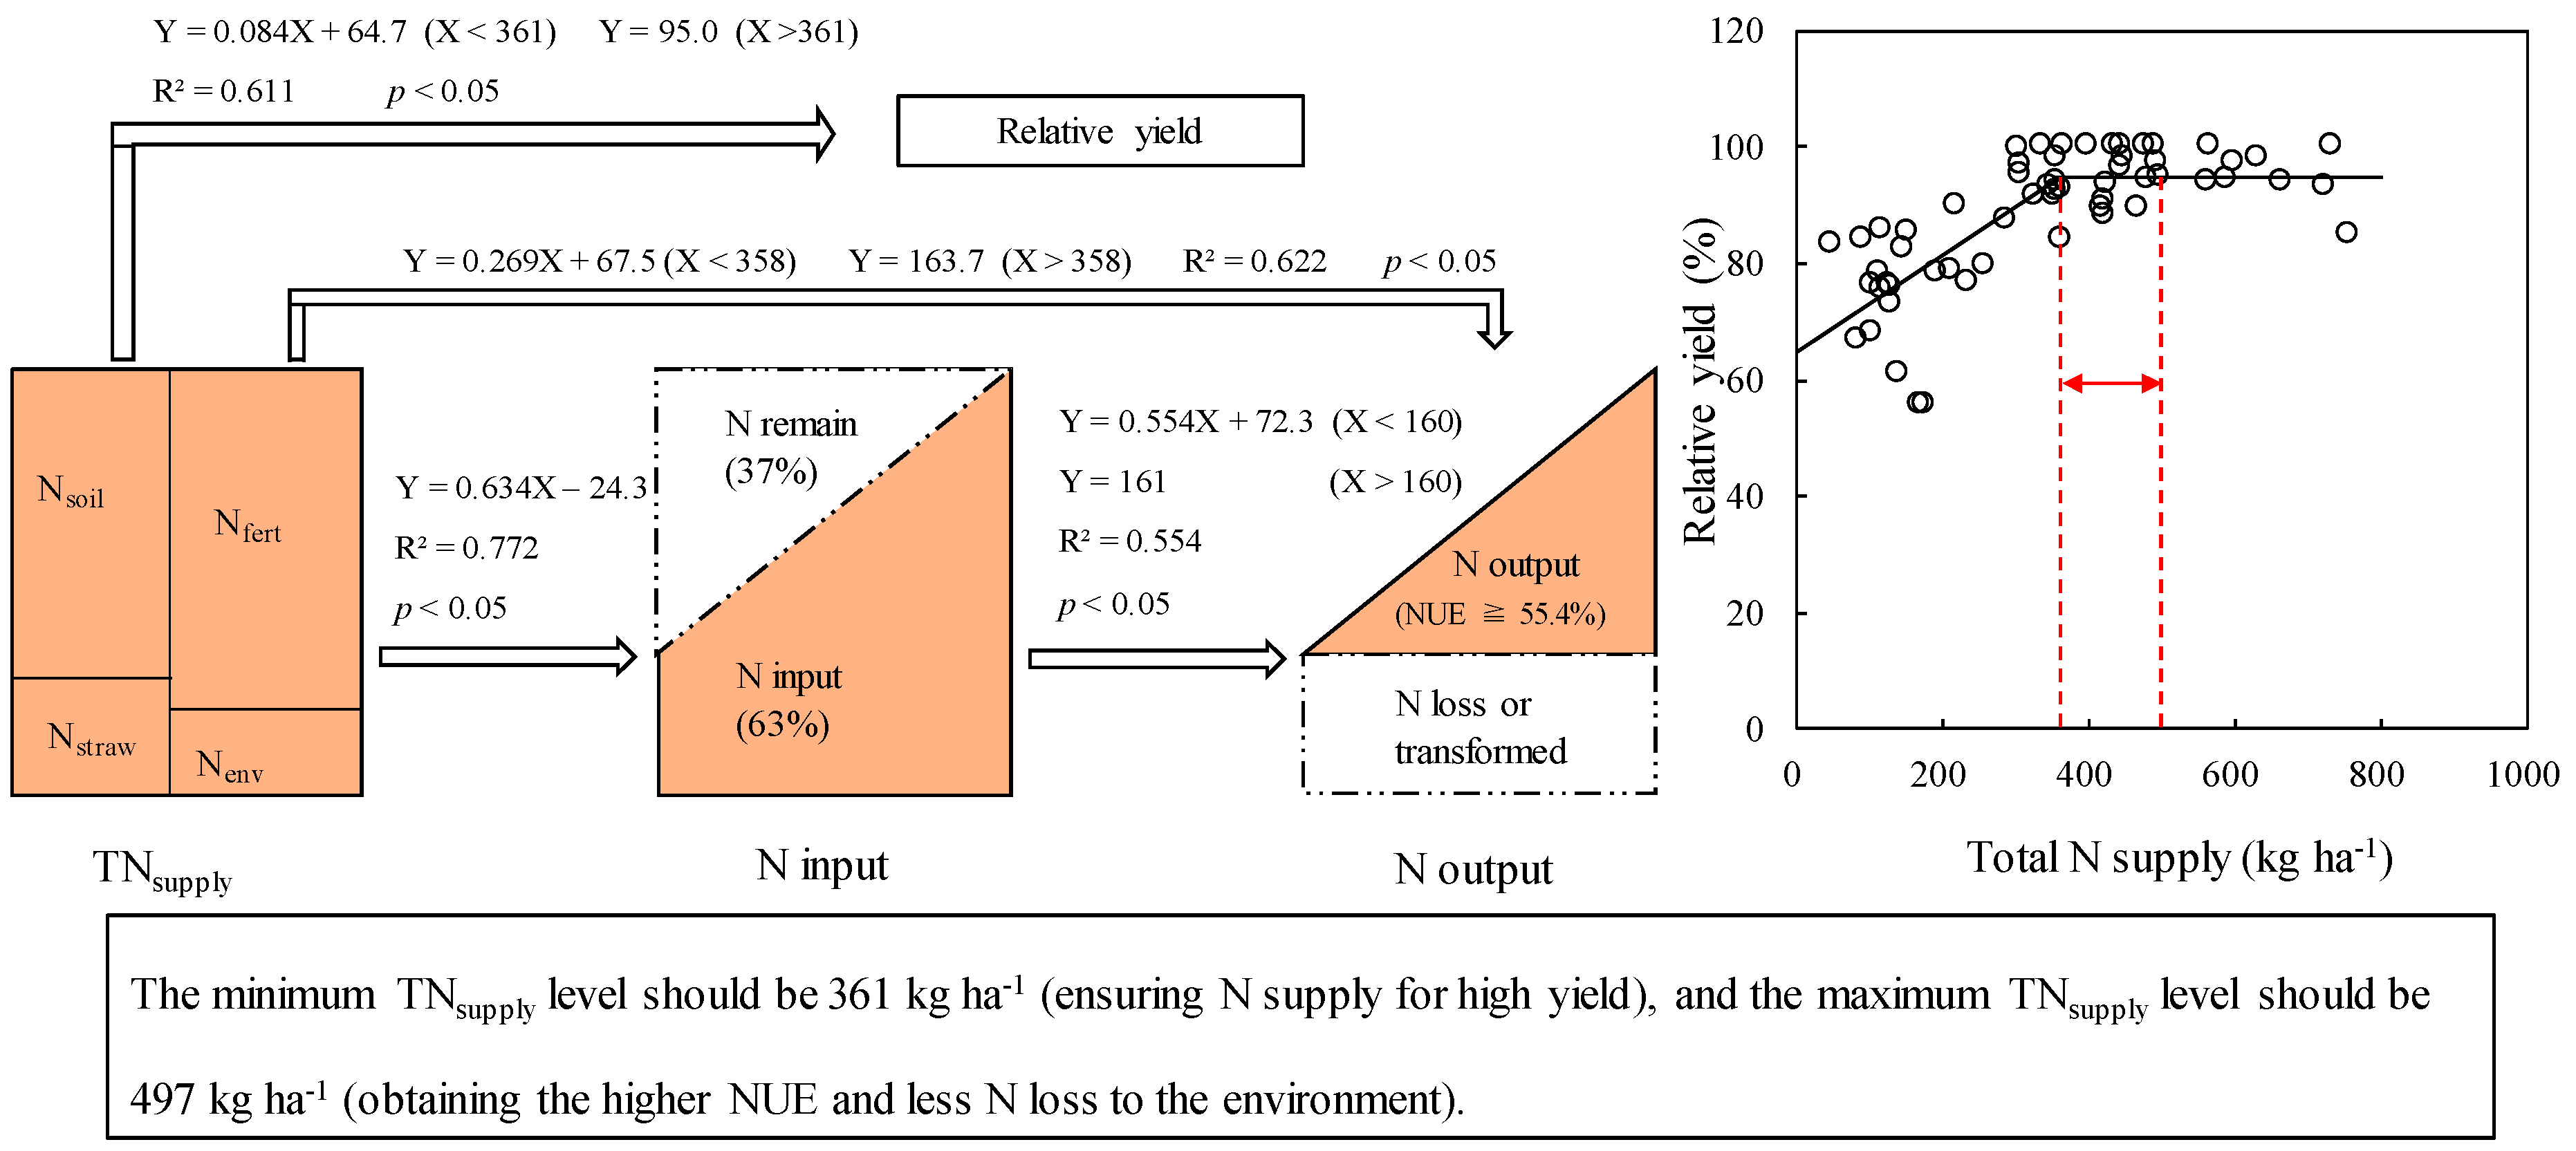
3.5. Suitable Total N Supply

Based on the correlation between the TNsupply and the RY, N input, and N output, the suitable TNsupply level that could maintain grain yields and achieve increased NUE with reduced environmental N loss was 361–497 kg ha−1 (Figure 4).

4. Discussion

4.1. Different Sources of N

Different sources of N can provide bioavailable N for crop uptake [35,36], and together, these sources constitute the total N supply. When all sources of N are fully considered, achieving NUE together with sustainable development can be accomplished.
In north-central China, smallholder farmers often apply excessive amounts of N fertilizer to ensure high yields, and the overuse of N fertilizer leads to lower NUEs and higher mineral N accumulation levels in the soil [5,37]. In this study, the average REN (28.5%), AEN (6.2 kg kg−1), PEN (22.3 kg kg−1), and PFPN (31.9 kg kg−1) of FP treatment were below the common values, which were 30–60%, 10–30 kg kg−1, 30–50 kg kg−1, and 40–70 kg kg−1, respectively [29]. Our data also showed that much greater mineral N accumulation occurred within the 0–100 cm soil profile under the FP3N treatment (168–448 kg ha−1) compared with the other treatments, which agrees with Lu et al. [11]. The soil N accumulation level was strongly correlated with nitrate leaching and is a valuable indicator of leaching tendency [4,38]. Moreover, the study region is characterized by sudden heavy rains and irrigation events (including flood irrigation) during the summer maize growing season, increasing the risk of N leaching [13,39]. Thus, any accumulated deposits of mineral N need to be depleted to reduce leaching, and the most effective method for achieving this is absorption by crops [40,41]. Thus, the cumulative soil N is an important N source.
Precipitation and irrigation are other N sources. Our field data showed that maize received a mean of 28 kg N ha−1 from these sources during the growing period. Researchers have reported that increasing amounts of N deposition occurred in China (from 13.2 kg N ha−1 in the 1980s to 21.1 kg N ha−1 in the 2000s) [42], and north-central China is a hotspot, as it currently has the greatest N deposition rate of 52.2 kg N ha−1 year−1 [22]. Returned N from crop residue can be utilized after decomposition by soil microorganisms. Returned crop residue N accounts for 37.4% of the total N needed for maize in China [24]. However, few studies have calculated crop residue N when recommending N fertilizer application rates.
Nsoil represents the end-product of mineralization and immobilization of soil organic matter, crop residue, environmental N, or previously applied fertilizer. Nitrogen accessibility depends on N mineralization and immobilization after N enters the soil, which can strongly affect N management [14,43]. Therefore, the TNsupply also includes N remaining from the previous growing season, in combination with Nsoil.

4.2. Essence of the Suitable Total N Supply

The TNsupply is a representation of all the sources of N available in a cropping system and an indicator of the N supply capacity. In this study, the TNsupply provides an improved way for better understanding crop system N supply capacity. Correlations between the TNsupply and RY, N input, and N output are shown in Figure 4. The TNsupply is a mixture of environmental, soil, crop residue, and fertilizer N, and indicates the support capacity for the system. With TNsupply values above 361 kg ha−1, the RY values were relatively high. Additionally, we observed a linear-plateau dependency between RY and TNsupply. In addition, 63.4% of the TNsupply (as N input) entered the crops. Additionally, not all N input was assimilated by the crops: some proportion was lost or converted to the organic N pool, which affected the NUE. The N input/output linear-plateau correlation with the 55.4% linear slope was the lower-limit target NUE. We then estimated the sustainable TNsupply to be 325–497 kg ha−1.
The EU Nitrogen Expert Panel suggested a NUE target value of 50–90% [32]. In fact, the compositions of the N supply in China and Europe were different. In Europe, manure is used more, which is different from that of the current maize system in China [44]. The lower-limit target NUE should be higher in the current system due to the lower N availability in manure than in inorganic fertilizer. Zhang et al. [15] also reported that the optimal NUE in the winter wheat–summer maize rotation system should be 60% according to a similar quantification method of NUE. In this study, at N input below 160 kg ha−1, the NUE was stably maintained at 55.4% (the slope), except for the intercept term. As N input increases, the NUE gradually decreases [16]. Therefore, it is acceptable that 55.4% is used as the lower-limit NUE.

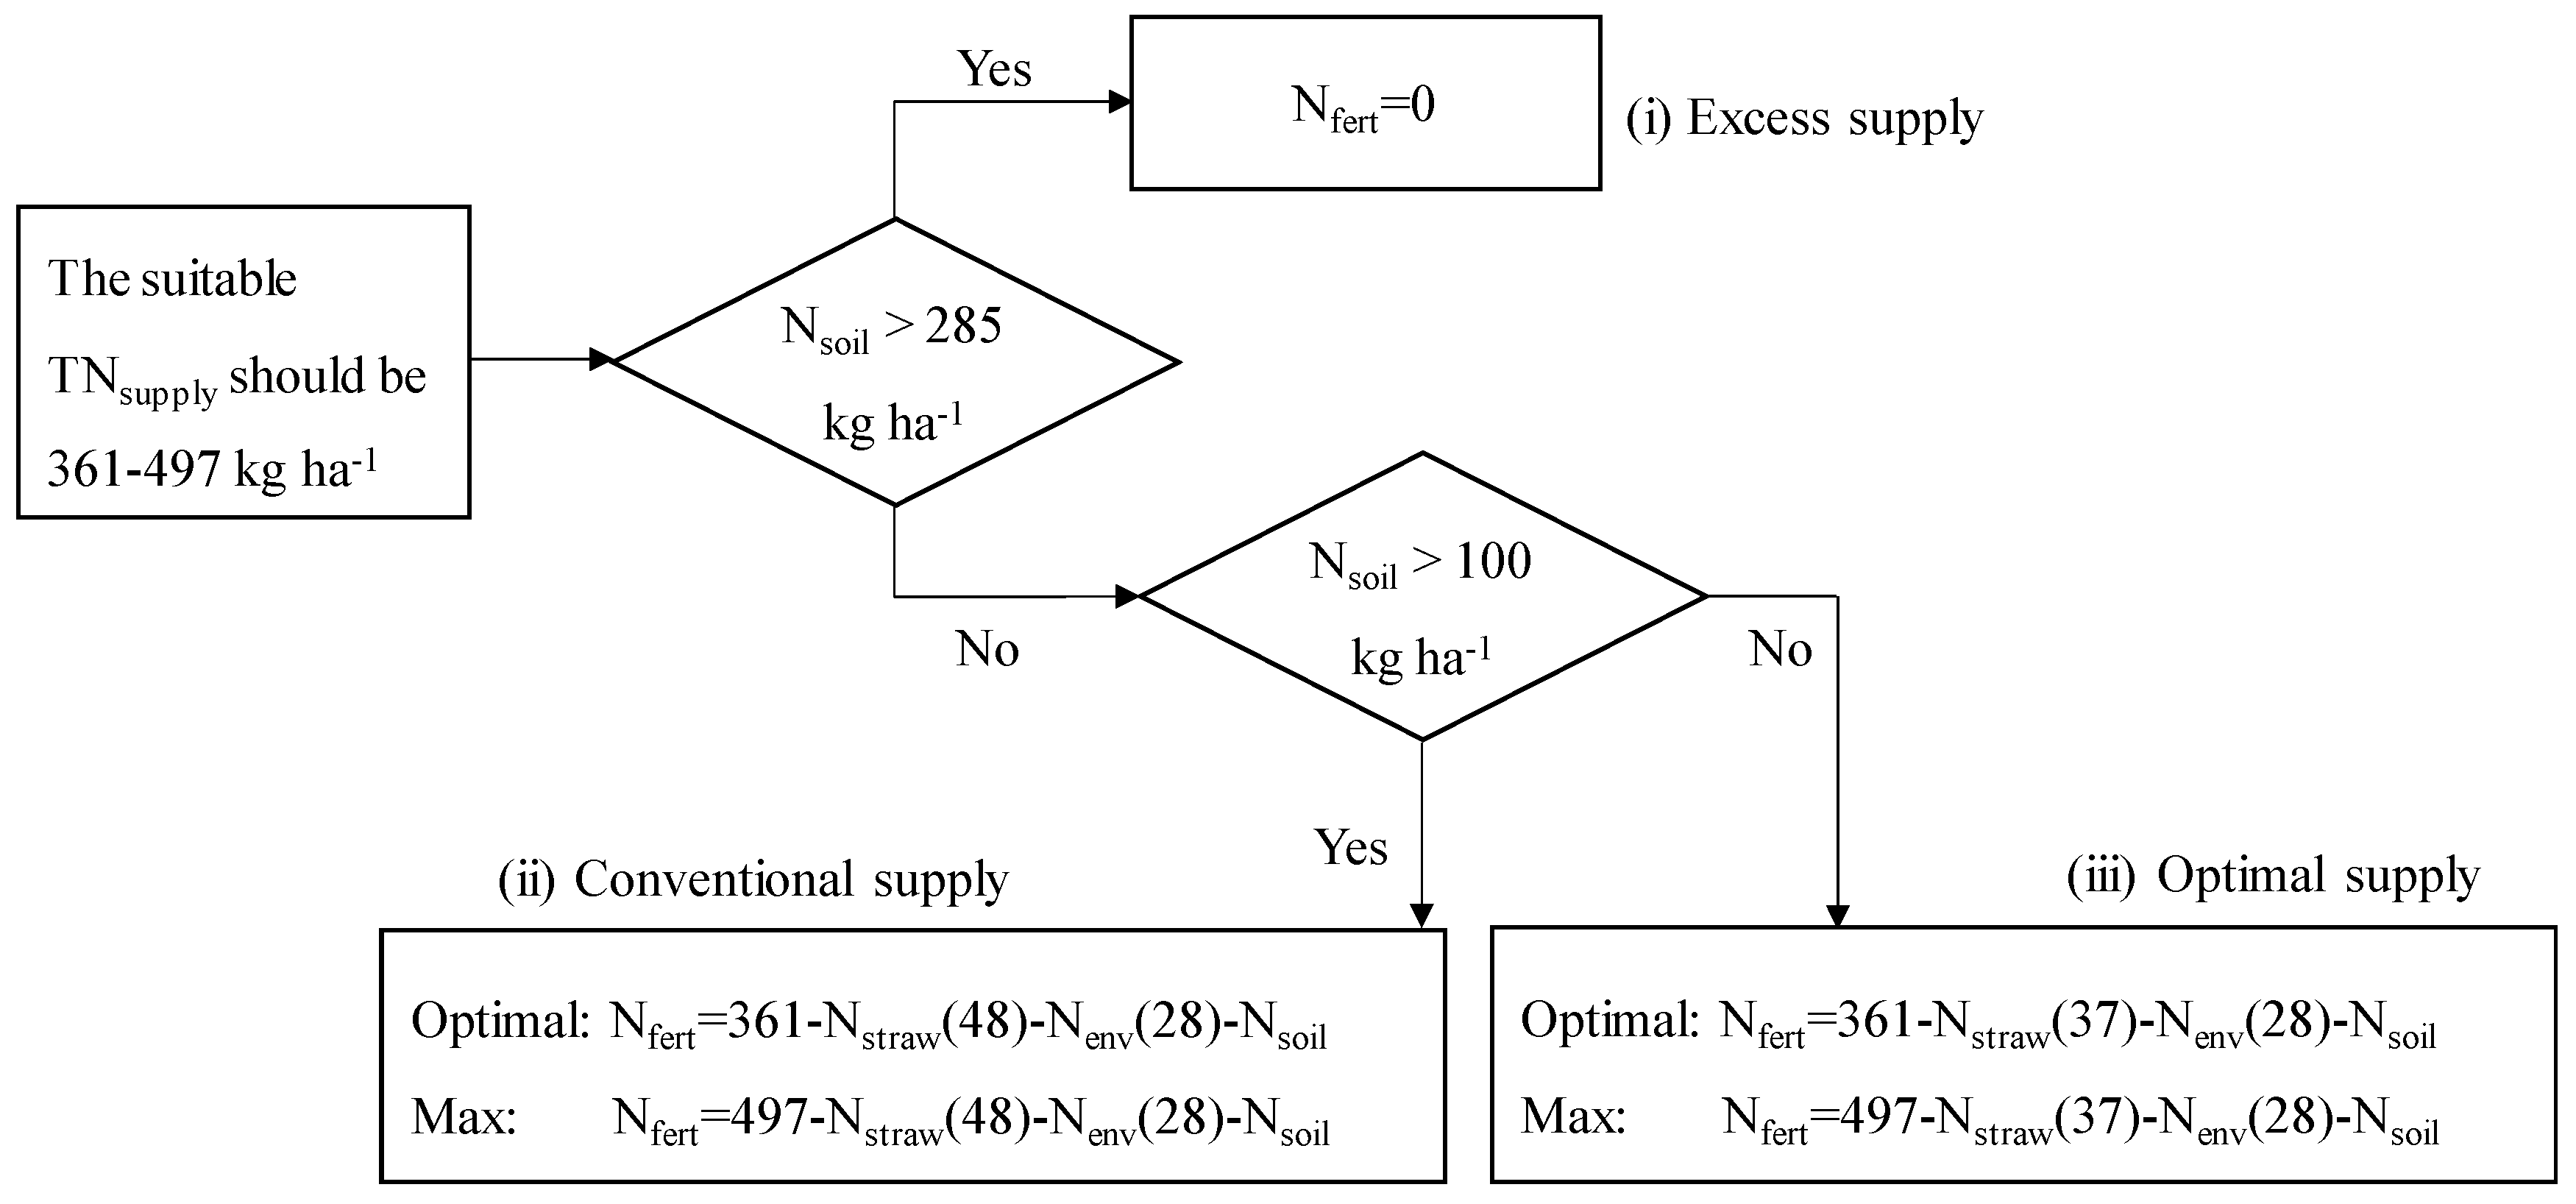
4.3. N Fertilizer Application Recommendations under Suitable N Supply Levels

To achieve a balanced N supply and crop demand, the TNsupply indicator should be used to manage N balance. However, full use of this indicator to provide recommendations is somewhat challenging.
All four N sources should be considered when the TNsupply is used to make fertilizer recommendations. Residual N accumulation should be above 100 kg ha−1 (the soil buffer capacity level) in summer maize–winter wheat rotations, over which the nitrate leaching increases exponentially [10,16,25,38]. This value could be a recommended one for mineral N contents during N management in soils. Moreover, the environmental N should be 28 kg ha−1, which is close to the value reported by Liu et al. [22] in the same region. Additionally, the previous wheat residue N content ranged from 2.9 to 143 kg ha−1 [45]. The specific value was influenced by the N delivery conditions [25,30,41]. We chose the upper quartile (48 kg ha−1) and the median (37 kg ha−1) of 2142 observations for the wheat residue N contents under excessive and suitable supply conditions based on suggestions provided by Chuan et al. [45]. Based on the above information and the appropriate TNsupply level, the fertilization recommendation was determined under different N supply conditions by measuring Nsoil levels, which are shown in Figure 5 and explained below:
(i) Excess supply condition: The Nsoil plus Nstraw (48 kg ha−1) and Nenv (28 kg ha−1) surpassed the minimum TNsupply requirements (equal to 361 kg ha−1). Thus, Nsoil needs to be above 285 kg ha−1. Under this condition, Nfert should be zero, and the priority of the N management strategy is to deplete the accumulated residual N by crops.
(ii) Conventional supply condition: The Nsoil ranged from 100 to 285 kg ha−1, and the Nstraw should be 48 kg ha−1 under this situation. The optimal Nfert rate should equal to the minimum TNsupply (361 kg ha−1) minus the Nstraw, Nenv, and Nsoil. In addition, the maximum Nfert rate cannot exceed the maximum TNsupply (497 kg ha−1) minus the Nstraw, Nenv, and Nsoil. Under these conditions, the goal of the N management strategy is to reduce the accumulated residual N to benign contents to maintain sufficient N.
(iii) Optimal supply condition: The Nsoil level was below 100 kg ha−1, and the Nstraw level should be 37 kg ha−1 under this situation. The optimal Nfert should equal the minimum TNsupply (361 kg ha−1) minus the Nstraw, Nenv, and Nsoil. In addition, the maximum Nfert rate cannot exceed the maximum TNsupply (497 kg ha−1) minus the Nstraw, Nenv, and Nsoil. Thus, this is the minimum amount of synthetic N fertilizer to achieve high yields and high NUE with low soil N contents.

5. Conclusions

The TNsupply, including different N sources, is a robust indicator that can be used for synchronizing N supply and crop demand, which is valuable for guiding the scientific application of N fertilizer in the summer maize cropping system. In this study, the RY, N input, and N output plotted as functions of TNsupply values were fitted using linear-plateau, linear, and linear-plateau models, respectively. The suitable TNsupply ranged from 361 to 497 kg ha−1, within which the crop can achieve higher grain yields, higher NUE, and less environmental N loss. Considering the high amounts of N accumulation in the soils of north-central China, sustainable N management should be considered, such as soil N, environmental N input, crop residue, and the minimum fertilizer applications, with regards to N for crop demand, and the residual soil N should be at a safe level. This research would provide a guideline for crop management involving crop residue post-utilization, improvements of soil quality, and environmental considerations.

Supplementary Materials

The following are available online at https://www.mdpi.com/article/10.3390/agronomy11071358/s1, Table S1: Variety, seed density, and fertilizer rate of summer maize in NE and FP treatments.

Author Contributions

S.H. conceived the study and wrote the manuscript; W.Y., L.J. (Liangliang Jia), and Y.Y. carried out the experiment and sample analysis; W.D., L.J. (Lingling Jiang), Y.L., and X.X. assisted with statistical analysis; P.H. and J.Y. revised the manuscript and were in charge of overall direction and planning. All authors have read and agreed to the published version of the manuscript.

Funding

This research was funded by the National Key Research & Development Program of China (No. 2018YFD0200608, No. 2016YFD0200101), and the Scientific Research Project of Hebei Academy of Agriculture and Forestry Sciences (2021130201).

Data Availability Statement

Relevant data applicable to this research are within the paper.

Acknowledgments

We are grateful to the farmers in our study for their patience and support.

Conflicts of Interest

The authors declare no conflict of interest.

References

  1. Zhang, X.; Davidson, E.A.; Mauzerall, D.L.; Searchinger, T.D.; Dumas, P.; Shen, Y. Managing nitrogen for sustainable development. Nature 2015, 528, 51–59. [Google Scholar] [CrossRef] [Green Version]
  2. Bagheri, S. Fertilizer consumption trend in developing countries vs. developed countries. Environ. Monit. Assess. 2018, 189, 103. [Google Scholar]
  3. Zhang, Y.; Liu, J.; Mu, Y.; Xu, Z.; Pei, S.; Lun, X.; Zhang, Y. Nitrous oxide emissions from a maize field during two consecutive growing seasons in the North China Plain. J. Environ. Sci. 2012, 24, 160–168. [Google Scholar] [CrossRef]
  4. Huang, T.; Ju, X.; Yang, H. Nitrate leaching in a winter wheat-summer maize rotation on a calcareous soil as affected by nitrogen and straw management. Sci. Rep. 2017, 7, 42247. [Google Scholar] [CrossRef] [PubMed] [Green Version]
  5. Ju, X.T.; Xing, G.X.; Chen, X.P.; Zhang, S.L.; Zhang, L.J.; Liu, X.J.; Cui, Z.L.; Yin, B.; Christie, P.; Zhu, Z.L.; et al. Reducing environmental risk by improving N management in intensive Chinese agricultural systems. Proc. Natl. Acad. Sci. USA 2009, 106, 3041–3046. [Google Scholar] [CrossRef] [PubMed] [Green Version]
  6. Cassman, K.G. Ecological intensification of cereal production systems: Yield potential, soil quality, and precision agriculture. Proc. Natl. Acad. Sci. USA 1999, 96, 5952–5959. [Google Scholar] [CrossRef] [PubMed] [Green Version]
  7. Fischer, R.; Connor, D. Issues for cropping and agricultural science in the next 20 years. Field Crop. Res. 2018, 222, 121–142. [Google Scholar] [CrossRef]
  8. Meng, Q.; Cui, Z.; Yang, H.; Zhang, F.; Chen, X. Establishing High-Yielding Maize System for Sustainable Intensification in China. Adv. Agron. 2018, 148, 85–109. [Google Scholar]
  9. National Bureau of Statistics of China (NBSC). China Statistical Yearbook 2020; Statistical Press: Beijing, China, 2020. [Google Scholar]
  10. Cui, Z.; Zhang, H.; Chen, X.; Zhang, C.; Ma, W.; Huang, C.; Zhang, W.; Mi, G.; Miao, Y.; Li, X.; et al. Pursuing sustainable productivity with millions of smallholder farmers. Nat. Cell Biol. 2018, 555, 363–366. [Google Scholar] [CrossRef]
  11. Lu, J.; Bai, Z.; Velthof, G.L.; Wu, Z.; Chadwick, D.; Ma, L. Accumulation and leaching of nitrate in soils in wheat-maize production in China. Agric. Water Manag. 2019, 212, 407–415. [Google Scholar] [CrossRef]
  12. Bai, Z.; Lu, J.; Zhao, H.; Velthof, G.L.; Oenema, O.; Chadwick, D.; Williams, J.R.; Jin, S.; Liu, H.; Wang, M.; et al. Designing Vulnerable Zones of Nitrogen and Phosphorus Transfers To Control Water Pollution in China. Environ. Sci. Technol. 2018, 52, 8987–8988. [Google Scholar] [CrossRef] [Green Version]
  13. Cui, Z.; Zhang, F.; Chen, X.; Miao, Y.; Li, J.; Shi, L.; Xu, J.; Ye, Y.; Liu, C.; Yang, Z.; et al. On-farm evaluation of an in-season nitrogen management strategy based on soil Nmin test. Field Crop. Res. 2008, 105, 48–55. [Google Scholar] [CrossRef]
  14. Ding, W.; Xu, X.; He, P.; Zhang, J.; Cui, Z.; Zhou, W. Estimating regional N application rates for rice in China based on target yield, indigenous N supply; N loss. Environ. Pollut. 2020, 263, 114408. [Google Scholar] [CrossRef]
  15. Zhang, C.; Ju, X.; Powlson, D.S.; Oenema, O.; Smith, P. Nitrogen Surplus Benchmarks for Controlling N Pollution in the Main Cropping Systems of China. Environ. Sci. Technol. 2019, 53, 6678–6687. [Google Scholar] [CrossRef]
  16. Huang, S.; Ding, W.; Yang, J.; Zhang, J.; Ullah, S.; Xu, X.; Liu, Y.; Yang, Y.; Liu, M.; He, P.; et al. Estimation of nitrogen supply for winter wheat production through a long-term field trial in China. J. Environ. Manag. 2020, 270, 110929. [Google Scholar] [CrossRef]
  17. Wei, Z.; Ying, H.; Guo, X.; Zhuang, M.; Cui, Z.; Zhang, F. Substitution of Mineral Fertilizer with Organic Fertilizer in Maize Systems: A Meta-Analysis of Reduced Nitrogen and Carbon Emissions. Agronomy 2020, 10, 1149. [Google Scholar] [CrossRef]
  18. Zhang, Y.; Wang, H.; Lei, Q.; Luo, J.; Lindsey, S.; Zhang, J.; Zhai, L.; Wu, S.; Zhang, J.; Liu, X.; et al. Optimizing the nitrogen application rate for maize and wheat based on yield and environment on the Northern China Plain. Sci. Total Environ. 2018, 618, 1173–1183. [Google Scholar] [CrossRef]
  19. Xu, X.; He, P.; Pampolino, M.F.; Johnston, A.M.; Qiu, S.; Zhao, S.; Chuan, L.; Zhou, W. Fertilizer recommendation for maize in China based on yield response and agronomic efficiency. Field Crop. Res. 2014, 157, 27–34. [Google Scholar] [CrossRef]
  20. Binford, G.D.; Blackmer, A.M.; Cerrato, M.E. Relationships between Corn Yields and Soil Nitrate in Late Spring. Agron. J. 1992, 84, 53–59. [Google Scholar] [CrossRef]
  21. Li, T.; Zhang, W.; Cao, H.; Ying, H.; Zhang, Q.; Ren, S.; Liu, Z.; Yin, Y.; Qin, W.; Cui, Z.; et al. Region-specific nitrogen management indexes for sustainable cereal production in China. Environ. Res. Commun. 2020, 2, 075002. [Google Scholar]
  22. Liu, X.; Xu, W.; Liu, L.; Du, E.; Shen, J.; Luo, X.; Zhang, X.; Goulding, K. Monitoring Atmospheric Nitrogen Deposition in China. In Atmospheric Reactive Nitrogen in China: Emission, Deposition and Environmental Impacts; Liu, X., Du, E., Eds.; Springer: Singapore, 2020; pp. 41–65. [Google Scholar]
  23. Lv, Y.; Wang, Y.; Wang, L.; Zhu, P. Straw Return with Reduced Nitrogen Fertilizer Maintained Maize High Yield in Northeast China. Agronomy 2019, 9, 229. [Google Scholar] [CrossRef] [Green Version]
  24. Song, D.; Hou, S.; Wang, X.; Liang, G.; Zhou, W. Nutrient resource quantity of crop straw and its potential of substituting. J. Plant Nutr. Fertil. 2018, 24, 1–21, (In Chinese with English abstract). [Google Scholar]
  25. Chuan, L.M.; He, P.; Pampolino, M.F.; Johnston, A.M.; Jin, J.Y.; Xu, X.P.; Zhao, S.C.; Qiu, S.J.; Zhou, W. Establishing a scientific basis for fertilizer recommendations for wheat in China: Yield response and agronomic efficiency. Field Crop. Res. 2013, 140, 1–8. [Google Scholar] [CrossRef]
  26. Ritchie, S.W.; Hanway, J.J.; Benson, G.O.; Herman, J.C. How a Corn Plant Develops; Iowa State University: Ames, IA, USA, 1993; Special Report No. 48. [Google Scholar]
  27. Douglas, L.A.; Riazi, A.; Smith, C.J. A semi-micro method for determining total nitrogen in soils and plant material containing nitrite and nitrate. Soil Sci. Soc. Am. J. 1980, 44, 431–433. [Google Scholar] [CrossRef]
  28. Henriksen, A.; Selmerolsen, A.R. Automatic methods for determining nitrate and nitrite in water and soil extracts. Analyst 1970, 95, 514–518. [Google Scholar] [CrossRef]
  29. Dobermann, A.R. Nitrogen Use Efficiency—State of the Art; University of Nebraska: Lincoln, NE, USA, 2005; Paper 316. [Google Scholar]
  30. Cui, Z.; Chen, X.; Miao, Y.; Li, F.; Zhang, F.; Li, J.; Ye, Y.; Yang, Z.; Zhang, Q.; Liu, C. On-Farm Evaluation of Winter Wheat Yield Response to Residual Soil Nitrate-N in North China Plain. Agron. J. 2008, 100, 1527–1534. [Google Scholar] [CrossRef]
  31. Dinnes, D.L.; Karlen, D.L.; Jaynes, D.B.; Kaspar, T.C.; Hatfield, J.L.; Colvin, T.S.; Cambardella, C.A. Nitrogen Management Strategies to Reduce Nitrate Leaching in Tile-Drained Midwestern Soils. Agron. J. 2002, 94, 153–171. [Google Scholar] [CrossRef]
  32. EU Nitrogen Expert Panel. Nitrogen Use Efficiency (NUE)-An Indicator for the Utilization of Nitrogen in Agriculture and Food Systems; Wageningen University (Alterra): Wageningen, The Netherlands, 2015. [Google Scholar]
  33. Schütz, L.; Gattinger, A.; Meier, M.; Müller, A.; Boller, T.; Mäder, P.; Mathimaran, N. Improving Crop Yield and Nutrient Use Efficiency via Biofertilization—A Global Meta-analysis. Front. Plant Sci. 2018, 8, 2204. [Google Scholar] [CrossRef] [PubMed] [Green Version]
  34. Cerrato, M.E.; Blackmer, A.M. Comparison of Models for Describing; Corn Yield Response to Nitrogen Fertilizer. Agron. J. 1990, 82, 138–143. [Google Scholar] [CrossRef] [Green Version]
  35. Cotrufo, M.F.; Wallenstein, M.; Boot, C.M.; Denef, K.; Paul, E. The Microbial Efficiency-Matrix Stabilization (MEMS) framework integrates plant litter decomposition with soil organic matter stabilization: Do labile plant inputs form stable soil organic matter? Glob. Chang. Biol. 2013, 19, 988–995. [Google Scholar] [CrossRef] [PubMed] [Green Version]
  36. Zhang, S.; Yue, S.; Yan, P.; Qiu, M.; Chen, X.; Cui, Z. Testing the suitability of the end-of-season stalk nitrate test for summer corn (Zea mays L.) production in China. Field Crop. Res. 2013, 154, 153–157. [Google Scholar] [CrossRef]
  37. Chen, X.-P.; Cui, Z.-L.; Vitousek, P.M.; Cassman, K.G.; Matson, P.A.; Bai, J.-S.; Meng, Q.-F.; Hou, P.; Yue, S.-C.; Romheld, V.; et al. Integrated soil-crop system management for food security. Proc. Natl. Acad. Sci. USA 2011, 108, 6399–6404. [Google Scholar] [CrossRef] [Green Version]
  38. Liu, L.; Yao, S.; Zhang, H.; Muhammed, A.; Xu, J.; Li, R.; Zhang, D.; Zhang, S.; Yang, X. Soil nitrate nitrogen buffer capacity and environmentally safe nitrogen rate for winter wheat-summer maize cropping in Northern China. Agric. Water Manag. 2019, 213, 445–453. [Google Scholar] [CrossRef]
  39. Wang, H.; Ju, X.; Wei, Y.; Li, B.; Zhao, L.; Hu, K. Simulation of bromide and nitrate leaching under heavy rainfall and high-intensity irrigation rates in North China Plain. Agric. Water Manag. 2010, 97, 1646–1654. [Google Scholar] [CrossRef]
  40. Sainju, U.M.; Lenssen, A.W.; Allen, B.L.; Stevens, W.B.; Jabro, J.D. Soil residual nitrogen under various crop rotations and cultural practices. J. Plant Nutr. Soil Sci. 2017, 180, 187–198. [Google Scholar] [CrossRef] [Green Version]
  41. Cui, Z.; Zhang, F.; Chen, X.; Dou, Z.; Li, J. In-season nitrogen management strategy for winter wheat: Maximizing yields, minimizing environmental impact in an over-fertilization context. Field Crop. Res. 2010, 116, 140–146. [Google Scholar] [CrossRef]
  42. Liu, X.; Zhang, Y.; Han, W.; Tang, A.; Shen, J.; Cui, Z.; Vitousek, P.; Erisman, J.W.; Goulding, K.; Christie, P.; et al. Enhanced nitrogen deposition over China. Nat. Cell Biol. 2013, 494, 459–462. [Google Scholar] [CrossRef] [PubMed]
  43. Burger, M.; Venterea, R.T. Nitrogen Immobilization and Mineralization Kinetics of Cattle, Hog, and Turkey Manure Applied to Soil. Soil Sci. Soc. Am. J. 2008, 72, 1570–1579. [Google Scholar] [CrossRef]
  44. Ma, L.; Bai, Z.; Ma, W.; Guo, M.; Jiang, R.; Liu, J.; Oenema, O.; Velthof, G.; Whitmore, A.; Crawford, J.; et al. Exploring Future Food Provision Scenarios for China. Environ. Sci. Technol. 2018, 53, 1385–1393. [Google Scholar] [CrossRef] [PubMed]
  45. Chuan, L.; He, P.; Jin, J.; Li, S.; Grant, C.; Xu, X.; Qiu, S.; Zhao, S.; Zhou, W. Estimating nutrient uptake requirements for wheat in China. Field Crop. Res. 2013, 146, 96–104. [Google Scholar] [CrossRef]
Figure 1. Monthly precipitation and maximum and minimum temperatures from 2009 to 2019 at Dahe station in north-central China.
Agronomy 11 01358 g001
Figure 2. Response of relative yield, N input, and N output as a function of TNsupply. (a). Relationship between TNsupplyy and relative yield. (b). Relationship between TNsupplyy and N input. (c). Relationship between TNsupplyy and N output. “*” means p < 0.05.
Agronomy 11 01358 g002
Figure 3. Relationship between N input and N output. The slope of the diagonal wedge represents a range of desired NUE between 55.4% and 90.0%: the orange part means lower values of NUE, which could exacerbate N pollution, while the yellow part means higher values of NUE, which risk mining of soil N stocks. “*” means p < 0.05.
Agronomy 11 01358 g003
Figure 4. Correlation between TNsupply and relative yield, N input, and N output, respectively. The dependent variables Y and X are the variables in front and at the end of the arrow, respectively. The orange part indicates the actual existence of the current stage, and the white part is the part removed in the current stage.
Agronomy 11 01358 g004
Figure 5. Flowcharts showing the use of suitable total nitrogen supply levels to make fertilizer recommendations. Kilograms per hectare was the unit of the values.
Agronomy 11 01358 g005
Table 1. Grain yields of summer maize in NE and FP treatments from 2009 to 2019.
YearNE (Mg ha−1)FP (Mg ha−1)
0N2N3N0N2N3N
20096.1b 16.0b6.9a5.9b5.9b6.5ab
20105.6cd6.2bc6.9ab5.4d6.6ab7.0a
20115.9b7.0a7.5a5.9b7.0a7.3a
20127.4c8.1abc8.6a6.5d7.8bc8.5ab
20136.5b7.8a7.8a5.3c7.1ab7.6a
20146.1c7.8a8.1a6.3bc7.5ab7.5ab
20153.9c5.7a6.0a4.8b5.8a6.3a
20163.9c6.5ab7.1a4.0c6.3b6.0b
20176.7b7.8a7.9a6.5b7.6a7.5a
20186.1c7.0b8.0a5.8c6.7b7.5ab
20195.2b7.4a7.7a6.4b7.2ab6.9ab
Average5.8c7.0b7.5a5.7c6.9b7.1ab
1 Values followed by different letters in the same column for different treatments are significantly different at the 0.05 probability level.
Table 2. Recovery efficiency, agronomic efficiency, physiological efficiency, and partial factor productivity of nitrogen in NE and FP treatments from 2009 to 2019.
YearREN (%)AEN (kg kg−1)PEN (kg kg−1)PFPN (kg kg−1)
NEFPNEFPNEFPNEFP
200919.5a 115.6b3.2b4.0a16.4b25.4a28.7b46.2a
201028.3a23.1b7.2a5.4b25.3a23.5a38.3a23.4b
201130.3a14.8b10.7a4.7b35.2a31.7b49.8a24.2b
201225.5a27.6a6.8b8.7a26.6b31.4a47.4a37.6b
201326.6b44.9a6.9b10.2a25.8a22.8b42.8a33.7b
201443.2a33.9b10.5a5.3b24.3a15.6b44.2a33.4b
201558.6a35.9b11.7a6.7b19.9a18.7a33.0a28.2b
201653.8a29.5b17.3a9.1b32.1a30.9a38.9a26.7b
201747.1a25.8b6.3a4.3b13.5b16.5a43.3a33.1b
201842.5a37.2b10.6a7.5b24.9a20.0b43.9a33.4b
201951.8a24.7b14.0a2.1b27.0a8.5b42.4a30.7b
Average38.8a28.5b9.6a6.2b24.6a22.3b41.1a31.9b
1 Values followed by different letters in the same column for different treatments are significantly different at the 0.05 probability level.
Table 3. Different sources of nitrogen and total nitrogen supply during the whole maize growing season.
YearTreatmentNE (kg ha−1)FP (kg ha−1)
NsoilNenvNstrawNfertTNsupplyNsoilNenvNstrawNfertTNsupply
20100N2092819025618828180233
2N19428181804202132822300563
3N21128281804472042834300566
20110N1632820021114528180191
2N20928381504242162844300588
3N21228451504352212849300598
20120N63282501155828290114
2N2832843035434728450420
3N19128421824433232855225631
20130N4828130886428120104
2N772817182304772821225351
3N11028451823651822860225494
20140N56282001046728190114
2N652831182306702839225362
3N21828481824754202850225723
20150N97271401388727130127
2N1392751021724527540326
3N22927581824964122768225732
20160N134288017013728110175
2N13328131823561412823225417
3N24228371824884482855225755
20170N106341001509934120145
2N11334271823561443440225444
3N14334371823961803441225479
20180N8932801298632100129
2N2223232028628532450363
3N30832421825643573249225664
20190N5719508221196046
2N521954182306421960225346
3N9019441823351681955225467
Publisher’s Note: MDPI stays neutral with regard to jurisdictional claims in published maps and institutional affiliations.

