Article

Nitrogen and Phosphorus Accumulation in Horizontal Subsurface Flow Constructed Wetland

Faculty of Civil Engineering, Architecture and Environmental Engineering, Institute of Environmental Engineering, University of Zielona Góra, 15 Prof. Z. Szafrana St, 65-516 Zielona Góra, Poland
Agronomy 2021, 11(7), 1317; https://doi.org/10.3390/agronomy11071317
Submission received: 27 May 2021 / Revised: 23 June 2021 / Accepted: 24 June 2021 / Published: 28 June 2021

Abstract

:
The article presents the results of studies aimed at determining the level of accumulation of total nitrogen and total phosphorus in parts of reeds (Phragmites australis (Cav.) Trin. ex Steud.), as well as in a constructed wetland bed. The influence of the vegetative phase and dormancy of plants on the level of accumulation of biogenes in plant parts and in the bed of constructed wetland was investigated. Young plants at the stage of intensive growth were found to contain the most total nitrogen and total phosphorus. The leaves of the common reed, on the other hand, revealed the highest ability for the phytoaccumulation of nitrogen (32.21 gN/kg d.m.). Accumulation of total phosphorus in the leaves of reeds was, on average 1.54 gP/kg d.m. The results of studies on the filtration material filling the beds showed that the surface layer of up to 20 cm in depth was characterized by the highest total nitrogen content and total phosphorus content (average: 12.53 gN/kg d.m. and 3.01 gP/kg d.m.). The accumulation of these compounds decreased along with the depth of the deposit as well as in the direction of the outflow of sewage from the constructed wetland.

1. Introduction

Constructed wetlands may be used for treating municipal sewage, industrial sewage, leakage from landfills, and stormwater and surface runoff from land used for agricultural purposes, highways, or airports [1,2,3,4,5,6,7]. In wetlands wastewater treatment plants, hydraulic and habitat conditions are a model of natural wetland ecosystems. Wastewater treatment is carried out as a result of the intensification of mechanical, chemical, and biological processes taking place in the natural soil, plant, and water environment. Under such conditions, it is possible to remove organic contaminants, nitrogen, and phosphorus.
The transformation and removal of nitrogen compounds from sewage in hydrophyte systems are possible in simultaneously occurring ammonification, nitrification, and denitrification processes, whereas the temporary retention of nitrogen in the ecosystem can take place as a result of bioaccumulation (phytoaccumulation) in the biomass, as well as sorption processes in the soil [8,9]. In constructed wetlands, the denitrification process can remove approximately 60–70% of the total removed nitrogen, of which 20–30% is hydrogen taken up by plants [10]. The efficiency of the denitrification process varies from 0.003 to 1.02 gN/m2·d. The speed of the process depends on the presence of NO3 ions and the rate of their migration from aerobic to anaerobic microzones. Constructed wetlands have proven potential for nitrogen removal, but nitrogen removal efficiency has been inconsistent due to inadequate observation of nitrogen transformation and removal mechanisms [11]. The phosphorus in the wetland system cycles between the soil, sediments, water, and vegetation, which can cause short-term and long-term accumulation of phosphorus in the system. The removal of phosphorus from sewage is attributed mainly to sorption and precipitation processes, plant and microbial accumulation, filtration, sedimentation, and mineralization. The efficiency of sorption and precipitation processes is connected with the pH, oxidation-reduction potential, presence of iron and aluminum ions, or the sorption capacity of the soil. Recognizing the mechanisms of removing nitrogen and phosphorus, as well as the influence of vegetation on the efficiency with which the systems operate, has become a topic of particular interest for researchers [12,13,14,15].
Plants used for assimilation and storing nutrients ought to be characterized by fast growth, high contents of nutrients in tissues, and the ability to obtain a high-quality plant yield. Plants that have a high accumulation of biomass in the autumn-winter period may release some of the gathered substances back into the system in the winter [16]. The role of constructed wetlands relies on supporting sewage treatment processes by:
  • transporting oxygen from the above-ground parts to the root zone;
  • loosening the structure of the soil with the aid of roots and maintaining good water permeability and soil patency;
  • taking up nutrients and water.
Common reed (Phragmites australis) is frequently applied to inhabit constructed wetlands due to the unique structure of its above-ground parts, its extensive root and rhizome systems, as well as significant tolerance to sub-zero temperatures and hot weather [17]. A feature enabling the functioning of macrophytes in unfavorable oxygen conditions is the air tissue called the aerenchyma. The aerenchyma, which can take up as much as 60% of the volume of stems and rhizomes, facilitates the transport of oxygen from above-ground parts of plants to organs found below the surface of the water [18]. Oxygen microzones (with O2) are formed near the rhizomes and roots of the reed, followed by oxygen-deprived zones (without O2 in the presence of NO3). In such a manner, a mosaic of aerobic and anaerobic microzones is formed, facilitating the development of heterotrophic microorganisms. This leads to the creation of the right conditions for both aerobic and anaerobic metabolic biochemical reactions of organic matter introduced with the sewage.
The analysis of literature data shows that the findings of authors regarding the influence of roots on the water permeability of a bed vary. A developed system of macrophyte rhizomes and roots spreading through the soil has a positive influence on the even infiltration of sewage, as well as facilitating the intensive growth of plants. The dying roots and rhizomes of plants undergo decomposition, leaving behind cylindrical spaces and canals. The hydraulic conductivity of the soil increases and stabilizes [19]. Spychała et al. showed that during the post-vegetative season of plants, the filtration coefficient reached the highest value, whereas the filtration time of sewage shortened [20]. According to Brix, the growth of rhizomes may lead to the increasing density of the filtration bed, thus leading to a degradation of its permeability. Too low permeability may be the reason behind sewage flowing across the surface of the bed, which leads to reduced efficiencies of sewage treatment [18]. According to Zhiwei et al., nutrient enrichment efficiency varies with the season and soil depth. The highest N and P enrichment efficiencies of the plant communities occurred in summer in a 0–15 cm soil layer, while the enrichment of P occurred uniformly in all vertical soil layers [21].
The growth of hydrophyte biomass is connected with the phytoaccumulation of nitrogen and phosphorus in their tissues. P. australis significantly improves the efficiency of removing total nitrogen and total phosphorus from sewage due to the high growth rate and high ability to accumulate nutrients in the stem, roots, and rhizomes [22]. There is a rather significant difference in taking up the macro- and microelements by individual macrophyte species. The differences in the accumulation of elements are found not only in individual species but also in individual plant parts of the same species. As given by Ozimek and Renman, the leaves of the common reed may contain a maximum amount of 3.50% d.m. nitrogen and 0.15% d.m. phosphorus, whereas stems contain 0.90% nitrogen and 0.08% phosphorus in dry mass. The accumulation of nitrogen in the rhizomes of the reed is 0.6% d.m., and 0.9% d.m. in the roots [23]. The length of time that the plants retain the taken-up biogenic elements depends on the phenological cycle and the abiotic and biotic factors modifying it. Macrophytes take up biogenic elements mainly in the spring and summer, whereas near the end and after completing the vegetative season, they may become a source of these elements in the system. The return of elements is confirmed by studies carried out in constructed wetlands by Obarska-Pempkowiak [24] as well as by Jakubaszek [25].
The article presents the results of research aimed at determining the level of accumulation of total nitrogen and total phosphorus in individual parts of reeds (Phragmites australis) and the amount of nitrogen and total phosphorus deposited in the bed of the wetland wastewater treatment plant, taking seasonality into account. In the available literature on the subject, there is little data on the level of accumulation and the distribution of nitrogen and phosphorus in the vertical and horizontal profile of the wastewater treatment plant bed. Research is often carried out on a model, semi-technical scale, or in new treatment plants operated for several months. The research carried out and described in the article concerned a real sewage treatment plant with several years of operation, taking seasonality into account.

2. Materials and Methods

The studies were carried out in constructed wetlands, operated for 15 years, with a horizontal subsurface flow of sewage, for a flow rate of 1300 PE, located in western Poland. The surface of the HS-SF (horizontal subsurface flow) is 3800 m2 and covered with reeds (Phragmites australis).
After mechanical treatment in a 3-chamber sedimentation tank, wastewater is directed to a distribution well located just before the bed. Then, in the filter layer, the wastewater is distributed evenly across the whole width of the deposit by means of perforated hole pipelines (Figure 1).
In the studied period, the temperature of raw sewage ranged from 7.5 °C to 21.3 °C, and the treated sewage ranged from 4.0 °C to 22.5 °C. During the growing season, the average temperature of raw sewage was 17.47 °C, and the temperature of treated sewage was 16.66 °C. In the post-vegetation period, the temperatures were 10.47 °C and 7.4 °C, respectively. The wastewater flowing into the wastewater treatment plant bed contained from 66.50 to 164.50 mg/L of total nitrogen (on average 105.4 ± 29.2 mg/L) and 9.45 ÷ 33.70 mg/L of total phosphorus (on average 16.3 ± 7.4 mg/L). In treated sewage, the concentration of total nitrogen was in the range of 49.00 ÷ 98.00 (mean 68.2 ± 15.0 mg/L), and total phosphorus 7.86 ÷ 14.30 (mean 11.5 ± 2.3 mg/L).
The root pond is rectangular in shape, measuring 40 m in width and 95 m in length. The arrangement of sealing layers is as follows:
  • clay layer, 40 cm in thickness;
  • gravel (6–12 mm) and boulder (20–32 mm) layer, 40 cm in thickness;
  • soil and sand layer (5–10 mm), 40 cm in thickness.
After the wastewater is discharged from the hydrophyte plot, it makes its way through a collecting pipeline to a collecting well, and then, by means of a drainage ditch, it flows into the stabilization ponds and, finally, the collector.
Research material was collected ten times, every five weeks. The research assumed: the growing season from 1 April to 30 September and the post-vegetative period from 1 October to 31 March. Plant material, as well as samples of the bed, were taken at the beginning, middle, and end parts of the hydrophytic subplot. The plants taken for tests were divided into leaves, stem, root, and panicle. Samples of air-dry plant material were broken up in a grinder, into pieces smaller than 0.25 mm, and next dried in a drier to a constant mass. The bed samples were taken from three depths, counting from the bed surface: 0–20 cm, 20–40 cm, and 40–60 cm using the method of multiple mixing. In each selected point, 4 primary samples were taken and then joined, making one general sample. In order to prepare a laboratory sample, the general sample was located on a plastic tray, and then thoroughly mixed. In order to obtain average content, plant parts and other solid contaminations were removed. Samples prepared in this way were dried to an air-dry state, then crushed in a mortar and screened using a sieve with a mesh size of 2 mm.
The total Kjeldahl nitrogen TKN in the soil samples was determined by means of a titrimetric method, titrating the distillate with a nominated solution of sodium base (after mineralization of the soil samples in the sulfuric acid environment using a microwave mineralizer Ertec-Magnum II (Ertec, Wroclaw, Poland), and after distillation of ammonia in a strongly alkaline environment in Vapodest 30 (Gerhardt GmbH, & Co. KG, Koenigswinter, Germany). Total phosphorus in the samples was determined by Komprath’s colorimetric method (after mineralization). The content of organic matter was determined by the weight method, dry combustion in a muffle furnace at a temperature of 550 °C.

Statistical Analysis and Graphing of Research Results

Statistical verification of results was carried out using the STATISTICA 12.0 program of StatSoft Poland. A two-factor analysis of variance (ANOVA) for a randomized block plan was carried out on the results.
In the test above, a level of significance at α = 0.05 was assumed. In the case of rejecting the zero hypotheses, Tukey’s posthoc test of multiple comparisons of differences between pairs of averages at individual levels (factor A or factor B, or interactions AB) was carried out. The aim of this was to indicate the statistical (for α = 0.05) differences between the average value of the analyzed feature at an appropriate level of factors accounted for in a given statistical model.
Prior to assuming the analysis of variance, the compatibility of the residual distribution of corresponding models with the normal distribution using the Shapiro-Wilk test was carried out, where the level of significance was assumed as α = 0.01. All of the indicated variables were found to be characterized by a normal Gaussian distribution.

3. Results of Studies and Discussion

3.1. Phytoaccumulation of Total Nitrogen and Total Phosphorus in Common Reed (P. australis)

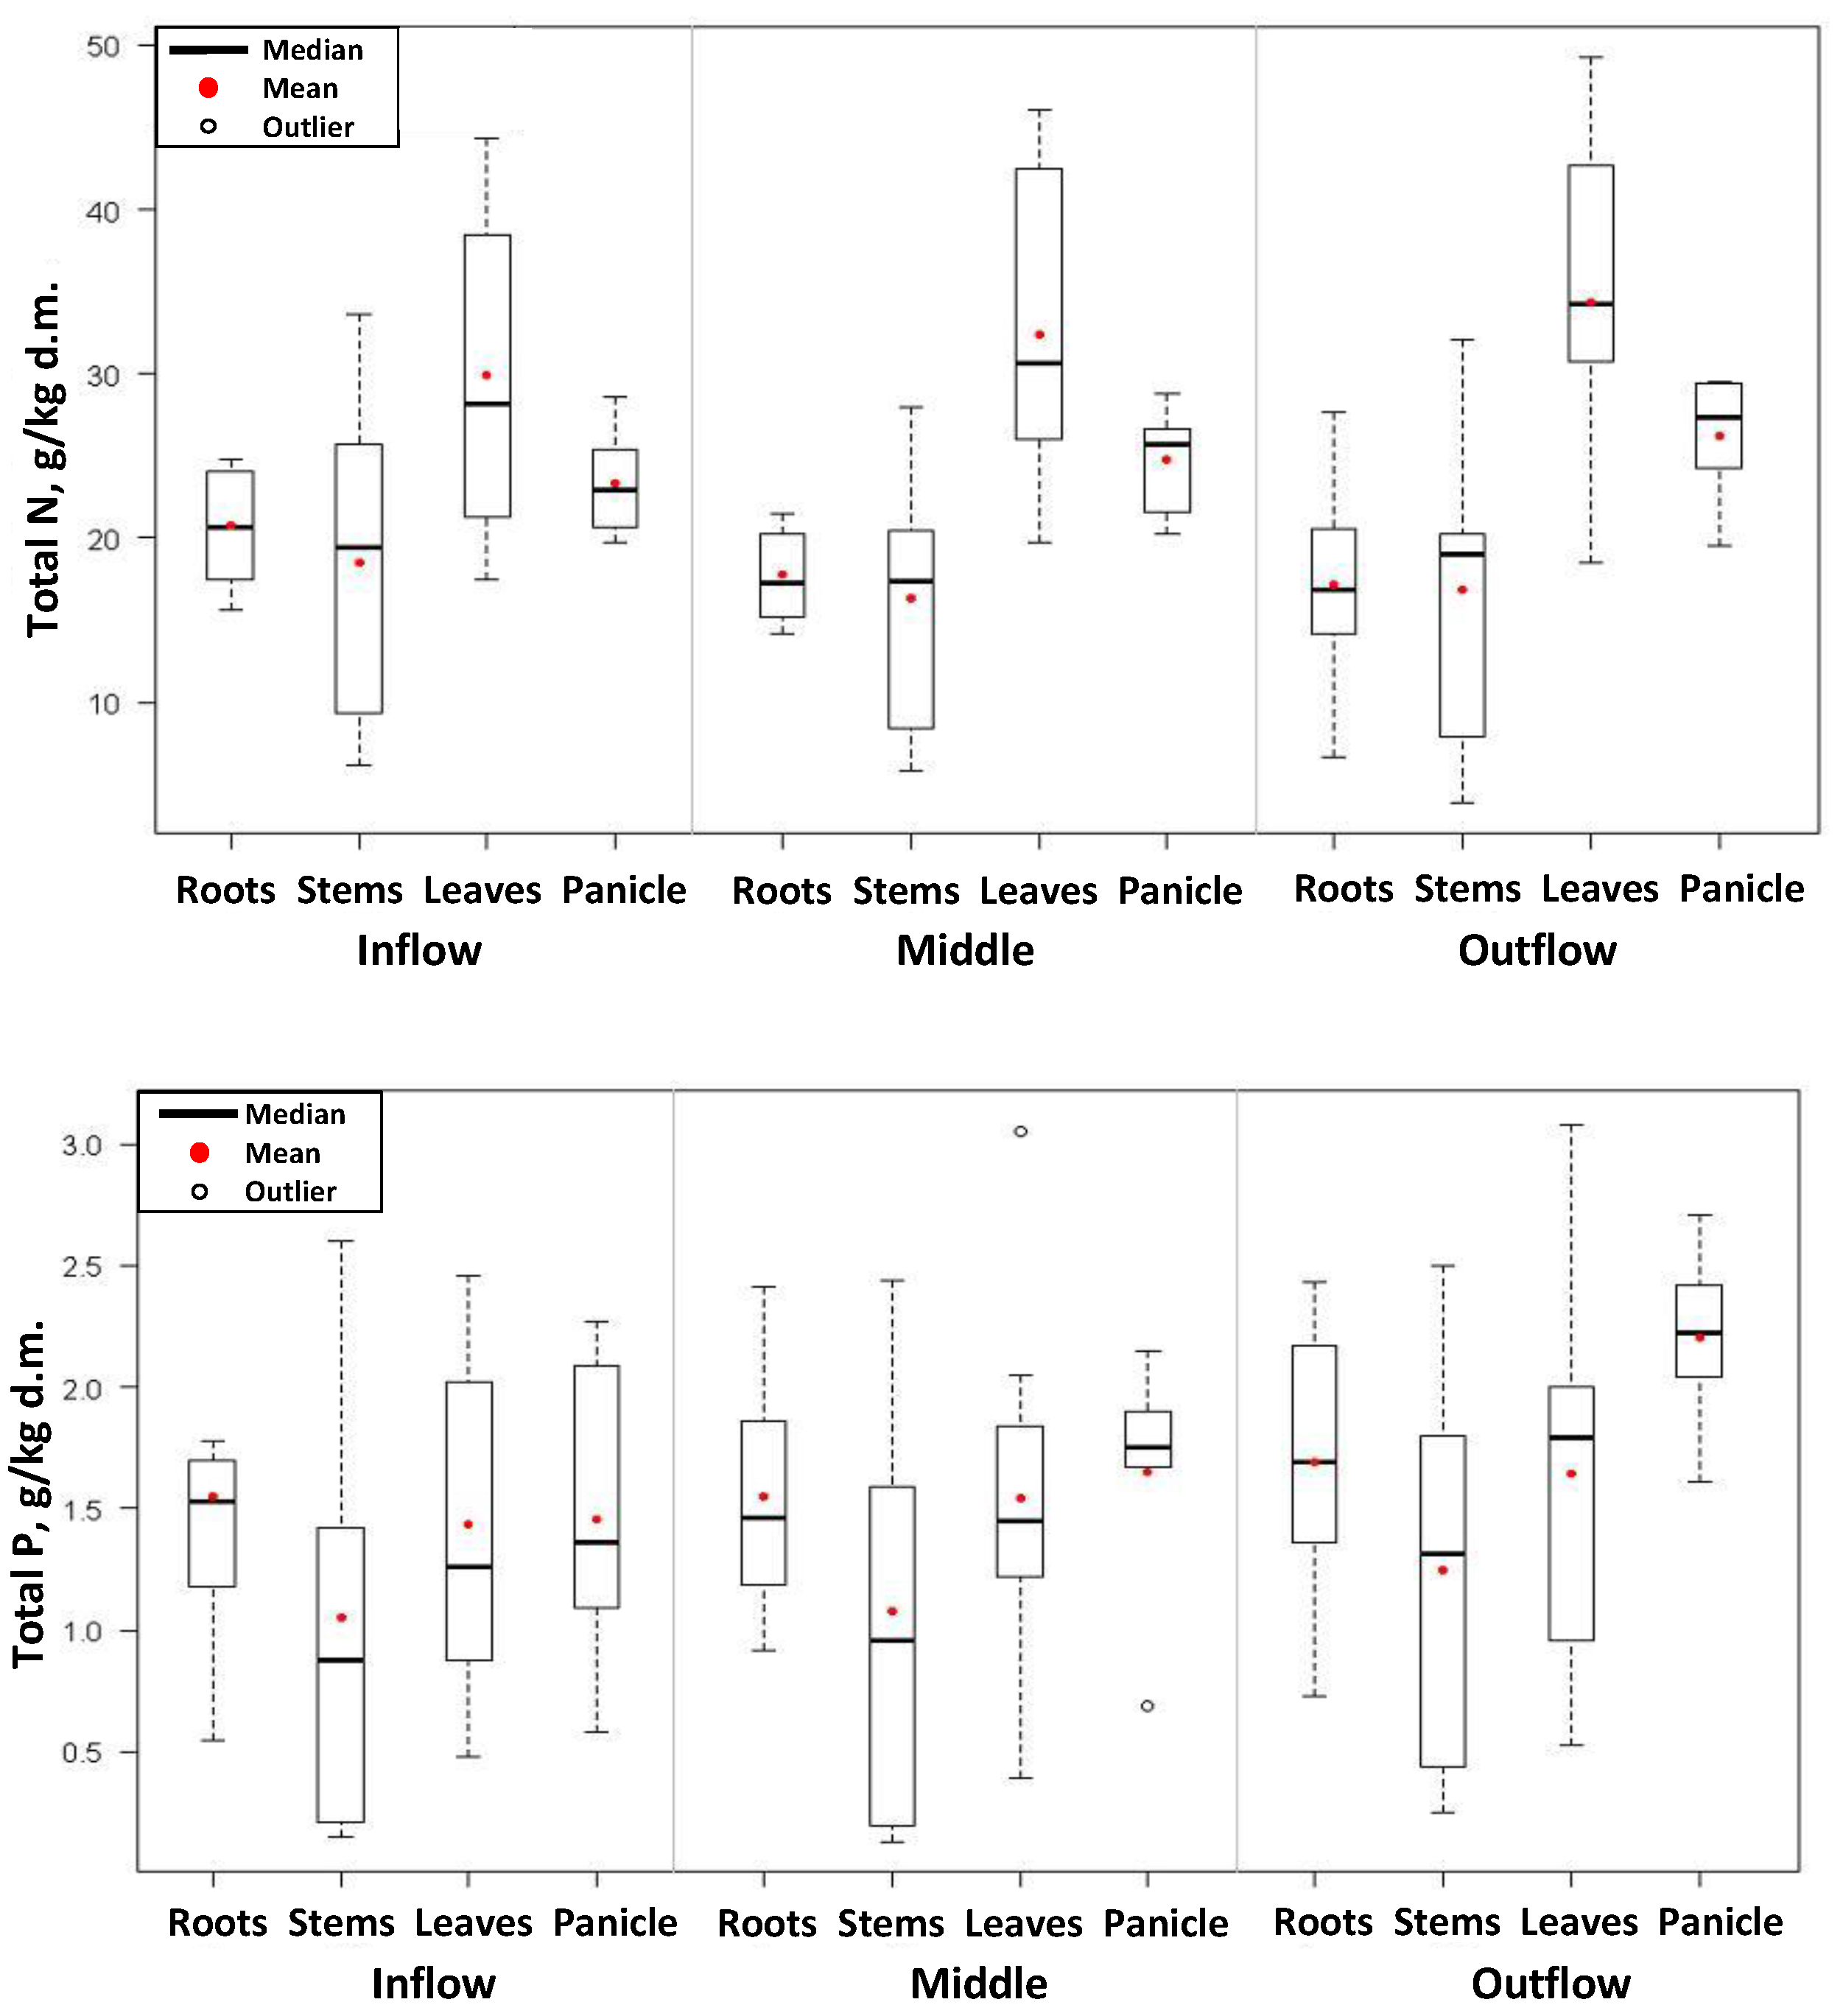
The ranges of concentration of total nitrogen and total phosphorus in individual parts of reeds, accounting for the place where they were collected, have been presented in Figure 2. The results of the studies show that young plants contained the most total nitrogen and total phosphorus during the phase of their intense growth. The amount of accumulated nitrogen and phosphorus dropped in the following months of the vegetative period.
Leaves and stems of reeds were characterized by the highest variability in nitrogen and phosphorus concentration in the subsequent months of growth. The accumulation of nitrogen and phosphorus in the subterranean parts of macrophytes and the inflorescence changed to a lesser degree.
The highest amounts of total nitrogen were accumulated in the leaves of reeds 17.50 ÷ 49.29 g/kg d.m. (average: 32.21 ± 9.7 g/kg d.m.). The total nitrogen content in the subterranean parts of reeds was from 6.67 g/kg d.m. to 27.71 g/kg d.m. (which corresponds to the average value of: 18.56 ± 4.3 g/kg d.m.). The stems contained from 3.89 to 33.60 g/kg d.m. of total nitrogen (average value: 17.25 ± 8.3 g/kg d.m.) The reed panicle accumulated from 19.53 to 29.53 g total nitrogen/kg d.m. (average: 24.79 ± 3.5 g/kg d.m.).
The content of total phosphorus in the roots of reeds ranged from 0.55 to 3.10 g/kg d.m. (average value: 1.63 ± 0.6 g/kg d.m.). The stems of plants contained from 0.13 to 2.60 g/kg d.m. of total phosphorus (average: 1.13 ± 0.8 g/kg d.m.). The phosphorus concentration in the leaves of the plants was in the range from 0.39 to 3.08 g/kg s.m. (with an average value of: 1.54 ± 0.8 g/kg d.m.). The reed panicle contained from 0.58 g/kg d.m. to 2.71 g/kg d.m. total phosphorus (average: 1.77 ± 0.6 g/kg d.m.).
According to Vymazal et al. [26], the total nitrogen content in reeds inhabiting single-phase HF-CW beds with subsurface sewage flow in Czech constructed wetlands varied from: 9.0 to 20.8 g/kg d.m. in the stems, from 15.0 to 43.0 g/kg d.m. in the leaves, and from 16.0 to 46.0 g/kg d.m. in the subterranean parts. According to the authors, the accumulation of nitrogen in the stems of reeds growing in natural sites can reach as much as 51.0 g/kg d.m.
The constructed wetlands analyzed by Gajewska and Obarska-Pempkowiak [27] were characterized by an average accumulation of nitrogen in reeds amounting to: object I—24.2 g/kg d.m., and object II—25.8 g/kg d.m. The authors believe that the higher the accumulation of nitrogen in the reed in the constructed wetland in Sarbsk, the more likely it was caused by a higher concentration of contaminants in the sewage flowing through it.
The average values of total nitrogen and phosphorus in individual parts of the reeds were higher than values given by Ozimek and Renman [23]. The authors report that the concentration of nitrogen in the leaves of reeds was 3.5%, 0.9% in the stems, and 0.6% in the rhizomes; total phosphorus, on the other hand, was characterized by values of 0.15% in the leaves and 0.08% in the stems and rhizomes.
The studies of Vymazal [28] showed the direct role of plants in nutrient removal in HF CWs. The common values of standing stock vary in the range of 30–80 g N m−2 and 2–6 g P m−2. Under the conditions of low loadings, the portion of removed nitrogen or phosphorus could be substantially higher (>100 g N m−2 and 10 g P m−2).
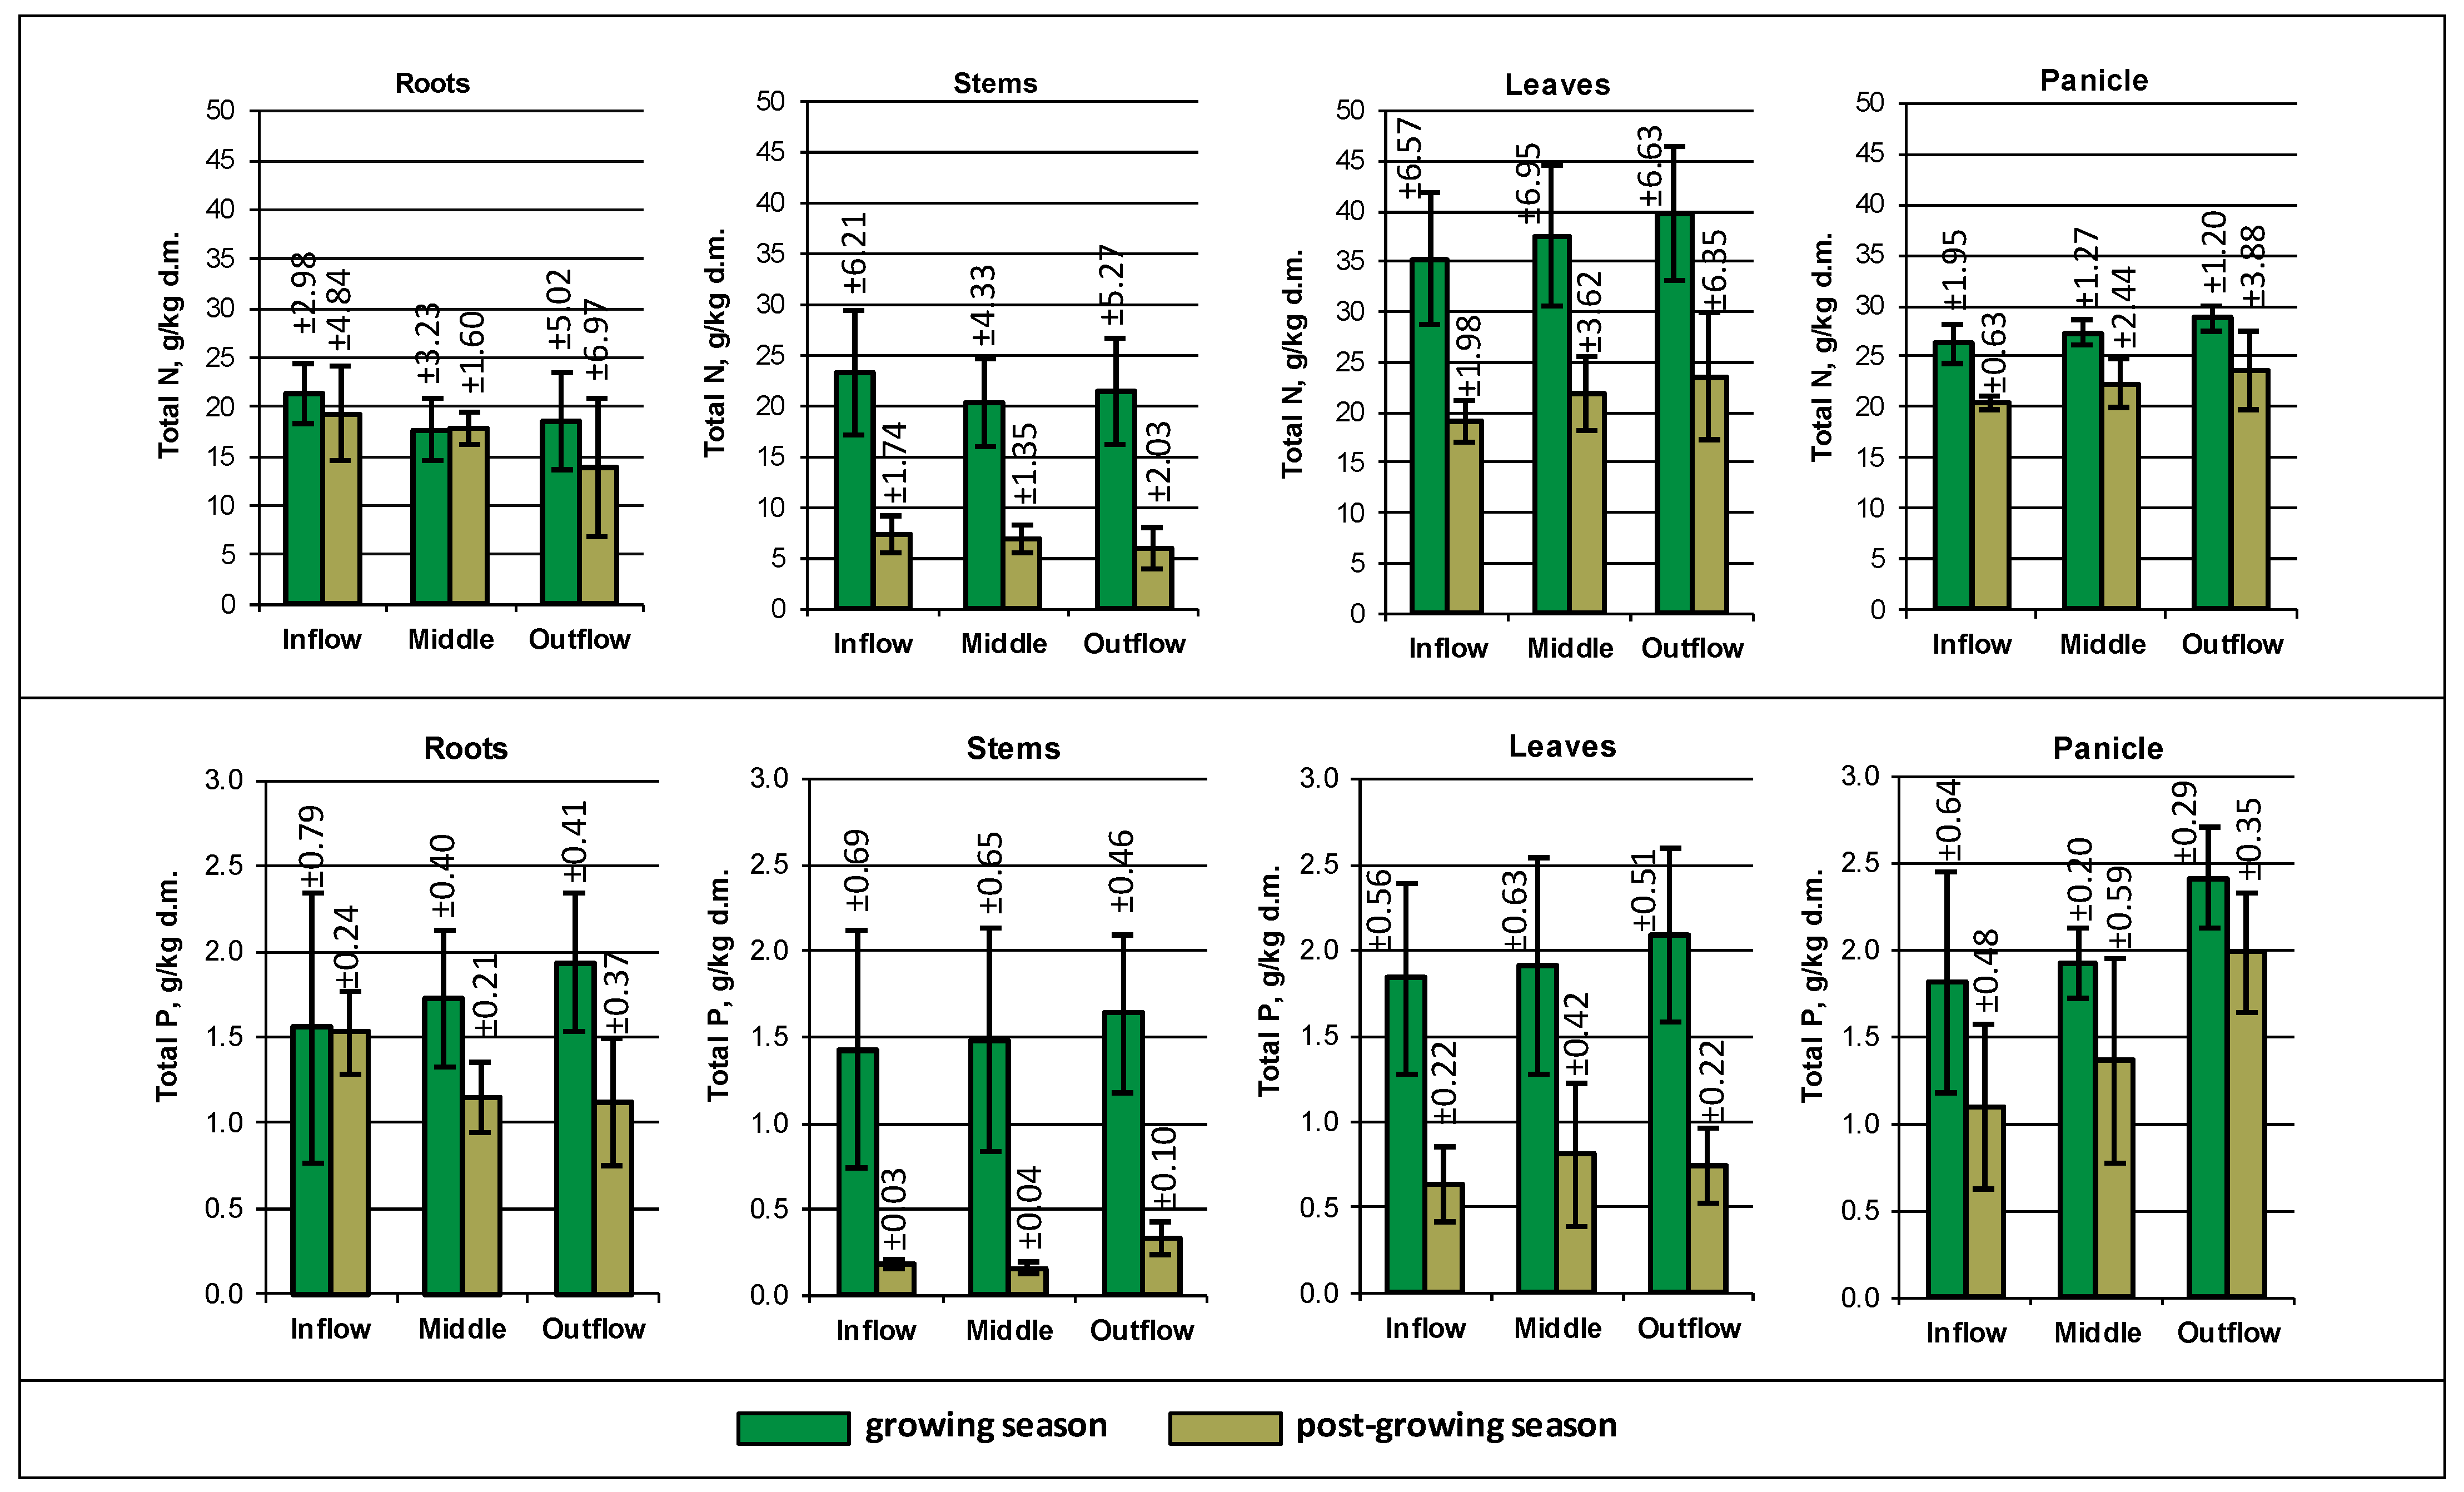
The study confirmed that during the vegetative period of plants, the amount of accumulated total nitrogen and phosphorus in individual parts of reeds was higher than post-vegetation (Figure 3). The highest differences in total nitrogen and phosphorus contents in the vegetative and post-vegetative periods were observed in the stems of the plant. In the vegetative period, reed stems accumulated on average 2.77 g/kg d.m. of nitrogen and 1.51 g/kg d.m. of phosphorus, whereas in the post-vegetative period, the respective values of these elements were 6.69 and 0.22 g/kg d.m.
High seasonal changes in phytoaccumulation were also noted in the leaves of P. australis. The average value of nitrogen in the vegetative period was 37.56 g/kg d.m. In the off-season, the leaves contained 21.54 g/kg d.m. nitrogen. Both during the vegetative period as well as the period of dormancy, the nitrogen contents in the leaves of reeds were higher in plants collected near the end of the constructed wetland than in reeds from the first part of the bed. The average value of nitrogen in leaf samples collected from the beginning of the subplot was 35.30 g/kg and 39.78 g/kg/d.m. in the end part. In the off-season, the plant leaves contained significantly less total nitrogen, which amounted to anywhere from 19.12 in the initial part of the bed to 23.61 gN/kg d.m. in the end section.
During the vegetative period, the accumulation of total phosphorus in the leaves of P. australis was, on average, 1.95 gP/kg d.m., with a lower value of 0.73 gP/kg d.m. noted in the off-season. During vegetation, the leaves of reeds collected near the inflow contained, on average, 1.84 gP/kg d.m., as compared to 2.09 gP/kg d.m. determined at the end of the bed. In the post-vegetative season, these respective values were 0.63 gP/kg d.m. and 0.75 gP/kg d.m.
Total nitrogen content in the rhizomes and inflorescence of reed did not undergo major seasonal changes. The average value of nitrogen in the subterranean parts of the plant varied from 19.23 g/kg d.m. in the vegetative period to 16.99 g/kg d.m. in the post-vegetative period. The reed panicle contained 27.46 g/kg d.m. of nitrogen during vegetation, whereas in the winter period, the amount of nitrogen was lower and averaged 22.12 gN/kg d.m.
During the vegetative period, the average amount of total phosphorus contained in the rhizomes of reeds was approximately 1.74 g/kg d.m. After the vegetation period, the average total phosphorus content in subterranean parts of the plant was somewhat lower: 1.27 g/kg d.m. of phosphorus. The reed panicle collected during the plant’s vegetative period accumulated 2.06 g/kg d.m. phosphorus. In the off-season, the dry panicles contained lesser amounts of total phosphorus, i.e., 1.49 g/kg d.m.
In the initial part of the bed, intensive growth of reeds was observed, the plants in the period of full development were high (approx. 3 m), with the number approximately 384 pcs/m2.. In the middle of the wetland bed, the reeds were lower (approx. 224 pieces/m2). At the outflow of sewage from the treatment plant, the reed height was about 1.5 m, the amount was about 66 pcs/m2.

3.2. Accumulation of Total Nitrogen and Phosphorus in the Constructed Wetland Bed

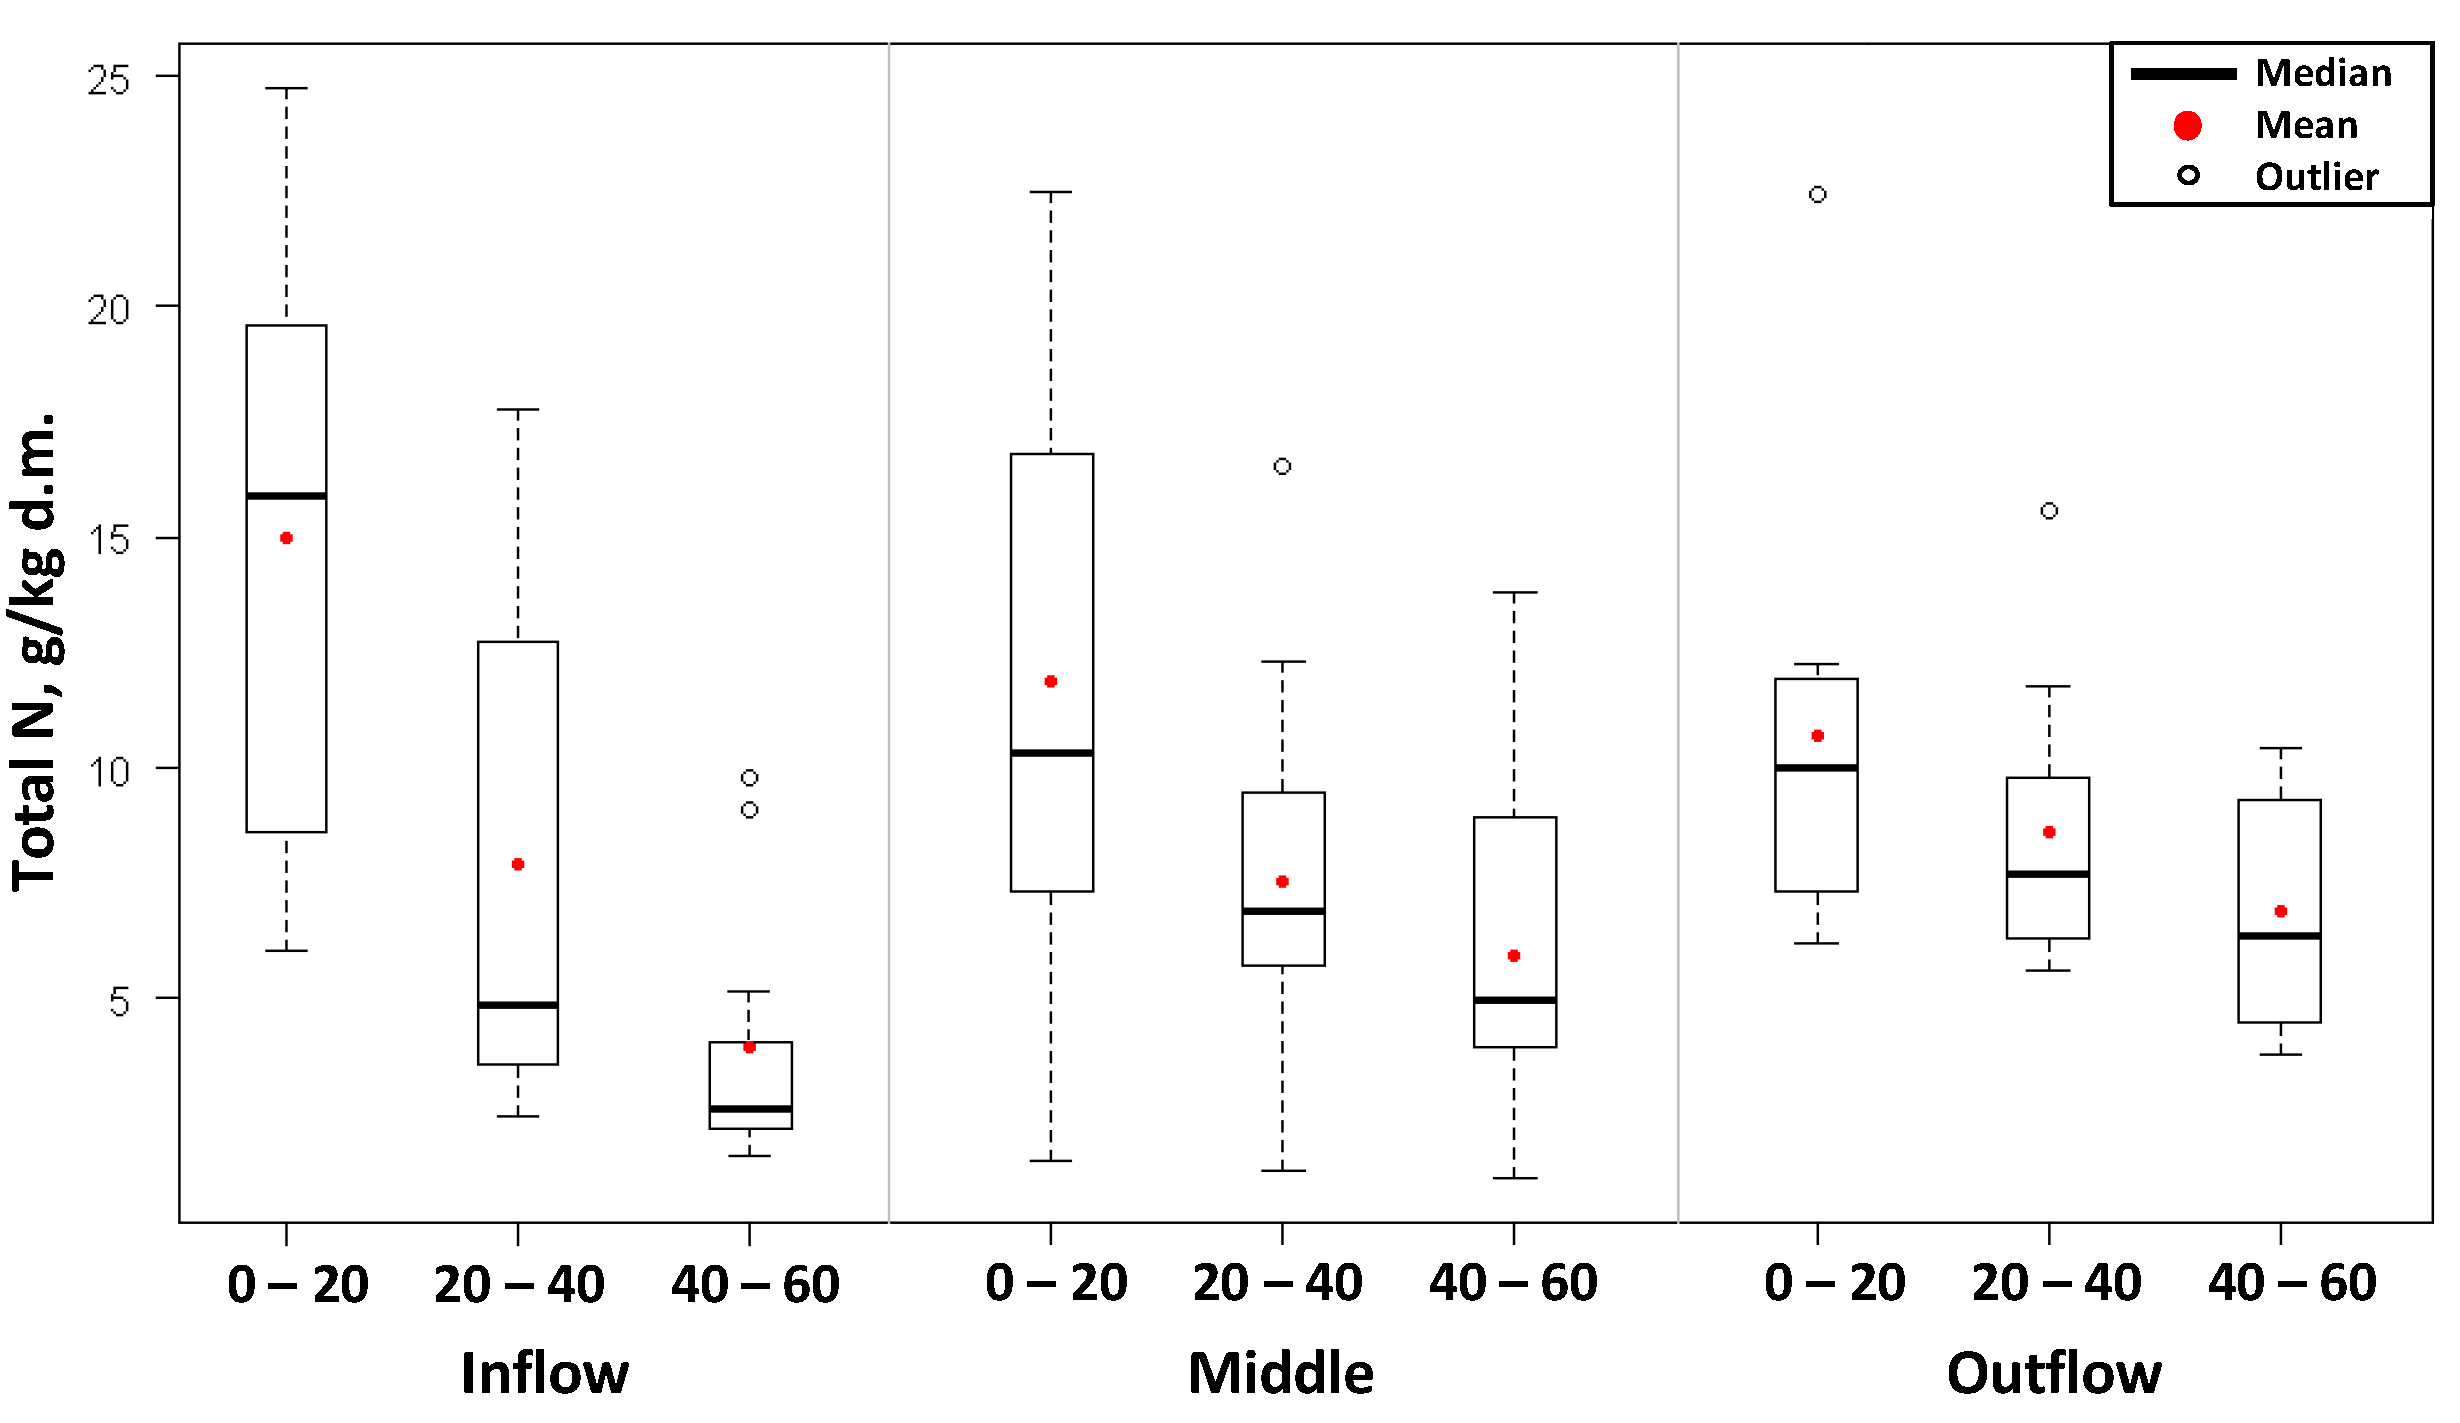
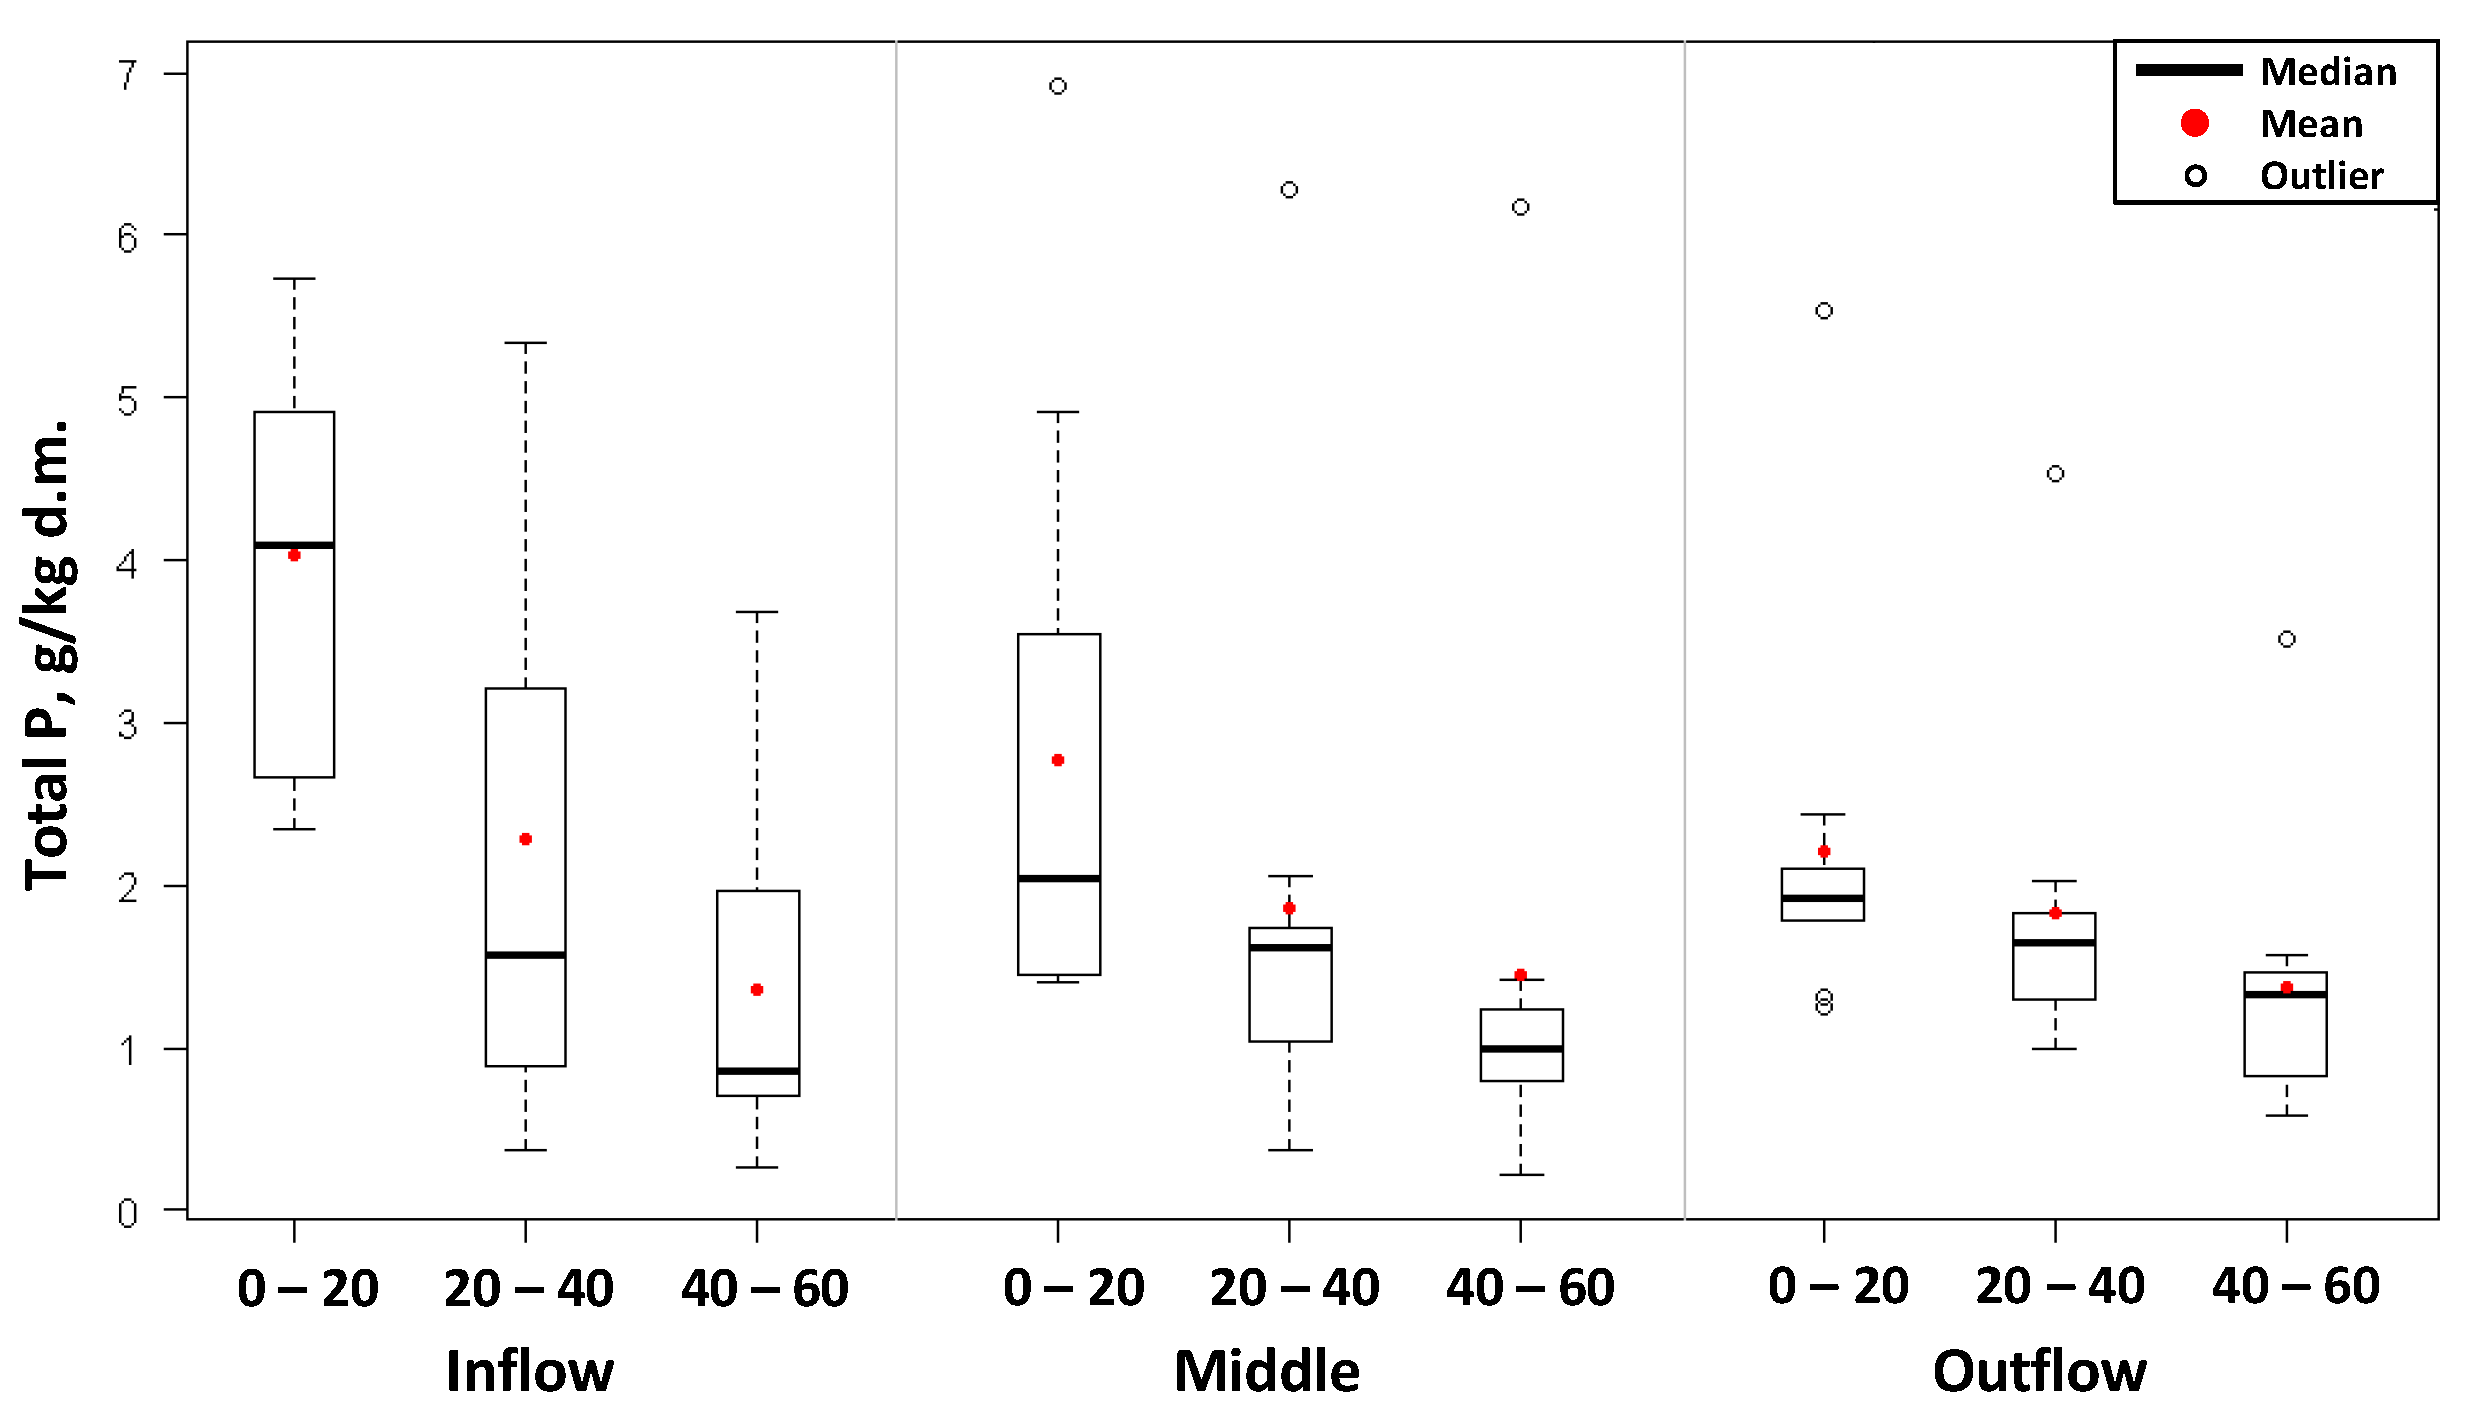
The accumulation of total nitrogen and total phosphorus was also studied in the constructed wetland bed. The distribution of nitrogen and phosphorus contents in the bed, as well as the basic values of descriptive statistics, depending on the location and depth of their collection, have been presented in Figure 4. The greatest changes in the concentration of total nitrogen and phosphorus during the course of the study period occurred in the surface layer 0–20 cm, especially in bed samples collected at the inflow of sewage into the wetlands. A comparison of the values of arithmetic means of nitrogen and phosphorus contents indicates that irrespective of the location where the samples were collected, these differ at each of the depths, and the average nitrogen and phosphorus consents in the bed is lower for subsequent depths.
The surface layer of the wetland bed, up to 20 cm in depth, was characterized by the highest content of total nitrogen and total phosphorus. The amount of total nitrogen was on average: 12.53 ± 6.0 gN/kg d.m. (range: 1.51 ÷ 24.74 g/kg d.m.). In deeper layers of the bed, the nitrogen content was lower. At the level of 20–40 cm, total nitrogen accumulated in the leaves in amounts from 1.30 to 17.79 g/kg d.m., with an average content of 8.01 ± 4.4 gN/kg d.m. At the depth of 40–60 cm, the amount of nitrogen fell into the range from 1.12 to 13.82, averaging: 5.60 ± 3.3 gN/kg d.m.
Similar relationships were observed in regards to total phosphorus. The average concentration of phosphorus at a depth of up to 20 cm was 3.01 ± 1.6 gP/kg d.m. (range of values: 1.41 ÷ 6.92 g/kg d.m.). In deeper layers of the bed, phosphorus content was lower. At the level of 20–40 cm, the accumulation of phosphorus was in the range from 0.37 to 6.28 gP/kg d.m., on average, 1.99 ± 1.5 gP/kg d.m. On the other hand, at the depth of 40–60 cm, the accumulation of phosphorus averaged 1.39 ± 1.2 gN/kg d.m. (range of values: 0.22 ÷ 6.18 g/kg d.m.).
The accumulation of nitrogen and phosphorus changed not only along with the depth but also depending on the location of collecting samples. In the initial part of the hydrophyte subplot, higher amounts of total nitrogen and total phosphorus were confirmed in the 0–20 cm layer than in samples taken near the sewage outflow. The average value of total nitrogen up to 20 cm in depth in the initial part of the bed was 14.99 ± 6.2 gN/kg d.m., whereas the average accumulation of nitrogen at the end of the bed was lower, and amounted to 10.73 ± 4.7 gN/kg d.m. The total phosphorus content at this depth was found to be 4.03 ± 1.2 gP/kg d.m. and 2.22 ± 1.2 gP/kg d.m. respectively at the initial part of the bed and near the outflow of sewage.
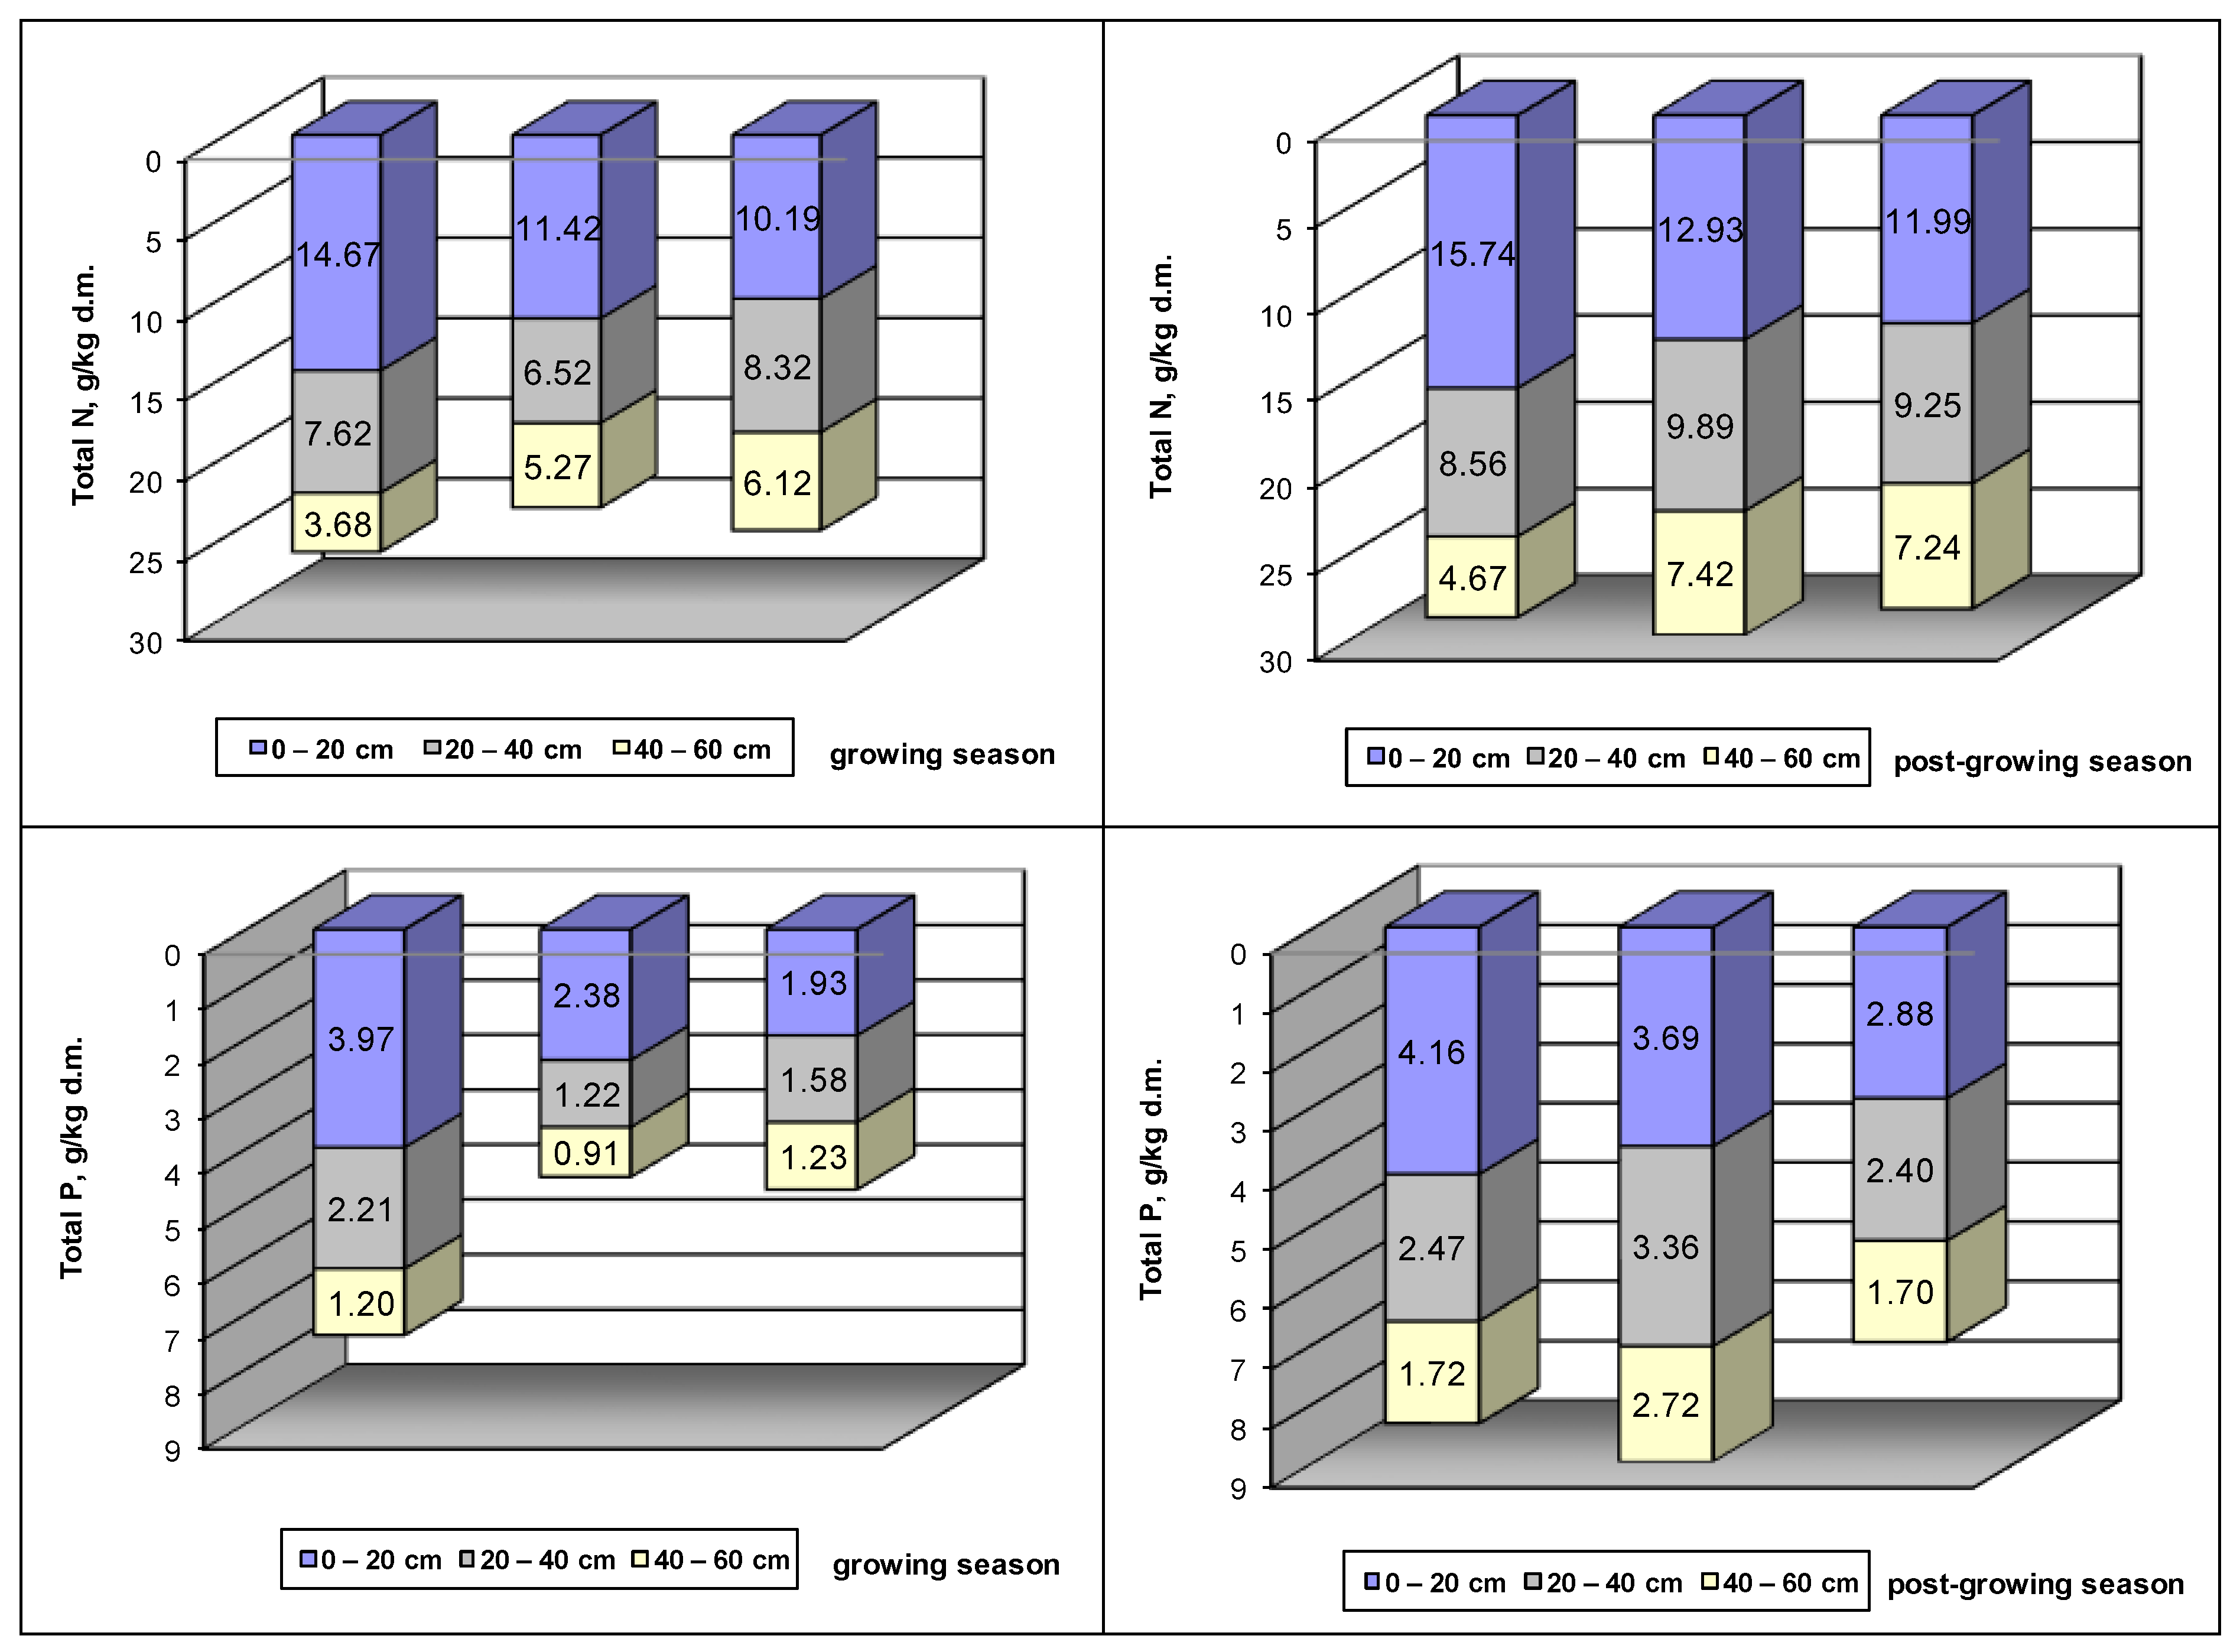
The penetration of nutrients deeper into the hydrophytic subplot increased with decreasing distance to the outflow of sewage from the wetlands. The amount of nitrogen and phosphorus at individual depths of the bed undergoes seasonal changes. The results of the studies carried out showed that, during the post-vegetative period, the content of total nitrogen and total phosphorus in the soil at individual depths was higher than in the vegetative season (Figure 5). These differences were the highest in the layer of up to 20 cm depth. During the period of full plant development, when the contents of total nitrogen in individual parts of the reed were high, a lower concentration of nitrogen in the wetland bed was noted. In January, the concentration of nitrogen in the plant was low, whereas the nitrogen contents in the wetland bed were the highest for the entire period of the studies. In the off-season, increased penetration of nutrients to deeper layers of the bed was also observed.
The increase in the biomass of reed in the initial part of the bed was higher than in the final part, thus making it possible to conclude that the amount of biomass is directly proportional to the nitrogen content in the ground of the wetlands. The panicle and leaves of reeds, which accumulate the highest amounts of total nitrogen, do not take it up proportionately to the amounts found in the bed. The results of the studies revealed that the nitrogen content in these parts of reeds is higher than in plants taken from the end of the wetlands, hence from the area where it is less abundant in the bed.
The efficiency of the accumulation of phosphorus depends on the filtration properties of the bed as well as the pH of the soil-water environment. The removal effect decreases along with the passing of time and the sorption capacities of the soil being used up. In the new objects, where the removal of phosphorus occurs in the sorption process of phosphorus on the surface of the bed, the efficiency of removing phosphorus compounds may be very high. After this period, the removal of phosphorus takes place only as a result of accumulation on the surfaces in the entire cross-section of the soil.

3.3. Analysis of Statistical Results of the Research

Two-way analysis of variance (ANOVA) in the randomized block design was applied for the statistic assessment of the results of bed and reed samples. The analysis concerned the effect of the influence of factor A, which was assumed as the sample collection location (inflow, middle, outflow), factor B, and the effects of the interaction between these factors in affecting the analyzed property. When preparing the reed sample results, plant organs (rhizomes, stem, leaves) were assumed as factor B. In the analysis of variance for the bed results, factor B indicated the depth of sample collection (0–20, 20–40, 40–60).
The analyses showed a rather strong positive correlation between the accumulation of nitrogen in the rhizome of reed collected at the initial part of the bed and the nitrogen content at individual depths (r = 0.65; r = 0.66; r = 0.71). On the other hand, the nitrogen content in the rhizomes of reeds growing at the end of the hydrophytic subplot was negatively correlated with its amount in the bed, and, compared to the correlation in the initial part of the bed, was rather low (Table S1).
Analysis of variance showed that from a statistical point of view, the location of collecting reed samples (factor A) did not influence the total nitrogen and total phosphorus contents in individual plant organs. Differences between the nitrogen and phosphorus contents in individual plant parts, however, turned out to be highly significant. The analysis did not also indicate the interactions between the analyzed factors A and B.
The applied multiple comparison test revealed highly significant differences between the average nitrogen content in the leaves and rhizomes as well as in the leaves and stems. Absolute differences for the average contents of nitrogen were 14.25 g/kg d.m. and 16.52 g/kg d.m. respectively, whereas LSD (Least Significant Difference) LSDB = 3.17 gN/kg d.m.
The Tukey test shows that significant differences between the average total phosphorus contents occurred between the following pairs of plant organs: rhizomes and stem, and stem and leaves. Absolute differences in measurements between average values of phosphorus amounted to 0.65 g/kg d.m. and 0.56 g/kg d.m. respectively (LSDB = 0.34 gP/kg d.m.).
The analysis of variance confirmed that the location of sample collection did not significantly diversify the total nitrogen content in the wetland bed (Table S2). On the other hand, the depth at which the samples were collected had a very significant influence on the average nitrogen content in the collected soil samples. The influence of interaction between the depth and location of sample collection on the nitrogen content was also determined to be highly significant. The applied test of multiple comparisons revealed that significant differences occurred between the average nitrogen content in the bed samples for each pair of depths: 0–20 and 20–40; 0–20 and 40–60; 20–40 and 40–60 cm (LSDB = 1.89 gN/kg d.m.). At the same time, the highest absolute difference in measurements between averages was noted for nitrogen contained in samples taken from a depth of 0–20 cm and 40–60 cm. The most significant differences in the nitrogen content for these depths occurred in the first part of the bed (the absolute difference was 11.02 g/kg d.m. whereas LSDA–B = 3.27 gN/kg d.m.). Statistically, large differences in the average measurement of nitrogen content were also observed at the inflow in the 0–20 cm layer, and its accumulation in the middle and at the end of the subplot in the 40–60 cm layer.
The concentration of total phosphorus in the bed samples depended on both the depth of collecting the samples and the location from which they were taken (beginning, middle, or end of the constructed wetland plot). These factors also influence the total phosphorus content in the bed through interaction. The test of multiple comparisons showed significant differences between the average phosphorus content in the bed samples for each pair of depths: 0–20 and 20–40; 0–20 and 40–60; and 20–40 and 40–60 cm. At the same time, the highest absolute difference in the measurement between averages occurred for phosphorus contained in samples collected at depths of 0–20 cm and 40–60 cm (LSDB = 0.49 gP/kg d.m.). The test confirms that significant differences also occurred between the average contents of total phosphorus in the bed samples collected at the inflow and outflow of the bed, as well as between samples collected from the inflow and the center of the subplot (LSDA = 0.49 gP/kg d.m.). Differences between the average concentration of phosphorus in samples collected from the middle and end of the bed, on the other hand, were not statically significant. The most significant differences in the average measurements were observed between the phosphorus content in the initial part of the subplot in the 0–20 cm layer and the accumulation of this element in the 40–60 cm layer, at the beginning, middle, and end of the subplot (LSDAB = 0.84 gP/kg d.m.).

4. Conclusions

Based on the studies carried out, it was established that nitrogen in reeds growing in constructed wetlands is accumulated mainly in the leaves and panicle, and phosphorus is accumulated in the leaves, rhizomes, and panicle. The ability to accumulate phosphorus in macrophytes is significantly lower when compared to the nitrogen they are able to retain. The concentration of nitrogen and total phosphorus in individual parts of reeds during the vegetative period was higher than in the post-vegetative season. Young plants in the phase of intensive growth contained the most total nitrogen and total phosphorus. In the following months of the growing season, the amount of accumulated nitrogen and phosphorus decreased. The results of studies on the filtration material filling the constructed wetland bed showed that the surface layer of a wetland sewage treatment plant, up to 20 cm depth, is characterized by the highest accumulation of total nitrogen and total phosphorus content. The highest nitrogen and total phosphorus contents are observed in the initial part of the bed, in a layer of up to 20 cm, and the deep penetration of these compounds increases toward the outflow of sewage from the treatment plant. The content of nitrogen and phosphorus compounds at particular depths of the deposit that undergo seasonal changes was higher in winter than in summer months. During the period of full plant development, when the content of nitrogen and total phosphorus in individual parts of reeds was high, their lower concentration in the soil of the treatment plant was observed. In the post-vegetation season, increased penetration of nitrogen and total phosphorus into the deeper layers of the deposit was also noted.

Supplementary Materials

The following are available online at https://www.mdpi.com/article/10.3390/agronomy11071317/s1, Table S1: Results of ANOVA variance analysis in P. australis, Table S2: Results of ANOVA variance analysis in the soil.

Funding

This publication contributes to UNCNET, a project funded under the JPI Urban Europe/China collaboration, project numbers UMO-2018/29/Z/ST10/02986 (NCN, Poland), [71961137011] (NSFC, China) and [870234] (FFG, Austria).

Data Availability Statement

Not applicable.

Conflicts of Interest

The authors declare no conflict of interest.

References

  1. Stefanakis, A.I. The Role of Constructed Wetlands as Green Infrastructure for Sustainable Urban Water Management. Sustainability 2019, 11, 6981. [Google Scholar] [CrossRef] [Green Version]
  2. Wang, M.; Zhang, D.; Dong, J.; Tan, S.K. Application of constructed wetlands for treating agricultural runoff and agro-industrial wastewater: A review. Hydrobiologia 2018, 805, 1–31. [Google Scholar] [CrossRef]
  3. Dou, T.; Troesch, S.; Petitjean, A.; Gabor, P.T.; Esser, D. Wastewater and rainwater management in urban areas: A role for Constructed Wetlands. Procedia Environ. Sci. 2017, 37, 535–541. [Google Scholar] [CrossRef]
  4. Schwammberger, P.; Walker, C.; Lucke, T. Using Floating Wetland Treatment systems to reduce stormwater pollution from urban developments. Int. J. Geomate 2017, 12, 45–50. [Google Scholar] [CrossRef]
  5. Stefanakis, A.I.; Seeger, E.; Dorer, C.; Sinke, A.; Thullner, M. Performance of pilot-scale horizontal subsurface flow constructed wetlands treating groundwater contaminated with phenols and petroleum derivatives. Ecol. Eng. 2016, 95, 514–526. [Google Scholar] [CrossRef]
  6. Stefanakis, A.I. Constructed Wetlands for Industrial Wastewater Treatment, 1st ed.; John Wiley & Sons: Chichester, UK, 2018. [Google Scholar]
  7. Bakhshoodeh, R.; Alavi, N.; Oldham, C.; Santos, R.M.; Babei, A.A.; Vymazal, J.; Paydary, P. Constructed wetlands for landfill leachate treatment: A review. Ecol. Eng. 2020, 146, 105725. [Google Scholar] [CrossRef]
  8. Saeed, T.; Sun, G. A review on nitrogen and organics removal mechanisms in subsurface flow constructed wetlands: Dependency on environmental parameters, operating conditions and supporting media. J. Environ. Manag. 2012, 112, 429–448. [Google Scholar] [CrossRef] [PubMed]
  9. Scholz, M.; Lee, B.H. Constructed wetlands: A review. Int. J. Environ. Stud. 2005, 62, 421–447. [Google Scholar] [CrossRef]
  10. Li, L.; Zerbe, S.; Han, W. Nitrogen and phosphorus stoichiometry of common reed (phragmites australis) and its relationship to nutrient availability in northern China. Aquatic Botany 2014, 112, 84–90. [Google Scholar] [CrossRef]
  11. Senzia, M.A.; Mashauri, D.A.; Mayo, A.W. Suitability of constructed wetlands and waste stabilization ponds in wastewater treatment: Nitrogen transformation and removal. Phys. Chem. Earth 2003, 28, 1117–1124. [Google Scholar] [CrossRef]
  12. Vymazal, J. Is removal of organics and suspended solids in horizontal sub-surface flow constructed wetlands sustainable for twenty and more years? Chem. Eng. J. 2019, 378, 122117. [Google Scholar] [CrossRef]
  13. Jamwalt, P.; Raj, A.V.; Raveendran, L.; Shirin, S.; Connelly, S.; Yeluripati, J.; Richards, S.; Rao, L.; Helliwell, R.; Tamburini, M. Evaluating the performance of horizontal sub-surface flow constructed wetlands: A case study from southern India. Ecol. Eng. 2021, 162, 106170. [Google Scholar] [CrossRef]
  14. Maucieri, C.; Salvato, M.; Borin, M. Vegetation contribution on phosphorus removal in constructed wetlands. Ecol. Eng. 2020. [Google Scholar] [CrossRef]
  15. Chung, A.K.C.; Wu, Y.; Tam, N.F.Y.; Wong, M.H. Nitrogen and phosphate mass balance in sub-surface flow constructed wetland for treating municipal wastewater. Ecol. Eng. 2008, 32, 81–89. [Google Scholar] [CrossRef]
  16. Lee, C.G.; Fletcher, T.D.; Sun, G. Nitrogen removal in constructed wetland. Eng. Life Sci. 2009, 9, 11–22. [Google Scholar] [CrossRef]
  17. Vymazal, J. Constructed wetlands for wastewater treatment: Five decades of experience. Environ. Sci. Technol. 2011, 45, 61–69. [Google Scholar] [CrossRef]
  18. Brix, H. Plants used in constructed wetlands and their functions. In 1st International Seminar on the use of Aquatic Macrophytes for Wastewater Treatment in Constructed Wetlands; Dias, V., Vymazal, J., Eds.; ICN and INAG: Lisboa, Portugal, 2003; pp. 81–109. [Google Scholar]
  19. Obarska-Pempkowiak, H.; Gajewska, M.; Wojciechowska, E. Hydrophyte Water and Wastewater Treatment; Polish Scientific Publishers PWN: Warsaw, Poland, 2010. [Google Scholar]
  20. Spychała, M.; Apolinarska, M.; Błażejewski, R. The influence of the development of common reed rhizomes on the water permeability of a sand-reed deposit. In Proceedings of the Water-Sewage-Waste in the Environment 5th Scientific and Technical Conference “Wastewater Treatment—New Trends”, Zielona Góra, Poland, 12–14 September 2002; pp. 131–136. [Google Scholar]
  21. Zhiwei, G.; Ran, A.; Shuiyuan, F.; Pengpeng, L.; Chuan, L.; Jianhui, X.; Shuiqiang, Y. Phragmites australis+ Typha latifolia Community Enhanced the Enrichment of Nitrogen and Phosphorus in the Soil of Qin Lake Wetland. Scientifica 2017, 3, 1–9. [Google Scholar]
  22. Vymazal, J.; Kröpfelova, L. Removal of nitrogen in constructed wetlands with horizontal sub-surface flow: A review. Wetlands 2009, 29, 1114–1124. [Google Scholar] [CrossRef]
  23. Ozimek, T.; Renman, G. The role of helophytes in hydrobotanic treatment plants. Hydrobotanic sewage treatment plants. In Proceedings of the II International Scientific and Technical Conference, Poznań, Poland, 2–3 September 1996; pp. 109–117. [Google Scholar]
  24. Obarska-Pempkowiak, H. Wastewater Treatment by Hydrobotanic Method with the Use of Soil Filters and Sewage Ponds; Scientific Paper; Gdańsk University of Technology: Gdańsk, Poland, 1992. [Google Scholar]
  25. Jakubaszek, A. Nitrogen and phosphorus content in constructed wetlands. Civil Environ. Eng. Rep. 2020, 30, 247–257. [Google Scholar] [CrossRef]
  26. Vymazal, J.; Dusek, J.; Kvet, J. Nutrient Uptake and Storage by Plants in Constructed Wetlands with Horizontal Sub-Surface Flow: A Comparative Study; Vymazal, J., Ed.; W: Nutrient Cycling and Retention in Natural and Constructed Wetlands; Backhuys Publishers: Leiden, The Netherlands, 1999; pp. 85–100. [Google Scholar]
  27. Gajewska, M.; Obarska-Pempkowiak, H. Retention and removal of nitrogen compound in hybrid constructed wetlands. In Proceedings of the VIIth International Symposium on Water Management and Hydraulic Engineering, Międzybrodzie Zywieckie, Poland, 10–12 September 2001; pp. 355–363. [Google Scholar]
  28. Vymazal, J. Removal of nutrients in constructed wetlands for wastewater treatment through plant harvesting—Biomass and load matter the most. Ecol. Eng. 2020, 155, 105962. [Google Scholar] [CrossRef]
Figure 1. Design of the constructed wetland.
Agronomy 11 01317 g001
Figure 2. Total nitrogen and phosphorus in parts of common reed (n = 10).
Agronomy 11 01317 g002
Figure 3. Seasonal dynamic concentration of TN and TP in the organs of P. australis.
Agronomy 11 01317 g003
Figure 4. Accumulation of total nitrogen and phosphorus in the bed (n = 10).
Agronomy 11 01317 g004aAgronomy 11 01317 g004b
Figure 5. Seasonal concentration of TN and TP in the soil constructed wetland (n = 10).
Agronomy 11 01317 g005
Publisher’s Note: MDPI stays neutral with regard to jurisdictional claims in published maps and institutional affiliations.

