Article

Aluminum Toxicity in Sweet Cherry Trees Grown in an Acidic Volcanic Soil

by
Claudia Bonomelli
1 and
Pamela Artacho
2,*
1
Departamento de Fruticultura y Enología, Facultad de Agronomía e Ingeniería Forestal, Pontificia Universidad Católica de Chile, Vicuña Mackenna 4860, Macul, Santiago 7820436, Chile
2
Departamento de Investigación y Desarrollo, Agriismart Limitada, Avenida Simpson 260, Valdivia 5090000, Chile
*
Author to whom correspondence should be addressed.
Agronomy 2021, 11(6), 1259; https://doi.org/10.3390/agronomy11061259
Submission received: 1 June 2021 / Revised: 14 June 2021 / Accepted: 18 June 2021 / Published: 21 June 2021
(This article belongs to the Special Issue Soil-Plant Interaction: Focus on Plant Growth and Soil Biodiversity)

Abstract

:
Chile is the world’s largest exporter of sweet cherries. New plantings have been shifted to southern regions, where aluminum (Al) phytotoxicity could be a serious constraint on establishing orchards in acidic volcanic soils. This study investigated the effects of soil Al on growth and macronutrient uptake in non-bearing ‘Bing’ on Gisela®6 trees grown in 120 L pots containing volcanic soil with four concentrations of exchangeable Al (0.12, 0.40, 0.60, and 1.24 cmol kg−1). At the end of the first and second seasons after planting, the trees were destructively harvested, and individual organs were analyzed for dry weight, Al concentration, and macronutrient concentration. Increasing soil Al concentrations had a detrimental effect on nutrient uptake and growth, particularly in the second season. However, fine-root growth was significantly reduced from the first season and from low soil Al concentrations. In sweet cherry trees, Al was preferentially accumulated in root tissues and its translocation to aerial organs was restricted. In addition, Al accumulation in fine roots, in conjunction with a reduction in root growth, severely restricted the uptake of N, P, K, Mg, and, particularly, Ca. Therefore, soil acidity must be corrected to ensure the successful establishment of sweet cherry orchards in southern Chile.

Graphical Abstract

1. Introduction

In the past decade, the Chilean sweet cherry industry has seen huge growth, making Chile the largest exporter in the world. The cultivated area and the exported volume have increased by 35% and by more than 5000%, respectively, currently being more than 40,000 ha and 350,000 t of exported fresh fruit [1]. Traditionally, cherries were grown in central Chile, but the new plantations have been shifted to southern regions due to climate change and the possibility of late harvest. Soils in this area are mainly acidic Andisols, in which aluminum (Al) toxicity is the most important constraint on crop growth [2,3].
Al is the most abundant metal in the earth’s crust; it is ubiquitously distributed as the third most abundant element, after oxygen and silicon [4]. However, Al is considered to be phytotoxic to the majority of plants when soil pH decreases to below 5.5, which makes Al soluble, while changing its hydroxide form to toxic forms, mainly Al3+ [5,6,7]. The main symptom of Al toxicity is the inhibition of root growth because of the disruption of cell division and cell elongation [8,9], which leads to poor water and nutrient use efficiency at the plant level [10,11] and, consequently, to poor crop growth and yield [12,13,14,15]. The toxic effects of Al begin in the roots within minutes of exposure and include cell wall thickening and callose and lignin deposition, structural alterations and depolarization of the plasma membrane, alterations in cytoskeleton dynamics, alterations in cell shape and vacuolization, disruption of cytosolic Ca2+ homeostasis, inhibition of cation uptake by channel protein blocking, generation of reactive oxygen species, lipid peroxidation and mitochondrial dysfunction, and several other bioenergetic alterations, resulting in cell death [16,17,18,19,20,21]. Al exposure also causes external damage to roots and severe changes in root morphology, which results in curved, swollen, cracked, brownish root apices [22,23].
Al3+ is taken up by an active process, despite not being an essential element for plants, wherein root apices play a vital role in Al toxicity perception and response [17,24,25], specifically in the distal part of the transition zone of the root apex [26,27]. In most of the plant species, Al uptake is limited mainly to the root system, where it accumulates predominantly in the epidermis and in the outer cortex. Of the total Al content acquired by the plant, up to 90% is localized in the root apoplasm. The endodermis possibly acts as a barrier and transport to the shoot and leaves is generally small [28,29,30,31]. However, some Al transfer from the apoplast to the symplast occurs, as has been demonstrated in wheat, soybean, and maize [30]. Subsequent xylem transport to the shoots and Al accumulation in the vacuoles of the leaves are a typical feature of Al accumulator plant species [30,32], but the reasons for the difference in Al mobility between Al excluders (most of the plant species) and accumulators are not yet understood.
Plant species vary considerably in their degree of Al tolerance, and even genotypes within the same plant species vary in their ability to cope with Al [25,33,34]. Two main types of Al resistance mechanisms have been documented: Al exclusion mechanisms, which aim at preventing Al from entering the root apex, and Al tolerance mechanisms, in which Al enters the plant but is detoxified and sequestered [4,16,17,35]. The proposed internal tolerance mechanisms include the chelation of Al by the efflux of organic acid anions or phenolic compounds, which effectively chelate Al and thereby detoxify Al in the rhizosphere, and sequestration of Al in the vacuole [15,33,35]. Novel Al tolerance mechanisms have been identified, involving modifications to the carbohydrate composition of the root cell wall, leading to reduced cell wall Al accumulation and novel Al uptake transporters, including aquaporins, which mediate plasma membrane and tonoplast Al accumulation in an Al accumulator [35,36]. Many strategies have been explored to mitigate the Al toxicity in plants in acid soils. They can be divided into two classes: inorganic amendments, such as the exogenous application of mineral elements including Ca, Mg, P, S, B, and Si and ground oxide/hydroxide (soil liming); and organic amendments, such as organo-mineral fertilizers, green waste compost, plant-derived biochars, and their combination with other minerals [25]. However, breeding, and advanced root-phenotyping tools to identify Al-tolerant cultivars appears to be the most promising strategy [37].
Many economically important fruit crops are grown in acidic soils worldwide and are prone to Al toxicity. Therefore, toxic Al effects, such as the inhibition of root and shoot growth, impairment of nutrient and water uptake, reduction in flower numbers and fruit yield, and alterations in physiological and biochemical process, for example, leaf photosynthesis, redox homeostasis, and nonstructural carbohydrate metabolism, have been reported in many fruit tree species, such as citrus, apple, quince, banana, mango, litchi, longan, pineapple, blueberry, raspberry, grape, and peach (see Chen et al. [38] and citations therein). In cherry trees, information about Al toxic effects is scarce and mostly comes from short-term studies under controlled cultivation and using seedlings or young plants. For example, in 1-year-old sweet cherry trees, inhibition of initial root and top growth as the soil pH became more acidic, as well as a marked reduction in the total uptake of N (−40%), P (−55%), K (−20%), Ca (−55%), and Mg (−55%), were reported [39]. In plantlets of two sour cherry cultivars, the drastic inhibition of shoot and root growth with increasing amounts of Al in hydroponic solution and differential Al tolerance, depending on plantlet age and cultivar, were reported [40]. In addition, in standard (Mazzard and Mahaleb) and semi-dwarfing (Gisela series) sweet cherry rootstocks, low pH and high Al availability in the soil resulted in elevated seedling mortality, and reduced K and Ca and increased Al and Mn concentrations in plant tissues [41].
These findings suggest that Al phytotoxicity could be a serious constraint on establishing new sweet cherry orchards on acidic volcanic soils in southern Chile. Therefore, a field study was carried out in this region to investigate the effects of increasing Al availability in a volcanic soil on vegetative growth, biomass production, Al concentration, and macronutrient uptake in non-bearing ‘Bing’ on Gisela®6 sweet cherry trees.

2. Materials and Methods

2.1. Study Site and Plant Material

An outdoor experiment with sweet cherry trees growing in pots was conducted at the Experimental Station of the Universidad Austral de Chile (39°47′ S; 73°14′ W) in southern Chile during two consecutive growing seasons: 2012/2013 (first season) and 2013/2014 (second season). One-year-old bare-root ‘Bing’ on Gisela®6 trees were planted in pots filled with local soil, with increasing concentrations of exchangeable Al. The plants were between 110 and 134 cm in height, with no lateral branches. The area has a humid temperate climate, with warm summers, according to the Köppen–Geiger climate classification [42], and the soil used to fill the containers is classified as Duric Hapludand according to USDA soil taxonomy [43].

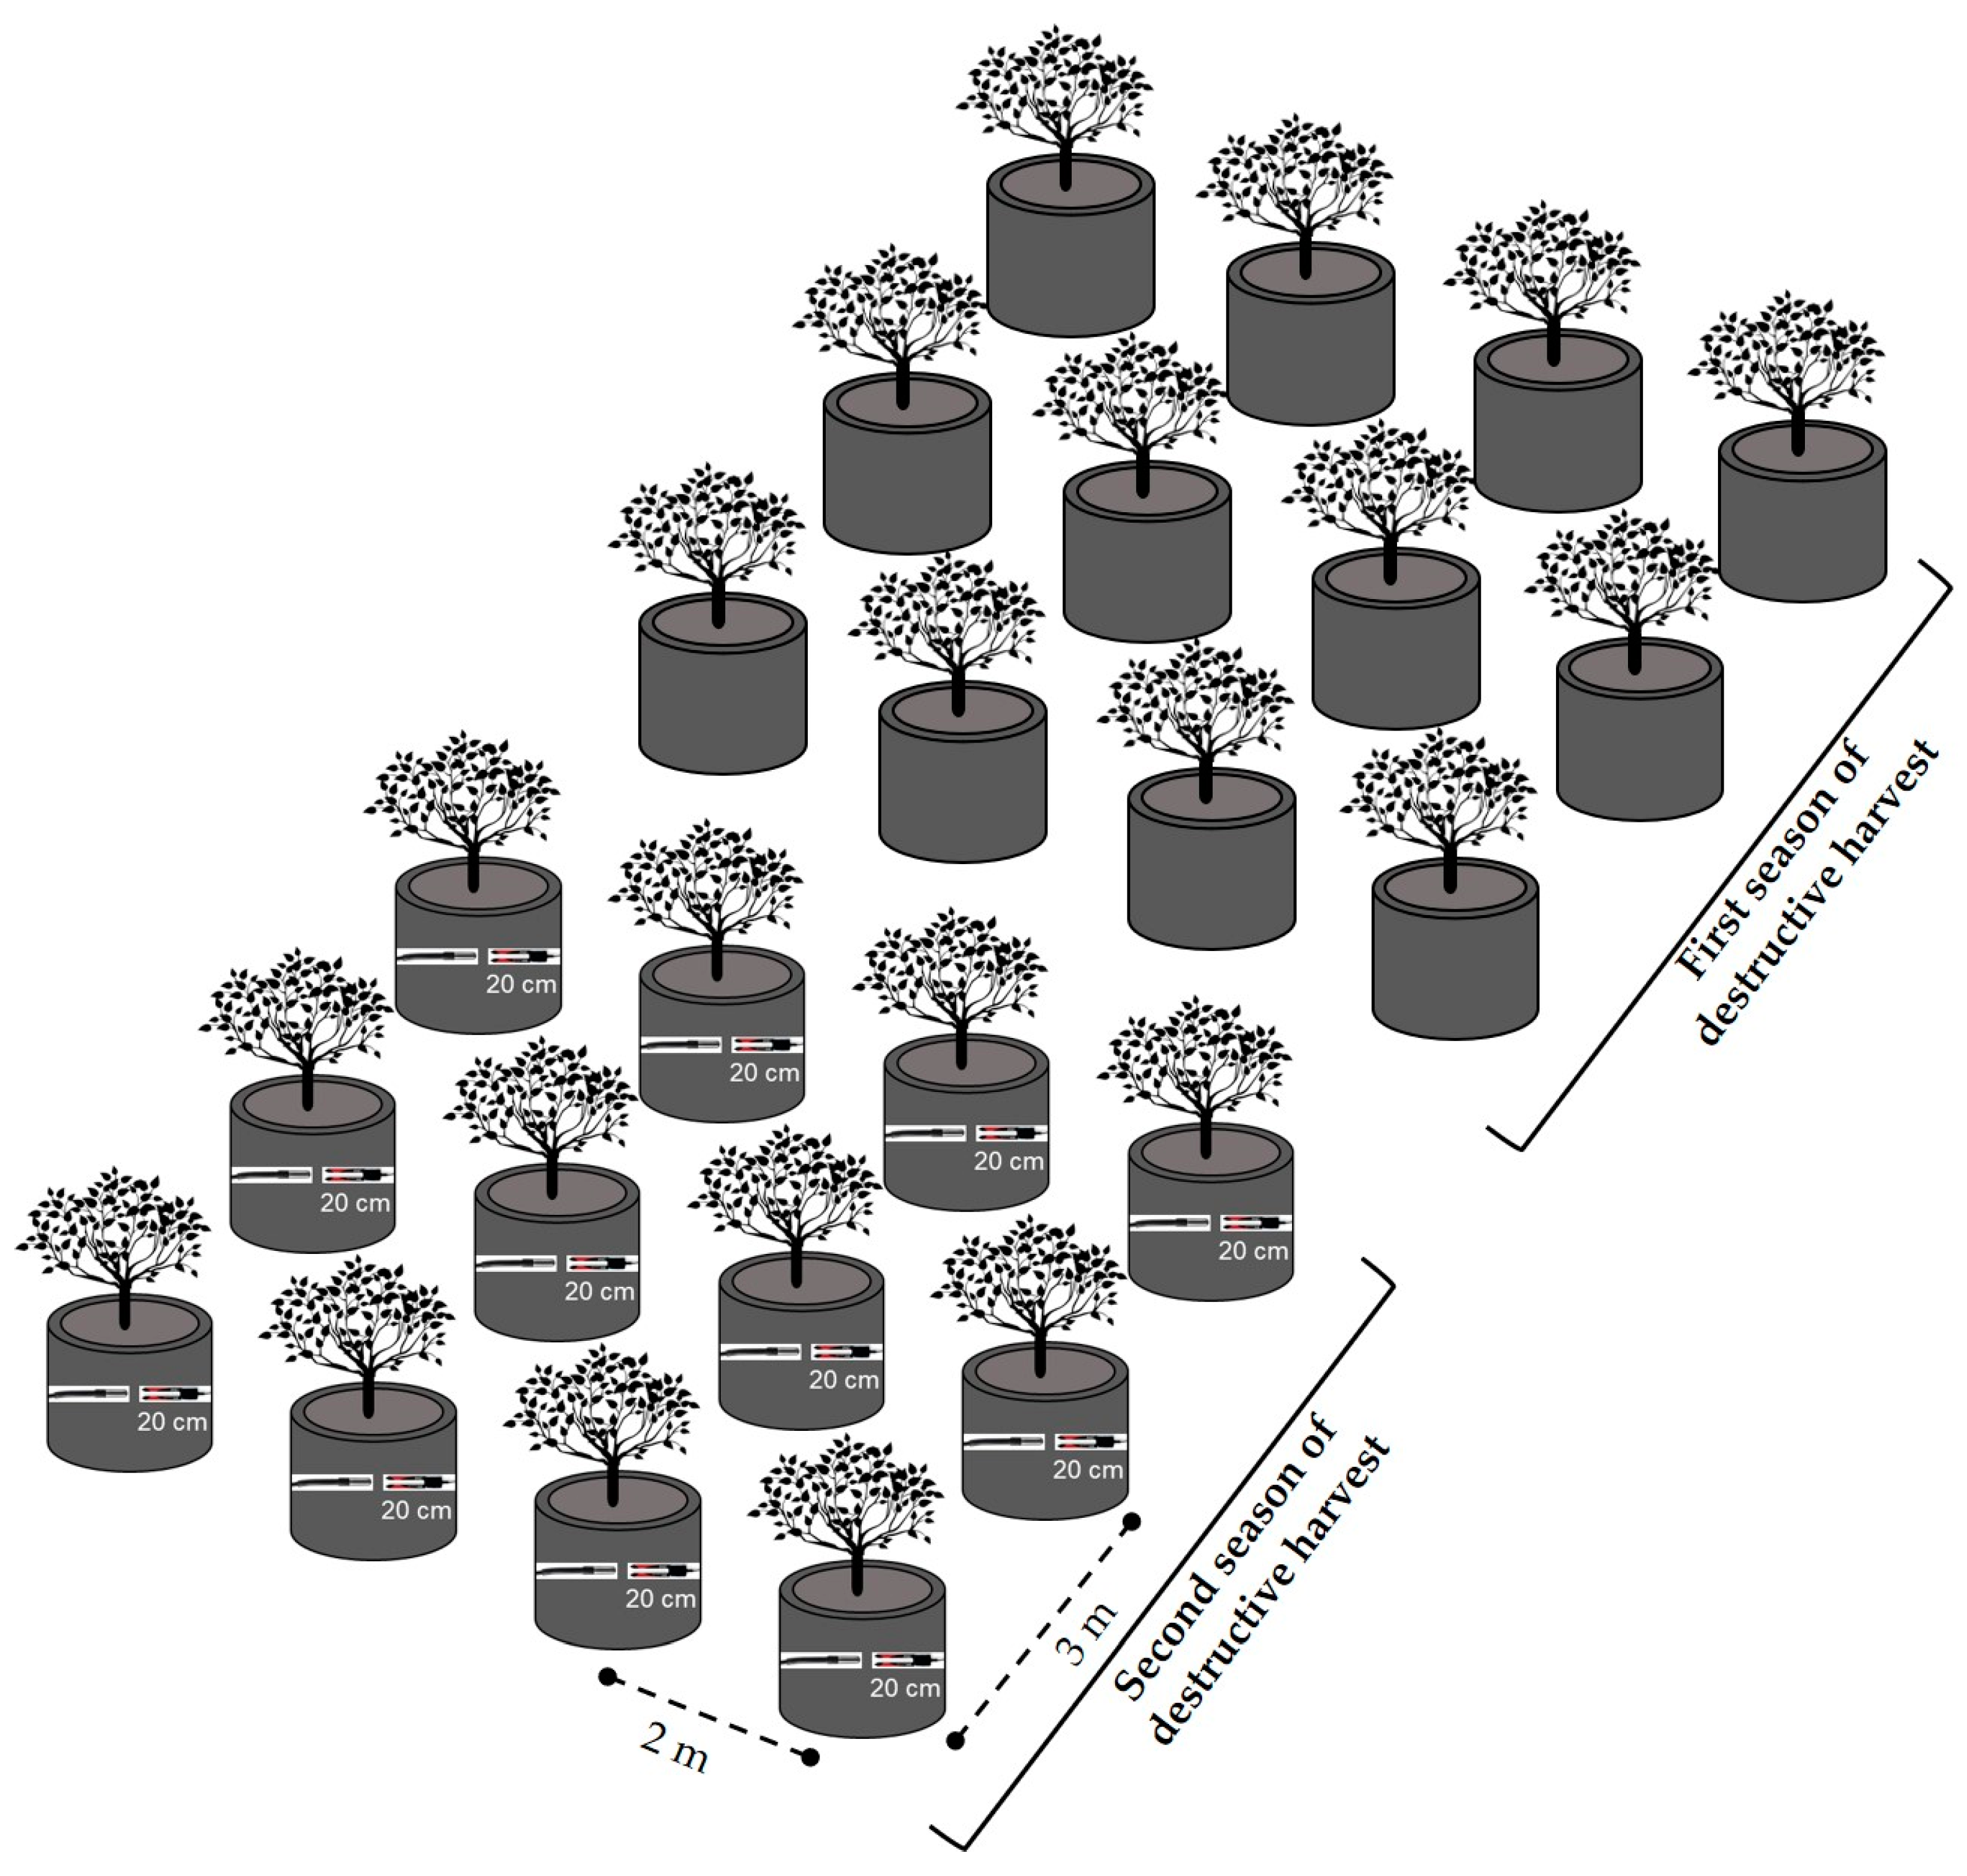
2.2. Experimental Design and Cultivation Management

The experiment was established in winter (July 2012) as a completely randomized design, with 4 treatments and 3 replicates. A single tree in a 120 L soil-filled pot was the experimental unit. The treatments included four acidity and Al availability levels in the soil (Table 1) obtained from a previous field trial at the Experimental Station of the Universidad Austral de Chile [44]. In this trial, the soil was acidified in 2005 with increasing Al sulfate rates (for further details, see Valle et al. [44]). The experimental design was duplicated as two groups of 12 experimental units (4 treatments × 3 replicates) to allow a destructive harvest of the trees at the dormant stage of two consecutive seasons (Figure 1).
Soil from the 0–20 cm layer was excavated from its original location and sieved to 2 mm. Prior to filling the pots with the soil, a soil analysis was performed, which showed high concentrations of organic matter (13%; Walkley–Black method), medium concentrations of P (17 mg kg−1; Olsen method), and low concentrations of K (76 mg kg−1; ammonium acetate method), on average, across Al treatments. The concentrations of exchangeable Ca (6.13 to 0.66 cmol kg−1; ammonium acetate method) and Mg (1.13 to 0.22 cmol kg−1; ammonium acetate method) and DTPA-extractable Cu (2.30 to 1.32 mg kg−1) and Zn (0.31 to 0.17 mg kg−1) diminished with increasing soil Al concentrations. Based on these results, basal fertilization was applied to the soil to elevate the nutrient levels to an appropriate range.
Sweet cherry trees were randomly assigned to pots containing soils with different treatments. In the first season, trees were not pruned, with the exception of the initial cutback of the scion. At the beginning of the second season, the apical buds on shoots were removed to induce lateral branching. The pots were irrigated two to four times per week from the end of October to the end of March through a drip line system with three 2 L h−1 emitters per tree, and the system was designed to maintain the soil water content near to field capacity (0.43 cm3 cm−3). The volumetric water content of the soil was monitored at 20 cm depth through 10HS sensors connected to EM-5b data loggers (Decagon Devices Inc., Washington, USA), after sensor calibration. The total amount of water applied was approximately 250 and 740 L per pot in the first and second seasons, respectively.
Nitrogen (N) fertilization was applied as urea (46% N) in four N splits, commencing in mid-November and ending in late February of each season. In the first and second seasons, 8 and 12 g of N per plant were applied, respectively, according to data on the N demand of young sweet cherry trees reported by Bonomelli and Artacho [45]. The N fertilizer was applied manually below the drippers and immediately incorporated with irrigation.

2.3. Tree Measurements

At the end of the first (18 July 2013) and second (2 July 2014) seasons, one set of trees (3 experimental units per treatment) was destructively sampled; thus, 12 trees were removed per season. In the field, the scion was separated from the rootstock at the graft union and then the aerial part was separated into the trunk, current-season shoots, ≥1-year-old branches, spurs, and buds. The shoot number and length were registered. There was no fruit production in both seasons, so fruits were not considered. The soil from the pots was sieved, and the roots were carefully recovered and sorted by diameter into fine (≤2 mm) and main (>2 mm) roots and then washed in running water using a 0.25 mm mesh to avoid losses. At this time, rootstocks were also recovered. Prior to this, in the autumn of each season (end of March), the trees selected for removal were enclosed with fine wire meshing and senescent leaves were collected. Vegetal samples were weighed in the field to determine the total fresh weight, and subsamples of each tissue were taken and oven-dried for 48 h at 65 °C to obtain dry matter (DM) content. The dry samples were subsequently ground and analyzed in the Analytical Laboratory of the Universidad Austral de Chile to determine the total Al and nutrient concentrations. The concentrations of N, P, and K were analyzed for the first and second seasons and the concentrations of Ca and Mg only for the second season. The Al and nutrient contents were calculated by multiplying the dry weight by the concentration in each tree organ.
The fine-root length (m tree−1) was estimated by multiplying the specific root length (SRL) and the total fine-root dry weight per tree, as obtained by the destructive harvest. For this, in the first season, the total root length in three fine-root samples per experimental unit (mean 2.32 ± 0.74 g fresh weight) was measured with the image analysis software WinRHIZOTM (Regent Instruments Inc., Ville de Québec, QC Canada) and by the conventional grid-line intersect method [46], using the same pictures. Then, the fine-root samples were dried for 48 h at 65 °C, and the SRL was determined as the length:mass ratio (m g−1).
Tree vegetative growth was assessed by measuring the scion trunk diameter at 0.1 m above the graft union and at two positions from the end of September (bud break) to the end of June (dormancy). The trunk cross-sectional area (TCSA) was calculated based on the trunk diameter, according to Westwood [47]. Seasonal increments of the TCSA were calculated based on the difference between measurements at the beginning and end of each season. The leaf area of 15–20 leaves per tree collected randomly in mid-summer was measured with the image processing program ImageJ (US National Institutes of Health). Then, the leaves were dried for 48 h at 65 °C, and the specific leaf area (SLA) was determined (area/mass, cm2 g−1). The leaf area per tree was roughly estimated by multiplying the SLA and the total leaf dry weight of each tree obtained at the end of the season, assuming a constant leaf weight from mid-summer until the time of leaf fall (mid-autumn).
The nutritional status of the trees was evaluated in the second season by the foliar analysis of leaves collected in mid-summer (mid-January) from the middle-third portion of newly formed shoots. The leaves from all treatments presented normal values of N, P, K, S, B, Fe, Zn, Cu, and Mn and low concentrations of Ca (0.74% on average) and Mg (0.15% on average). The foliar concentration of Al increased, as did exchangeable Al in the treatment soils.

2.4. Statistical Analysis

Based on triplicate measurements per treatment, the means and standard errors (SEs) for the TCSA, foliar area, fine-root and shoot lengths, dry weight, Al concentration, and contents of Al, N, P, K, Ca, and Mg were calculated. The treatment effects were evaluated using analysis of variance (ANOVA). When the F test was significant, the means were separated by Tukey’s honestly significant difference test with a 0.05 significance level. These statistical analyses were performed with STATISTICA 12.0 software (Statsoft Inc., Tulsa, OK, USA). Linear regression and segmental linear regression analyses were also used to evaluate relationships between different variables. These statistical analyses were performed with GraphPad Prism 9.1.0 software (GraphPad Software, San Diego, CA, USA).

3. Results

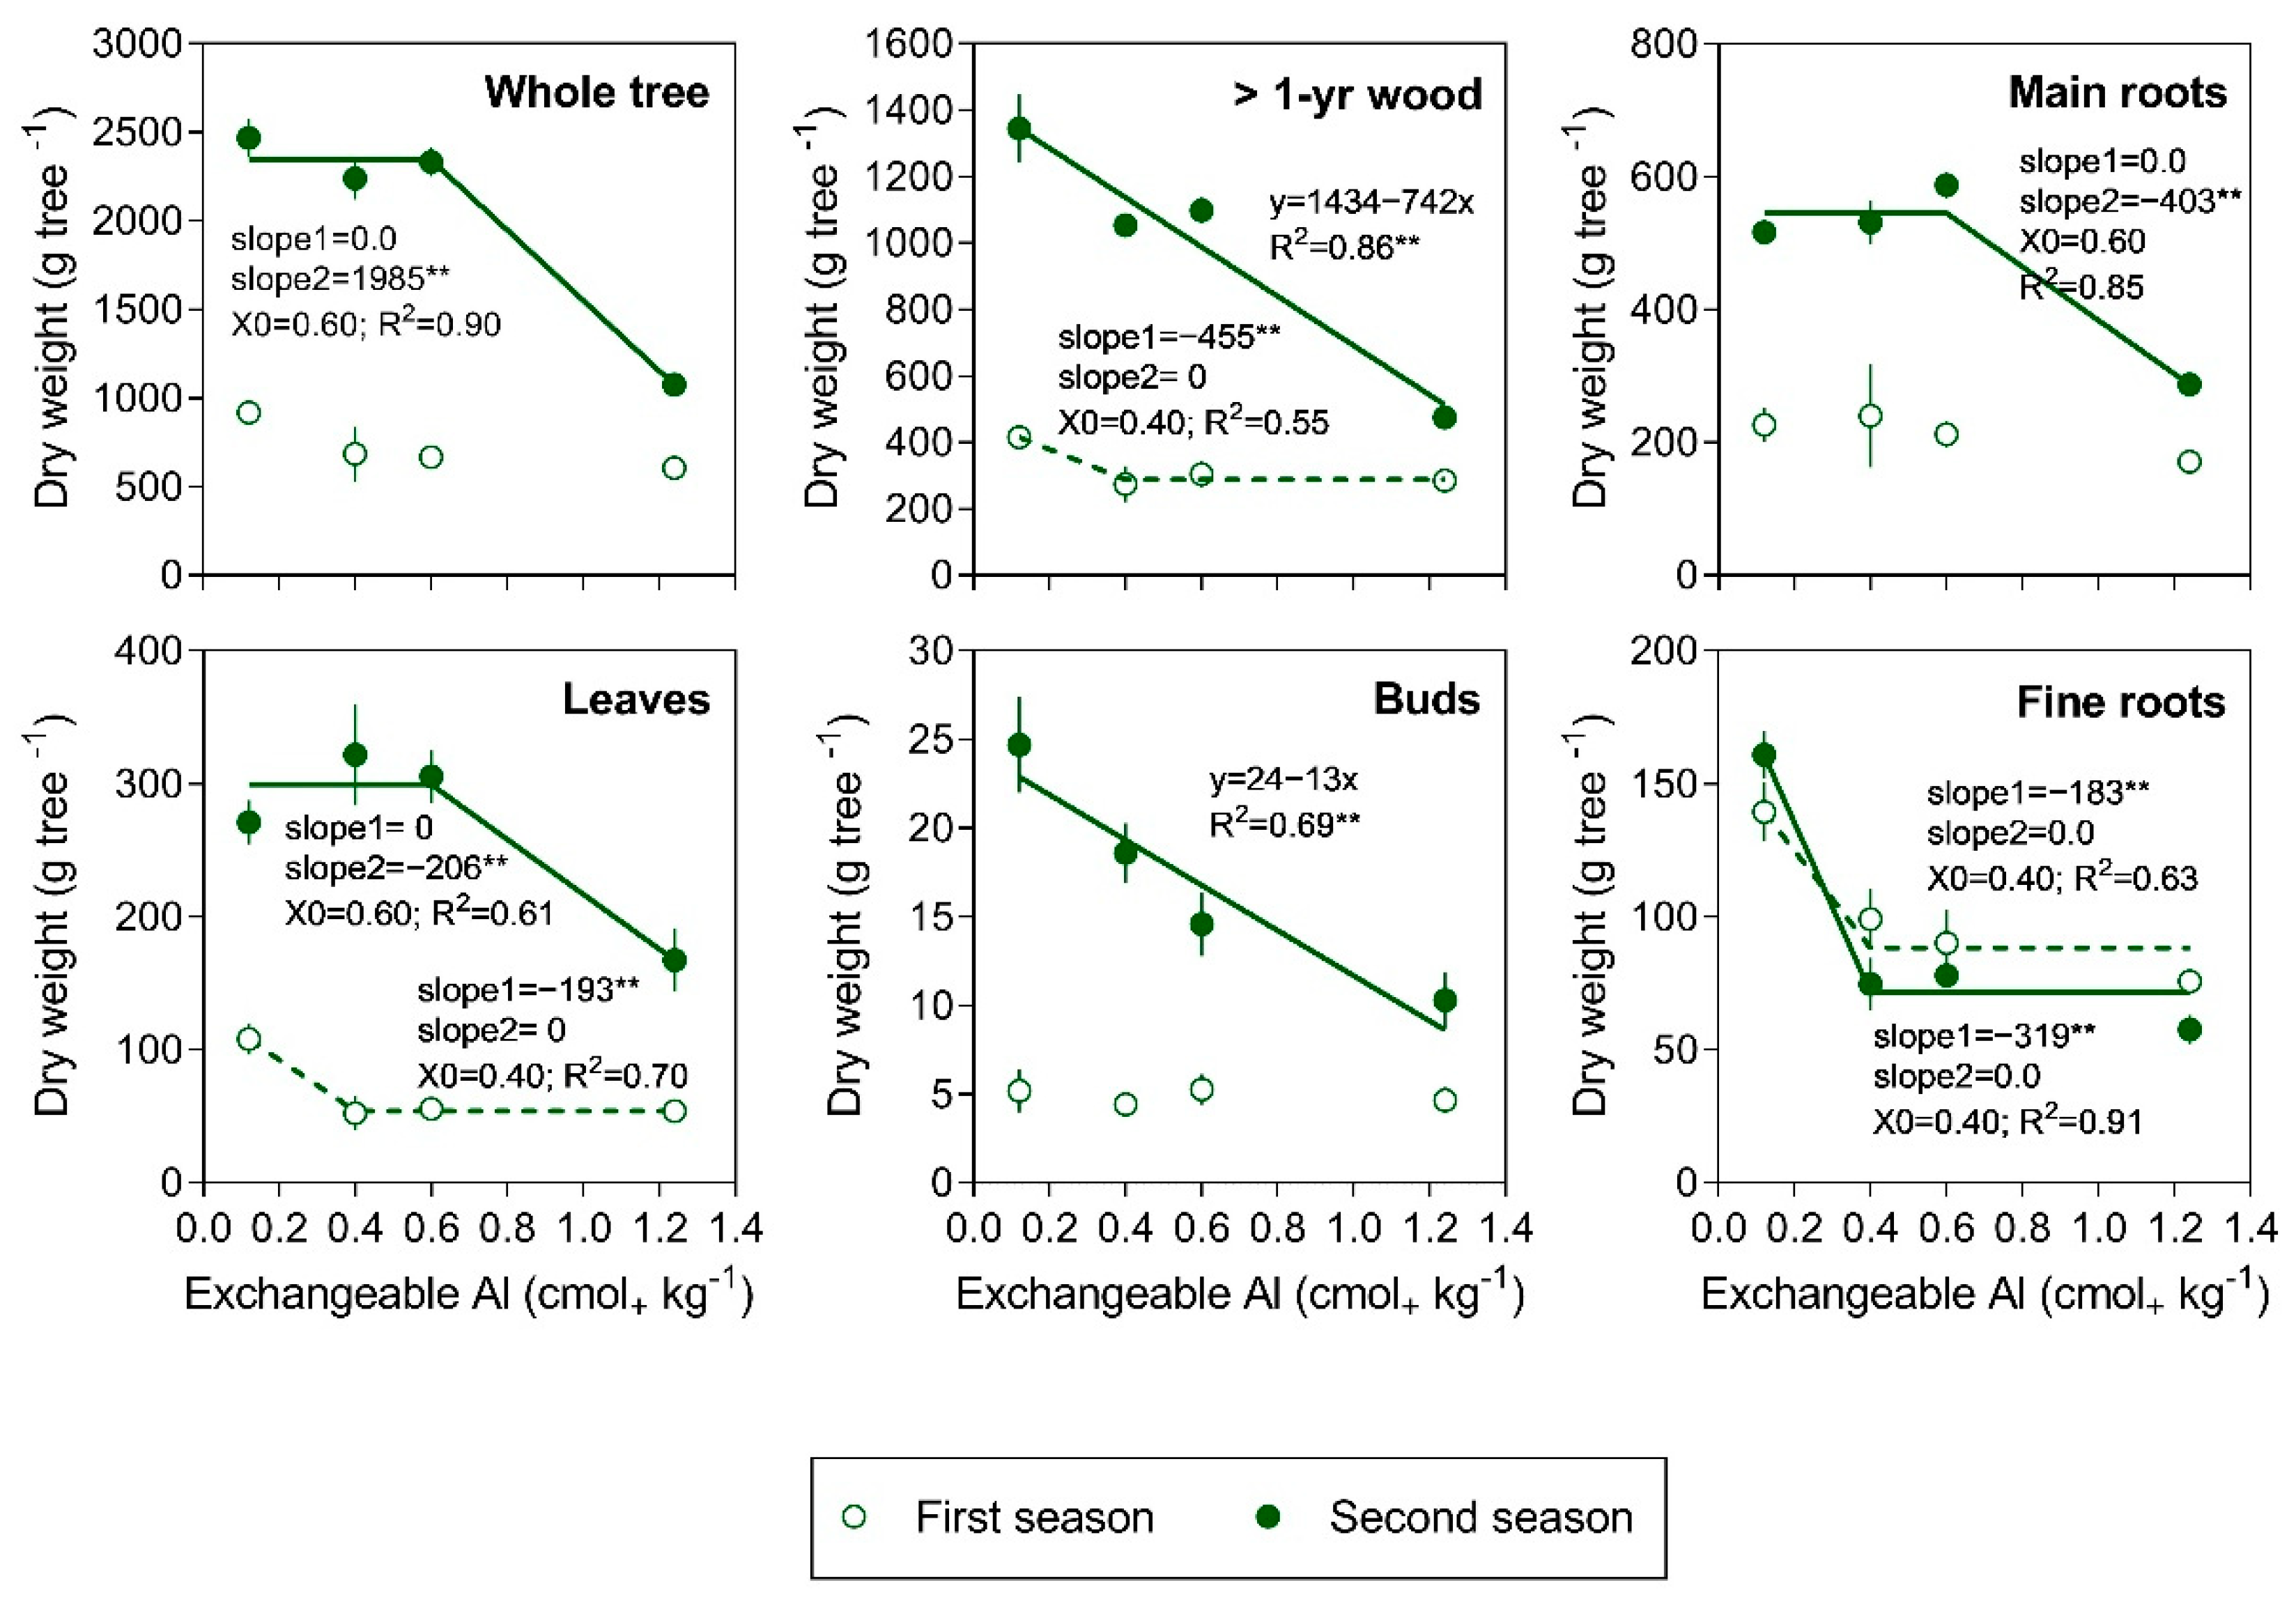
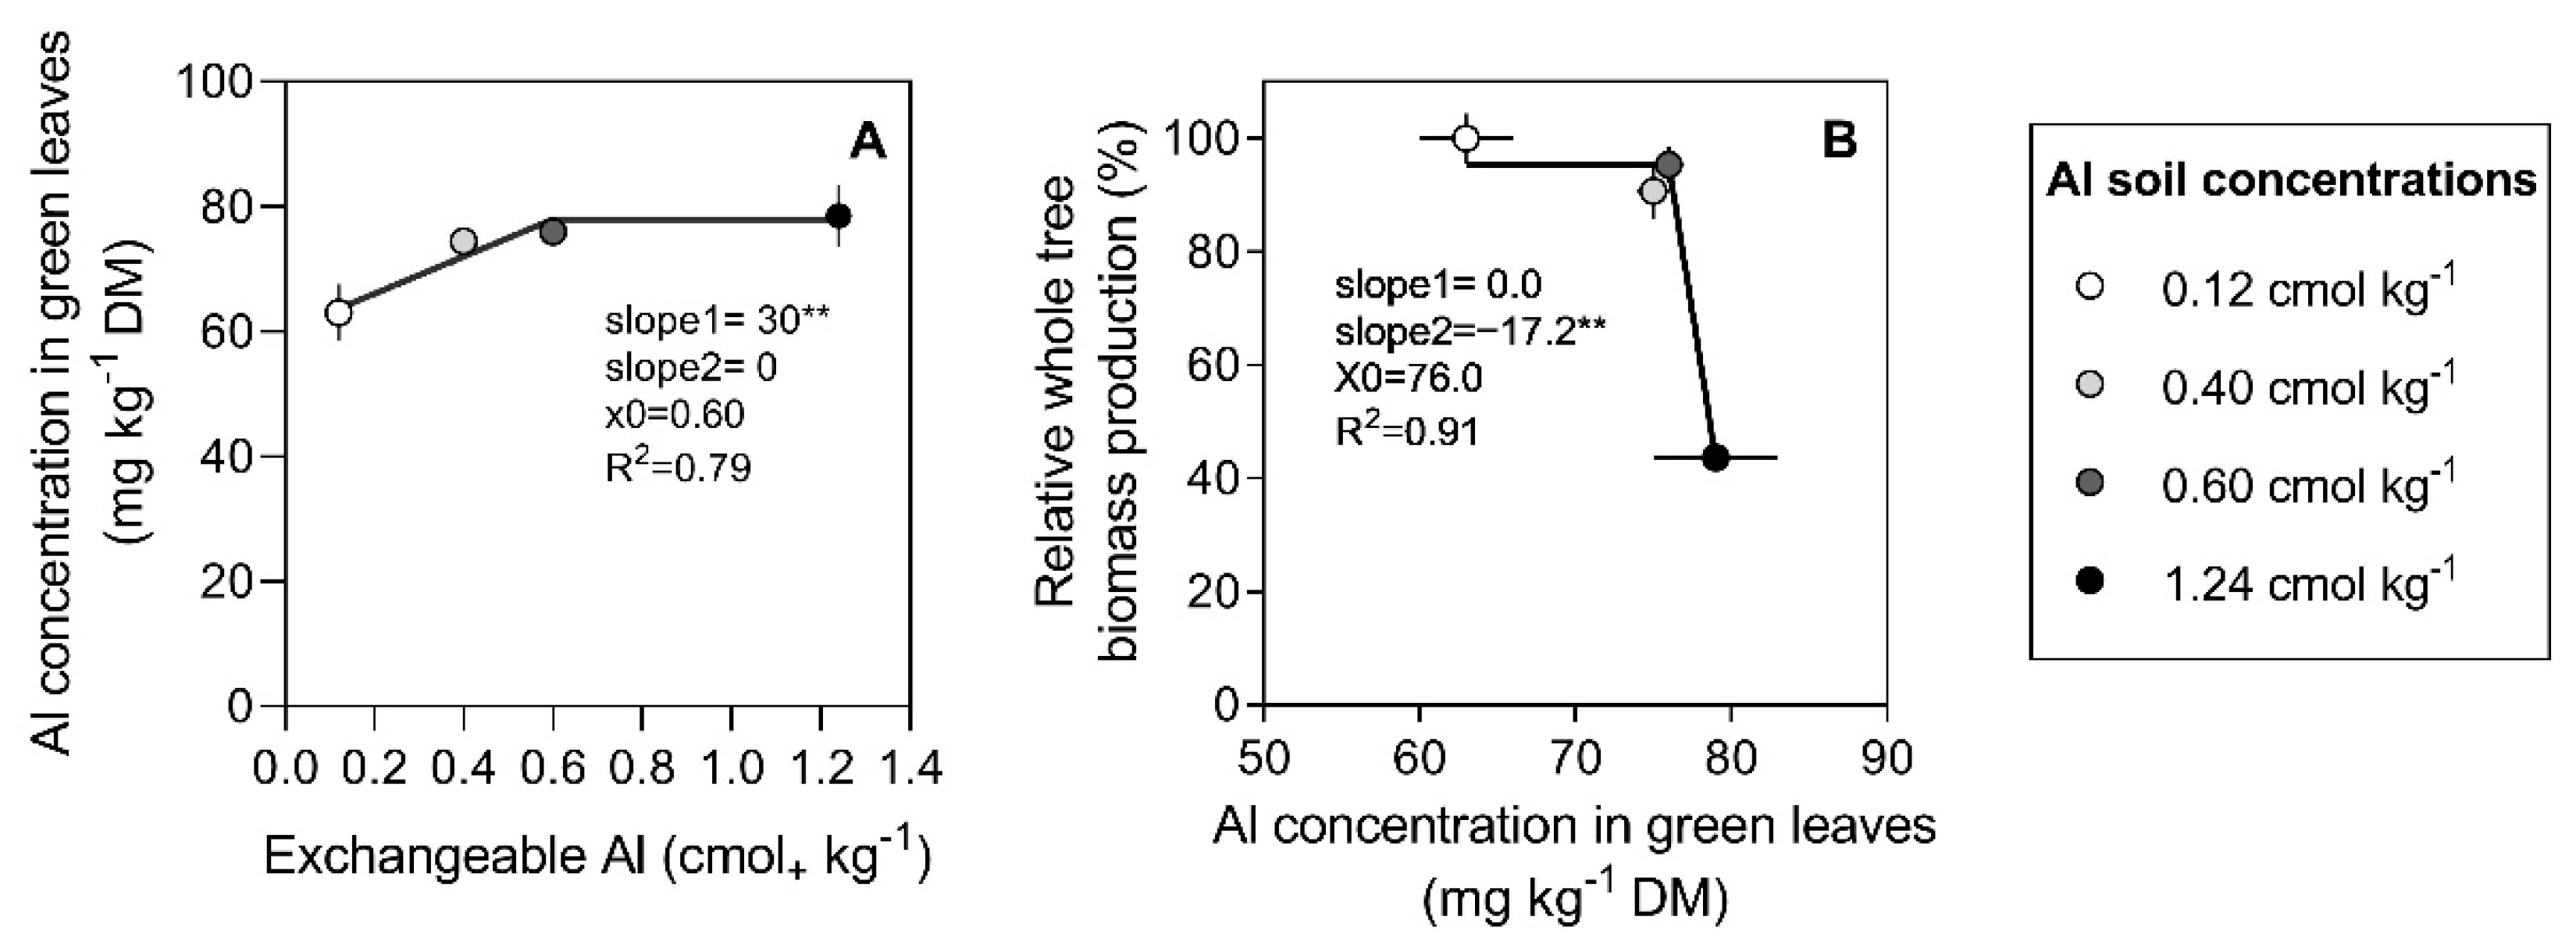
3.1. Tree Growth and Biomass Production

Tree growth measured as absolute increments of the TCSA was significantly reduced by soil Al in both seasons, specifically starting from 0.60 cmol kg−1 of Al. On average, the absolute increment in the TCSA of trees growing in soil with 1.24 cmol kg−1 of Al was 59% (first season) and 47% (second season) lower than that of trees growing in soil with between 0.12 and 0.60 cmol kg−1 of Al (Table 2). Similarly, the standing fine-root length was significantly reduced. On average, the fine-root length was 36% and 56% less at the end of the first and second seasons, respectively, in soil with between 0.40 and 1.24 cmol kg−1 of Al in comparison with soil with 0.12 cmol kg−1 of Al (Table 2). Instead, the shoot growth and the total leaf area of trees were restricted only in the second season. At this time, the total shoot length and the total foliar area of trees growing in soil with the highest Al concentration were, on average, half those of trees growing in soil with the lowest soil Al concentration (Table 2).
In terms of the biomass production of whole trees, the effects of soil Al were significant in the second season after planting, when the total biomass linearly decreased starting from 0.60 cmol kg−1 of Al. This reduction was equivalent to 1985 g DM tree−1 per extra centimole of exchangeable Al (slope2; Figure 2). The biomass of the leaves and main roots showed a similar trend to that of the whole tree, with 0.60 cmol kg−1 of Al as the tolerance threshold. Above this value, biomass reductions in leaves and main roots was 206 and 403 g DM tree−1 per centimole of Al, respectively (Figure 2). The critical soil Al concentration for buds and >1-year-old wood (trunk, rootstock, plus >1-year-old branches) was lower than that for the whole plant, as shown by a single negative linear relationship with soil Al (Figure 2). The slope of the adjusted line indicates a biomass reduction of 13 and 742 g DM tree−1 per centimole of soil Al in buds and >1-year-old wood, respectively, in the range between 0.12 and 1.24 cmol kg−1 of Al (Figure 2). However, no clear relationship was detected for biomass accumulation in shoots, although the shoot biomass was the lowest (data not shown) at the highest Al concentration in the soil. For fine roots, a linear biomass reduction, equivalent to 319 g DM tree−1 per centimole of Al, was observed between 0.12 and 0.40 cmol kg−1 of soil Al, and no decrease was detected above 0.40 cmol kg−1 of Al (Figure 2).
In the first season, in contrast, the whole tree biomass was not significantly related to soil Al availability, although trees with the lowest soil Al concentration produced 40% more biomass than the remaining trees (918 g DM tree−1 versus 653 g DM tree−1). Similarly, the biomass of the main roots and buds was also not related to soil Al concentration, while in the leaves, >1-year-old wood (trunk plus rootstock), and fine roots, the biomass reduced with a slope of −193, −455, and −183 g DM tree−1 per centimole of Al, respectively, between 0.12 and 0.40 cmol kg−1 of soil Al, and above this point, no decrease was observed (Figure 2).
Among tree organs, the main roots and >1-year-old wood made the greatest contribution to the total biomass in each growing season, collectively representing more than 70% of the total biomass. The buds made the lowest contribution, 1% of the total biomass in each season (Figure 3). The biomass allocated to the aboveground organs increased as the tree aged. From the first to the second season, across soil Al concentrations, the biomass of >1-year-old wood increased from 45% to 48%, that of the leaves from 9% to 13%, and that of the shoots from 2% to 9%. On the contrary, the biomass of the main and fine roots reduced from the first to the second season from 30% to 24% and 14% to 5%, respectively (Figure 3).
The effects of soil Al concentration on biomass partitioning were significant only in the second season. At this time, the contribution of >1-year-old wood (trunk, rootstock, plus >1-year-old branches) to the total biomass was higher in trees growing with the lowest soil Al concentration (54%) than in those growing with the highest soil Al concentration (44%) (Figure 3). Similarly, the biomass allocated to the fine roots decreased from 7% to 5% (Figure 3). Instead, the biomass partitioned to the main roots and shoots increased with increasing soil Al concentrations, i.e., from 21% to 27% for the main roots and from 6% to 7% for the shoots when comparing the lowest and highest concentrations of soil Al (Figure 3). Finally, the soil Al concentration did not change the biomass partitioned to the leaves and buds (Figure 3).

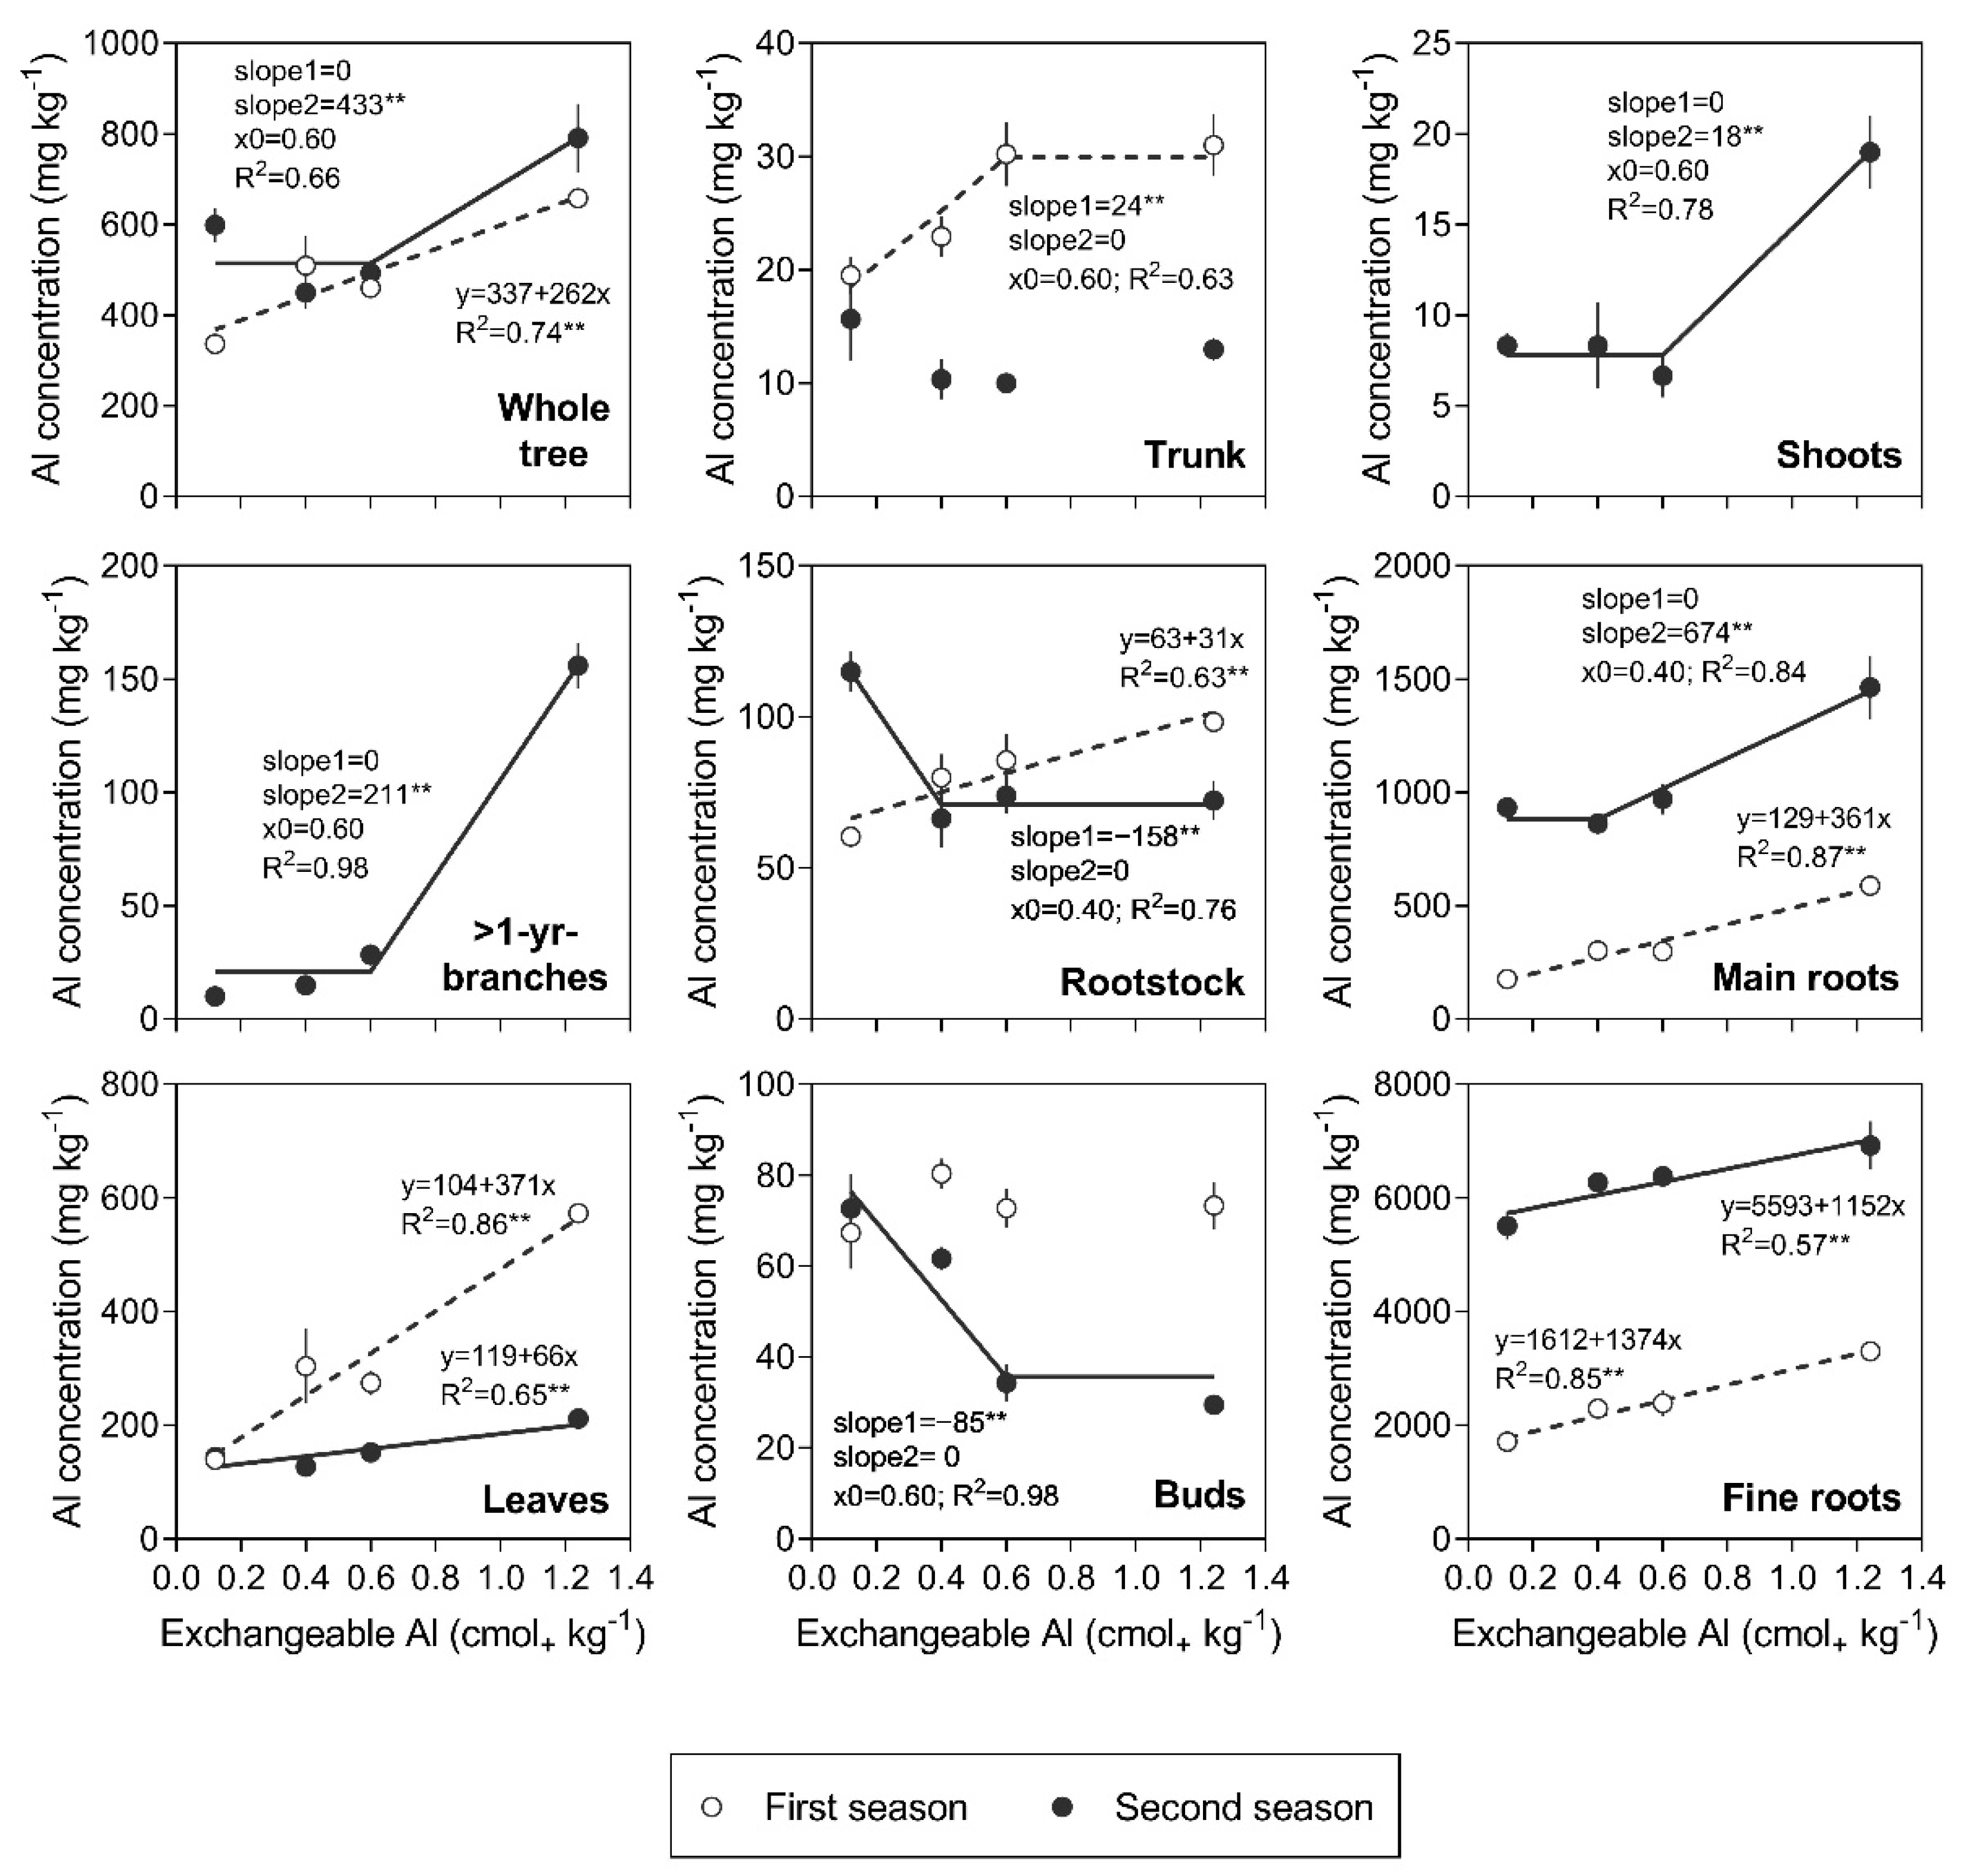
3.2. Al Concentration in Tree Organs

In the first season, the Al concentration in most of the individual organs linearly increased with increasing soil Al availability (Figure 4). The weighted Al concentration in the whole tree followed the same relationship, with an increment of 262 mg kg−1 of Al per centimole of exchangeable soil Al. However, the Al concentration in the buds was not significantly related to the soil Al (Figure 4). In the second season, individual organs showed differential responses (Figure 4). The Al concentration in the leaves and fine roots had a positive linear relationship with the soil Al concentration, as in the first season. The main roots also showed a linear increase in the Al concentration, although starting from 0.40 cmol kg−1 of soil Al. For >1-year-old wood and buds, the Al concentration linearly decreased until 0.40 and 0.60 cmol kg−1 of soil Al, respectively, and above these points, no decrease was observed. At the whole-plant level, the weighted Al concentration did not vary up to 0.60 cmol kg−1 of soil Al, and above this point, there was a linear increase, with a slope of 433 mg kg−1 of Al per centimole of exchangeable soil Al (Figure 4).
The Al concentration increased with tree age only in belowground organs. Specifically, across Al treatments, the Al concentration increased by between two and five times in the main roots and by two to three times in the fine roots (Figure 4) from the first to the second season. The belowground organs also had the highest Al concentrations in their tissues in both seasons, particularly the fine roots. On the contrary, >1-year-old wood (trunk, rootstock, plus >1-year-old branches), shoots, and buds were the organs with the lowest Al concentrations (Figure 4).

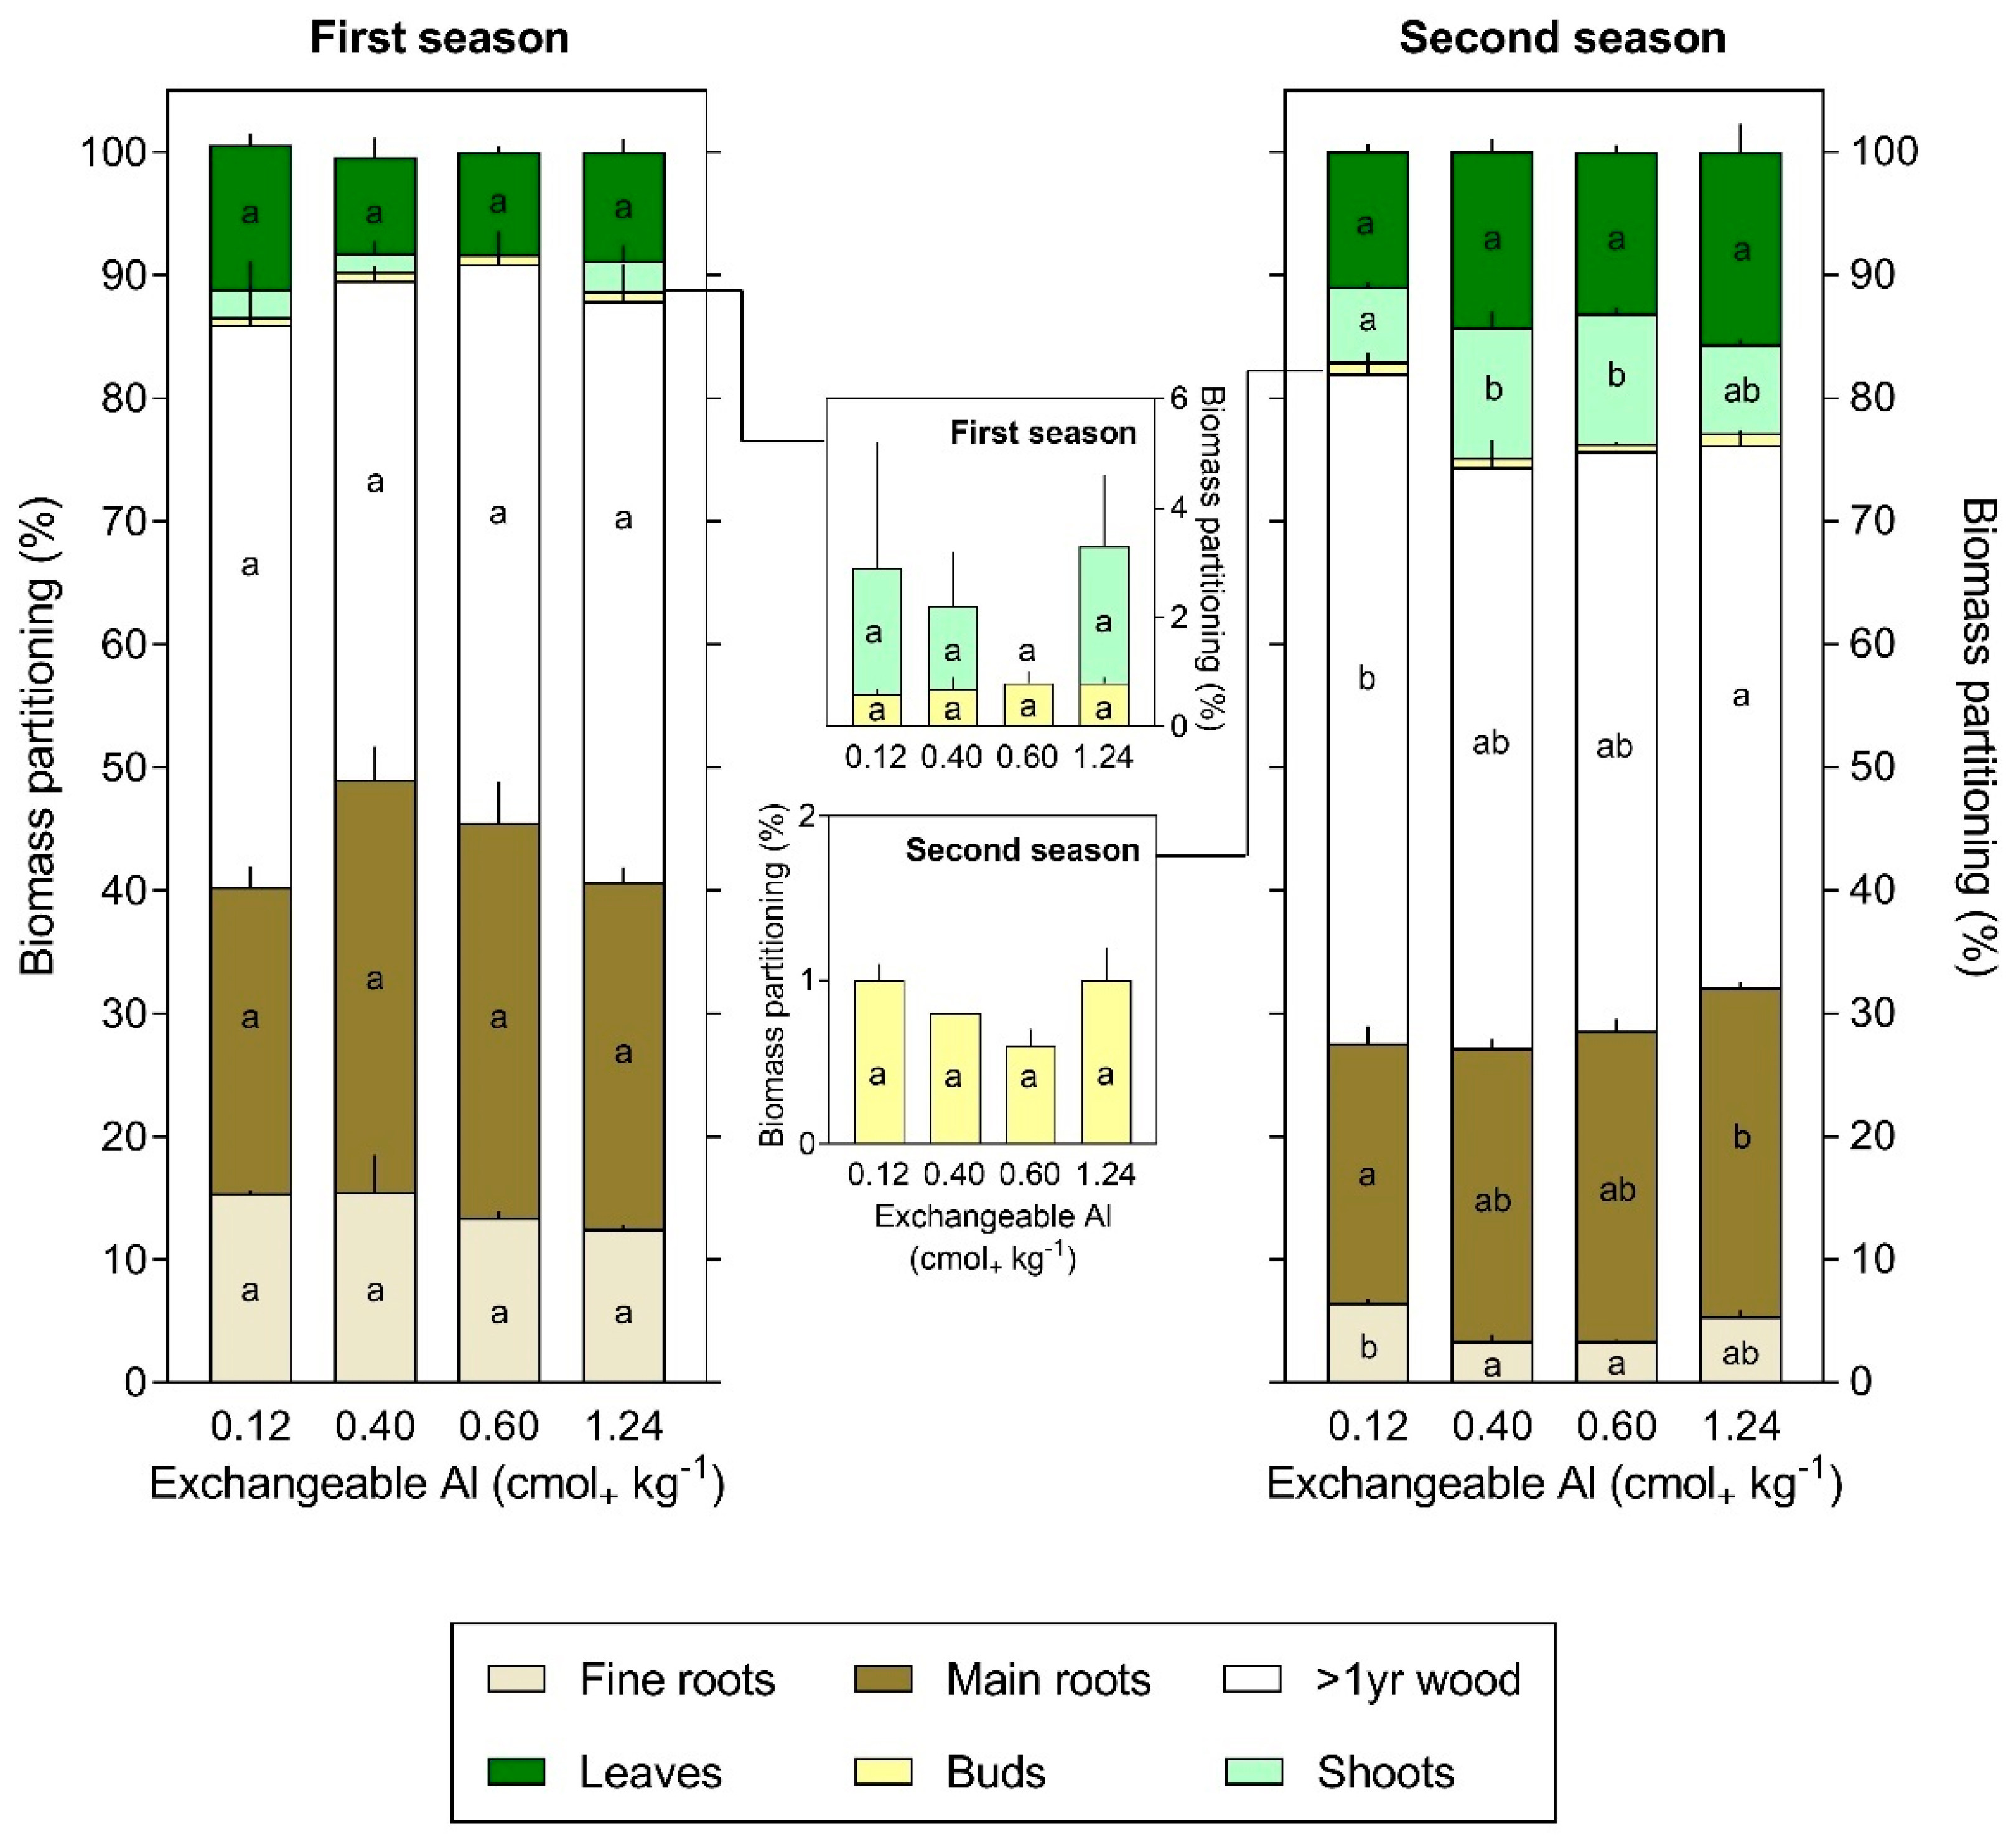
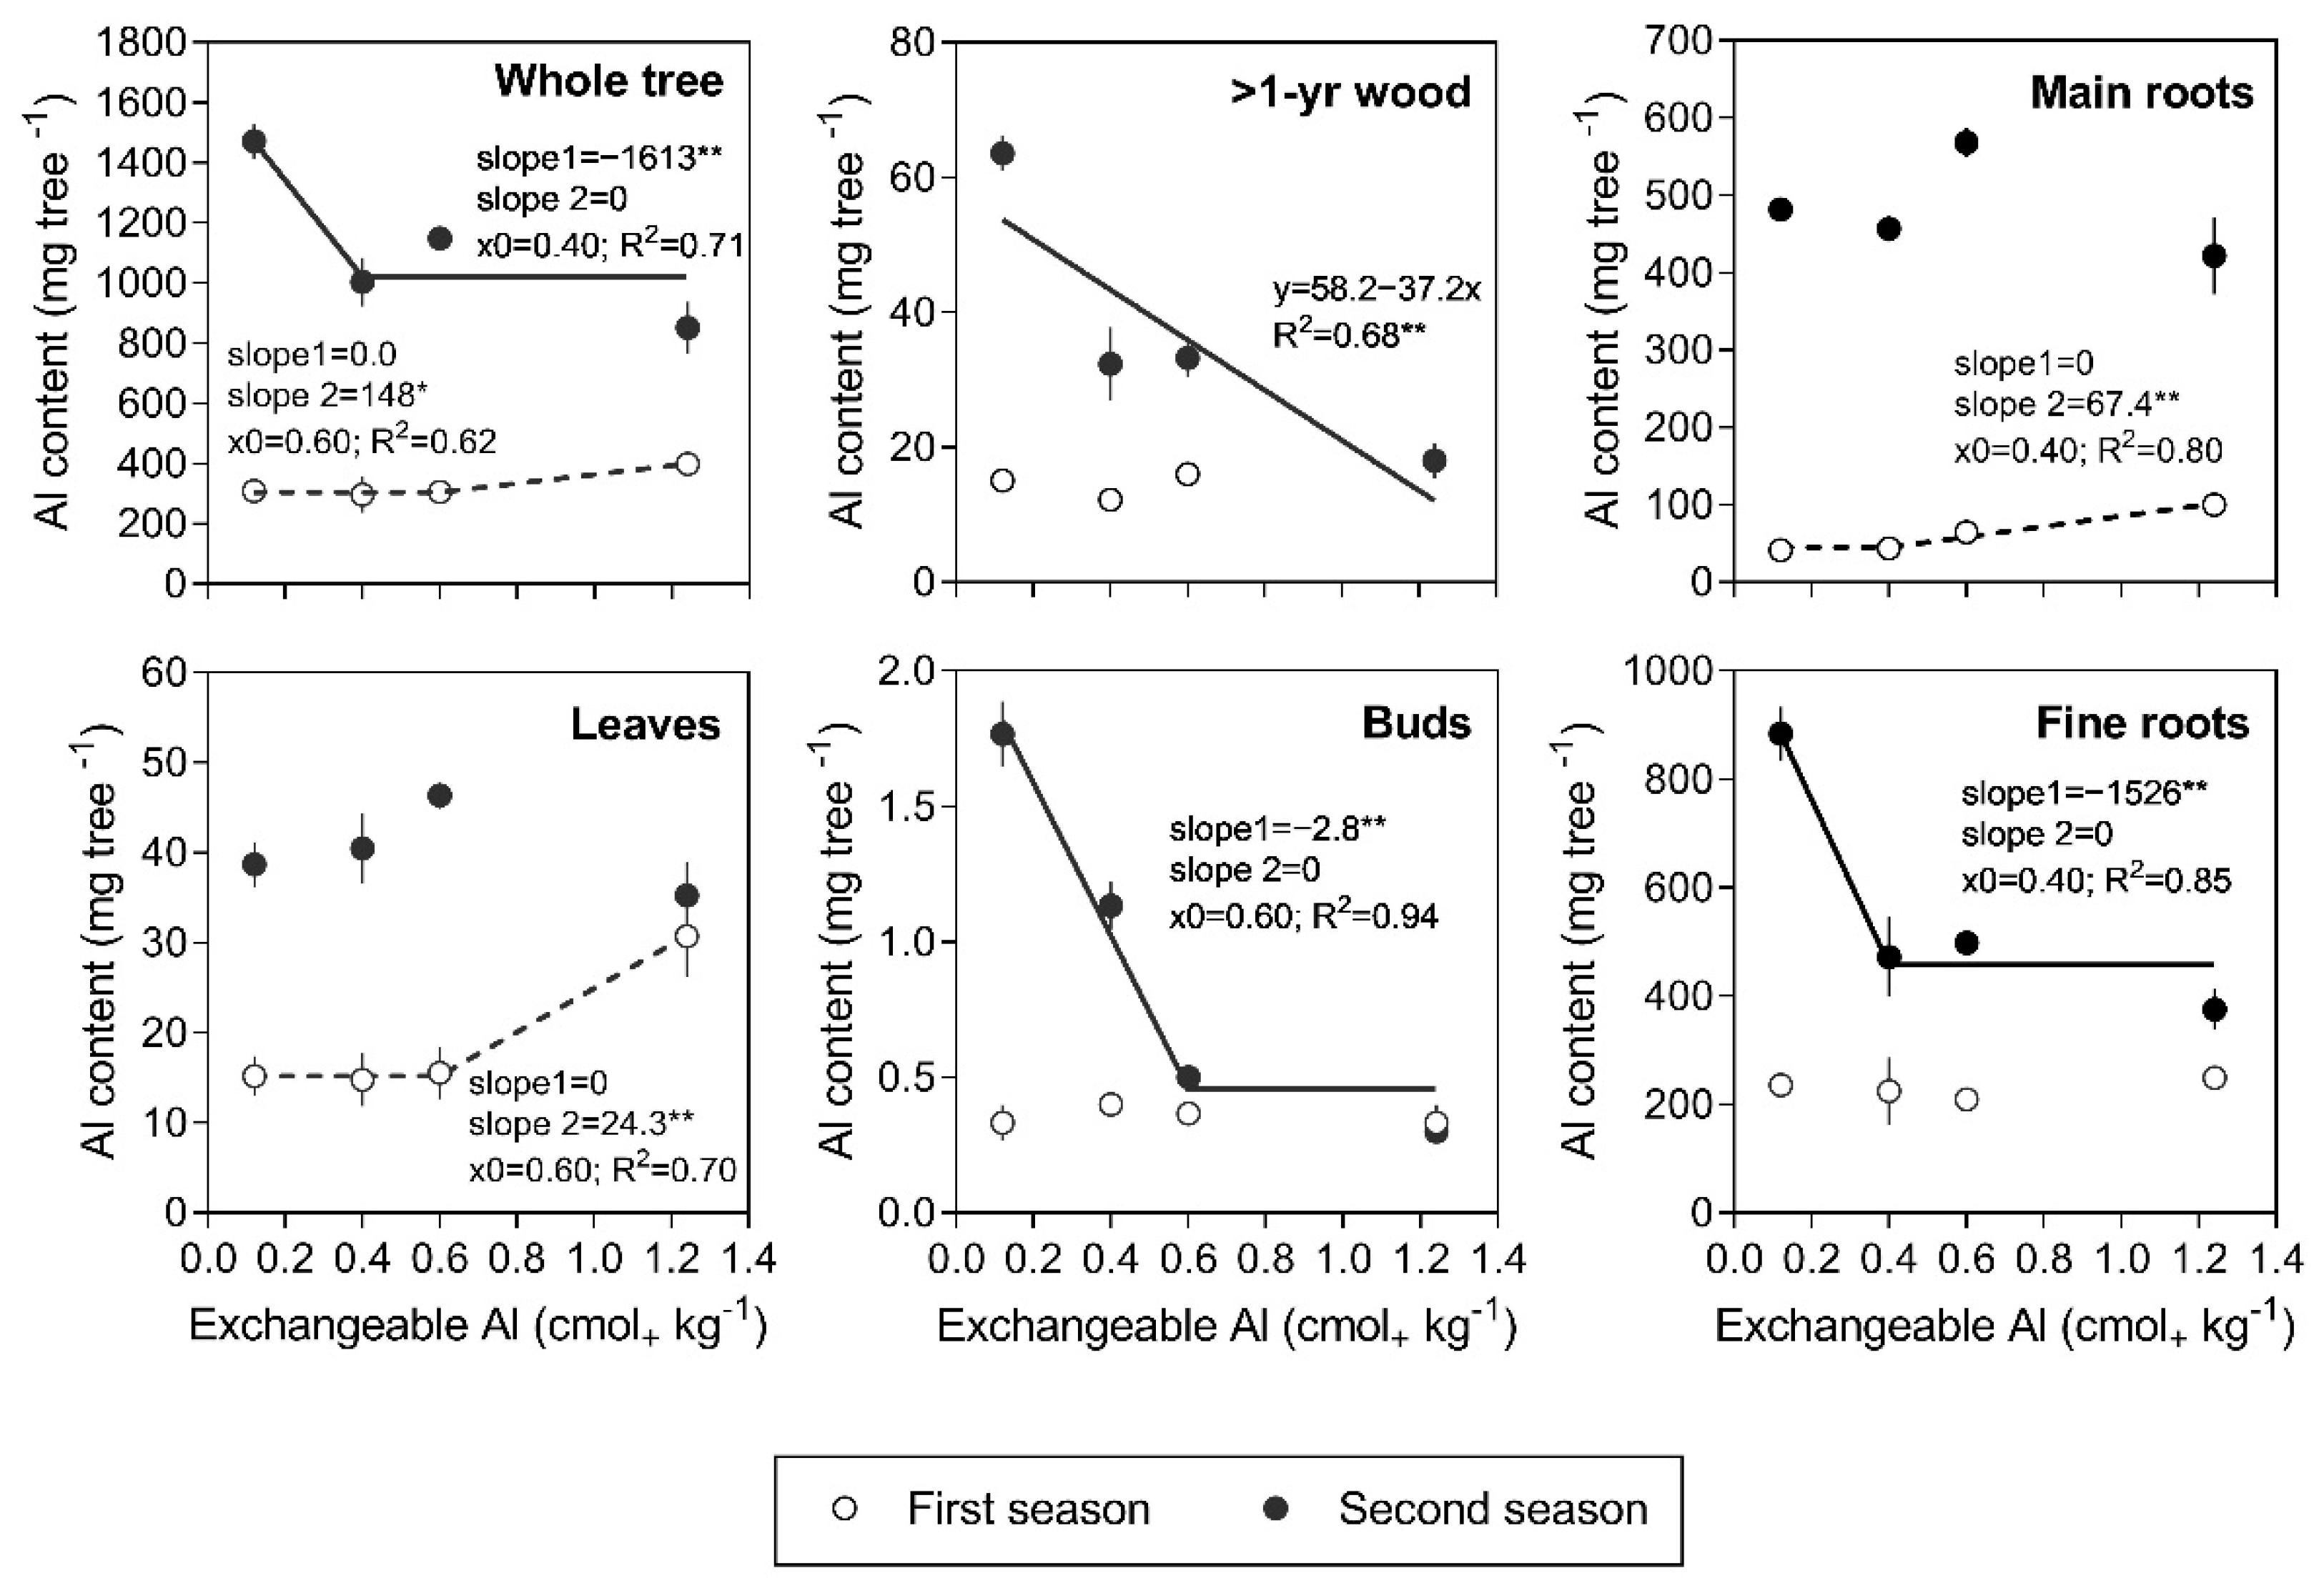
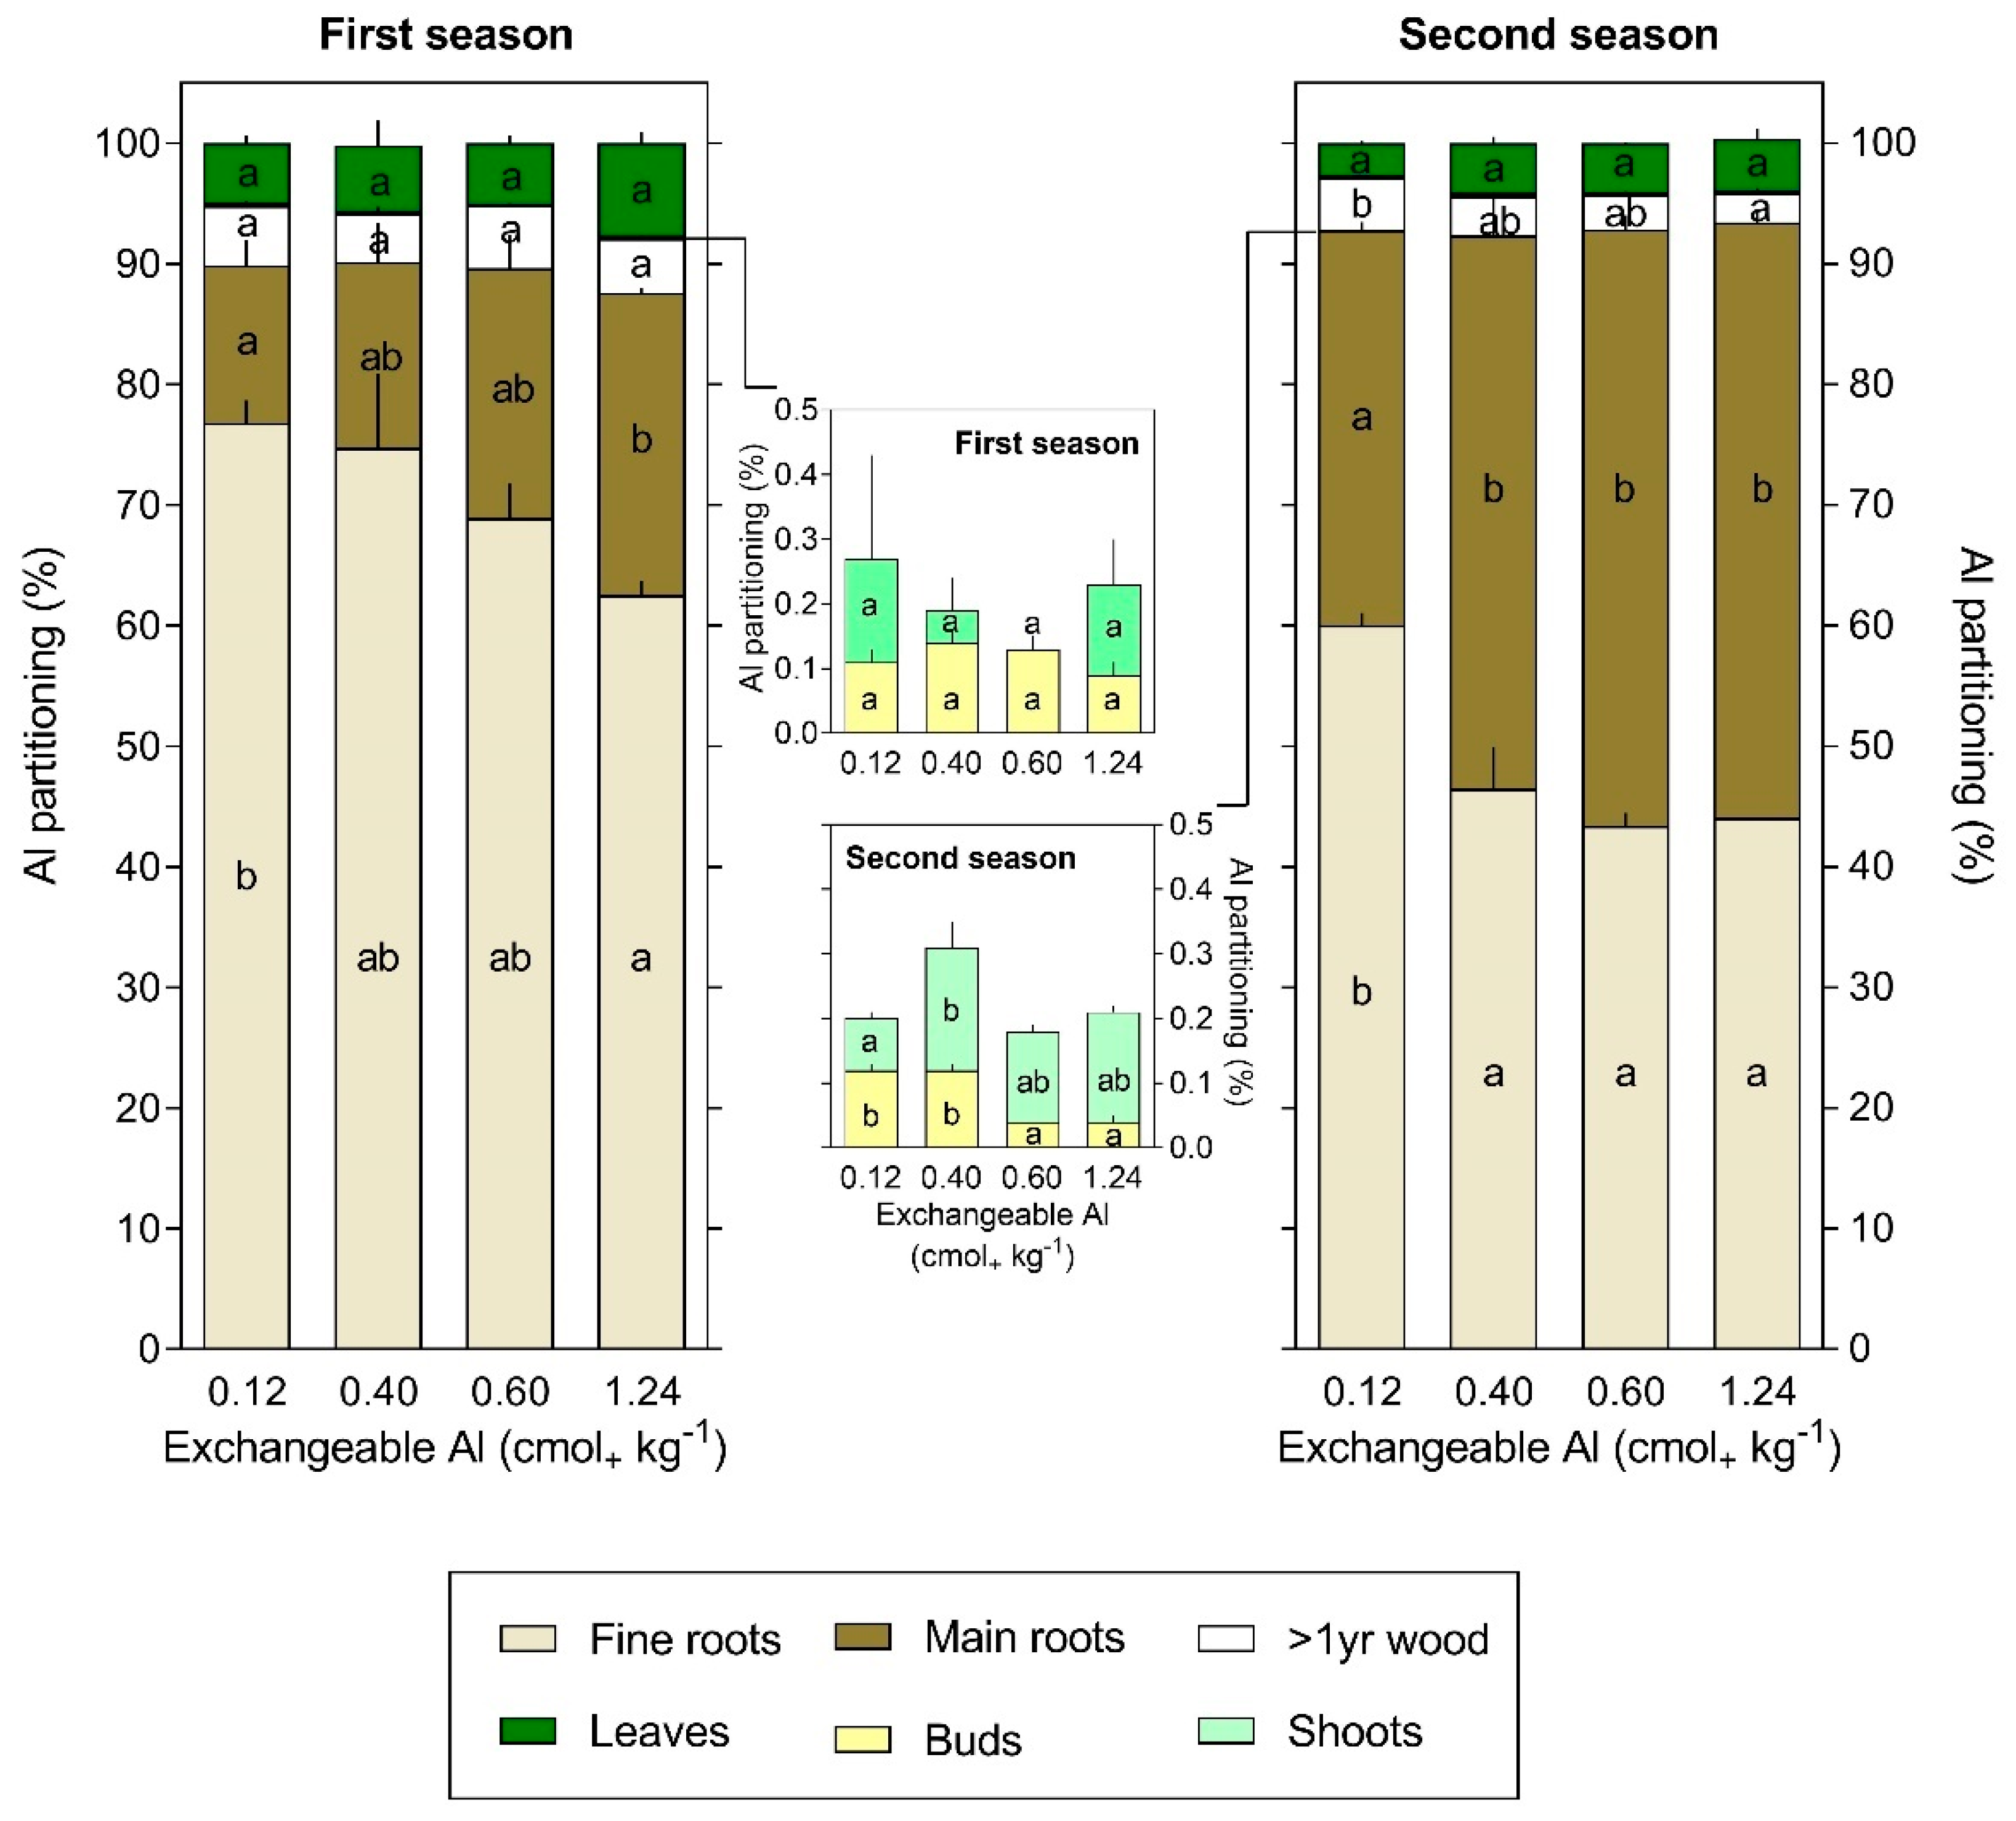
3.3. Al Content and Partitioning

The combined effects of soil Al concentration on biomass accumulation and the Al concentration in individual organs led to differential responses in terms of Al content (Figure 5). In the first season, no effects were detected on the Al content in >1-year-old wood, buds, and even fine roots. However, in the main roots, the Al content linearly increased from 40 to 100 mg tree−1 when the soil Al concentration rose from 0.40 to 1.24 cmol kg−1, whereas in the leaves, it linearly increased from 15 to 31 mg tree−1 when the soil Al concentration rose from 0.60 to 1.24 cmol kg−1 (Figure 5). Therefore, the whole-tree response was a linear increase in the Al content from 300 to 400 mg Al tree−1 with a soil Al concentration starting from 0.60 cmol kg−1 (Figure 5). In the second season, the opposite response was observed, with a decrease in the Al content in the whole tree (from 1472 to 1000 mg tree−1) and in individual organs, such as buds (from 1.8 to 0.6 mg tree−1) and fine roots (from 885 to 448 mg tree−1), when the soil Al concentration rose from 0.12 to 0.60 cmol kg−1. Above the latter value, no variation in Al content was registered in these organs. Differing from the first season, neither the main roots nor the leaves showed a significant relationship between the Al content and soil Al concentration, with an average Al content of 482 and 40 mg tree−1, respectively (Figure 5).
The Al content in the whole tree and in the fine and main roots increased with tree age at all soil Al concentrations. On average, across soil Al concentrations, the total Al content increased from 327 to 1119 mg tree−1 from the first to the second season, which means a threefold increase in one season (Figure 5). This was mainly a result of the variation in Al content in the main and fine roots, which showed average eight- and twofold increases, respectively. In >1-year-old wood, leaves, and buds, no increase in Al content was observed at the highest soil Al concentrations, but there was an increase at the lowest concentrations (Figure 5).
Independent of the soil Al concentration, the main and fine roots had the highest Al content in both growing seasons, while the shoots and buds had the lowest (Figure 5). The average Al content in the tree organs, across soil Al concentrations, in descending order was 230 mg in the fine roots, 62 mg in the main roots, 19 mg in leaves, 15 mg in >1-year-old wood, and <0.5 mg in shoots and buds in the first season, and 558 mg in the fine roots, 482 mg in the main roots, 40 mg in leaves, 38 mg in >1-year-old wood, 1.5 mg in shoots, and 0.9 mg in buds in the second season. Therefore, most of the total Al content was accounted for in the fine plus main roots in both seasons (Figure 6). Interestingly, the contribution of the fine roots to the total Al content significantly decreased with increasing soil Al concentrations, whereas the opposite was true for the main roots. Specifically, the contribution of the fine roots to total Al content decreased from 77% to 63% in the first season and from 60% to 44% in the second season, while the contribution of the main roots increased from 13% to 25% in the first season and from 33% to 49% in the second season (Figure 6). In the first season, the Al fraction accounted for in the aboveground organs did not change due to soil Al concentration, being, on average, 6% for leaves, 5% for >1-year-old wood, and <0.5% for shoots plus buds. In the second season, the Al content contribution of >1-year-old wood and buds decreased with increasing soil Al concentrations, but that of the leaves did not (Figure 6).

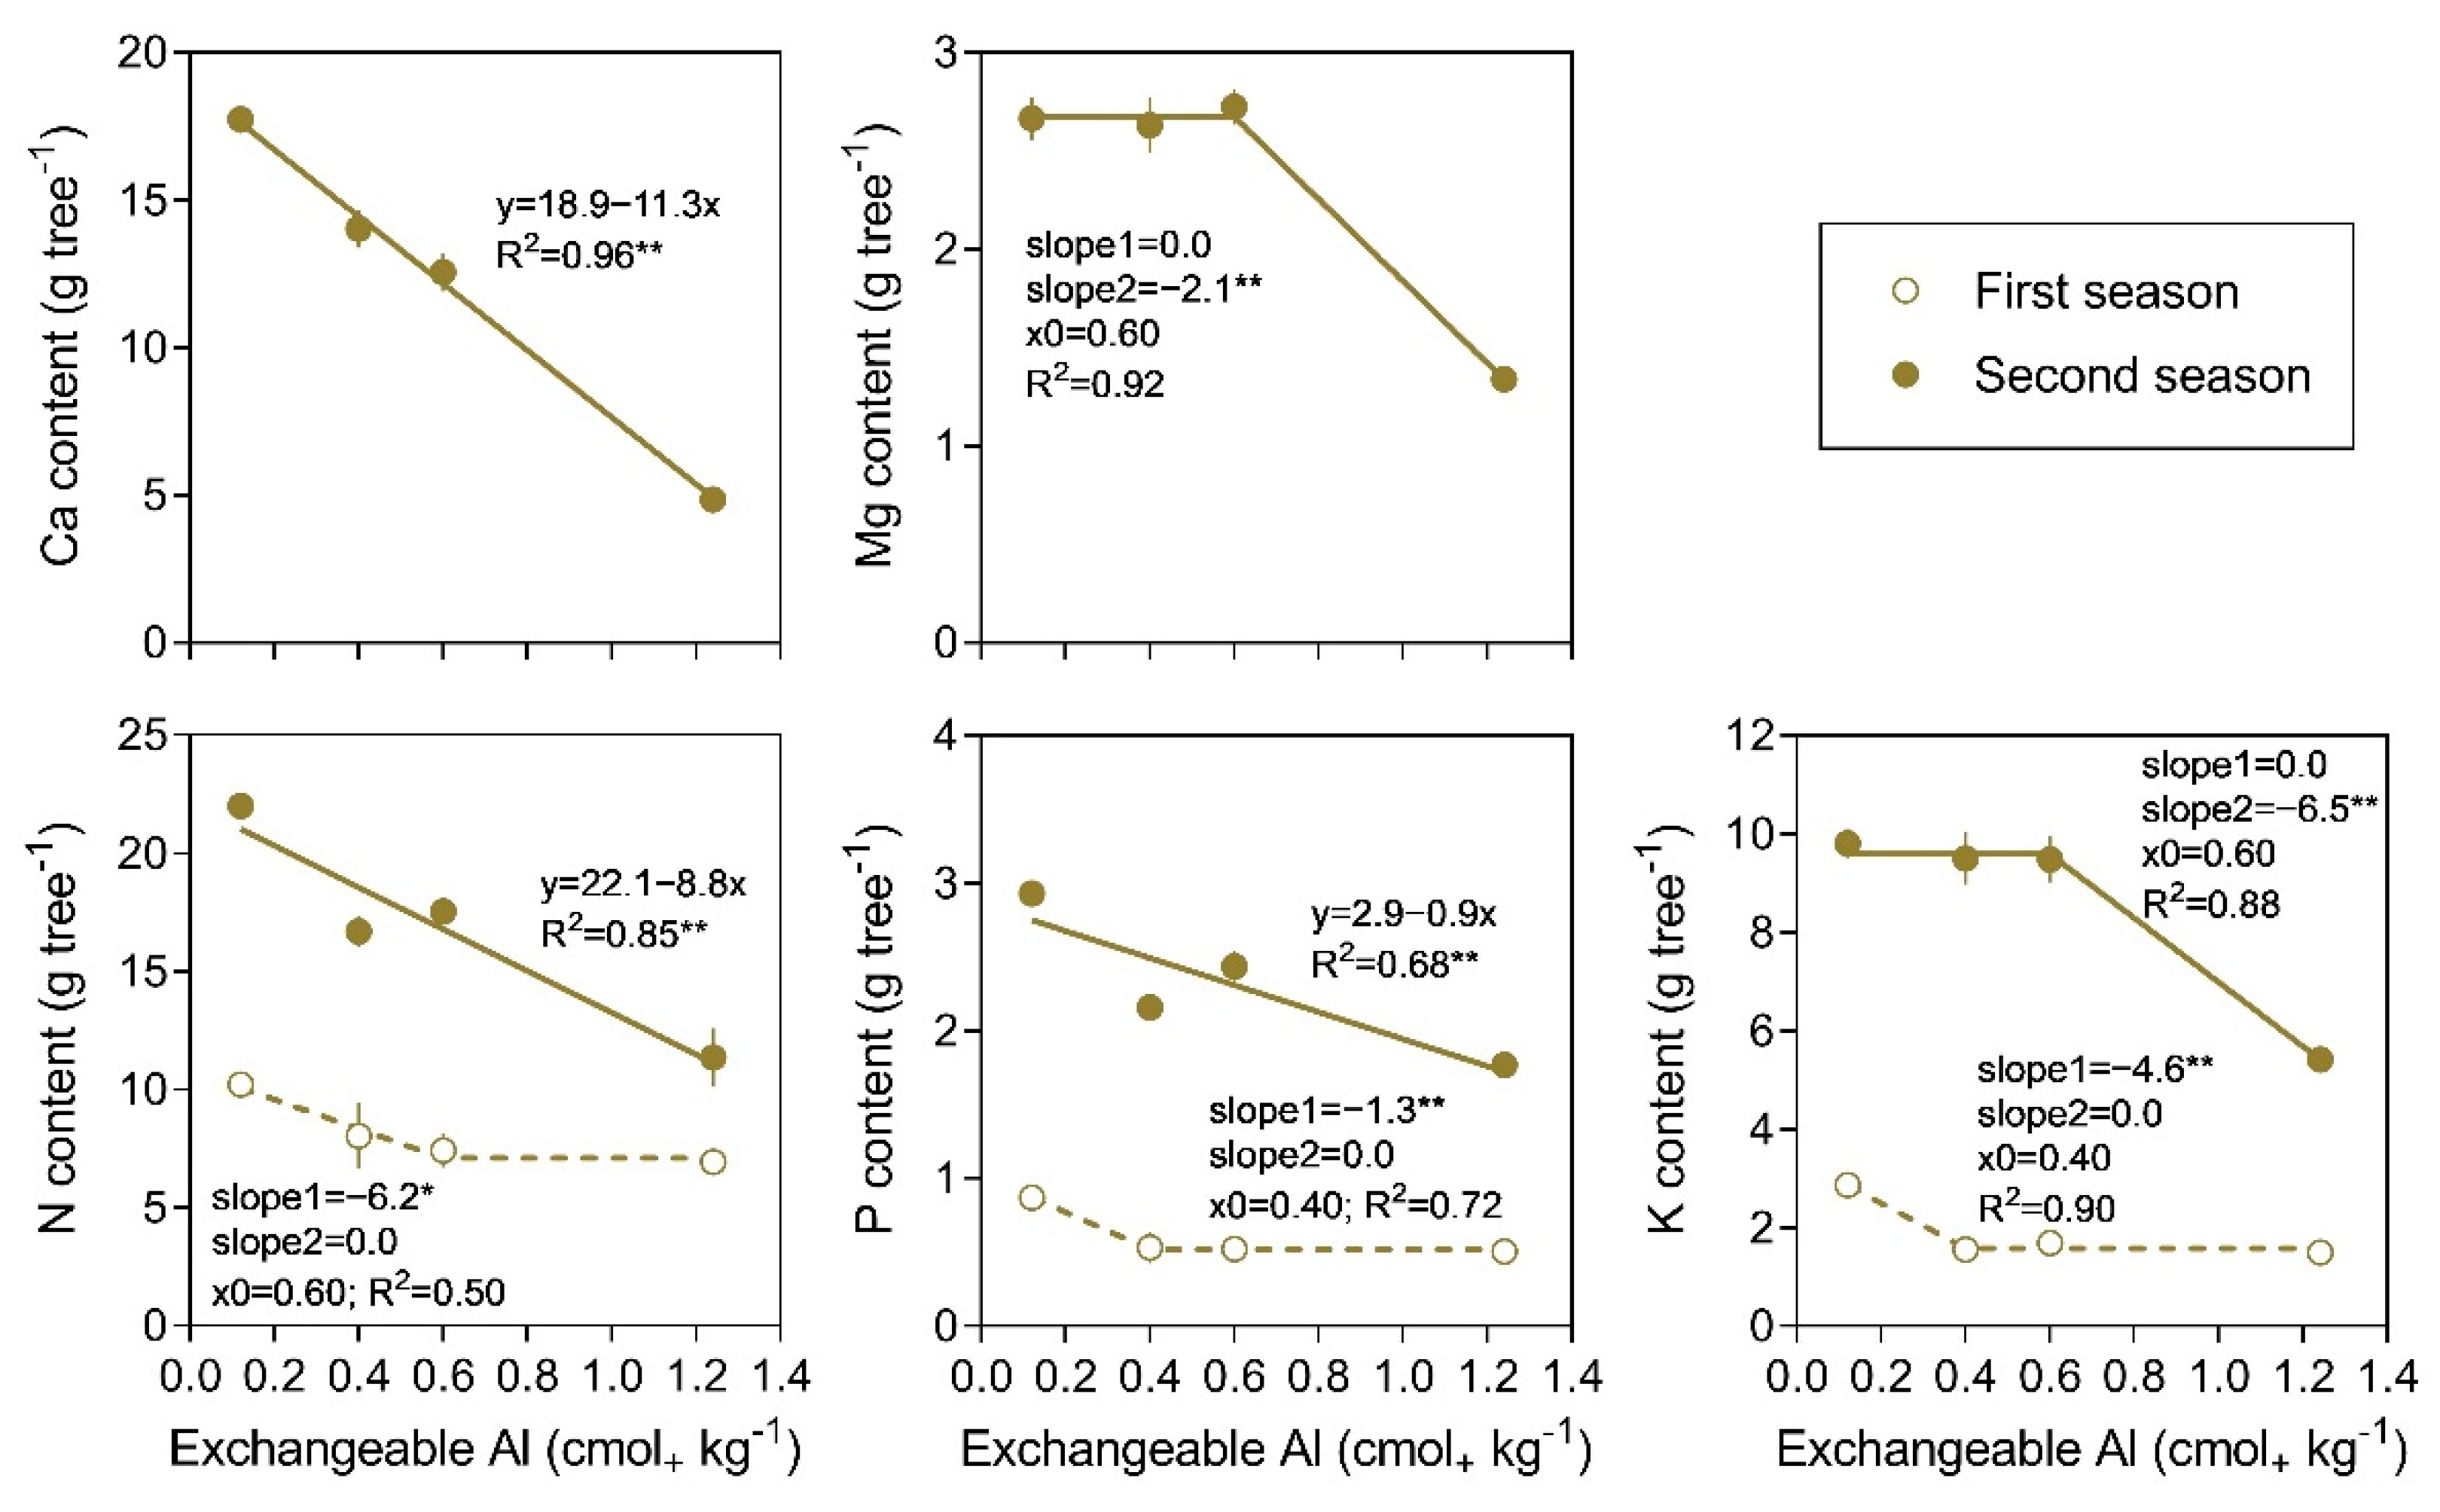
3.4. Nutrient Content in Trees

The content of macronutrients in sweet cherry trees was severely restricted by increasing soil Al concentrations in both seasons. In the first season, the relationship between the total N, P, and K content and the soil Al concentration was better explained by a broken-line regression: the nutrient content linearly decreased until 0.40 cmol kg−1 of soil Al for P or until 0.60 cmol kg−1 of soil Al for N and K, with no decrease above these thresholds (Figure 7). In the second season, a linear decrease in the total N, P, and Ca content was observed within the complete range of the soil Al concentration tested, whereas the K and Mg content significantly reduced starting from 0.60 cmol kg−1 of soil Al (Figure 7).

4. Discussion

In the experimental soil, the Al availability increased with decreasing pH values (Table 1) in an inverse exponential way (Y = 1674 * exp[−1.67 * X]; R2 = 0.99), consistent with previous reports on volcanic soils in southern Chile [48]. The soil pH range varied from 5.82 to 4.64, the exchangeable Al range from 0.12 to 1.24 cmol kg−1, and the Al saturation from 2.9% to 63.6% (Table 1). To the best of our knowledge, critical soil Al concentrations for sweet cherry and other fruit trees have not been reported thus far, at least in terms of exchangeable Al or Al saturation in the soil. Plant-dependent variables, such as differences among species and varieties in terms of resistance to Al, as well as variations in threshold toxicity concentrations for Al in soil extracts due to soil type and extractant, have hindered the correlation between soil- and plant-based indices [49,50]. However, values of 0.50 cmol kg−1 of exchangeable Al and 5% of Al saturation are used as criteria for soil liming in soybean [51], and in Chile, 0.10 cmol kg−1 of exchangeable Al is used as a critical level for Al-sensitive species [48]. Moreover, the Ministry of Agriculture of Chile has set 5% of Al saturation in volcanic soils as the limit above which there is a high probability of Al toxicity for crops and pastures. Therefore, the soil Al concentrations tested in our experiment ranged from low to high values, even for Al-tolerant species.
As previously described for sweet cherry trees [39], sweet cherry rootstocks [40,41], and many other fruit tree species (see Chen et al. [38]), increasing concentrations of exchangeable soil Al had detrimental effects on the growth of ‘Bing’ on Gisela®6 sweet cherry trees, particularly in the second season (Figure 2). At this time, biomass accumulation in the whole tree (and in aboveground and belowground fractions; data not shown) linearly decreased starting from 0.60 cmol kg−1 of exchangeable soil Al, with a slope equivalent to an 81% biomass reduction per centimole of exchangeable soil Al in relation to the treatment with the lowest soil Al concentration (Figure S1). A similar segmental linear relationship and breaking point were registered for the main roots and leaves (Figure 2), which would explain the behavior of the whole-tree biomass, considering that the main roots are one of the tree organs with the greatest contribution to the total biomass (Figure 3), as reported by Bonomelli and Artacho [45]. The biomass in buds and >1-year-old wood (trunk, rootstock, plus >1-year-old branches) seems to have a lower critical soil Al concentration than that for the whole plant, which should be at least 0.12 cmol kg−1 in volcanic soils, according to the simple and negative linear relationship between biomass and soil Al concentration (Figure 2). In both these organs, the relative biomass reduction was close to 100% per centimole of soil Al in the range between 0.12 and 1.24 cmol kg−1 of Al (Figure S1). In the first season, in contrast, only the biomass in the leaves and >1-year-old wood (trunk plus rootstock) was significantly affected by the soil Al concentration (Figure 2).
Differing from the whole tree, and most of the individual organs, the growth of fine roots was negatively affected by the soil Al concentration from the first season and from low Al concentrations. In terms of fine-root biomass, a drastic linear reduction was observed between 0.12 and 0.40 cmol kg−1 of soil Al in both seasons, and the biomass decrease was no longer registered above 0.40 cmol kg−1 (Figure 2). The relative reduction in the fine-root biomass per centimole of soil Al was equivalent to 131% in the first season and 198% in the second season in the range between 0.12 and 0.40 cmol kg−1 of soil Al (Figure S1). The standing fine-root length showed a behavior similar to that of fine-root biomass in both seasons (Table 1). Therefore, fine-root growth was the most strongly affected process, as reported from the beginning of the past century in many trials on different species and under different experimental conditions [49]. These results also reflect the role of fine roots as the primary organ of perception and expression of Al toxicity [17,24]. In fact, fine-root parameters are recognized as sensitive indicators of Al toxicity and other environmental changes because root responses occur prior to the responses of the aboveground parts [49,52]. Such high sensitivity of fine roots to soil Al is explained by their particular characteristics. For example, they are located directly in the soil, they have a relatively short life span, and they are susceptible to changes in the carbon allocation within plants [53].
The TCSA of sweet cherry trees, an aboveground, non-destructive, and less time-consuming measurement, evidenced Al toxicity from the first season but with a lower sensitivity than fine-root measurements (Table 2). Our results suggest that the critical soil Al concentration for trunk growth would be as high as 1.24 cmol kg−1 and that the TCSA measurement would not be sensitive enough at lower soil Al concentrations. The shoot length and total leaf area were restricted only in the second season and starting from 0.60 cmol kg−1 of soil Al (Table 2). Moreover, a slight effect of Al stimulation on shoot growth and foliar area was observed, particularly between 0.40 and 0.60 cmol kg−1 in comparison to the lowest soil Al concentration tested. The beneficial effects of moderate Al doses, such as an increase in plant growth, alleviation of abiotic stress, promotion of resistance to biotic stress, and an increase in metabolism and antioxidant activity, have been reported mainly in woody species adapted to acid soils [4], but may also occur in Al-stimulated plants [54].
The Al concentration in vegetal tissues was another variable affected by the soil Al concentration from the first season after planting (Figure 4). At this time, all individual tree organs except buds showed a linear increase in the Al concentration with increasing soil Al concentrations, which would reflect some degree of Al uptake and long-distance transport within the trees. In the second season, different responses were observed, depending on the tree organ (Figure 4). In the main and fine roots, >1-year-old branches, shoots, and leaves, the higher the availability of soil Al, the greater the concentration of Al in tissues, with or without breaking points. Interestingly, the contrary was true for the buds, which registered a linear decrease in the Al concentration (Figure 4). In cherry trees, buds are simple and borne on shoots or spurs, which provide water and nutrients for bud development [55,56]. However, the temporary obstruction of the plasmodesmatal system by callose deposition allows controlling the supply route through the phloem between the buds and the shoot [57,58]. Callose deposition also occurs under Al stress, driven by Al-signal-mediated alterations to Ca2+ homeostasis [17,18]. Plants have evolved long-range and fast signaling systems involving Ca2+ and other mobile small molecules, hormones, and even electrical signals [59]; therefore, lower Al concentrations in buds with increasing soil Al may be a result of metabolic isolation of the buds via Al-induced callose deposition at plasmodesmatal connections.
Plant tolerance to Al toxicity is associated with not only low Al uptake, but also relatively little Al translocation from roots to shoots [38,60]. Our results indicate that sweet cherry trees preferentially accumulate Al in their root tissues and restrict Al translocation to the aerial organs, constituting an Al excluder similar to most plant species [30]. In fact, among the tree organs, the Al concentration was the highest in the fine roots, being at least 30 times higher than the Al concentration in the leaves (Figure 4). This is because the negatively charged carboxylic groups in the pectin matrix of the root cell wall are the primary site of Al3+ binding [30], and up to 90% of the Al3+ absorbed by the roots can be localized to the root apoplast [28]. In addition, the pectin content and the degree of pectin methylation would be important determinants of the amount of Al3+ that can bind to the cell walls of root cells, playing a role in Al resistance [35,61]. In the main roots, the Al concentration was lower than that in the fine roots, but it was still much higher than that in the aerial organs, which did not exceed a few hundred mg kg−1 dry weight (Figure 4). The buds had the lowest Al concentration, even at the highest soil Al concentration, suggesting additional mechanisms to maintain the Al concentration in a safe physiological range in the buds, preventing damage to an organ essential to the growth and development cycle of sweet cherry trees.
The Al concentration in the fine roots varied within a narrow range; on average, from 1708 to 3305 mg kg−1 in the first season, and from 5508 to 6498 mg kg−1 in the second season, despite the ample range of soil Al availability tested (from 0.12 to 1.24 cmol kg−1) (Figure 4), suggesting the operation of some Al exclusion mechanism. Moreover, the proportion of total Al content accounted for in belowground organs remained relatively unchanged across soil Al concentrations in both seasons (about 90%) (Figure 6), which would be considered additional evidence. The best-characterized Al exclusion mechanism in many monocot and dicot species is the Al-dependent root exudation of organic acids such as malate, citrate, and/or oxalate into the rhizosphere, where they chelate Al3+ ions, forming nontoxic compounds that do not enter the root [17,35]. There is evidence for the Al-induced secretion of organic acids in woody plants such as Populus, Pinus, and Eucalyptus species [61], and in fruit tree species such as citrus [62]. In sweet cherry trees, there are no reports in this regard. The closest reference is the root efflux of malate and citrate reported for Prunus rootstocks, but in response to iron chlorosis [63] and N fertilization [64]. Therefore, whether the roots of sweet cherry trees use such an Al3+ exclusion mechanism remains unclear.
As mentioned above, the Al concentration in senescent leaves linearly increased with increasing soil Al concentrations, constituting a good candidate as an indicator of Al toxicity. However, the Al concentration in senescent leaves at soil Al concentrations equal to or higher than 0.40 cmol kg−1 was lower in the second season than in the first season (Figure 4). This inter-seasonal variation could be due to low root-to-shoot Al transport [49] and hampers the use of the Al concentration in senescent leaves as an indicator of Al toxicity. The values of Al concentration in green leaves collected in mid-summer, as traditionally done in sweet cherry orchards, showed higher stability among seasons (data not shown), but only in the second season were they significantly related to soil Al availability (Figure 8A). According to the foliar Al concentration–soil Al relationship, foliar analysis would be sensitive enough up to 0.60 cmol kg−1 of soil Al (Figure 8A). However, when the foliar Al concentration and relative biomass production at the whole-tree level were related, it was possible to define a critical foliar concentration of Al in green leaves (76 mg kg−1), above which the biomass production in non-bearing sweet cherry trees was significantly reduced (Figure 8B). This threshold Al concentration constitutes a first approximation, and it must be validated with additional measurements.
Toxic Al interferes with the acquisition, accumulation, localization, and use of most of the mineral elements [25]. However, the toxic effects of Al on nutrient uptake depend on the time of exposure to Al, the Al concentration in the growth medium, the nutrient studied, and the species or cultivar of fruit trees [38,65]. In our study, the total macronutrient content in sweet cherry trees was severely restricted by increasing soil Al concentrations (Figure 7). In the second season, the responses were linear for N, P, and Ca and segmentally linear for K and Mg. Decreasing but differential responses with increased soil Al concentrations depending on the nutrient studied have been reported previously for seedlings of peach, although Al did not alter the translocation of most nutrients, including Ca [65]. In fact, mid-summer foliar analysis showed adequate values of N, P, and K according to the reference standards reported by Reuter and Robinson [66]. However, the foliar concentration of Ca linearly decreased with increasing soil Al concentrations (Y = −0.31 * X + 0.77; R2 = 0.74; p = 0.0014), different from that reported by Edwards and Horton [65], suggesting an influence of toxic Al on Ca translocation within the tree. The foliar Mg concentration did not show a significant relationship with soil Al availability, but the values were deficient in the complete range of soil Al tested. Therefore, the uptake of all studied elements was affected to a greater or lesser extent, but Ca was the most affected. Al affects the uptake of mineral nutrients by inhibiting root growth as well as by altering the root membrane structure and function [38,54,67]. Ca2+ is absorbed at the new root apex zone when the Casparian strip is not yet developed; therefore, an Al-mediated reduction in root growth can have dramatic effects on Ca uptake. In addition, Al3+ affects membrane transporters (ion channels, carriers, and pumps), and specifically for Ca, Al+3 blocks the voltage-gated Ca2+ channels in the root plasma membrane. Similarly, Al3+ blocks the inward K+ channels in the root plasma membrane as well as reduces the activity of Mg2+ transporters (see Kar et al. [67] and citations therein). For P uptake, in addition to the Al-induced impairment of P transporters in the plasma membrane, the inhibition of root growth by Al toxicity should have a major impact on P uptake. Among the most important root traits for P uptake are the rate of root elongation and the root diameter, considering the slow diffusion of inorganic P in the soil, which, in turn, results from its low concentrations in the soil solution and the high reactivity of inorganic P [68]. For N, probably, the effect of Al3+ on the activity of NO3− transporters [67] should be the main factor explaining the reduced N uptake under Al stress, given the high NO3− mobility in the soil.

5. Conclusions

For non-bearing ‘Bing’ on Gisela®6 sweet cherry trees growing in a volcanic soil, increasing concentrations of exchangeable Al had detrimental effects on nutrient uptake and growth, particularly in the second season after planting. The whole-tree biomass linearly decreased starting from 0.60 cmol kg−1 of exchangeable soil Al. However, fine-root responses occurred prior to the responses in the aboveground organs. Both length and biomass of the fine roots were drastically reduced from the first season and from low Al concentrations, reflecting the role of fine roots as a primary organ of perception and expression of Al toxicity. In general, the higher the availability of Al in the soil, the greater the concentration of Al in the tissues of individual organs. However, the Al concentration in fine roots was the highest, in the order of thousands of mg kg−1 dry weight, whereas in aerial organs, it did not exceed a few hundred mg kg−1 dry weight. Therefore, we postulate that sweet cherry trees preferentially accumulate Al in their root tissues and restrict Al translocation to the aerial organs and also that some Al exclusion mechanism might be operating in the rhizosphere. In addition, Al accumulation in fine roots, in conjunction with the Al-induced reduction in fine-root growth, severely restricts the uptake of N, P, K, Mg, and, particularly, Ca. Moreover, Ca translocation within the tree also appears to be affected by toxic Al. Therefore, soil acidity must be corrected (e.g., by soil liming) before tree planting in order to ensure the rapid and successful establishment of sweet cherry orchards on volcanic soils in southern Chile.

Supplementary Materials

The following are available online at https://www.mdpi.com/article/10.3390/agronomy11061259/s1. Figure S1: Relationship between relative biomass accumulation in the whole tree and in individual organs of sweet cherry trees and exchangeable Al in a volcanic soil. Values are the means, with standard errors as vertical bars (n = 3). Significance of slopes: * p < 0.05; ** p < 0.01. In segmental regression, slope1 is the slope of the first line segment, slope2 is the slope of the second line segment, and X0 is the X value where the two line segments intersect.

Author Contributions

Conceptualization, C.B. and P.A.; methodology, P.A.; validation, C.B. and P.A.; formal analysis, P.A.; investigation, P.A.; resources, C.B. and P.A.; data curation, P.A.; writing—original draft preparation, C.B. and P.A.; writing—review and editing, C.B. and P.A.; visualization, C.B.; supervision, C.B.; project administration, P.A.; funding acquisition, P.A. All authors have read and agreed to the published version of the manuscript.

Funding

This research was funded by the Comisión Nacional de Investigación Científica y Tecnológica del Ministerio de Educación del Gobierno de Chile (CONICYT; grant No. 24121664 (2012–2014)).

Institutional Review Board Statement

Not Applicable.

Informed Consent Statement

Not Applicable.

Data Availability Statement

The data presented in this study are available on request from the corresponding author.

Acknowledgments

The authors acknowledge the Estación Experimental Austral de la Universidad Austral de Chile for providing the physical location for the field trial and the agronomy students of the Pontificia Universidad Católica de Chile (Felipe Ahumada) and the Universidad Austral de Chile (Jorge Peralta) who contributed to the field and laboratory work.

Conflicts of Interest

The authors declare no conflict of interest.

References

  1. iQonsulting. Anuario Cereza 2020–2021 Desafíos En El Mercado Chino Ante El Aumento de La Oferta. Available online: http://www.iqonsulting.com/yb/# (accessed on 21 April 2021).
  2. Dahlgren, R.A.; Saigusa, M.; Ugolini, F.C. The Nature, Properties and Management of Volcanic Soils. Adv. Agron. 2004, 82, 113–182. [Google Scholar] [CrossRef]
  3. Borie, F.; Aguilera, P.; Castillo, C.; Valentine, A.; Seguel, A.; Barea, J.M.; Cornejo, P. Revisiting the Nature of Phosphorus Pools in Chilean Volcanic Soils as a Basis for Arbuscular Mycorrhizal Management in Plant P Acquisition. J. Soil Sci. Plant Nutr. 2019, 19, 390–401. [Google Scholar] [CrossRef]
  4. Bojórquez-Quintal, E.; Escalante-Magaña, C.; Echevarría-Machado, I.; Martínez-Estévez, M. Aluminum, a Friend or Foe of Higher Plants in Acid Soils. Front. Plant Sci. 2017, 8, 1–18. [Google Scholar] [CrossRef]
  5. Kinraide, T.B. Identity of the Rhizotoxic Aluminium Species. Plant Soil 1991, 134, 167–178. [Google Scholar] [CrossRef]
  6. Delhaize, E.; Ryan, P.R. Aluminum Toxicity and Tolerance in Plants. Plant Physiol. 1995, 107, 315–321. [Google Scholar] [CrossRef] [PubMed] [Green Version]
  7. von Uexküll, H.R.; Mutert, E. Global Extent, Development and Economic Impact of Acid Soils. Plant Soil 1995, 171, 1–15. [Google Scholar] [CrossRef]
  8. Matsumoto, H. Cell Biology of Aluminum Toxicity Tolerance in Higher Plants. Int. Rev. Cytol. 2000, 200, 1–46. [Google Scholar] [CrossRef]
  9. Čiamporová, M. Morphological and Structural Responses of Plant Roots to Aluminium at Organ, Tissue, and Cellular Levels. Biol. Plant. 2002, 45, 161–171. [Google Scholar] [CrossRef]
  10. Scott, B.J.; Ridley, A.M.; Conyers, M.K. Management of Soil Acidity in Long-Term Pastures of South-Eastern Australia: A Review. Aust. J. Exp. Agric. 2000, 40, 1173–1198. [Google Scholar] [CrossRef]
  11. Zhao, X.Q.; Shen, R.F. Aluminum—Nitrogen Interactions in the Soil—Plant System. Front. Plant Sci. 2018, 9, 807. [Google Scholar] [CrossRef] [Green Version]
  12. Graham, C.J. The Influence of Nitrogen Source and Aluminum on Growth and Elemental Composition of Nemaguard Peach Seedlings. J. Plant Nutr. 2001, 24, 423–439. [Google Scholar] [CrossRef]
  13. Liao, X.Y.; Yang, L.T.; Lu, Y.B.; Ye, X.; Chen, L.S. Roles of Rootstocks and Scions in Aluminum-Tolerance of Citrus. Acta Physiol. Plant. 2015, 37, 1743. [Google Scholar] [CrossRef]
  14. Sade, H.; Meriga, B.; Surapu, V.; Gadi, J.; Sunita, M.S.; Suravajhala, P.; Kavi Kishor, P. Toxicity and Tolerance of Aluminum in Plants: Tailoring Plants to Suit to Acid Soils. BioMetals 2016, 29, 187–210. [Google Scholar] [CrossRef] [PubMed]
  15. Dos Santos Neto, J.; Delfini, J.; Silva, T.W.; Hirose, A.A.; Novais, J.M.; Azeredo Gonçalves, L.S.; Moda-Cirino, V. Response of Common Bean Cultivars and Lines to Aluminum Toxicity. Agronomy 2020, 10, 296. [Google Scholar] [CrossRef] [Green Version]
  16. Barceló, J.; Poschenrieder, C. Fast Root Growth Responses, Root Exudates, and Internal Detoxification as Clues to the Mechanisms of Aluminium Toxicity and Resistance: A Review. Environ. Exp. Bot. 2002, 48, 75–92. [Google Scholar] [CrossRef]
  17. Kochian, L.V.; Hoekenga, O.A.; Piñeros, M.A. How Do Crop Plants Tolerate Acid Soils? Mechanisms of Aluminum Tolerance and Phosphorous Efficiency. Annu. Rev. Plant Biol. 2004, 55, 459–493. [Google Scholar] [CrossRef] [PubMed]
  18. Sivaguru, M.; Fujiwara, T.; Samaj, J.; Baluska, F.; Yang, Z.; Osawa, H.; Maeda, T.; Mori, T.; Volkmann, D.; Matsumoto, H. Aluminum-Induced 1→3-β-D-Glucan Inhibits Cell-to-Cell Trafficking of Molecules through Plasmodesmata. A New Mechanism of Aluminum Toxicity in Plants. Plant Physiol. 2000, 124, 991–1005. [Google Scholar] [CrossRef] [PubMed] [Green Version]
  19. Panda, S.K.; Matsumoto, H. Molecular Physiology of Aluminum Toxicity and Tolerance in Plants. Bot. Rev. 2007, 73, 326–347. [Google Scholar] [CrossRef]
  20. Kopittke, P.M.; Pax, F.; Blamey, C. Theoretical and Experimental Assessment of Nutrient Solution Composition in Short-Term Studies of Aluminium Rhizotoxicity. Plant Soil 2016, 40, 311–326. [Google Scholar] [CrossRef]
  21. Chandra, J.; Keshavkant, S. Mechanisms Underlying the Phytotoxicity and Genotoxicity of Aluminum and Their Alleviation Strategies: A Review. Chemosphere 2021, 278, 130384. [Google Scholar] [CrossRef]
  22. Hirano, Y.; Kaneko, S.; Isomura, A. Root Morphology and Nutritional Status of Japanese Red Cedar Saplings Subjected to in Situ Levels of Aluminum in Forest Soil Solution. J. Res. 2003, 8, 209–214. [Google Scholar] [CrossRef]
  23. Kopittke, P.M.; Blamey, F.P.C.; Menzies, N.W. Toxicities of Soluble Al, Cu, and La Include Ruptures to Rhizodermal and Root Cortical Cells of Cowpea. Plant Soil 2007, 303, 217–227. [Google Scholar] [CrossRef]
  24. Ryan, P.R.; Ditomaso, J.M.; Kochian, L.V. Aluminium Toxicity in Roots: An Investigation of Spatial Sensitivity and the Role of the Root Cap. J. Exp. Bot. 1993, 44, 437–446. [Google Scholar] [CrossRef]
  25. Rahman, M.A.; Lee, S.H.; Ji, H.C.; Kabir, A.H.; Jones, C.S.; Lee, K.W. Importance of Mineral Nutrition for Mitigating Aluminum Toxicity in Plants on Acidic Soils: Current Status and Opportunities. Int. J. Mol. Sci. 2018, 19, 3073. [Google Scholar] [CrossRef] [PubMed] [Green Version]
  26. Sivaguru, M.; Horst, W.J. The Distal Part of the Transition Zone Is the Most Aluminum-Sensitive Apical Root Zone of Maize. Plant Physiol. 1998, 116, 155–163. [Google Scholar] [CrossRef] [Green Version]
  27. Blair, M.W.; López-Marín, H.D.; Rao, I.M. Identification of Aluminum Resistant Andean Common Bean (Phaseolus vulgaris L.) Genotypes. Braz. J. Plant Physiol. 2009, 21, 291–300. [Google Scholar] [CrossRef]
  28. Kochian, L.V. Cellular Mechanisms of Aluminum Toxicity and Resistance in Plants. Annu. Rev. Plant Physiol. Plant Mol. Biol. 1995, 46, 237–260. [Google Scholar] [CrossRef]
  29. Vitorello, V.A.; Capaldi, F.R.; Stefanuto, V.A. Recent Advances in Aluminum Toxicity and Resistance in Higher Plants. Braz. J. Plant Physiol. 2005, 17, 129–143. [Google Scholar] [CrossRef]
  30. Horst, W.J.; Wang, Y.; Eticha, D. The Role of the Root Apoplast in Aluminium-Induced Inhibition of Root Elongation and in Aluminium Resistance of Plants: A Review. Ann. Bot. 2010, 106, 185–197. [Google Scholar] [CrossRef]
  31. Rahman, R.; Upadhyaya, H. Aluminium Toxicity and Its Tolerance in Plant: A Review. J. Plant Biol. 2021, 64, 101–121. [Google Scholar] [CrossRef]
  32. Kochian, L.V.; Piñeros, M.A.; Hoekenga, O.A. The Physiology, Genetics and Molecular Biology of Plant Aluminum Resistance and Toxicity. Plant Soil 2005, 274, 175–195. [Google Scholar] [CrossRef]
  33. Grisel, N.; Zoller, S.; Künzli-Gontarczyk, M.; Lampart, T.; Münsterkötter, M.; Brunner, I.; Bovet, L.; Métraux, J.P.; Sperisen, C. Transcriptome Responses to Aluminum Stress in Roots of Aspen (Populus Tremula). BMC Plant Biol. 2010, 10, 1–15. [Google Scholar] [CrossRef] [Green Version]
  34. Cárcamo, M.P.; Reyes-Díaz, M.; Rengel, Z.; Alberdi, M.; Omena-Garcia, R.P.; Nunes-Nesi, A.; Inostroza-Blancheteau, C. Aluminum Stress Differentially Affects Physiological Performance and Metabolic Compounds in Cultivars of Highbush Blueberry. Sci. Rep. 2019, 9, 11275. [Google Scholar] [CrossRef] [Green Version]
  35. Kochian, L.V.; Piñeros, M.A.; Liu, J.; Magalhaes, J.V. Plant Adaptation to Acid Soils: The Molecular Basis for Crop Aluminum Resistance. Annu. Rev. Plant Biol. 2015, 66, 571–598. [Google Scholar] [CrossRef]
  36. Bano, C.; Amist, N.; Singh, N.B. Transporters Regulating Aluminum Uptake, Accumulation, and Toxicity in Plants; Elsevier Inc.: Amsterdam, The Netherlands, 2021. [Google Scholar] [CrossRef]
  37. Rao, N.K.S.; Shivashankara, K.S.; Laxman, R.H. Abiotic Stress Physiology of Horticultural Crops. In Abiotic Stress Physiology of Horticultural Crops; Springer: New Delhi, India, 2016; pp. 1–368. [Google Scholar] [CrossRef]
  38. Chen, L.S.; Yang, L.T.; Guo, P.; Jiang, H.X.; Tang, N. Aluminum Toxicity and Fruit Nutrition; Elsevier Inc.: Amsterdam, The Netherlands, 2020. [Google Scholar] [CrossRef]
  39. Neilsen, G.H.; Neilsen, D.; Atkinson, D. Top and Root Growth and Nutrient Absorption of Prunus avium L. at Two Soil PH and P Levels. Plant Soil 1990, 121, 137–144. [Google Scholar] [CrossRef]
  40. Borkowska, B. Experimental System for Investigations of Aluminium Toxicity in Fruit Trees. In Plant-Soil Interactions at Low pH; Kluwer Academic Publishers: Dordrecht, The Netherlands, 1991; pp. 999–1004. [Google Scholar] [CrossRef]
  41. Melakeberhan, H.; Bird, G.W.; Jones, A.L. Soil pH Affects Nutrient Balance in Cherry Rootstock Leaves. HortScience 2001, 36, 916–917. [Google Scholar] [CrossRef] [Green Version]
  42. Kottek, M.; Grieser, J.; Beck, C.; Rudolf, B.; Rubel, F. World Map of the Köppen-Geiger Climate Classification Updated. Meteorol. Z. 2006, 15, 259–263. [Google Scholar] [CrossRef]
  43. Soil Survey Staff. Soil Taxonomy: A Basic System of Soil Classification for Making and Interpreting Soil Surveys, 2nd ed.; US Department of Agriculture: Washington, DC, USA, 1999.
  44. Valle, S.R.; Carrasco, J.; Pinochet, D.; Calderini, D.F. Grain Yield, above-Ground and Root Biomass of Al-Tolerant and Al-Sensitive Wheat Cultivars under Different Soil Aluminum Concentrations at Field Conditions. Plant Soil 2009, 318, 299–310. [Google Scholar] [CrossRef]
  45. Bonomelli, C.; Artacho, P. Nitrogen Application to Non-Bearing “Bing” Sweet Cherry Trees on Gisela®6 Rootstock: Effects on Accumulation and Partitioning of Biomass and Nitrogen. Sci. Hortic. 2013, 162, 293–304. [Google Scholar] [CrossRef]
  46. Newman, E.I. A Method of Estimating the Total Length of Root in a Sample. J. Appl. Ecol. 1966, 3, 139–145. [Google Scholar] [CrossRef]
  47. Westwood, M.N. Temperate-Zone Pomology: Physiology and Culture, 3rd ed.; Timber Press: Portland, OR, USA, 1993. [Google Scholar]
  48. Pinochet, D.; Artacho, P.; Maraboli, A. Manual de Fertilización de Arándanos Cultivados En El Sur de Chile; Imprenta América: Valdivia, Chile, 2014. [Google Scholar]
  49. Poschenrieder, C.; Gunsé, B.; Corrales, I.; Barceló, J. A Glance into Aluminum Toxicity and Resistance in Plants. Sci. Total Environ. 2008, 400, 356–368. [Google Scholar] [CrossRef]
  50. Abdulaha-Al Baquy, M.; Li, J.Y.; Xu, C.Y.; Mehmood, K.; Xu, R.K. Determination of Critical pH and Al Concentration of Acidic Ultisols for Wheat and Canola Crops. Solid Earth 2017, 8, 149–159. [Google Scholar] [CrossRef] [Green Version]
  51. Martini, J.A.; Kochhann, R.A.; Siqueira, O.J.; Borkert, C.M. Response of Soybeans to Liming as Related to Soil Acidity, Al and Mn Toxicities, and P in Some Oxisols of Brazil. Soil Sci. Soc. Am. J. 1974, 38, 616–620. [Google Scholar] [CrossRef]
  52. Hirano, Y.; Mizoguchi, T.; Brunner, I. Root Parameters of Forest Trees as Sensitive Indicators of Acidifying Pollutants: A Review of Research of Japanese Forest Trees. J. For. Res. 2007, 12, 134–142. [Google Scholar] [CrossRef]
  53. Vogt, K.A.; Publicover, D.A.; Bloomfield, J.; Perez, J.M.; Vogt, D.J.; Silver, W.L. Belowground Responses as Indicators of Enviromental Change. Environ. Exp. Bot. 1993, 33, 189–205. [Google Scholar] [CrossRef]
  54. Foy, C.D. Physiological Effects of Hydrogen, Aluminum, and Manganese Toxicities in Acid Soil. Soil Acidity Liming 1984, 12, 57–97. [Google Scholar] [CrossRef]
  55. Azarenko, A.N.; Chozinski, A.; Brewer, L.J. Fruit Growth Curve Analysis of Seven Sweet Cherry Cultivars. Acta Horticult. 2008, 795, 561–565. [Google Scholar] [CrossRef]
  56. Signorelli, S.; Shaw, J.; Hermawaty, D.; Wang, Z.; Verboven, P.; Considine, J.A.; Considine, M.J. The Initiation of Bud Burst in Grapevine Features Dynamic Regulation of the Apoplastic Pore Size. J. Exp. Bot. 2020, 71, 719–729. [Google Scholar] [CrossRef] [PubMed]
  57. Rinne, P.L.H.; Welling, A.; Vahala, J.; Ripel, L.; Ruonala, R.; Kangasjärvi, J.; van der Schoot, C. Chilling of Dormant Buds Hyperinduces FLOWERING LOCUS T and Recruits GA-Inducible 1,3-β-Glucanases to Reopen Signal Conduits and Release Dormancy in Populus. Plant Cell 2011, 23, 130–146. [Google Scholar] [CrossRef] [PubMed] [Green Version]
  58. Beauvieux, R.; Wenden, B.; Dirlewanger, E. Bud Dormancy in Perennial Fruit Tree Species: A Pivotal Role for Oxidative Cues. Front. Plant Sci. 2018, 9, 1–13. [Google Scholar] [CrossRef] [PubMed]
  59. Choi, W.G.; Hilleary, R.; Swanson, S.J.; Kim, S.H.; Gilroy, S. Rapid, Long-Distance Electrical and Calcium Signaling in Plants. Annu. Rev. Plant Biol. 2016, 67, 287–307. [Google Scholar] [CrossRef] [PubMed]
  60. Roy, A.K.; Sharma, A.; Talukder, G. Some Aspects of Aluminum Toxicity in Plants. Bot. Rev. 1988, 54, 145–178. [Google Scholar] [CrossRef]
  61. Brunner, I.; Sperisen, C. Aluminum Exclusion and Aluminum Tolerance in Woody Plants. Front. Plant Sci. 2013, 4, 1–12. [Google Scholar] [CrossRef] [PubMed] [Green Version]
  62. Yang, L.T.; Jiang, H.X.; Tang, N.; Chen, L.S. Mechanisms of Aluminum-Tolerance in Two Species of Citrus: Secretion of Organic Acid Anions and Immobilization of Aluminum by Phosphorus in Roots. Plant Sci. 2011, 180, 521–530. [Google Scholar] [CrossRef]
  63. Jiménez, S.; Ollat, N.; Deborde, C.; Maucourt, M.; Rellán-Álvarez, R.; Moreno, M.Á.; Gogorcena, Y. Metabolic Response in Roots of Prunus Rootstocks Submitted to Iron Chlorosis. J. Plant Physiol. 2011, 168, 415–423. [Google Scholar] [CrossRef] [PubMed] [Green Version]
  64. Ferreira, L.; Antunez, L.E. Plant Growth and Organic Acids in Root Sap, Roots and Root Exudates of Prunus Rootstocks in the Function of Nitrogen Fertilization. Ciência Agrícola 2017, 15, 11–18. [Google Scholar]
  65. Edwards, J.H.; Horton, B.D. Aluminum-Induced Calcium Deficiency in Peach Seedlings. J. Am. Soc. Hortic. Sci. 1977, 102, 459–461. [Google Scholar]
  66. Reuter, D.; Robinson, J. Plant Analysis: An Interpretation Manual, 2nd ed.; Csiro Publishing: Collingwood, ON, Canada, 1997. [Google Scholar]
  67. Kar, D.; Pradhan, A.A.; Datta, S. The Role of Solute Transporters in Aluminum Toxicity and Tolerance. Physiol. Plant. 2021, 171, 638–652. [Google Scholar] [CrossRef] [PubMed]
  68. Lambers, H.; Plaxton, W.C. Phosphorus: Back to The Roots. In Phosphorus Metabolism in Plants; Wiley Blackwell: Chichester, UK, 2015; Volume 48, pp. 3–22. [Google Scholar] [CrossRef]
Figure 1. Schematic arrangement of the experimental units on the field.
Agronomy 11 01259 g001
Figure 2. Relationship between biomass accumulation in the whole tree and in individual organs of sweet cherry trees and exchangeable Al in a volcanic soil. Values are the means, with standard errors as vertical bars (n = 3). Significance of slopes: ** p < 0.01. In segmental regression, slope1 is the slope of the first line segment, slope2 is the slope of the second line segment, and X0 is the X value where the two line segments intersect.
Agronomy 11 01259 g002
Figure 3. Biomass partitioning in individual organs of sweet cherry trees growing with increasing concentrations of exchangeable Al in a volcanic soil. The vertical bars represent the standard errors (n = 3). Different small letters in the same organ indicate significant differences between treatments (Tukey’s test; p < 0.05).
Agronomy 11 01259 g003
Figure 4. Relationship between Al concentration (in dry weight) in the whole tree and in individual organs of sweet cherry trees and exchangeable Al in a volcanic soil. Values are the means, with standard errors as vertical bars (n = 3). Significance of slopes: ** p < 0.01. In segmental regression, slope1 is the slope of the first line segment, slope2 is the slope of the second line segment, and X0 is the X value where the two line segments intersect.
Agronomy 11 01259 g004
Figure 5. Relationship between Al content in the whole tree and in individual organs of sweet cherry trees and exchangeable Al in a volcanic soil. Values are the means, with standard errors as vertical bars (n = 3). Significance of slopes: * p < 0.05; ** p < 0.01. In segmental regression, slope1 is the slope of the first line segment, slope2 is the slope of the second line segment, and X0 is the X value where the two line segments intersect.
Agronomy 11 01259 g005
Figure 6. Al partitioning in individual organs of sweet cherry trees growing with increasing concentrations of exchangeable Al in a volcanic soil. The vertical bars represent standard errors (n = 3). Different small letters in the same organ indicate significant differences between treatments (Tukey’s test; p < 0.05).
Agronomy 11 01259 g006
Figure 7. Relationship between total N, P, K, Ca, and Mg contents in sweet cherry trees and exchangeable Al in a volcanic soil. Values are the means, with standard errors as vertical bars (n = 3). Significance of slopes: * p < 0.05; ** p < 0.01. In segmental regression, slope1 is the slope of the first line segment, slope2 is the slope of the second line segment, and X0 is the X value where the two line segments intersect.
Agronomy 11 01259 g007
Figure 8. Relationship between (A) Al concentration (in dry weight) in green leaves and (B) relative biomass production of sweet cherry trees and exchangeable Al in a volcanic soil during the second season after planting. Significance of slopes: ** p < 0.01. In segmental regression, slope1 is the slope of the first line segment, slope2 is the slope of the second line segment, and X0 is the X value where the two line segments intersect.
Agronomy 11 01259 g008
Table 1. Soil chemical characteristics of the treatments. The values are the means, with standard errors in parentheses (n = 6).
TreatmentpH Water
(1:2.5)
pH CaCl2
0.01 M
KCl-Exchangeable Al
(cmol kg−1)
Al Saturation
(%)
Al 15.82 (0.06)5.11 (0.06)0.12 (0.02)2.9 (0.5)
Al 25.31 (0.04)4.68 (0.02)0.40 (0.03)19.0 (0.8)
Al 35.17 (0.01)4.56 (0.02)0.60 (0.03)33.2 (1.9)
Al 44.64 (0.01)4.25 (0.01)1.24 (0.03)63.6 (1.0)
Table 2. Vegetative growth variables and fine-root length in sweet cherry trees growing in a volcanic soil with increasing concentrations of exchangeable Al. Values are the means, with standard errors in parentheses (n = 3).
Soil-Exchangeable Al
(cmol kg−1)
TCSA
Increment 1
(cm2 Tree−1)
Total
Shoot Length
(cm Tree−1)
Total
Leaf Area 2
(cm2 Tree−1)
Fine-Root
Length 2
(m Tree−1)
First season
0.124.24 (0.80) b48.5 (48.5)0.63 (0.05)997.3 (95.4) b
0.403.68 (0.21) ab53.3 (37.0)0.30 (0.10)628.3 (68.9) a
0.603.09 (0.10) ab27.3 (17.3)0.33 (0.05)612.0 (58.6) a
1.241.52 (0.09) a17.7 (17.7)0.38 (0.08)649.6 (48.3) a
p-Value0.046n.s.n.s0.009
Second season
0.128.99 (1.50) b519.2 (6.4) ab2.09 (0.09) ab1148.8 (72.8) b
0.408.84 (1.30) b704.7 (58.9) b2.61 (0.35) b487.0 (99.3) a
0.609.01 (0.62) b718.5 (41.0) b2.46 (0.23) ab536.0 (21.8) a
1.244.76 (0.39) a346.8 (21.8) a1.25 (0.13) a494.7 (30.4) a
p-Value0.0970.0920.0340.000
Different small letters indicate significant differences between treatments (Tukey’s test; p < 0.10); n.s., non-significant. 1 Calculated based on the difference between measurements at the beginning and end of each season. 2 Measurements from the destructive harvest of trees at the end of each season.
Publisher’s Note: MDPI stays neutral with regard to jurisdictional claims in published maps and institutional affiliations.

