Article

Impact of El Niño Southern Oscillation on Rainfall and Rice Production: A Micro-Level Analysis

by
Shilpa Cherian
1,
Shankarappa Sridhara
1,*,
Konapura Nagaraja Manoj
1,
Pradeep Gopakkali
1,
Nandini Ramesh
1,
Abdullah A. Alrajhi
2,*,
Ahmed Z. Dewidar
3,* and
Mohamed A. Mattar
4,5,*
1
Center for Climate Resilient Agriculture, University of Agricultural and Horticultural Sciences, Shivamogga 577204, Karnataka, India
2
King Abdulaziz City for Science and Technology (KACST), King Abdullah Road, Riyadh 11442, Saudi Arabia
3
Prince Sultan Bin Abdulaziz International Prize for Water Chair, Prince Sultan Institute for Environmental, Water and Desert Research, King Saud University, P. O. Box 2454, Riyadh 11451, Saudi Arabia
4
Department of Agricultural Engineering, College of Food and Agriculture Sciences, King Saud University, Riyadh 11451, Saudi Arabia
5
Agricultural Engineering Research Institute (AEnRI), Agricultural Research Centre, Giza 12618, Egypt
*
Authors to whom correspondence should be addressed.
Agronomy 2021, 11(6), 1021; https://doi.org/10.3390/agronomy11061021
Submission received: 19 April 2021 / Revised: 14 May 2021 / Accepted: 18 May 2021 / Published: 21 May 2021

Abstract

:
Monsoon fluctuation due to El Niño Southern Oscillation (ENSO) has a reflective influence on rice production, which is the major food grain crop in India. The impact of ENSO on the spatial variability of summer monsoon rainfall was analyzed from 1950 to 2018 and that on Kharif rice production for the period of 1998–2016. It was clear from the analysis that ENSO had varied influences on rainfall and rice production over different rice-growing districts of Karnataka. During El Niño (strong, moderate, and weak) years, southwest (S-W) monsoon rainfall was below normal in all the districts of Karnataka, wherein the highest negative deviation from normal was recorded in the Mysore district (−21.43%). In contrast, the rice production was higher in 15 districts out of 25, and the deviation from normal ranged from −39.73% in Bidar to 42.11% in Gulbarga district. During the La Niña (strong, moderate, and weak) years, S-W monsoon rainfall was above normal in 12 districts in which Bidar and Bengaluru urban districts have shown the highest positive deviation (19.93 and 19.82%, respectively). However, except for Udupi, Dakshina Kannada, Bidar, Davanagere, and Hassan districts, all the other major rice-growing districts have shown a positive deviation in rice production with the highest deviation of 62.39% in Tumkur district. Additionally, correlation coefficient values indicated the influence of southwest monsoon rainfall on Kharif rice production during El Niño years with a major contribution from September month rainfall. This kind of ENSO impact analysis on spatial rice production could be useful for formulating the farm-level site-specific management, planning, and policy decisions during ENSO periods in advance.

1. Introduction

Despite rapid industrialization in recent decades, India is primarily an agrarian country with a contribution of 17.8% to GDP [1]. Besides, agriculture is the primary source of income and livelihood for more than half of the Indian population. However, agriculture in India is gambling with uneven distribution of precipitation over time and space with higher dependency on southwest (S-W) monsoon, as it contributes nearly 75% of overall rainfall both in India and Karnataka. Thus, crop production in both India and Karnataka mainly relies on the amount of rainfall received during the S-W monsoon, also known as the summer monsoon, which accounts for the rainfall during June, July, August, and September months. Among the different crops, rice is one of the major food crops in India with a contribution of more than 40% to total food grain production and is grown across the country depending on the occurrence of the rainfall. Important rice-producing states in India are West Bengal, Uttar Pradesh, Punjab, Andhra Pradesh, Bihar, Tamil Nadu, Odisha, Chhattisgarh, Karnataka, Assam, and Kerala, which together hold 72% rice-growing area and contribute nearly 95% to the total rice production. It is generally grown during all the three seasons, viz., Kharif, rabi, and summer, in India with 84% rice production from Kharif-sown crop alone [2]. Similarly, in Karnataka, Kharif rice alone occupies 75% of the total rice growing area and contributes nearly 73% to the total rice production in the state [3]. Kharif rice crop is grown during the June to September months, which amounts to the S-W monsoon rainfall, and thereby, crop mainly depends on the precipitation and water availability in major rice-growing parts of the state as well as across the country. Thus, Kharif rice production is mainly affected by the onset of the S-W monsoon. The adverse effects of ENSO events are greater on rice crops, as it contributed a 48% decline in the food grain production during El Niño years and 35% increased production during La Niña years [4]. During El Niño events, improved mean soybean yield by 2.1 to 5.4% and variation in rice, maize, and wheat yields by −4.3 to +0.8% were also noticed globally [5]. A direct correlation between S-W monsoon rainfall and Kharif rice yield was reported in the earlier studies conducted by Webster et al. [6] and Prasanna [7].
The inter-annual variability of Indian monsoon rainfall profoundly influences the area and production of the different agricultural crops. Occurrences of droughts and floods associated with the inter-annual variability of Indian rainfall affect in the agriculture, water resources, and economic sectors. This variability is affected mainly under the influence of ENSO events. The occurrence of El Niño is generally associated with a weak monsoon (rainfall less than normal), and La Niña is associated with a strong monsoon (rainfall more than normal) [8]. El Niño and the Indian summer monsoon are inversely related. Among the most prominent droughts in India, six of them since 1871 have been El Niño droughts, including the recent ones in 2002 and 2009. La Niña events are associated with abnormal rainfall, which have often resulted in floods in India. Northeast Monsoon rainfall tends to be higher during El Niño events and lower than normal during La Niña events [9].
Many researchers have made efforts to examine and understand the occurrence of seasonal rainfall at all India levels in relation to large-scale atmospheric and oceanic circulation features [10,11,12]. In the recent past, the relationship between ENSO and the Indian summer monsoon has been weakening [13]. At the same time, northeast (N-E) monsoon is greatly influenced by ENSO events. Shukla [14] and Gregory [15] also opinioned that instead of considering India as a single unit, analysis of local and regional level distribution characteristics of seasonal as well as annual rainfall will also help to divide the country into homogeneous regions that will help in better attainment of forecasting results. The impact of El Niño on rainfall distribution and its subsequent implications on crop production and productivity at the state and district level is very meager. At this juncture, the impact of ENSO events (El Niño and La Niña) on seasonal rainfall distribution and its aggregated implications on crop acreage, production, and productivity of Karnataka state as a whole and also at the district level have been investigated and are presented in this study.

2. Data and Methodology

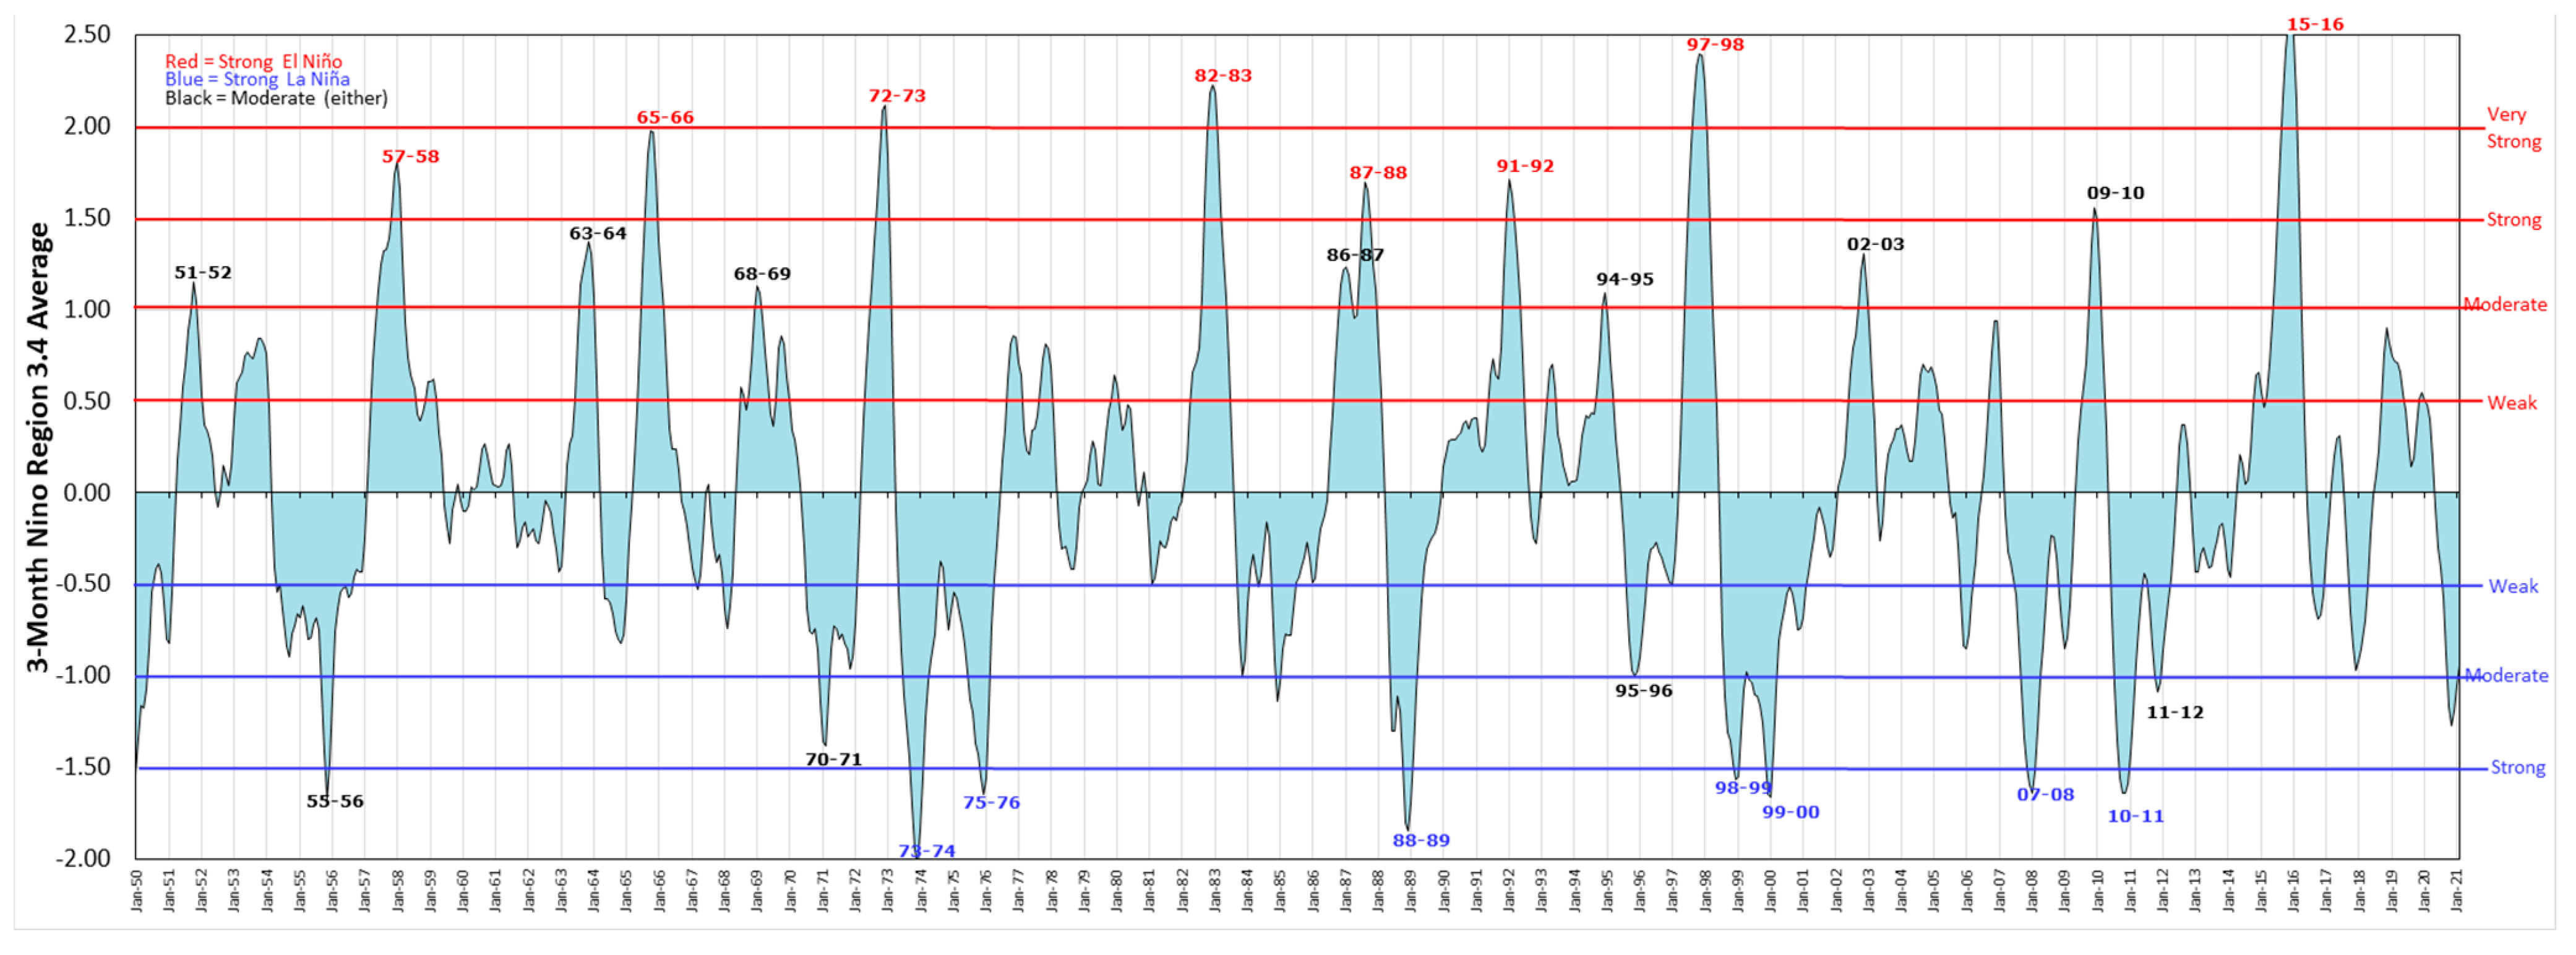
2.1. ENSO Identification

Information on ENSO was collected from the Australian Bureau of Meteorology, which is a globally recognized institute that monitors and disseminates ENSO events globally. The Oceanic Niño Index (ONI) has become the accepted criteria that the National Oceanic and Atmospheric Administration (NOAA) uses for identifying El Niño (warm) and La Niña (cool) events in the tropical Pacific (Figure 1). It is the running 3-month mean SST anomaly for the Niño 3.4 region (i.e., 5° N–5° S, 120°–170° W). Events are defined as five consecutive months at or above the +0.5 °C anomaly for warm (El Niño) events and at or below the −0.5 °C anomaly for cold (La Niña) events. The threshold is further broken down into weak (with a 0.5 to <1.0 SST anomaly), moderate (1.0 to <1.5), and strong (≥1.5) events [16].

2.2. Classification of ENSO Events

In this study, for an event to be categorized as weak, moderate, or strong, it must have equaled or exceeded the threshold for at least three months. Accordingly, the El Niño years were classified during the study period (Table 1). During the study year 1950 to 2018, there were eleven weak El Niño events, seven moderate El Niño events, and eight strong El Niño events. Simultaneously, there were eleven weak La Niña events, four moderate La Niña events, and seven strong La Niña events during the years 1950 to 2018 (Table 2). The mean rainfall for different El Niño years, La Niña years, and years with normal rainfall for each district was deduced by averaging the corresponding rainfall data.

2.3. Rainfall Data

The district-wise monthly rainfall data for 27 districts of Karnataka were recorded during the years 1950–2018 and collected from Karnataka State Natural Disaster Monitoring Centre (KSNDMC). The districts Chikkaballapura and Ramanagara were created in 2007 and Yadgir in the year 2009; therefore, these three districts have been excluded in this study. The rainfall totals for the different seasons, viz., S-W monsoon (June–September) and N-E monsoon, were aggregated district-wise for all the state districts.

2.4. Rice Production Data

Homogenous data on area, production, and productivity of Kharif rice in 27 districts of Karnataka from 1998 to 2018 were obtained from the Department of Agriculture Cooperation and Farmers Welfare (https://agricoop.nic.in accessed on 28 February 2020). Since long-term data are not readily available for districts, Chikkaballapura, Ramanagara, and Yadgir, which were recently created, have been excluded from the study.

2.5. Analysis

The percent change in seasonal as well as yearly rainfall during the weak, moderate, and strong El Niño and La Niña years was computed for the different districts of the state by comparing with normal rainfall. Similarly, the percent change in area harvested, production, and yield of Kharif rice was computed and interpreted. However, the percent change is not calculated for Bagalkote and Vijayapura districts, since rice is not grown extensively in these districts. Later, the mean percent change was also calculated for the four meteorological regions of Karnataka, viz., Coastal Karnataka, Malnad region, South Interior Karnataka, and North Interior Karnataka region.
Impacts of S-W monsoon on Kharif rice yield over Karnataka have been studied by computing correlation between S-W Monsoon rainfall and detrended Kharif rice yield using SPSS V.20 software developed by IBM Corp. Armonk, New York. The statistical significance of correlation coefficients was tested at p = 0.05 and p = 0.01 level of significance. Later, the correlation values were spatially interpolated by using inverse distance weighting (IDW) methods using QGIS 3.0 software, OSGeo Foundation, Beaverton, Oregon, United States. The spatial interpolation map was clipped by overlaying the geo-referenced state map of Karnataka.
For each ENSO phase, percent deviation of seasonal rainfall and rice yield were calculated and tested for significant differences by applying the Kruskal–Wallis (KW) H test. The KW H test is the non-parametric alternative to the one-way ANOVA. The H test is used when the ANOVA assumptions are no met (such as the assumption of normality). The KW H test was employed using SPSS V.20 software to assess the significance of deviation and is applied to test the null hypothesis that all the samples are drawn from an identical population. The KW H test is used for the entire data to test whether at least one ENSO phase group has a different value from those of other ENSO phase groups [17].

3. Results

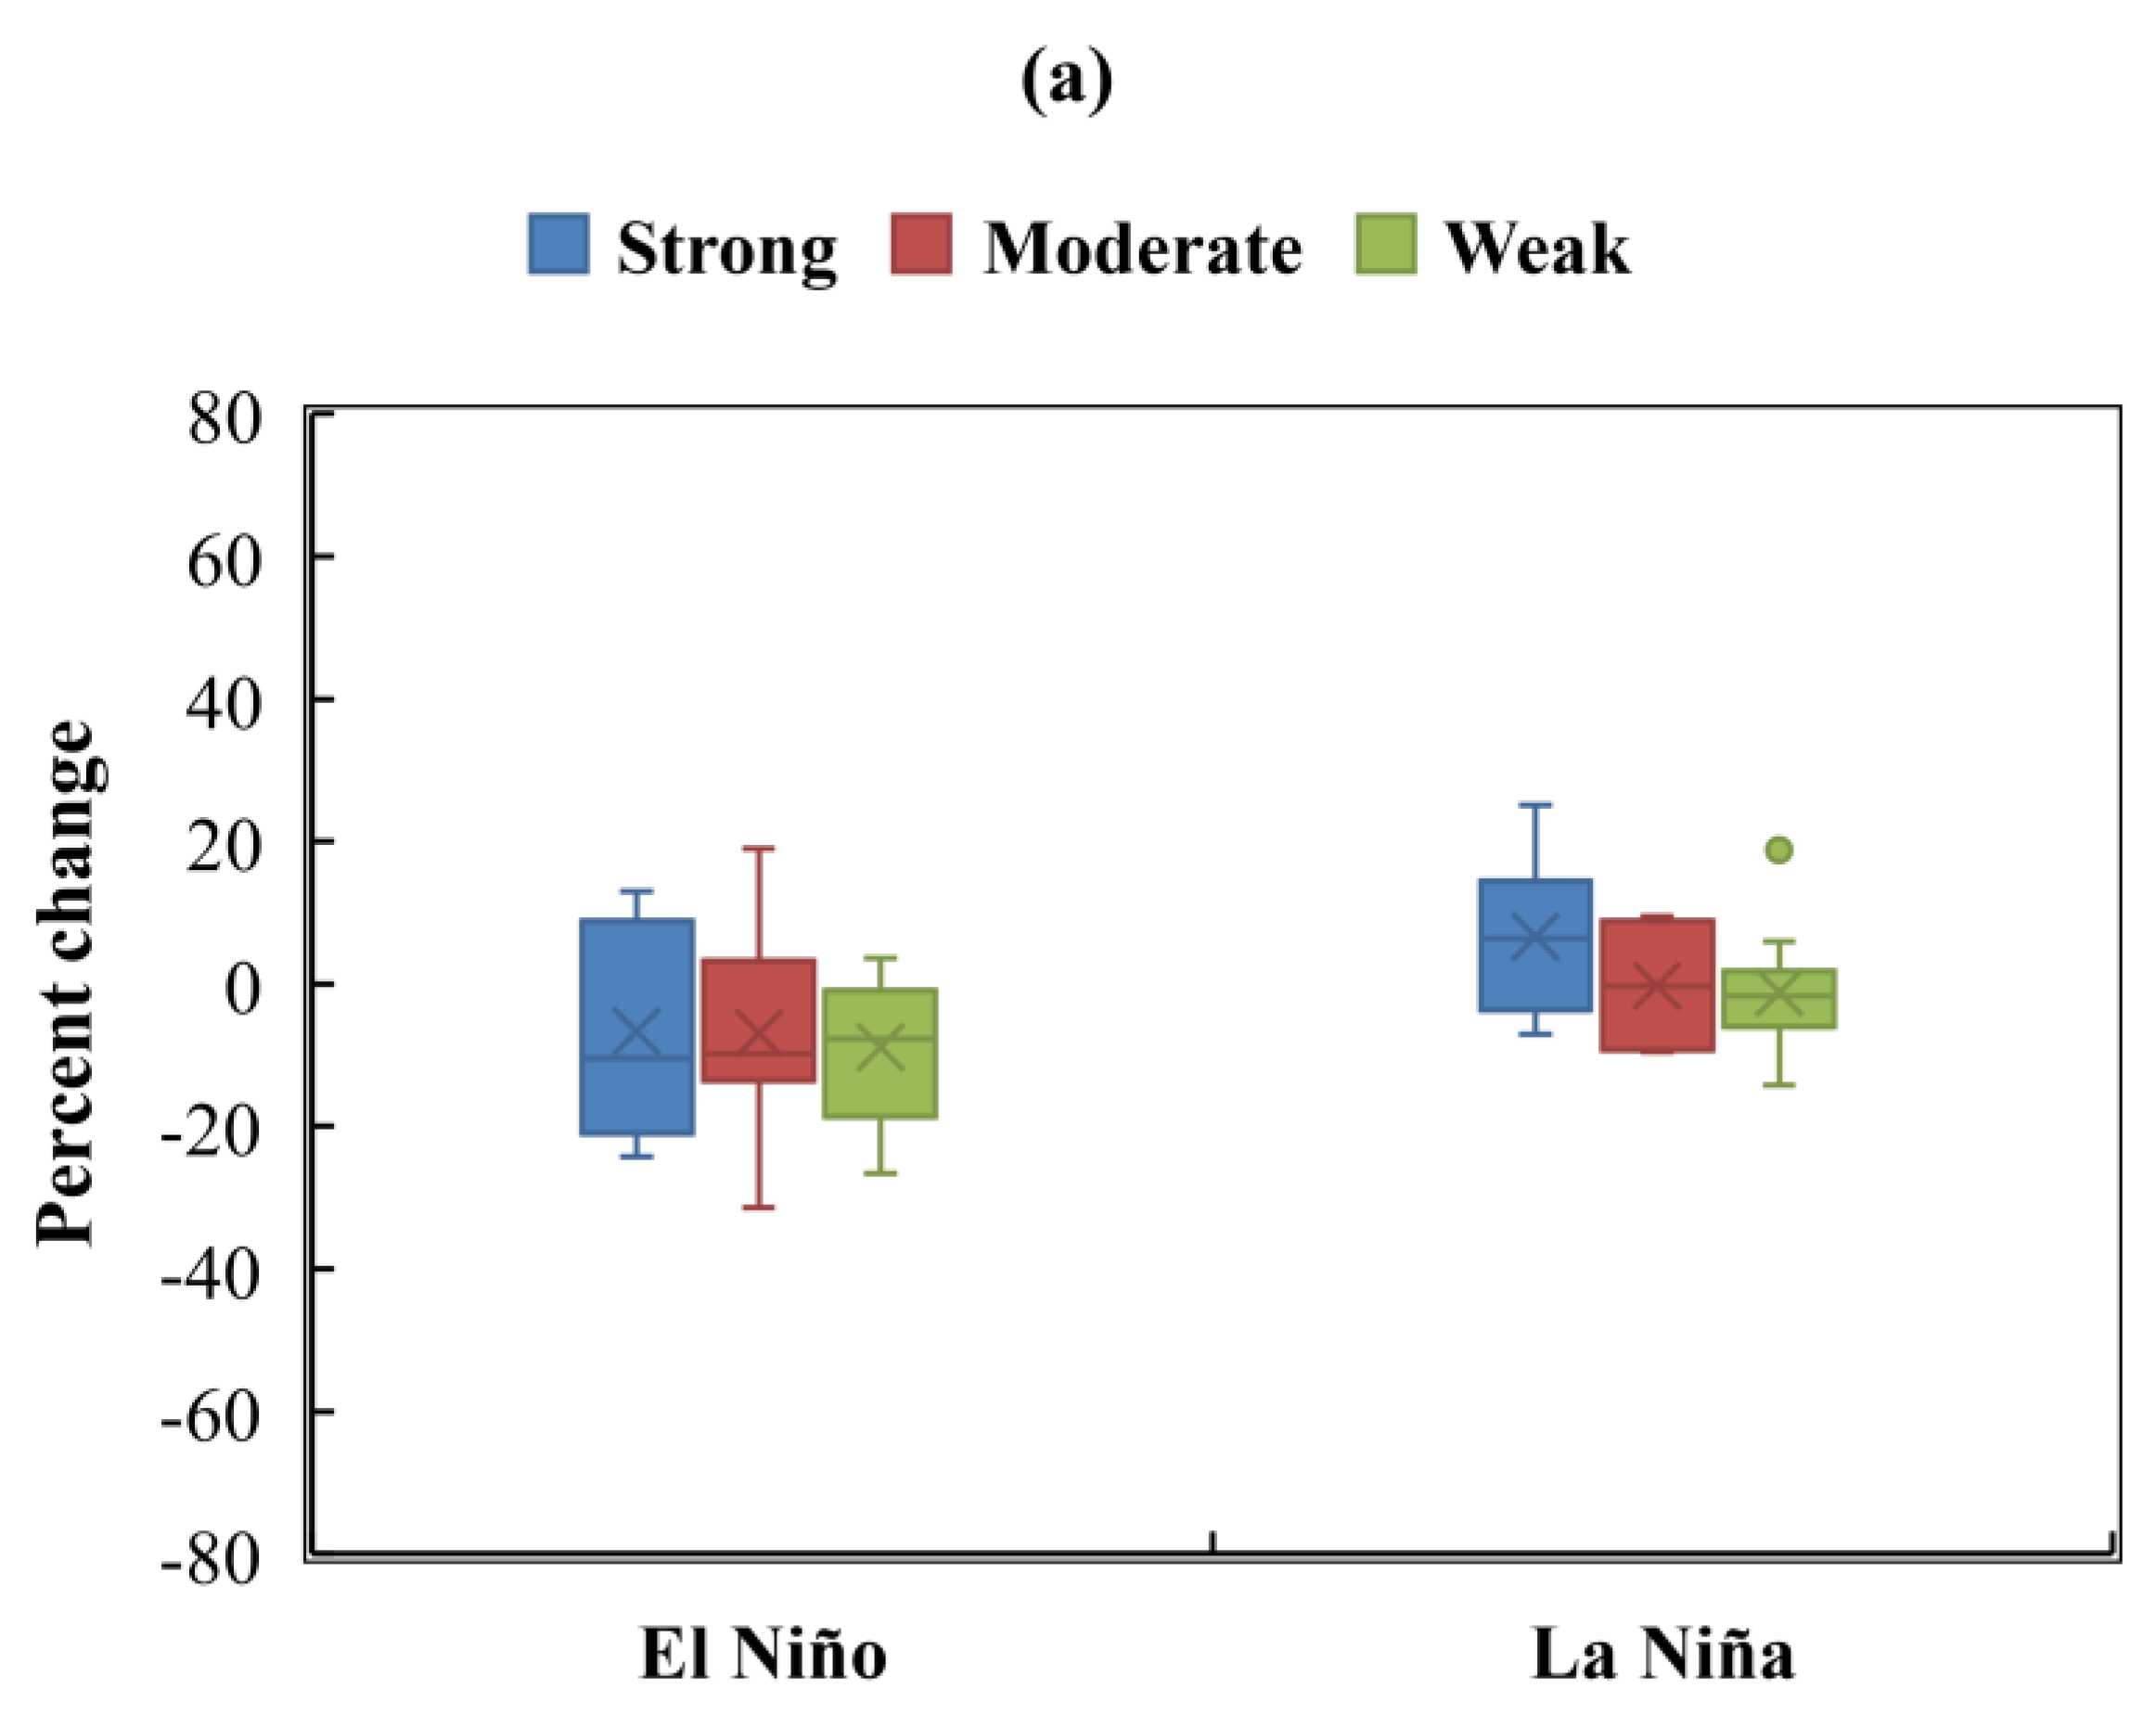
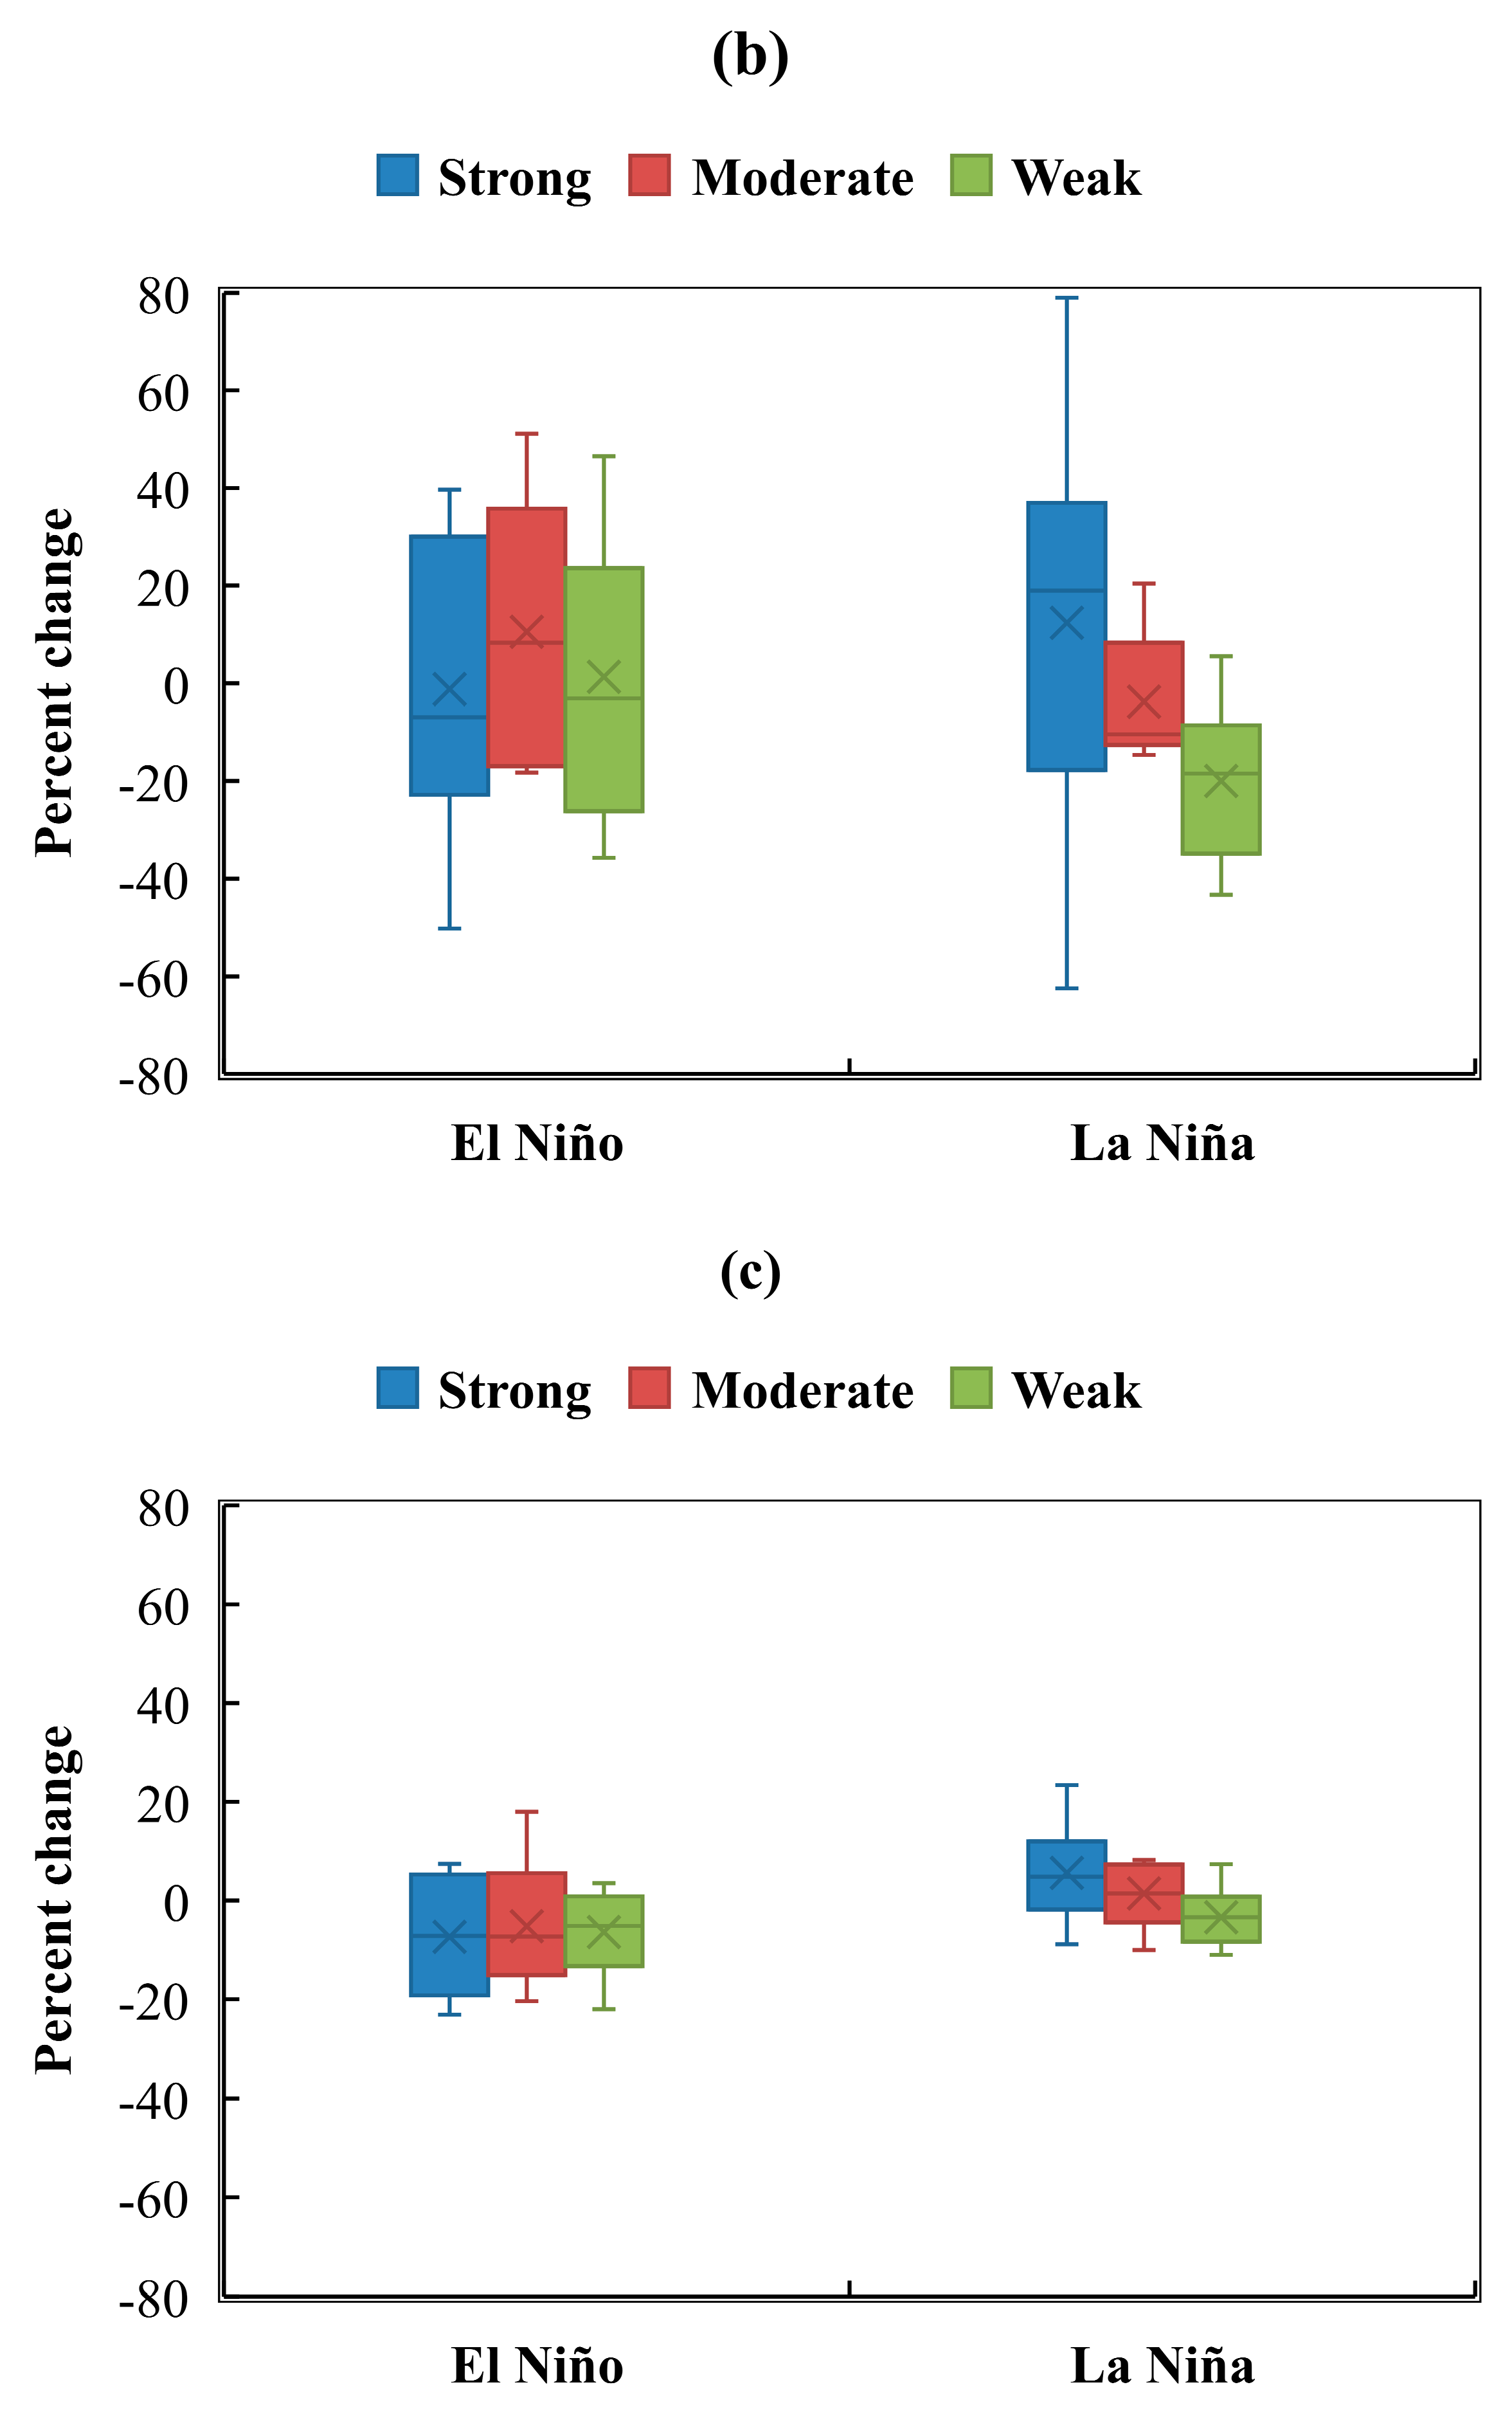
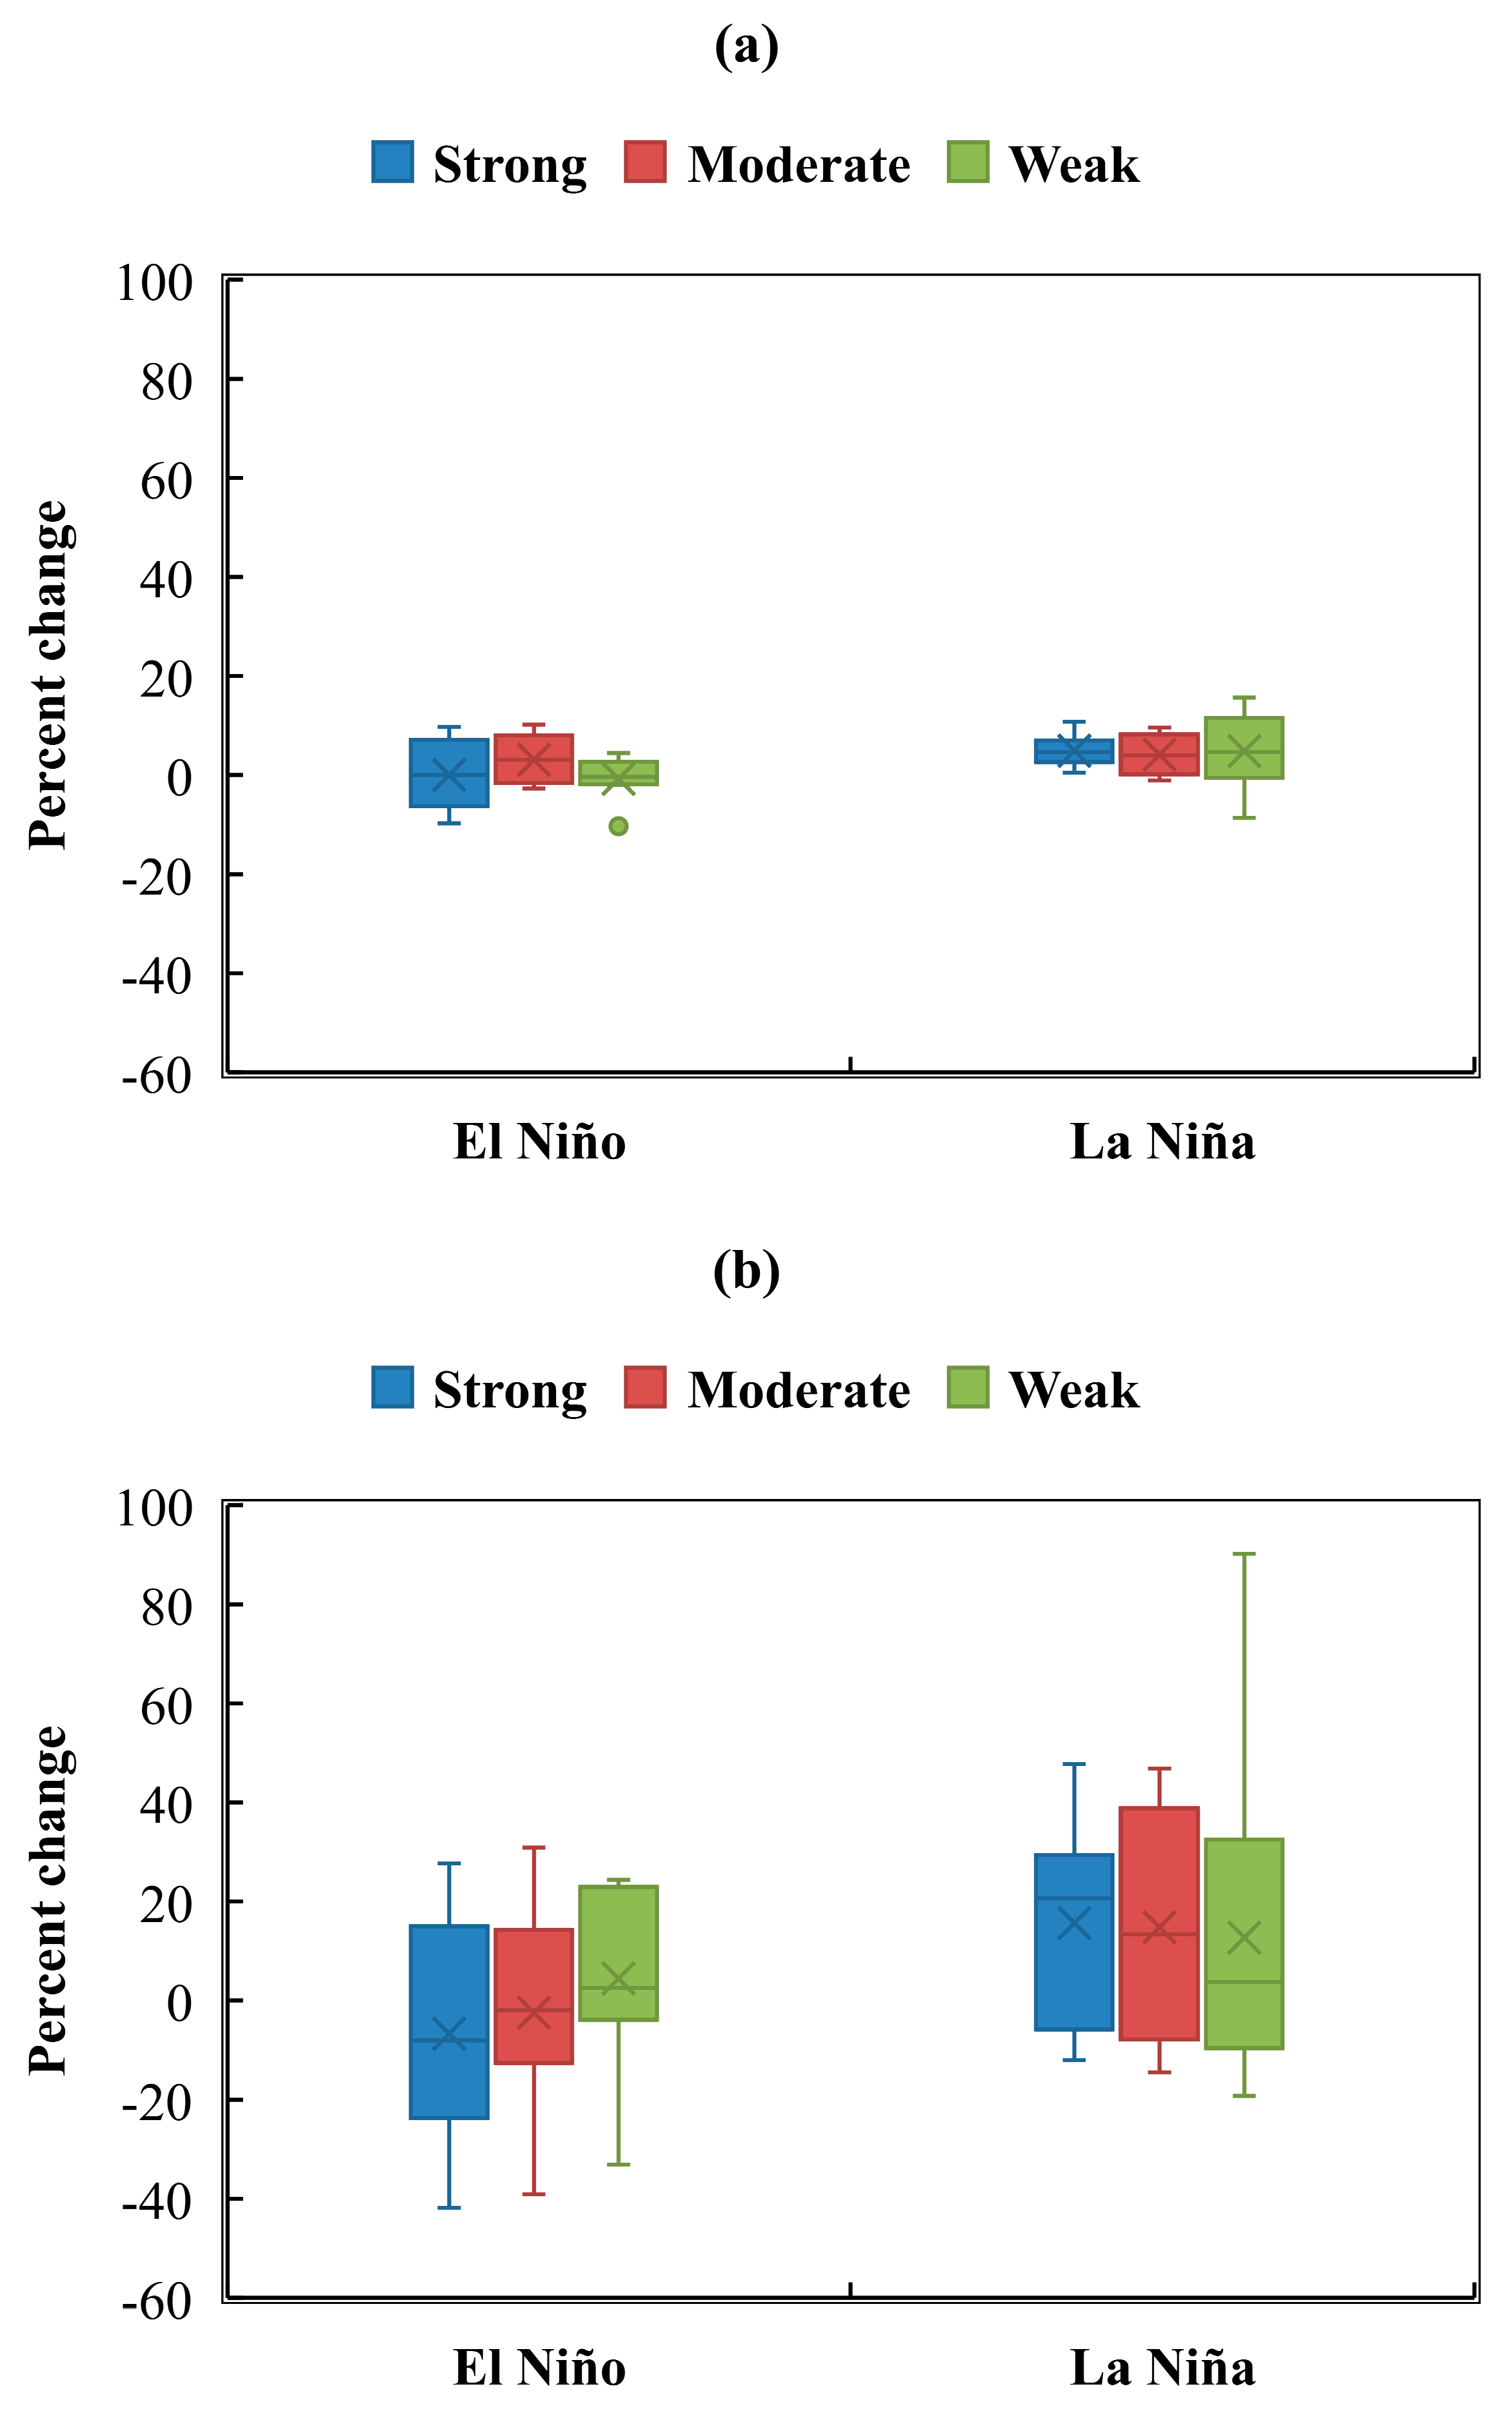
3.1. The Percent Change in Seasonal and Annual Rainfall during El Niño Years

The percent anomaly in the seasonal and annual rainfall during El Niño years compared to normal years (1950–2018) across different districts of Karnataka is tabulated in Table 3. The average S-W monsoon rainfall during strong El Niño years was less than the normal rainfall in all the districts of Karnataka, with an anomaly range of −5.46% in Gadag to −19.89% in Kolar. Among the different regions, the El Niño effect was more pronounced in the Malnad region with a −13.72% deviation followed by −13.52% in South Interior Karnataka. However, only the South Interior Karnataka region was pronounced with above normal N-E monsoon rainfall during strong El Niño years with an anomaly of 8.09%, while it was found below the normal rainfall during the rest of the regions. The deviation in the N-E monsoon rainfall across the districts ranged from 17.32% in Chamarajanagara district to −20.86% in Uttara Kannada district. During strong El Niño years, the average annual rainfall showed negative departure across all the districts of Karnataka (−1.16% in Bangalore Rural to −15.12% in Uttara Kannada district) except Bangalore Urban district, which showed positive deviation by 1.51%. Among the different regions, the higher anomaly of annual rainfall was experienced by Coastal Karnataka (−13.27%).
The average S-W monsoon rainfall during moderate El Niño years was less than the normal rainfall in all the districts of Karnataka barring Bagalkote, Vijayapura, Koppal, Raichur, and Bangalore Urban districts, and the deviation ranged from −17.72% in Mysore to 5.01% in Koppal. Across the regions, the more pronounced effect was noticed in the Malnad region (deviation by −11.51%) followed by South Interior Karnataka (deviation by −8.99%). The average N-E monsoon rainfall during moderate El Niño years was found to be more than normal in North Interior Karnataka (+18.05%) and Coastal Karnataka (+8.88%), while it was found to be below normal rainfall by 12.68 and 2.45% in South Interior Karnataka and Malnad region, respectively. Raichur district of North Interior Karnataka has received 64.65% more rainfall than the normal N-E monsoon rainfall. Similarly, Bijapura and Gulbarga districts of the same region have also received the above normal N-E monsoon rainfall by 22.24 and 23.83%, respectively. However, Bangalore Rural (−21.08%) and Kolar districts (−20.18%) have pronounced a higher deficit of N-E monsoon rainfall. With respect to annual rainfall, all four regions of the state witnessed the negative departure of rainfall during moderate El Niño years than normal, and the range was −9.96% in the Malnad region to −1.42% in North Interior Karnataka. Among the districts, the Raichur district of North Interior Karnataka has received 16.23% more rainfall than normal, while in contrast to this, Hassan district of Malnad region experienced a deficit of annual rainfall by 15.18%.
During weak El Niño years, average S-W monsoon rainfall showed negative departure in all the four regions of the state. The deviation was ranged from –16.43% in South Interior Karnataka to −4.58% in the Malnad region. However, the more negative anomaly of −31.69 and −26.47% was witnessed with the Mysore and Mandya districts of South Interior Karnataka. Similar to the S-W monsoon, N-E monsoon rainfall was also found less than normal at all four meteorological subdivisions with an anomaly percent of −14.89 in North Interior Karnataka. Additionally, a more pronounced negative departure of rainfall was witnessed in the Bidar (−30.06%) and Raichur (−28.06%) districts of North Interior Karnataka. On the contrary, only Tumkur, Bangalore Rural, and Bangalore Urban districts of South Interior Karnataka have witnessed the above normal N-E monsoon rainfall with an anomaly of 5.94, 9.53, and 4.26%, respectively. Even with annual rainfall, all the state regions were witnessed with the negative departure of the normal rainfall and ranged from −11.16% in North Interior Karnataka to −2.84% in Malnad region. Among the districts, it ranged from −24.04% in Mysore to 8.07% in the Kodagu district.

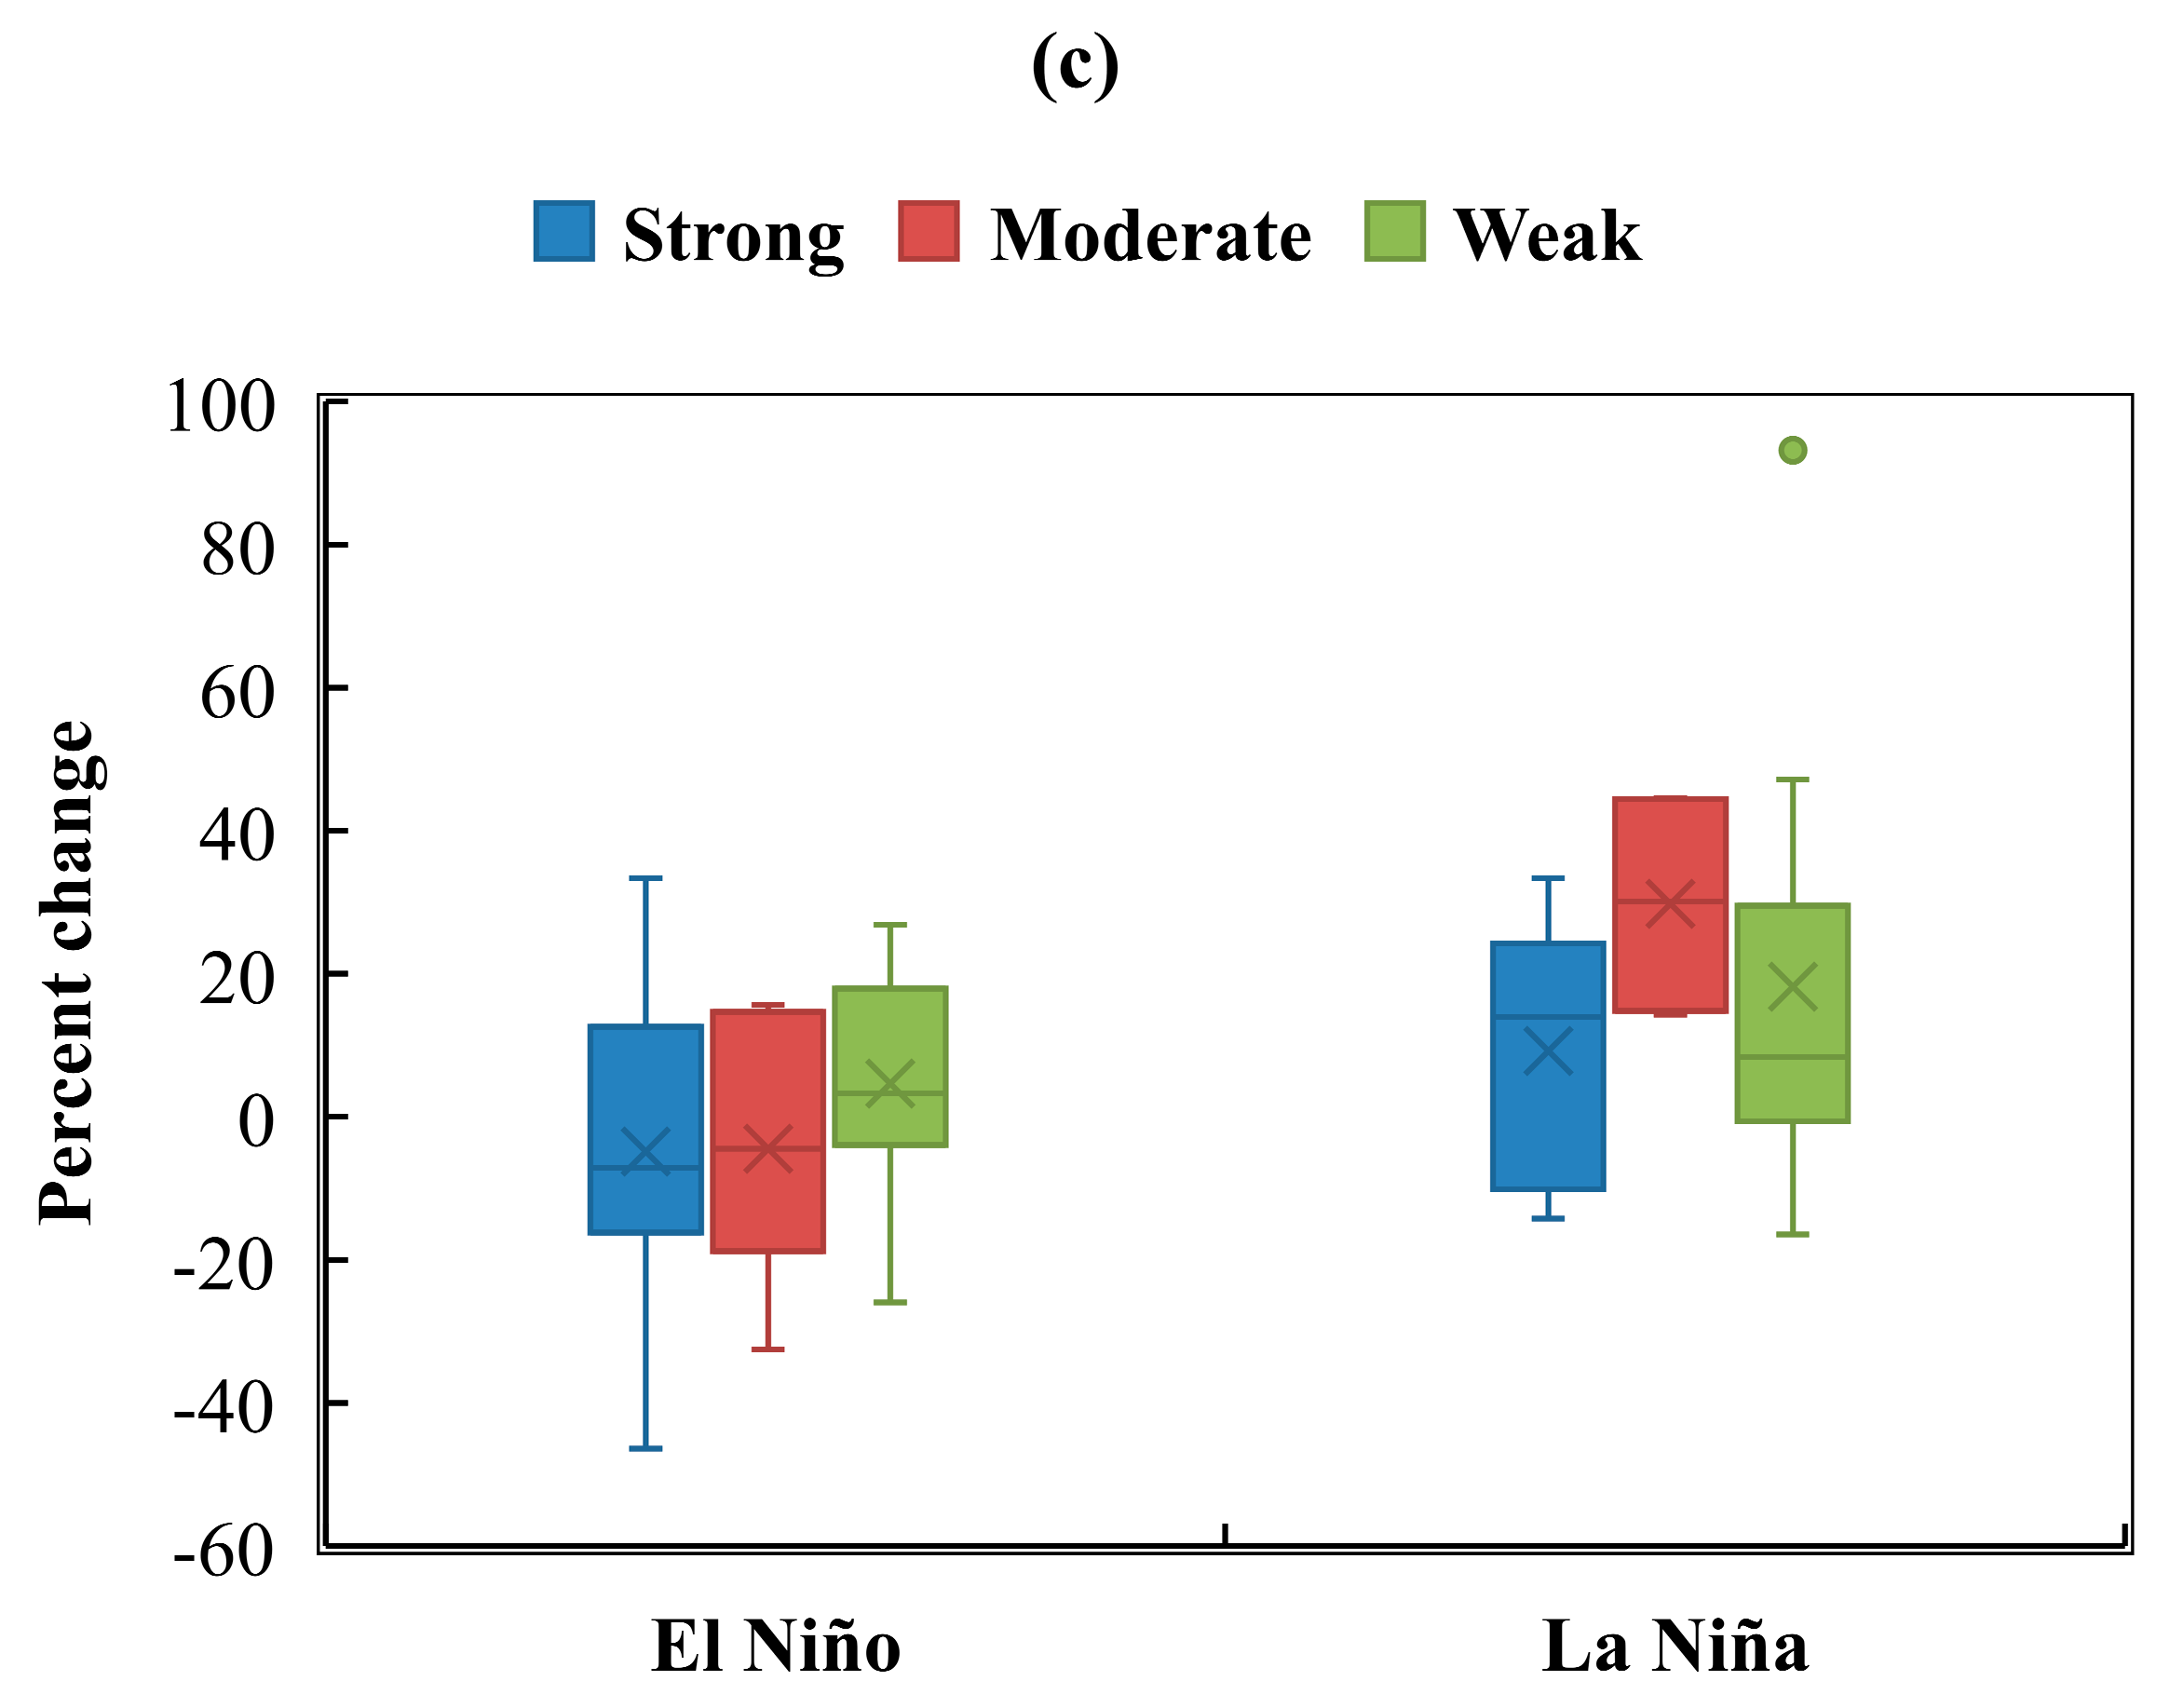
3.2. The Percent Change in Seasonal and Annual Rainfall during La Niña Years

During La Niña years across the different districts of Karnataka, the percent anomaly in the seasonal and annual rainfall compared to normal years (1950–2018) is depicted in Table 4. During the strong La Niña years, all the four meteorological divisions received higher S-W monsoon rainfall than normal. The impact was more pronounced in the South Interior Karnataka (15.55%). However, among the different districts, the highest negative and positive deviation of S-W monsoon by 11.07 and 30.49% was experienced by the Dharwad and Bangalore Urban districts, respectively. With respect to N-E monsoon rainfall, all the regions were pronounced above normal rainfall except in the Malnad region. The deviation in the N-E monsoon rainfall among the districts varied from −10.51% in the Chikkamagaluru district of Malnad region to 16.34% in the Udupi district of Coastal Karnataka. The above normal annual rainfall experienced all the four meteorological subdivisions of Karnataka with a more pronounced impact in South Interior Karnataka (10.84%). Similar to S-W monsoon rainfall, the anomaly of average annual rainfall ranged from −12.89% in Dharwad district to 20.47% in Bangalore Urban.
All the regions of Karnataka showed a negative departure of S-W monsoon rainfall during moderate La Niña years except in Coastal Karnataka. The more pronounced negative departure was witnessed in Hassan district (−33.05%) of Malnad region and Mysore district (−32.66%) of South Interior Karnataka, while higher positive deviation was noticed in Bidar (+29.72%) and Gulbarga (+20.93%) districts of North Interior Karnataka. The N-E monsoon rainfall was also negatively deviated from the normal rainfall in all the four regions of Karnataka and ranged from −7.74% in Coastal Karnataka to −1.25% in South Interior Karnataka. However, both the highest positive and negative deviation in the normal N-E monsoon rainfall was witnessed in the Belgaum (+26.64%) and Bidar (−27.84%) districts of the North Interior Karnataka. The deviation in the annual rainfall during moderate La Niña years followed a similar trend as that of the S-W monsoon rainfall deviation. It ranged from −24.02% in Hassan district of Malnad region to +18.02 percent in Bidar district of North Interior Karnataka.
During the weak La Niña years, except South Interior Karnataka, all the other meteorological subdivisions witnessed the negative deviation of S-W monsoon rainfall. The more pronounced impact of weak La Niña years on S-W monsoon rainfall was noticed with Bangalore Urban district (+26.71%) of South Interior Karnataka and Dharwad district (−18.39%) of North Interior Karnataka. The N-E monsoon rainfall was also negatively deviated from the normal rainfall in all the four meteorological regions of Karnataka and different districts (−33.64 to −1.47%) of the state excluding Kolar and Bangalore Urban districts, where slight positive deviations of 1.64 and 1.60%, respectively, were shown. During the weak La Niña years, annual rainfall was also negatively deviated from the normal rainfall in all the regions, and the tune of deviation was higher in Coastal Karnataka (−9.63%). In comparison, it was lower in South Interior Karnataka (−2.18%). Among various districts, similar to S-W monsoon rainfall, Bangalore Urban (+15.75%) in South Interior Karnataka and Dharwad (−18.17%) in North Interior Karnataka witnessed the extremities of deviation.

3.3. Impact of ENSO Events on the Rainfall of Karnataka State (1951–2014)

Karnataka state that the S-W monsoon and yearly rainfall were less than normal with an anomaly range of −6.69 to −10.66% and −6.66 to −10.29% under moderate to weak El Niño years, respectively. However, N-E monsoon rainfall was above normal during moderate El Niño years with a percent anomaly of 12.76, but it was less than normal during strong and weak El Niño years (−10.02 and −7.42%, respectively) (Figure 2). Under the La Niña phase of ENSO, S-W monsoon rainfall was above normal during moderate and strong La Niña events by 2.14 and 3.83%, respectively, while it was lower by 4.44% during weak La Niña events. Similarly, N-E monsoon rainfall was higher than normal during strong La Niña events by 6.17%, while it was lower under moderate and weak La Niña events by 4.15 and 35.70%, respectively. During S-W monsoon, the state’s annual rainfall was above normal during moderate (2.56%) and strong (2.05%) La Niña events. In comparison, it was lower during weak La Niña events by 7.59%. Irrespective of the El Niño and La Niña phases of ENSO, the highest anomaly (−35.70%) in the rainfall was noticed with the N-E monsoon under the La Niña phase.

3.4. Impact of ENSO Events on Area, Production, and Productivity of Kharif Rice

The data on percent change in the area, production, and productivity of Kharif rice during strong, moderate, and weak El Niño years are presented in Figure 2. During the strong and moderate El Niño years, the highest reduction in the area (–8.14%) and production (−9.07%) of Kharif rice were witnessed in South Interior Karnataka; however, the highest reduction in productivity (−12.39%) was witnessed in North Interior Karnataka. The area and production under Kharif rice in Bidar, Kolar, and Bangalore Rural districts were decreased by nearly 22, 36, and 43% and 37, 46, and 39%, respectively. In contrast, the Gulbarga district of North Interior Karnataka showed approximately a 57% increase in area and a 58% increase in the production of Kharif rice. The highest deviation was witnessed in the Belgaum (−38.32%) and Bangalore Rural districts (+12.57%) concerning productivity. During the weak El Niño years, North Interior Karnataka (−3.81%) and Coastal Karnataka (−0.58%) regions witnessed a slight decrease in the area under Kharif rice. However, all the areas of Karnataka showed above the normal production as well as productivity of Kharif rice with the highest in North Interior Karnataka (17.88 and 21.14%, respectively). Among the districts, the highest negative departure from the normal Kharif rice area was witnessed in Dharwad (−22.35%), Bidar (−19.83%), and Haveri districts (−17.90%). In Dharwad and Haveri districts, the highest positive departure from normal production (67.9 and 48.76%) and productivity (95.35 and 70.42%) of Kharif rice was witnessed even with the decreased area under Kharif rice.
During La Niña years, the increase in area, production, and productivity of the Kharif rice was witnessed in all the four meteorological subdivisions except Coastal Karnataka region, particularly with respect to productivity (Table 5). However, increase in area (30.06%) and production (37.28%) was noticed in South Interior Karnataka, while increased productivity was found in North Interior Karnataka (8.36%) and Malnad region (8.14%). Except for Davanagere, Koppal, and Gadag districts, all the state districts showed positive departure in the area of Kharif rice cultivation. Similarly, Davanagere, Gadag, Udupi, and Dakshina Kannada were marked with increased Kharif rice production. However, Tumkur, Kolar, Bangalore Urban, and Chitradurga districts of South Interior Karnataka showed a tremendous increase in the area (56.91, 52.36, 40.10, and 39.75%, respectively) and production (69.08, 51.03, 63.86, and 60.49%, respectively) of Kharif rice. The highest deviation in productivity was 46.28 and 37.64% in Belagavi and Haveri districts of North Interior Karnataka, respectively. During the weak La Niña years, all other meteorological divisions had a marked increase in the Kharif rice area and production barring Malnad region with the highest increase in South Interior Karnataka (19.12 and 20.35%) followed by North Interior Karnataka (6.99 and 20.02%). Tumkur and Bangalore Rural districts of South Interior Karnataka showed a marked hike in the area harvested to the tune of more than 44% as well as Gulbarga district of North Interior Karnataka to the tune of more than 45%. Similarly, Belagavi, Gadag, and Haveri districts of North Interior Karnataka had marked an increase in production to the tune of more than 35%, while it was more than 40% increase for Tumkur, Bangalore Rural, and Chitradurga districts of South Interior Karnataka. With respect to productivity, North Interior Karnataka witnessed the increased productivity of Kharif rice by 14.48%; however, South Interior Karnataka and Malnad region witnessed a slight negative deviation of normal productivity. Among the districts, Belagavi and Haveri of North Interior Karnataka marked an increase in productivity to the tune of 35.10 and 43.31%, respectively.

4. Discussion

4.1. Impact of ENSO Events on the Rainfall of Karnataka State

The study on variability of rainfall in Karnataka and their association with El Niño Southern Oscillation has shown that during El Niño years (strong, moderate, and weak), the majority of districts as well as Karnataka state as a whole received less than the normal S-W monsoon rainfall. The reduction in rainfall during El Niño events contributes to more heating of water along the eastern coast of South America, increasing the sea surface temperatures above normal by 0.5 °C and leads to diversion of the moist wind flow from the Indian Ocean towards the eastern coast of South America. These results corroborate the findings of Mooley and Parthasarathy [18], who studied the S-W monsoon at an all-India level. The Indian monsoon rainfall was mainly below normal over most parts of the country during 22 El Niño years. The association between El Niño and deficient rainfall or drought was statistically significant over the west of longitude 80° E and north of 12° N. Many areas of India suffered considerable rainfall deficiencies and severe drought during the five-strong El Niño year’s, viz., 1877, 1899, 1911, 1918, and 1972 [19]. It was observed that particularly during strong La Niña years, S-W monsoon rainfall was found to be above normal in the majority of districts as well as Karnataka state as a whole. Similar results at the country level were also reported by Kripalani and Kulkarni [20]. As the La Niña event develops, there will be more accumulation of cold water in the eastern equatorial Pacific Ocean, resulting in strong trade winds blowing towards the Indian sub-continent, resulting in a heavy downpour in India. The decreasing trend of S-W monsoon rainfall by −11.8% and annual rainfall by −6.7% during 1974–2009 in Karnataka state was also revealed by the Subash and Gangwar [21]. El Niño years resulted below normal S-W monsoon rainfall in coastal Andhra Pradesh and Rayalaseema regions with a deficit range of −55.9 to −5.4% in different districts of Andhra Pradesh [22]. The warm phase of ENSO declined the S-W monsoon rainfall by 14%, and in contrast, the cold phase of ENSO increased the S-W monsoon rainfall by 9% in India [4].
During moderate El Niño years, the N-E monsoon rainfall was above normal and above normal and below normal during strong and weak El Niño years in Karnataka state. The studies made by Zubair and Ropelewski [23] also indicated that the rainfall over South Interior Karnataka, Rayalaseema, and Coastal Andhra Pradesh, which lies on the windward side of the Western Ghats mountain range, shows a relatively enhanced correlation with ENSO. This regional rise might be attributed to a slight enhancement of the low-level circulation in recent decades during the N-E monsoon, leading to a relative increase in the orographic component of rainfall. De and Mukhopadhyay [24] also revealed that the tracks of low-pressure systems in the Bay of Bengal during the ENSO years are more westerly than those during anti-ENSO years. Thus, during El Niño years, the number of low-pressure systems affecting the Tamil Nadu and Andhra Pradesh coasts is higher than that during La Niña years. The low-pressure systems have a higher tendency to recurve. During the La Niña years, the surface wind anomalies in the Indian Ocean are westerly, indicating weaker than normal N-E monsoon circulation [25]. These factors may contribute to higher rainfall than normal over the southeastern peninsular region of India during El Niño years and lower during La Niña years. Rajeevan et al. [26] also reported that the N-E monsoon rainfall performance during the period 2001–2010 was not as anticipated by the canonical relationship between ENSO and N-E monsoon rainfall.
In the present study, S-W monsoon during different ENSO phases such as El Niño, La Niña, and neutral was subjected to KW H test, which indicated that the distribution pattern of S-W monsoon across ENSO phases was significantly different in the case of Raichur, Gulbarga, Bidar, Kolar, Bangalore Rural, and Bangalore Urban with a corresponding H statistic of 9.26, 9.80, 16.60, 14.38, 10.02, and 10.93, respectively (Table 6). In the rest of the cases, the distribution pattern remained the same, signaling that all three phases follow the same distribution pattern.

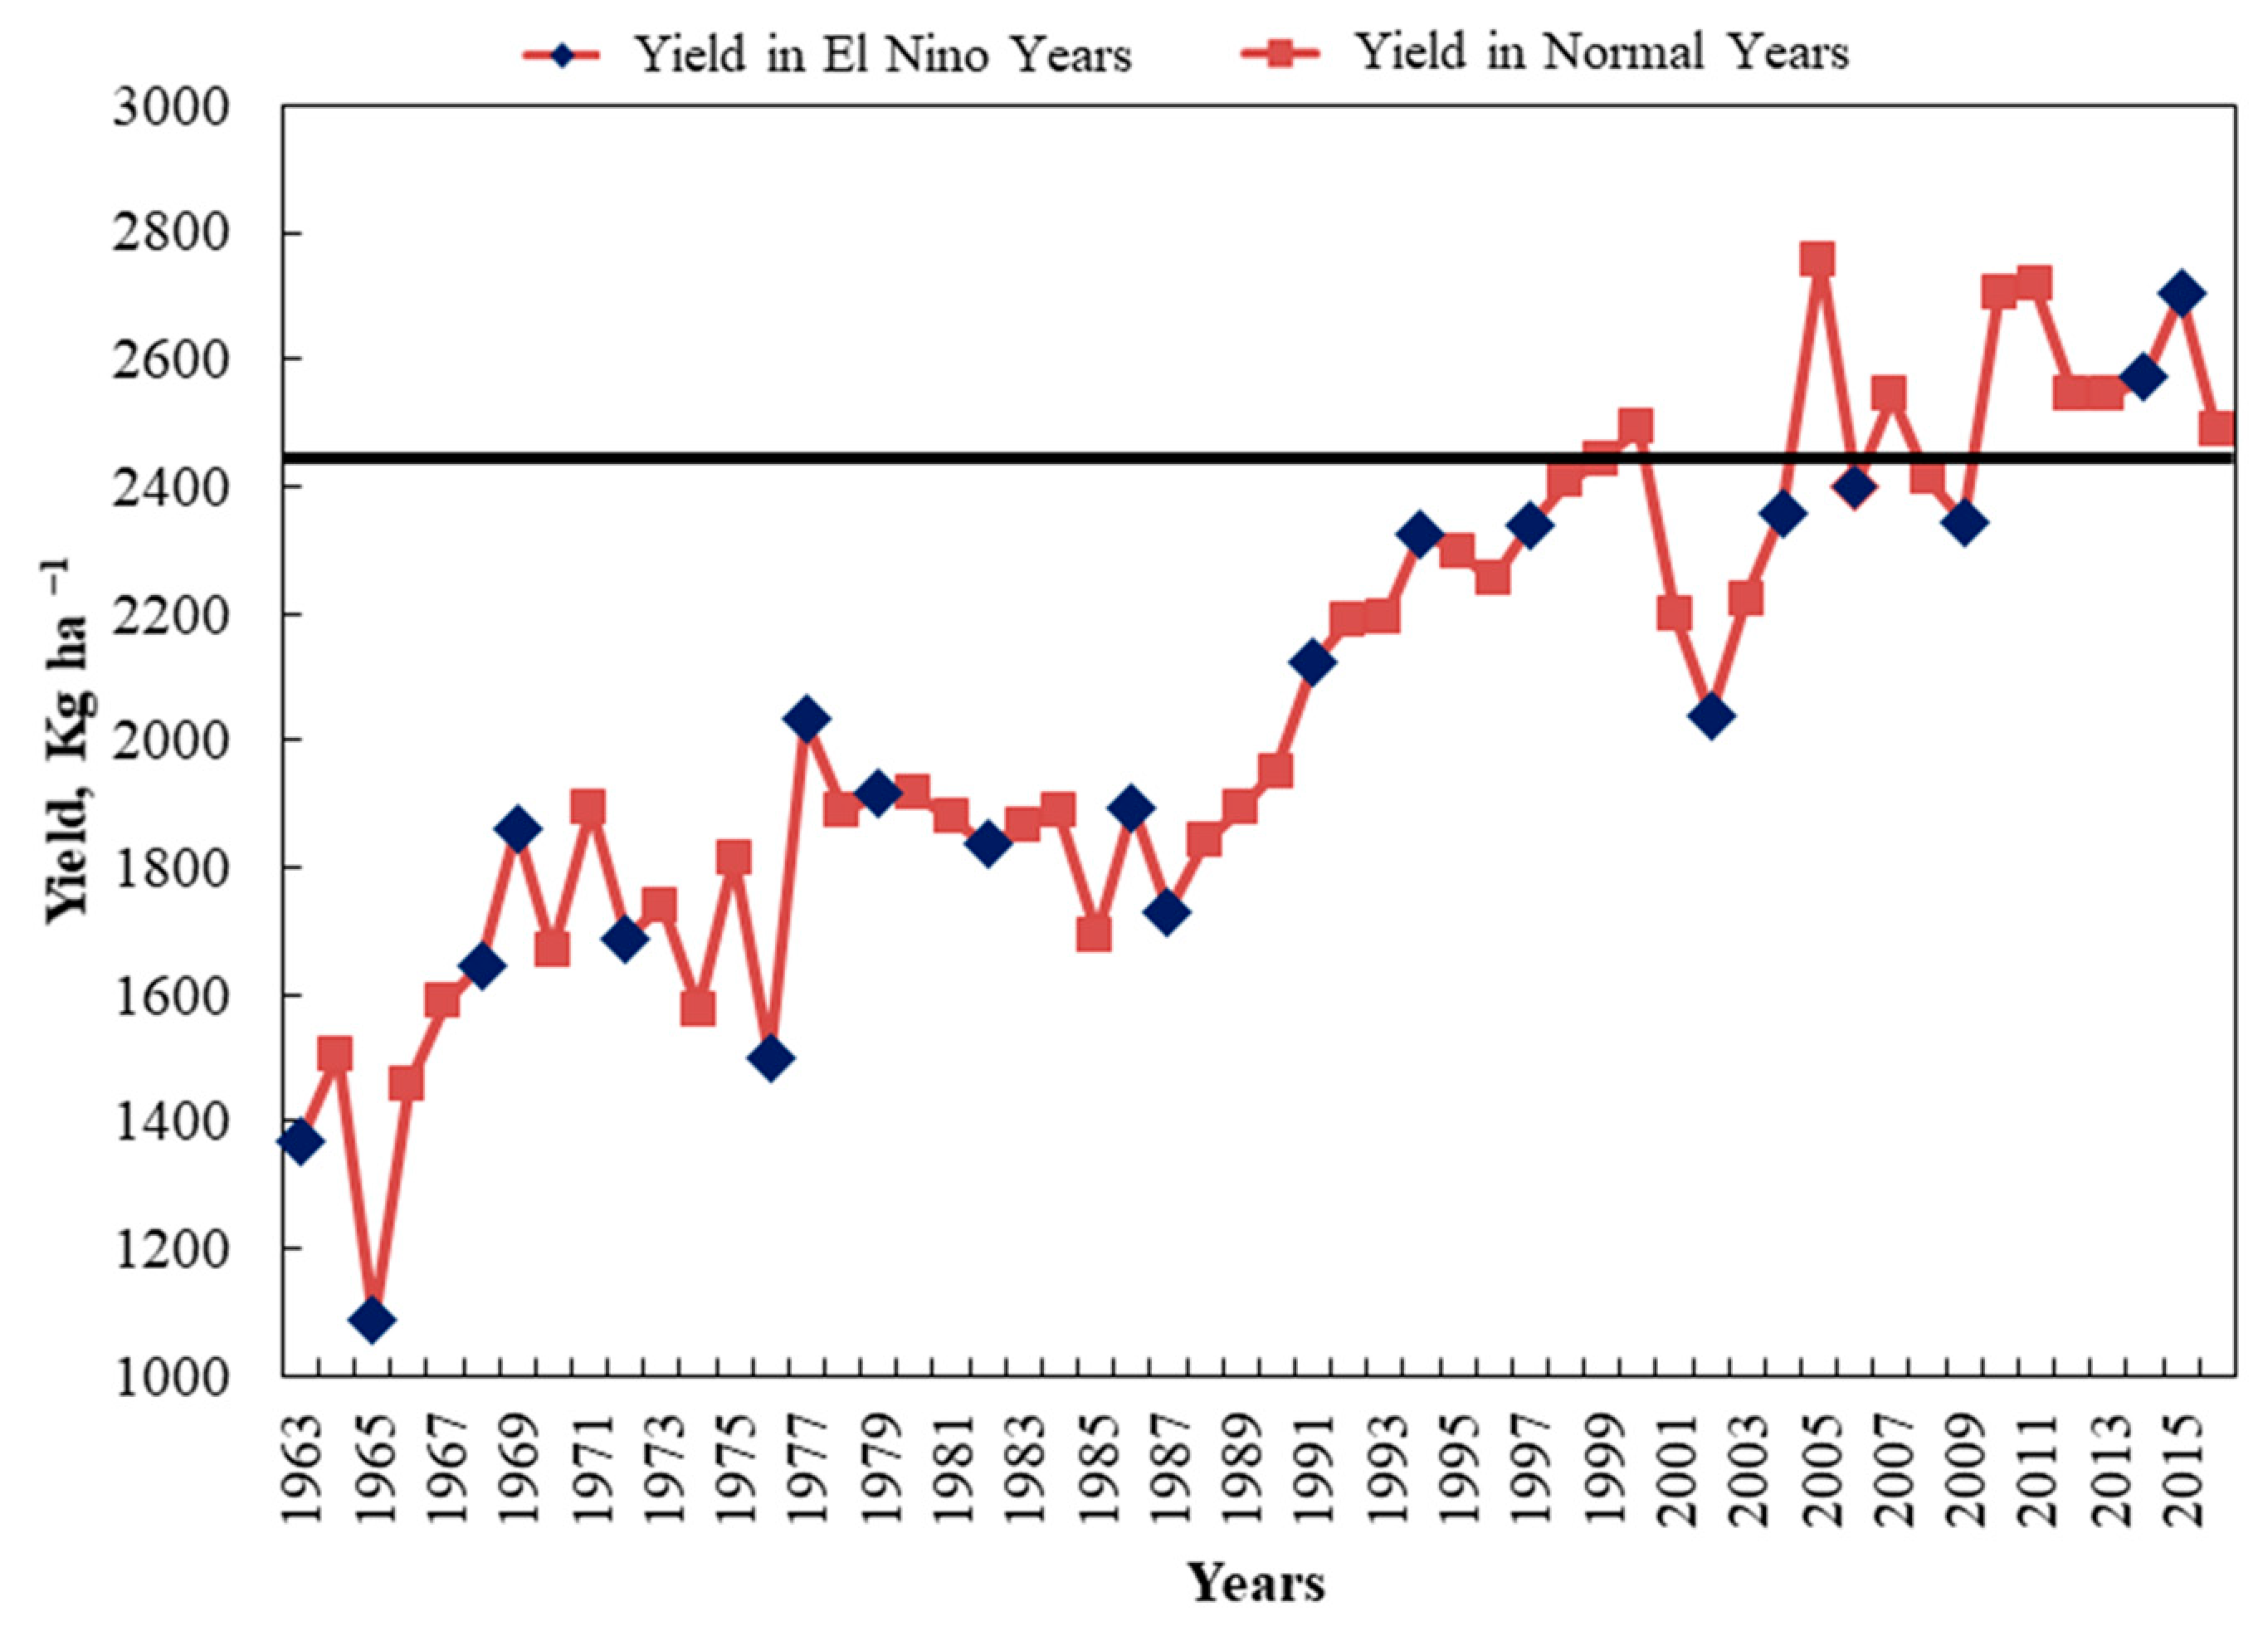
4.2. Impact of ENSO Events on Area, Production, and Productivity of Kharif Rice

In Karnataka state as a whole unit, during El Niño years, a considerable reduction in the production, as well as productivity, of rice was noticed even with a slight increase in the area of Kharif rice during strong and moderate El Niño years, and higher deviation in the production, as well as productivity, was noticed during strong El Niño years (−6.64 and –4.83%, respectively) (Figure 3). The spatial variability and early withdrawal of September rains when the crop is at its peak tillering stage might have reduced productivity by producing Kharif rice during strong and moderate El Niño years. In contrast, because of higher productivity under weak El Niño years, increased rice production was observed even with a slight reduction in the area. The impact of El Niño and delayed onset of monsoon on rice productivity over different rice-growing states of India was also reported by Subash and Gangwar [21]. Additionally, the negative influence of El Niño episodes on rice productivity (−2% in Ahmedabad to −59.4% in Vadodara) in all the major rice-growing districts in Gujarat was noted by Patel et al. [27]. Similarly, regarding the area, production, and productivity of Kharif rice, a decline of 9.3, 12.6, and 3.6% in Andhra Pradesh and 11.9, 18.0, and 7.0% in Telangana states during El Niño years was observed by Rao et al. [28]. The deficit rainfall declined the production (−5.4%) as well as the productivity (−4.5%) of rice in Himachal Pradesh during El Niño years [9]. A loss in crop acreage by about 1% in El Niño years and about 8% loss in cereals and pulses production with a productivity loss of about 6% in Chhattisgarh was also reported by Manikandan et al. [29].
During the La Niña years, the area, production, and productivity of rice was increased irrespective of the strong, moderate, and weak La Niña years. A higher percent anomaly in the area (+4.91%) and production (+15.68%) was witnessed during strong La Niña years, while higher productivity was witnessed during moderate La Niña years (+9.85%). The increased area and productivity during weak El Niño and La Niña years and strong and moderate La Niña years might have increased the Kharif rice production mainly because of higher rainfall than normal during those events. This clearly indicates that during strong and moderate El Niño years, rice production will decrease in Karnataka. Among the different cereal crops, the impact of ENSO events was more on rice production. Out of 13 El Niño years in 6 years, the rice production declined by more than 10%, and out of 13 La Niña years in 10 years, rice production was above normal in India [4]. The spatial and temporal variability of monsoon rainfall leads to large-scale droughts or floods in one or the other part of India. It thereby influences the country’s total food grain production, food security, and economic situation [30]. Similar kinds of El Niño implications on agriculture production have also been studied by several researchers in other countries [31,32,33].
The average Kharif rice yield (kg ha−1) for the Karnataka (1963–2016) state is shown in Figure 4. The productivity was below the long-term average (2081 kg ha−1) in 12 years out of 20 El Niño years. Years 1963, 1968, 1986, and 2002 were moderate El Niño years, and years 1965, 1972, 1982, and 1987 were strong El Niño years. There was a decline in the Kharif rice yield during the strong and moderate El Niño years; whereas, it is interesting to note that the above-average yield of Kharif rice was achieved during the years 1991, 1994, 1997, 2004, 2006, 2009, 2014, and 2015. Among those years, 2004, 2006, and 2014 were weak El Niño years. However, the years 1994 and 2009 were moderate El Niño years, whereas years 1991, 1997, and 2015 were strong El Niño years. Positive Indian Ocean Dipole (IOD) had facilitated normal or excess rainfall over India in 1994 and 1997 despite a moderate and a strong El Niño year, respectively, in those years. Rice production in India is highly correlated with the seasonal mean monsoon rainfall, and there was a major reduction in the rice crop yield in 1982 and 1987 [8]. Therefore, strong and moderate El Niño is a signal for the declining trend in the yield, in general, and weak El Niño events have exerted a lesser influence on food grain productivity so far.

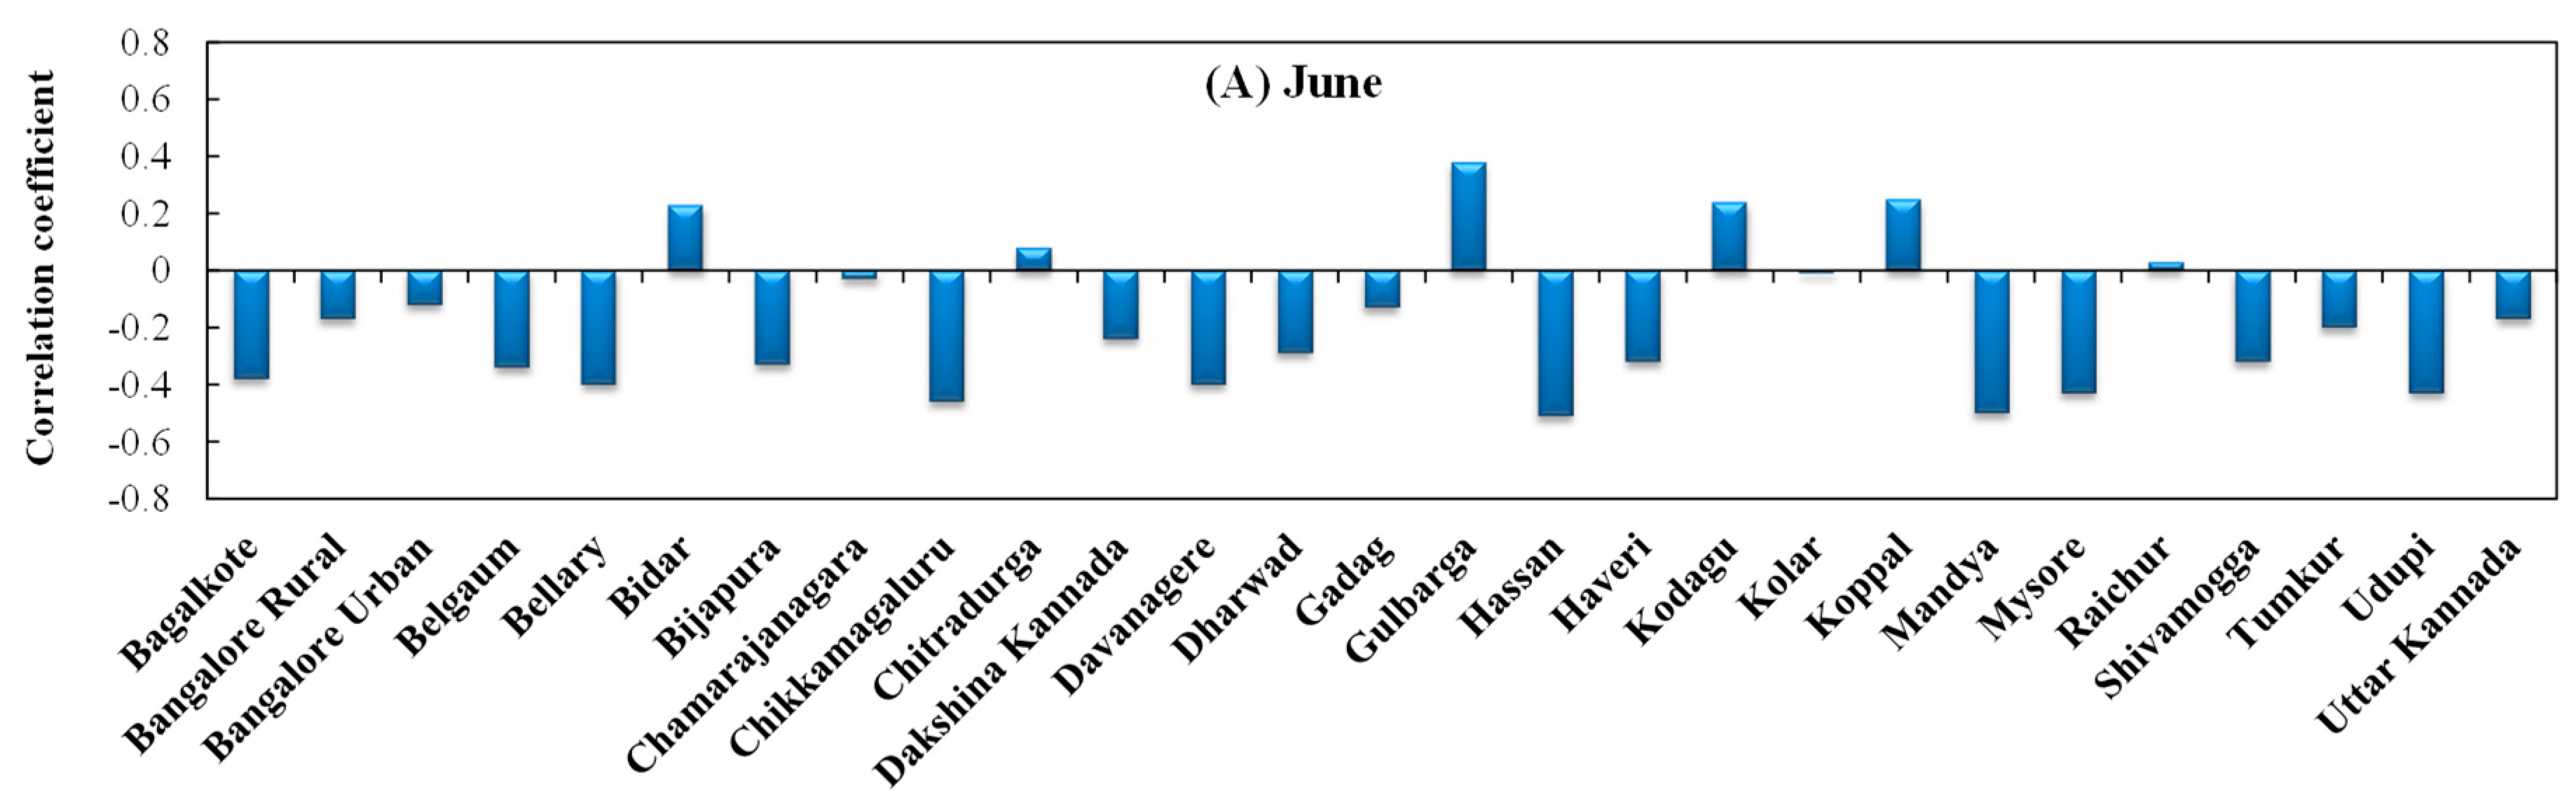
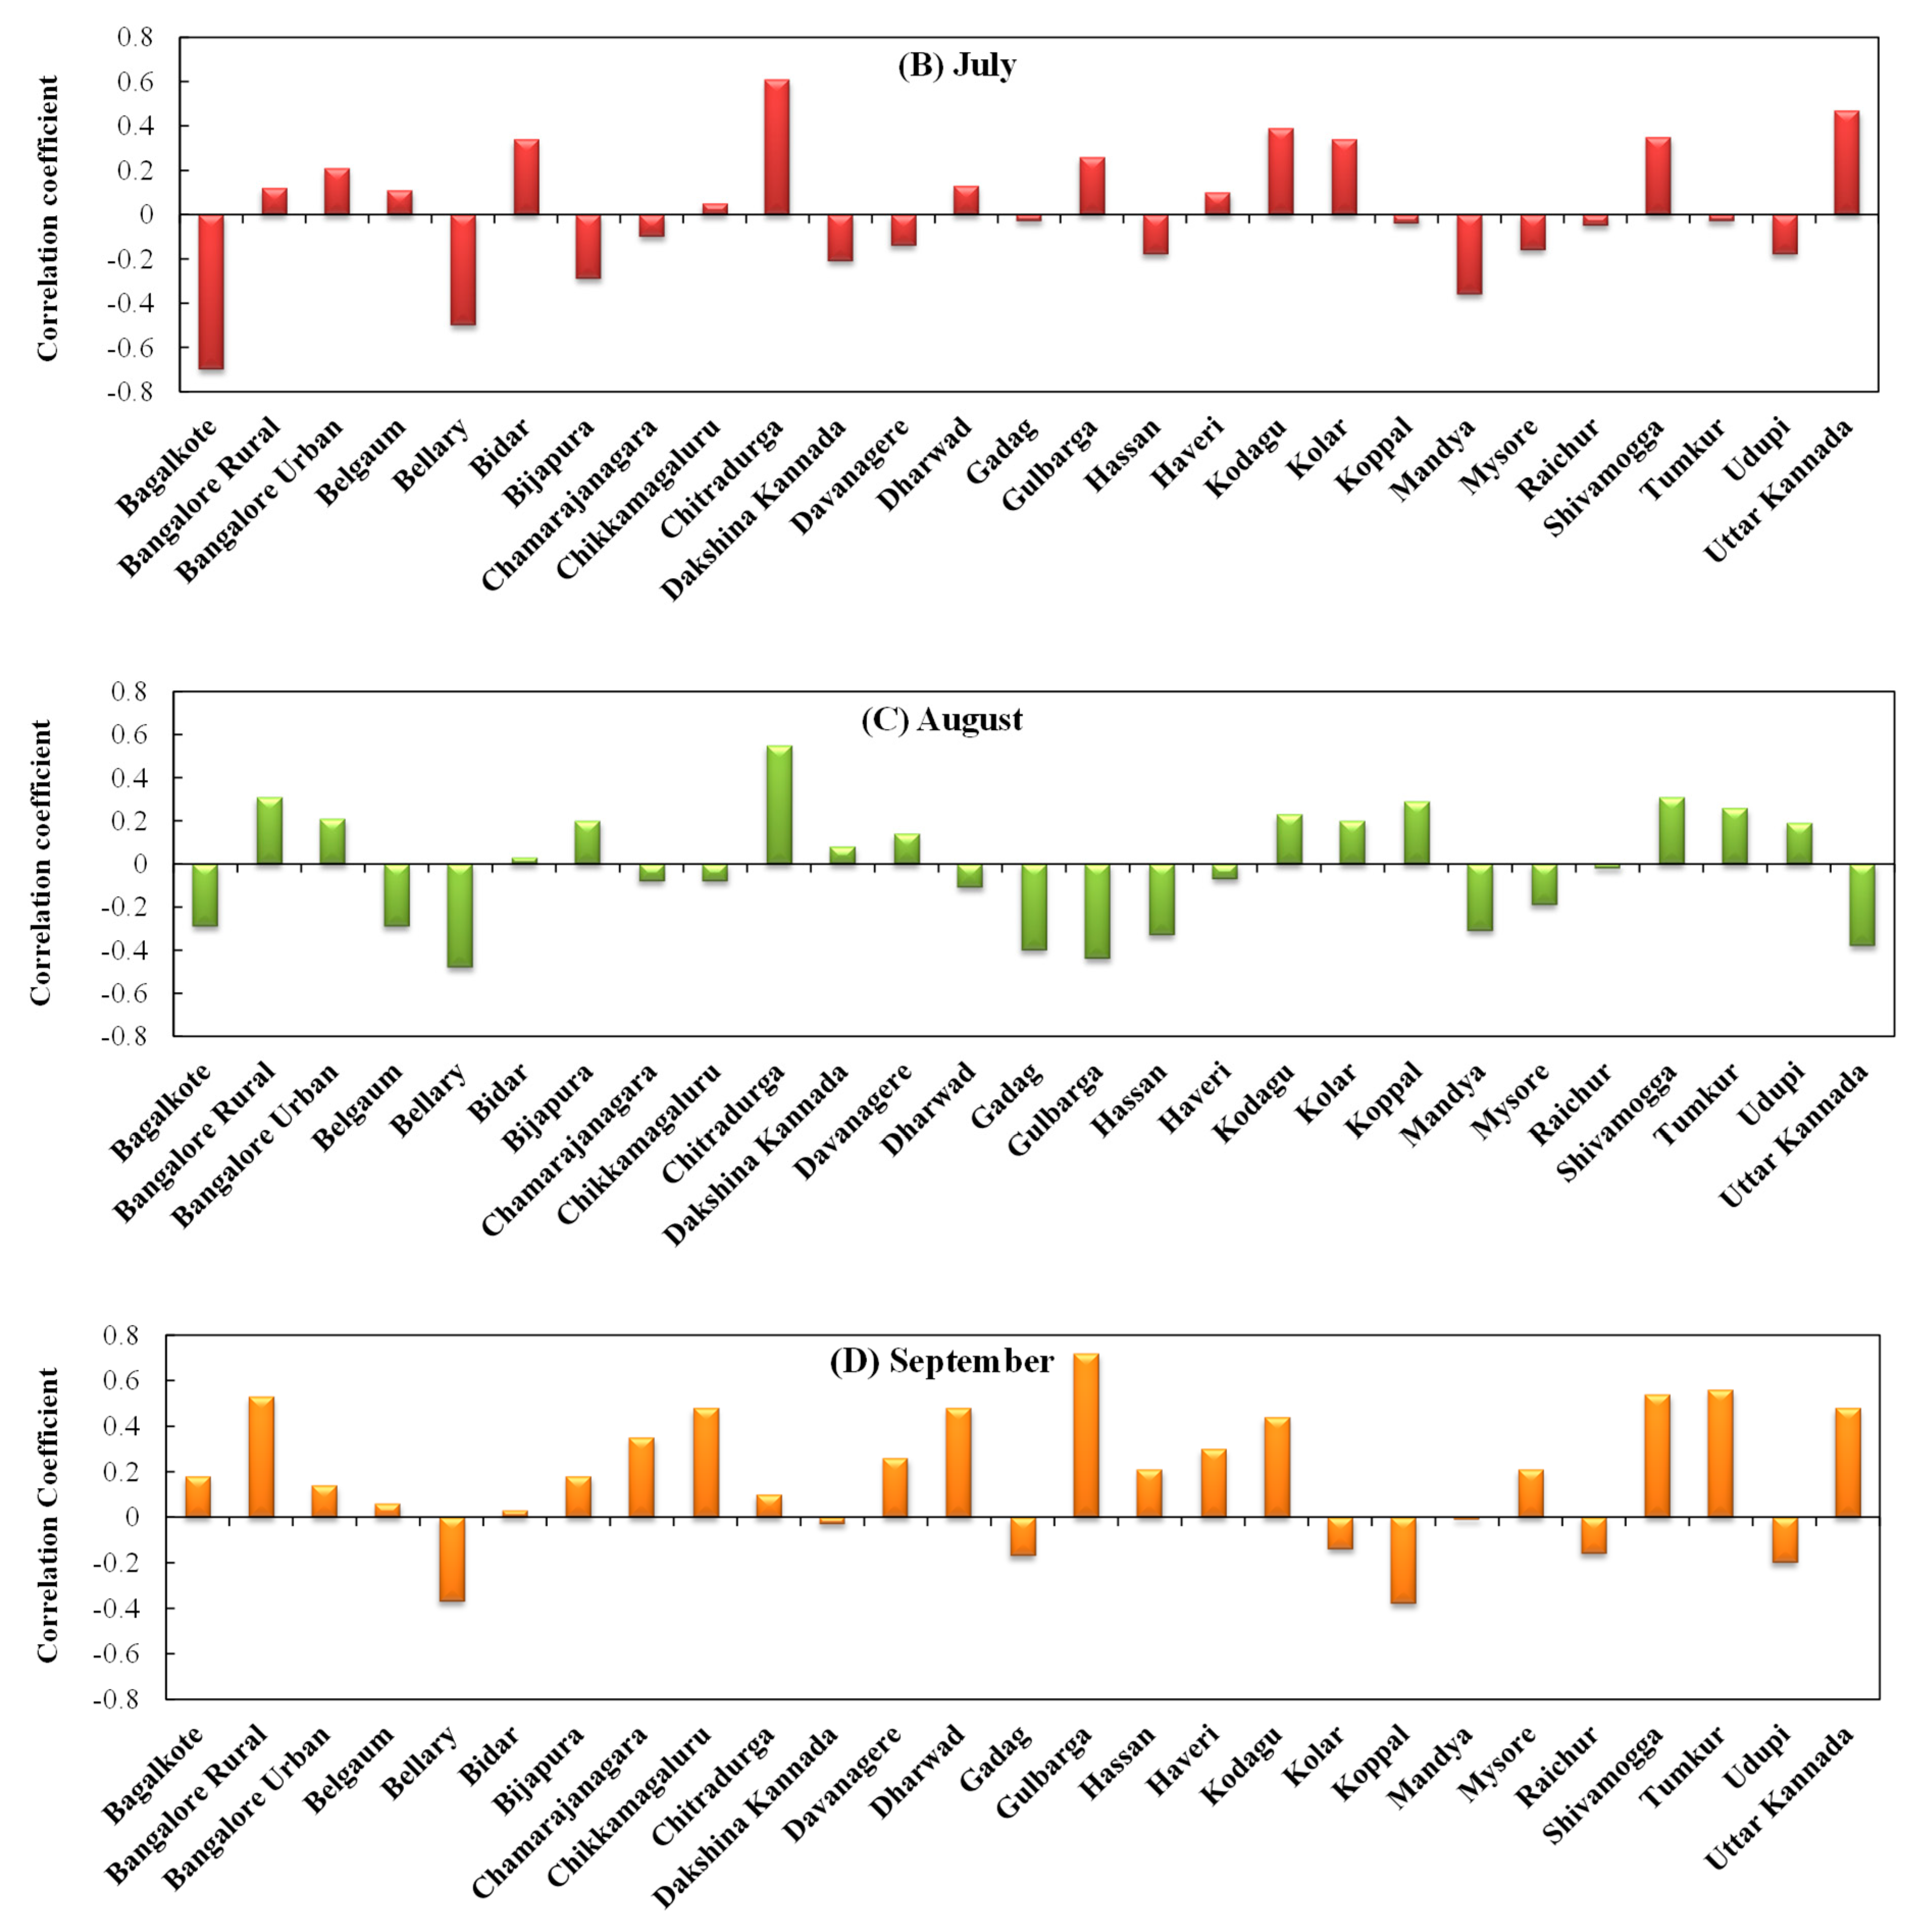
4.3. Relationship between Seasonal Rainfall and Kharif Rice Production

In order to know the impact of June to September rainfall on the Kharif rice production across different rice-growing districts of Karnataka, the correlation coefficient (r) values were worked out. They showed that six rice-growing districts, viz., Bangalore Rural, Chikkamagaluru, Dharwad, Shivamogga, Tumkur, and Uttara Kannada districts, have a significant positive relation with the September rainfall at a 5% level of significance. While Gulbarga district showed a significant positive association with the September rainfall at a 1% level of significance. In the case of Chitradurga district, August rainfall and Kharif rice production were found significant at a 5% level of significance (Figure 5).
It clearly shows the impact of rainfall over Kharif rice yield across the state. Correlation coefficient values were also determined to know the overall influence of S-W monsoon rainfall on Kharif rice production in different state districts (Figure 6) and found a moderate correlation between S-W monsoon rainfall and Kharif rice production in Bangalore Rural, Chitradurga, Gulbarga, Kodagu, Shivamogga, and Uttar Kannada districts. In contrast, Bagalkote, Bellary, and Mandya districts have shown a moderate negative correlation with the Kharif rice production. These differences in relationships in terms of correlation coefficients are attributed to the differences in agronomic practices being practiced by the farmers. Apart from this, the moderate correlations are also due to the fact that these districts come under irrigated rice by the reservoirs. Nevertheless, the present study clearly infers the influence of rainfall on rice production. A higher correlation (r = 0.69) of summer monsoon rainfall and rice production in India was reported by Kiran [34]. Similarly, a significant association between S-W monsoon rainfall and rice production (r = 0.66) was unveiled by Selvaraju [4] who inferred that S-W monsoon rainfall is responsible for 50% variability in the total food grain production in India.

5. Conclusions

Anomalies in the ENSO phases across the different years have exhibited the inter-annual variability of monsoon rainfall over Karnataka and, thereby, exerted its impact on the rice production in the state. Different regions and districts have shown the deviation in the normal rainfall during different ENSO phases in the present study. During El Niño years, below normal S-W monsoon rainfall was witnessed over all the districts of Karnataka state with an anomaly of −3.34% in Bangalore Urban to −21.43% in Mysore, but out of 25 districts, 15 have shown positive departure in the Kharif rice production. In contrast to El Niño during La Niña years, S-W monsoon rainfall was above normal in 12 districts, but production was higher in most rice-growing districts. In general, across Karnataka, strong and moderate El Niño years declined the production as well as productivity of the Kharif rice. However, during the weak El Niño years and all the La Niña years, the crop acreage, production, and productivity of Kharif rice were above normal. Thus, the present study’s findings pave the way for policymakers to develop localized adaptation strategies and measures to combat the adverse effects of ENSO on sustainable production and productivity of the Kharif rice in Karnataka.

Author Contributions

Conceptualization, supervision, methodology, formal analysis, writing—original draft preparation, writing—review and editing, S.C. and S.S.; data curation, project administration, investigation, K.N.M., P.G., and N.R.; writing—review and editing, funding acquisition, A.A.A., A.Z.D., and M.A.M. All authors have read and agreed to the published version of the manuscript.

Funding

This research was financially supported by the Vice Deanship of Research Chairs at King Saud University.

Institutional Review Board Statement

Not applicable.

Informed Consent Statement

Not applicable.

Data Availability Statement

The data presented in this study are available on request from the corresponding author.

Acknowledgments

This research publication was financially supported by the Vice Deanship of Research Chairs at King Saud University.

Conflicts of Interest

The authors declare no conflict of interest.

References

  1. Anonymous. Ministry of Statistics and Programme Implementation Government of India. Available online: http://statisticstimes.com/economy/country/india-gdp-sectorwise.php (accessed on 12 March 2021).
  2. Sekhara, K. Trends in area, production and productivity of paddy crop: An overview. Int. J. Humanit. Soc. Sci. Invent. 2019, 8, 50–58. [Google Scholar]
  3. Anonymous. Ministry of Agriculture and Farmers Welfare, Government of India. Available online: https://www.indiastat.com (accessed on 28 February 2020).
  4. Selvaraju, R. Impact of El Niño-Southern Oscillation on Indian foodgrain production. Int. J. Climatol. 2003, 23, 187–206. [Google Scholar] [CrossRef]
  5. Iizumi, T.; Luo, J.J.; Challinor, A.J.; Sakurai, G.; Yokozawa, M.; Sakuma, H.; Brown, M.E.; Yamagata, T. Impacts of El Niño Southern Oscillation on the global yields of major crops. Nat. Commun. 2014, 15, 3712. [Google Scholar] [CrossRef] [Green Version]
  6. Webster, P.J.; Magana, V.O.; Palmer, T.N.; Shukla, J.; Thomas, R.A.; Yanai, M.; Yasunari, T. Monsoons: Processes, predictability and the prospects of prediction. J. Geophys. Res. 1998, 103, 14451–14510. [Google Scholar] [CrossRef]
  7. Prasanna, V. Impact of monsoon rainfall on the total food grain yield over India. J. Earth. Syst. Sci. 2014, 123, 1129–1145. [Google Scholar] [CrossRef]
  8. Webster, P.J.; Yang, S. Monsoon and ENSO: Selectivity Interactive Systems. Q. J. R. Meteorol. Soc. 1992, 118, 877–926. [Google Scholar] [CrossRef]
  9. Prasad, R.; Rao, V.U.M.; Rao, B.B. Res Bull No. 01. In El Niño—Its Impact on Rainfall and Crop Productivity—A Case Study for Himachal Pradesh; CSK HPKV: Palampur, India, 2014; pp. 1–24. [Google Scholar]
  10. Krishnamurthy, V.; Goswami, B.N. Indian Monsoon–ENSO Relationship on Interdecadal Timescale. J. Clim. 2000, 13, 579–595. [Google Scholar] [CrossRef]
  11. Pai, D.S. Teleconnections of Indian summer monsoon with global surface air temperature anomalies. Mausam 2003, 54, 407–418. [Google Scholar]
  12. Kane, R.P. Unstable ENSO Relationship with Indian regional rainfall. Int. J. Climatol. 2005, 26, 771–783. [Google Scholar] [CrossRef]
  13. Kumar, K.K.; Rajagopalan, B.; Cane, M.A. On the weakening relationship between the Indian Monsoon and ENSO. Science 1999, 284, 2156–2159. [Google Scholar] [CrossRef] [PubMed] [Green Version]
  14. Shukla, J.; Mooley, D.A. Empirical prediction of the summer monsoon rainfall over India. Mon. Weather Rev. 1987, 115, 695–703. [Google Scholar] [CrossRef] [Green Version]
  15. Gregory, S. Macro-regional definition and characteristics of Indian summer monsoon rainfall. Int. J. Climatol. 1989, 9, 465–483. [Google Scholar] [CrossRef]
  16. Null, J. El Niño and La Niña Intensities. Available online: http://ggweather.com/enso/oni.htm (accessed on 12 March 2021).
  17. Conover, W.J. Practical Non-Parametric Statistics; Wiley: New York, NY, USA, 1971. [Google Scholar]
  18. Mooley, D.A.; Parthasarathy, B. Indian Summer Monsoon and the East Equatorial Pacific Sea Surface Temperature. Atmos. Ocean 1984, 22, 23–35. [Google Scholar] [CrossRef] [Green Version]
  19. Mooley, D.A.; Parthasarathy, B. Indian summer monsoon and El Niño. Pure Appl. Geophys. PAGEOPH 1983, 121, 339–352. [Google Scholar] [CrossRef]
  20. Kripalani, R.H.; Kulkarni, A. Assessing the Impacts of El Niño and Non-El Niño-related Droughts over India. Drought Netw. News (1994–2001) 1996, 24. Available online: https://digitalcommons.unl.edu/droughtnetnews/24 (accessed on 12 March 2021).
  21. Subash, N.; Gangwar, B. Statistical analysis of Indian rainfall and rice productivity anomalies over the last decades. Int. J. Clim. 2014, 34, 2378–2392. [Google Scholar] [CrossRef]
  22. Victor, U.S.; Srivastava, N.N.; Subba Rao, A.V.M.; Ramana Rao, B.V. El Niño’s Effect on Southwest Monsoon Rainfall in Andhra Pradesh, India. Drought Netw. News (1994–2001) 1995, 89. Available online: https://digitalcommons.unl.edu/droughtnetnews/89 (accessed on 12 March 2021).
  23. Zubair, L.; Ropelewski, C.F. The Strengthening Relationship between ENSO and Northeast Monsoon Rainfall over Sri Lanka and Southern India. J. Clim. 2006, 19, 1567–1575. [Google Scholar] [CrossRef] [Green Version]
  24. De, U.S.; Mukhopadhyay, R.K. The effect of ENSO/Anti ENSO on northeast monsoon rainfall. Mausam 1999, 50, 343–354. [Google Scholar]
  25. Ropelewski, C.F.; Halpert, M.S. Global and regional scale precipitation patterns associated with the El-Niño Southern Oscillation. Mon. Weather Rev. 1987, 115, 1606–1626. [Google Scholar] [CrossRef] [Green Version]
  26. Rajeevan, M.; Unnikrishnan, C.K.; Bhate, J.; Kumara, K.N.; Sreekalab, P.P. Northeast monsoon over India: Variability and prediction. Meteorol. Appl. 2012, 19, 226–236. [Google Scholar] [CrossRef]
  27. Patel, H.R.; Lunagaria, M.M.; Pandey, V.; Rao, B.B.; Rao, V.U.M.; Sharma, P.K. Tech Bull No. 01. In El Niño Episodes and Agricultural Productivity in Gujarat; Anand Agric Univ Anand: Anand, India, 2014; pp. 1–22. [Google Scholar]
  28. Rao, V.U.M.; Subba Rao, A.V.M.; Rao, B.B.; Ramana Rao, B.V.; Sravani, C.; Venkateswarlu, B. Res Bull No. 2. In El Niño Effect on Climatic Variability and Crop Production—A Case Study for Andhra Pradesh; CRIDA: Hyderabad, India, 2011; pp. 1–35. [Google Scholar]
  29. Manikandan, N.; Chaudhary, J.L.; Khavse, R.; Rao, V.U.M. El-niño impact on rainfall and food grain production in Chhattisgarh. J. Agrometeorol. 2016, 18, 142–145. [Google Scholar]
  30. Gadgil, S.; Gadgil, S. The Indian Monsoon, GDP and agriculture. Econ. Polit. Wkly. 2006, 41, 4887–4895. [Google Scholar]
  31. Hansen, J.W.; Jones, J.W.; Irmak, A.; Royce, F. El Niño-Southern Oscillation Impacts on Crop Production in the Southeast United States; ASA Special Publication: Madison, WI, USA, 2001. [Google Scholar]
  32. Phillips, J.G.; Cane, M.A.; Rosenzweig, C. ENSO, seasonal rainfall patterns and simulated maize yield variability in Zimbabwe. Agric. For. Meteorol. 1998, 90, 39–50. [Google Scholar] [CrossRef]
  33. Zubair, L. El Niño—Southern Oscillation influences on rice production in Sri Lanka. Int. J. Climatol. 2002, 22, 249–260. [Google Scholar] [CrossRef] [Green Version]
  34. Kiran, S.R. Impact of rainfall on rice production of India. Int. J. Innov. Res. Sci. Eng. Technol. 2016, 5, 258–265. [Google Scholar]
Figure 1. The Oceanic Niño Index (ONI) [16].
Agronomy 11 01021 g001
Figure 2. Box plots depicting the percent change in (a) S-W monsoon, (b) N-E monsoon, and (c) annual rainfall during El Niño and La Niña years compared to normal years in Karnataka (1951–2014).
Agronomy 11 01021 g002aAgronomy 11 01021 g002b
Figure 3. Box plots depicting the percent change in (a) average area, (b) production, and (c) productivity of Kharif rice in Karnataka during El Niño and La Niña years compared to normal years (1963–2016).
Agronomy 11 01021 g003aAgronomy 11 01021 g003b
Figure 4. Average Kharif rice yield (kg ha−1) in Karnataka (1963–2016).
Agronomy 11 01021 g004
Figure 5. Correlation coefficient between Kharif rice productivity and (A) June, (B) July, (C) August, and (D) September months’ rainfall in different districts of Karnataka.
Agronomy 11 01021 g005aAgronomy 11 01021 g005b
Figure 6. District-wise correlation coefficient of Kharif rice yield with S-W monsoon rainfall for Karnataka.
Agronomy 11 01021 g006
Table 1. Years associated with El Niño from 1950 to 2018.
El Niño IntensityYears
Weak El Niño1952, 1953, 1958, 1969, 1976, 1977, 1979, 2004, 2006, 2014, 2018
Moderate El Niño1951, 1963, 1968, 1986, 1994, 2002, 2009
Strong El Niño1957, 1965, 1972, 1982, 1987, 1991, 1997, 2015
Neutral years1950, 1956, 1959, 1960, 1961, 1962, 1966, 1967, 1978, 1980, 1981, 1985, 1989, 1990, 1992, 1993, 1996, 2001, 2003, 2012, 2013
Table 2. Years associated with La Niña from 1950 to 2018.
La Niña IntensityYears
Weak La Niña1954, 1964, 1971, 1974, 1983, 1984, 2000, 2005, 2008, 2016, 2017
Moderate La Niña1955, 1970, 1995, 2011
Strong La Niña1973, 1975, 1988, 1998, 1999, 2007, 2010
Neutral years1950, 1956, 1959, 1960, 1961, 1962, 1966, 1967, 1978, 1980, 1981, 1985, 1989, 1990, 1992, 1993, 1996, 2001, 2003, 2012, 2013
Table 3. District-wise percent change in seasonal and annual rainfall during El Niño years compared to normal years (1950–2018).
Strong El NiñoModerate El NiñoWeak El Niño
DistrictsSWMNEMASWMNEMASWMNEA
Udupi−13.47−13.55−14.49−2.0510.79−3.66−10.09−2.41−9.94
Dakshina Kannada−8.90−2.47−10.19−8.648.05−8.37−11.78−3.55−10.38
Uttara Kannada−13.41−20.86−15.12−11.077.81−11.14−8.51−17.84−9.06
Coastal Karnataka−11.93−12.29−13.27−7.258.88−7.72−10.13−7.93−9.79
Bagalkote−7.69−4.50−8.540.2314.910.35−13.75−16.51−12.48
Belgaum−10.94−5.53−8.69−8.7615.74−7.34−8.60−7.61−8.51
Bellary−9.14−3.36−6.85−7.1315.57−6.00−10.46−7.84−9.83
Bidar−14.87−16.45−13.09−12.66−6.06−10.24−10.08−30.06−9.42
Bijapura−12.05−7.56−12.350.9422.242.83−10.59−13.23−8.08
Gadag−5.46−9.45−5.00−5.2812.13−2.24−14.92−10.18−10.63
Gulbarga−15.59−17.48−14.16−6.9623.83−1.26−8.58−18.27−5.04
Koppal−8.13−0.55−5.865.0114.196.18−19.91−18.02−14.89
Dharwad−7.61−3.13−7.01−8.0313.72−6.82−15.12−7.62−13.11
Haveri−7.89−2.17−8.79−7.047.65−7.31−19.35−6.39−16.90
Raichur−13.32−16.02−13.390.5864.6516.23−16.79−28.06−13.87
North Interior Karnataka−10.24−7.84−9.43−4.4618.05−1.42−13.47−14.89−11.16
Kolar−19.8915.47−5.29−12.41−20.18−13.23−15.35−1.42−7.67
Mandya−12.09−0.14−7.99−13.84−11.53−12.18−26.47−0.98−15.81
Mysore−14.884.04−10.44−17.72−6.50−14.90−31.69−8.97−24.04
Tumkur−13.8011.50−5.01−8.55−17.49−9.03−15.475.94−4.95
Bangalore Rural−14.5211.55−1.16−2.94−21.08−7.79−5.079.534.88
Bangalore Urban−12.0011.701.513.17−18.40−2.66−1.194.266.91
Chamarajanagara−16.7317.32−4.28−16.78−11.47−12.27−22.66−1.73−10.27
Chitradurga−9.363.15−5.32−3.96−7.50−4.43−12.45−2.11−5.69
Davanagere−8.40−1.80−7.71−7.850.06−6.25−17.56−5.23−13.48
South Interior Karnataka−13.528.09−5.08−8.99−12.68−9.19−16.43−0.08−7.79
Shivamogga−12.57−6.56−12.28−7.652.46−7.17−0.89−7.64−2.40
Chikkamagaluru−13.16−3.56−10.76−11.65−4.32−9.400.03−4.240.69
Kodagu−15.111.07−12.24−9.763.56−8.094.92−0.468.07
Hassan−14.02−3.41−11.55−16.98−11.51−15.18−22.37−7.13−17.73
Malnad Region−13.72−3.12−11.71−11.51−2.45−9.96−4.58−4.87−2.84
Note: SWM—southwest monsoon; NEM—northeast monsoon; A—annual.
Table 4. District-wise percent change in seasonal and annual rainfall during La Niña years compared to normal years (1950–2018).
Strong La NiñaModerate La NiñaWeak La Niña
DistrictsSWMNEMASWMNEMASWMNEMA
Udupi6.5616.345.191.81−15.09−0.78−8.49−24.90−11.11
Dakshina Kannada5.7814.904.936.99−10.536.11−4.85−27.69−7.41
Uttara Kannada2.30−0.420.28−4.542.40−3.96−7.84−26.64−10.37
Coastal Karnataka4.8810.283.471.42−7.740.46−7.06−26.41−9.63
Bagalkote13.926.103.38−8.082.14−4.101.49−19.85−6.34
Belgaum−7.723.65−9.49−15.4326.64−10.23−14.88−20.00−15.51
Bellary−6.073.50−8.18−19.5918.45−13.80−15.00−20.24−15.56
Bidar16.5712.6811.4929.72−27.8418.0213.49−12.016.55
Bijapura15.1213.765.721.51−9.22−2.445.05−17.82−4.18
Gadag−1.57−8.62−5.64−23.86−11.07−16.34−12.30−27.14−13.99
Gulbarga12.8112.387.7320.93−2.2313.9911.98−16.314.12
Koppal20.31−1.839.83−7.76−14.79−0.725.71−25.53−3.58
Dharwad−11.07−7.51−12.89−21.439.41−14.77−18.39−21.55−18.17
Haveri4.570.580.24−14.69−3.13−7.78−14.32−24.17−15.68
Raichur21.12−3.847.729.87−6.209.2412.05−19.220.84
North Interior Karnataka7.092.810.90−4.44−1.62−2.63−2.28−20.35−7.41
Kolar18.744.1114.28−6.55−1.081.2613.021.647.45
Mandya9.10−4.677.04−27.4417.18−13.33−5.31−13.37−5.97
Mysore−3.05−9.31−3.12−32.665.28−21.25−17.89−14.19−15.80
Tumkur16.52−0.5412.09−20.507.16−4.911.81−12.87−2.01
Bangalore Rural25.723.1916.37−1.211.537.2020.39−1.4710.73
Bangalore Urban30.492.0720.472.25−7.199.0426.711.6015.75
Chamarajanagara7.921.227.59−26.45−13.02−12.67−16.16−4.48−9.31
Chitradurga22.484.5915.51−20.49−6.59−4.950.84−26.08−8.03
Davanagere12.047.387.30−18.51−14.53−9.98−9.14−27.47−12.47
South Interior Karnataka15.550.8910.84−16.84−1.25−5.511.58−10.74−2.18
Shivamogga6.47−4.882.71−14.93−6.95−9.58−4.17−30.94−7.40
Chikkamagaluru7.07−10.514.09−27.13−14.07−20.88−4.09−33.64−7.35
Kodagu17.48−4.1712.56−11.10−2.27−5.904.04−13.621.30
Hassan−2.26−7.17−2.67−33.059.51−24.02−12.78−22.24−12.90
Malnad Region7.19−6.684.18−21.55−3.45−15.09−4.25−25.11−6.59
Note: SWM—southwest monsoon; NEM—northeast monsoon; A—annual.
Table 5. District-wise percent change in average area, production, and productivity of Kharif rice during El Niño years compared to normal years (1998–2018).
Strong and moderate La NiñaWeak La Niña
DistrictsAreaProductionYieldAreaProductionYield
Udupi5.40−5.98−10.253.380.69−2.39
Dakshina Kannada7.20−1.25−7.37−1.43−0.831.44
Uttara Kannada5.0211.724.541.944.761.01
Coastal Karnataka5.871.49−4.361.301.540.02
Belgaum4.6056.1746.285.2244.5235.10
Bellary2.061.38−2.076.712.92−4.47
Bidar6.201.08−15.94−12.48−16.57−9.49
Gadag−4.29−4.411.4218.3851.4920.59
Gulbarga13.1219.13−17.1048.7729.3225.77
Koppal−0.445.425.130.10−2.47−2.81
Dharwad5.7123.5815.52−1.6715.1510.53
Haveri4.3233.7737.64−10.2835.7543.31
Raichur0.583.304.398.1720.0211.82
North Interior Karnataka3.5415.498.366.9920.0214.48
Kolar52.3651.03−2.2816.0416.17−3.17
Mandya15.3621.445.4411.231.68−9.63
Mysore13.079.00−3.522.23−5.19−7.18
Tumkur56.9169.086.4849.5355.690.99
Bangalore Rural32.8447.867.1944.7845.016.40
Bangalore Urban40.1063.868.8110.8529.858.27
Chamarajanagara28.0618.06−7.3213.39−5.42−18.38
Chitradurga39.7560.4916.1719.1740.5610.32
Davanagere−7.87−5.271.444.854.790.24
South Interior Karnataka30.0637.283.6019.1220.35−1.35
Shivamogga6.3920.6912.200.993.800.48
Chikkamagaluru8.6220.3411.09−0.884.715.25
Kodagu8.186.25−1.92−1.02−4.91−4.27
Hassan1.229.4311.21−7.81−10.67−2.68
Malnad Region6.1114.188.14−2.18−1.77−0.31
Table 6. Mean percentage deviation of S-W monsoon rainfall from normal under El Niño, La Niña, and neutral ENSO phases (1950–2018) n = 69 years.
S-W Monsoon Rainfall (mm)
DistrictsEl NiñoLa NiñaNeutralH statistic
Bagalkote−6.365.691.911.60
Bangalore Rural−10.1014.72−2.9110.02 *
Bangalore Urban−9.0016.23−5.8610.93 *
Belgaum−1.93−5.548.201.06
Bellary−1.69−5.848.220.91
Bidar−13.0716.33−0.9316.60 *
Bijapura−7.418.220.572.87
Chamarajanagara−9.720.2111.813.37
Chikkamagaluru−3.09−0.544.400.98
Chitradurga−7.136.232.302.57
Dakshina Kannada−6.724.413.705.33
Davanagere−6.641.896.251.48
Dharwad−1.65−7.9610.380.75
Gadag−2.54−4.247.590.75
Gulbarga−10.7813.26−0.549.80 *
Hassan−8.16−2.2712.482.44
Haveri−5.54−1.077.971.19
Kodagu−5.025.760.192.31
Kolar−13.8814.042.4814.38 *
Koppal−8.589.091.105.21
Mandya−11.054.149.342.20
Mysore−10.57−2.5715.783.25
Raichur−11.4614.00−0.479.26 *
Shivamogga−3.160.533.361.64
Tumkur−9.326.884.343.92
Udupi−5.212.224.125.52
Uttar Kannada−5.701.375.613.19
Legend: * = significant at 5% (KW H test).
Publisher’s Note: MDPI stays neutral with regard to jurisdictional claims in published maps and institutional affiliations.

