The First National Survey of Cadmium in Cacao Farm Soil in Colombia

 ,
,  , , ,
, , ,
Abstract
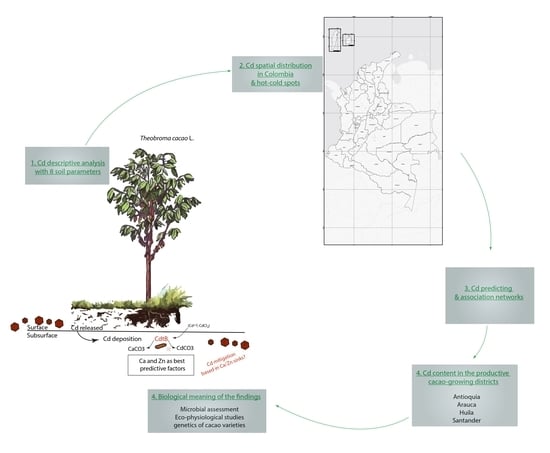
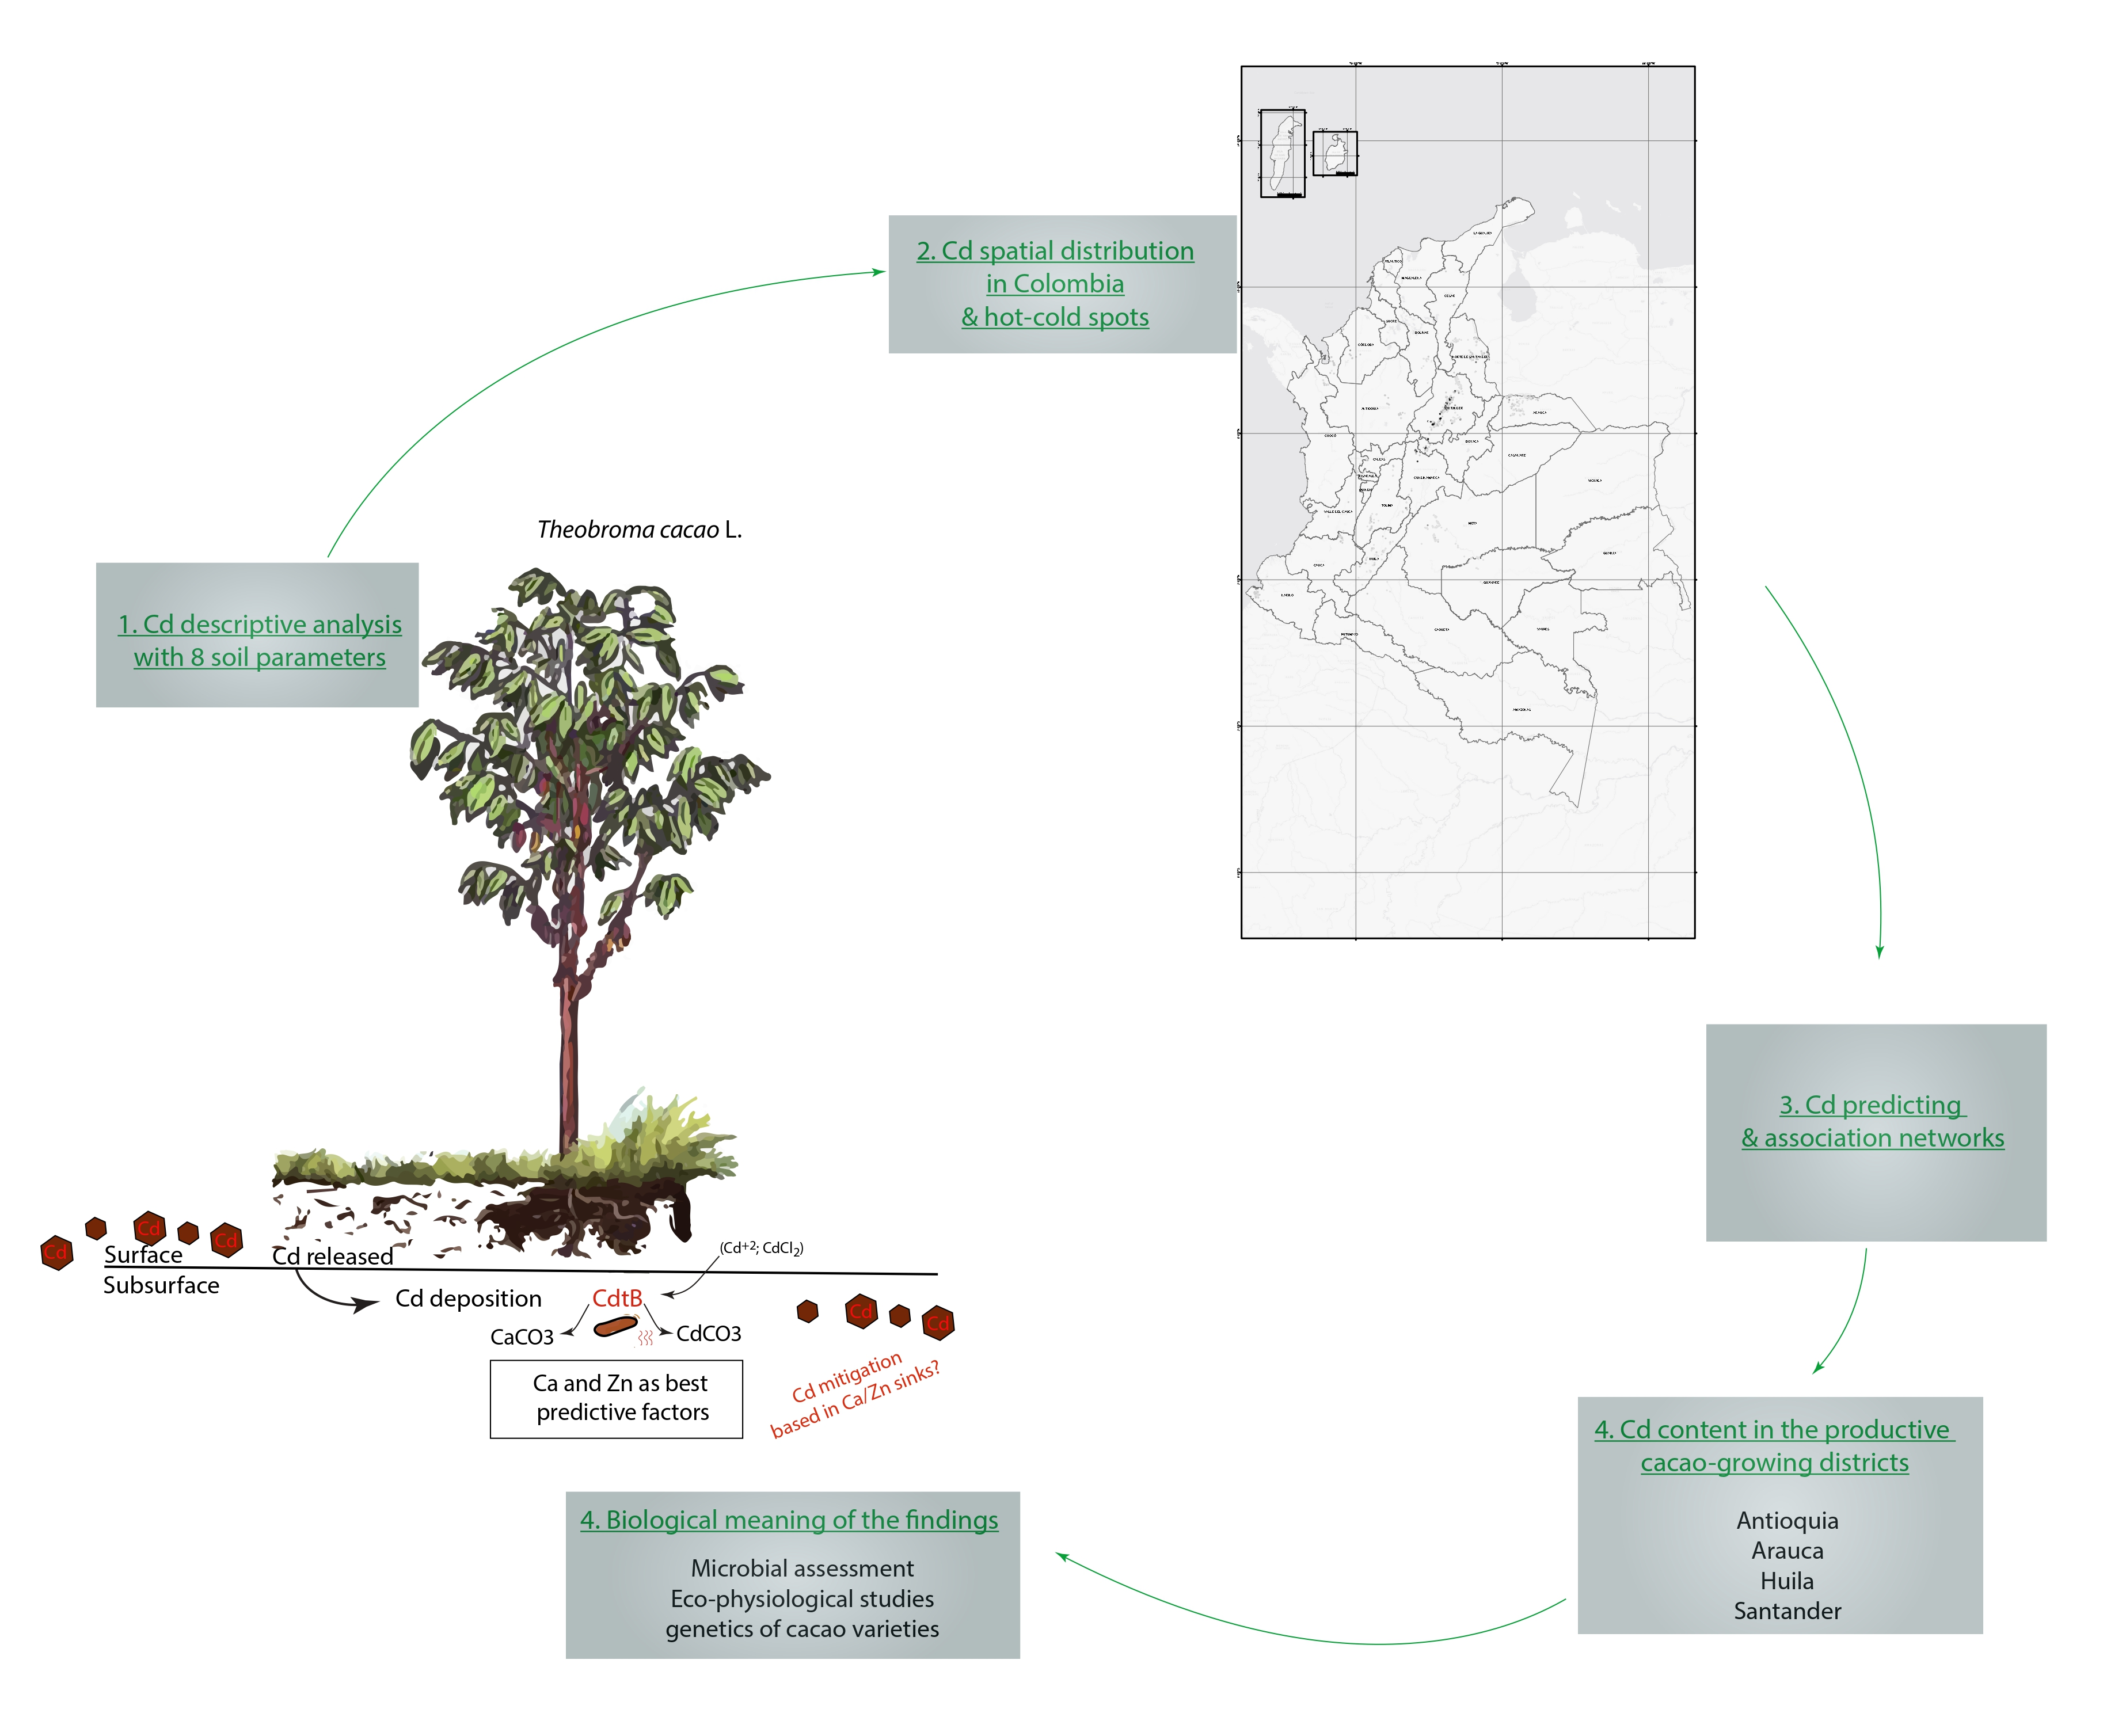
1. Introduction
2. Materials and Methods
2.1. Sampling Design
2.2. Soil Type Description
2.3. Chemical Analysis
2.4. Database Setting and Editing
2.5. Data Analysis
2.5.1. Descriptive Analysis
2.5.2. Ability of Soil Parameters to Predict Cd Content
2.5.3. Estimation of Association Networks
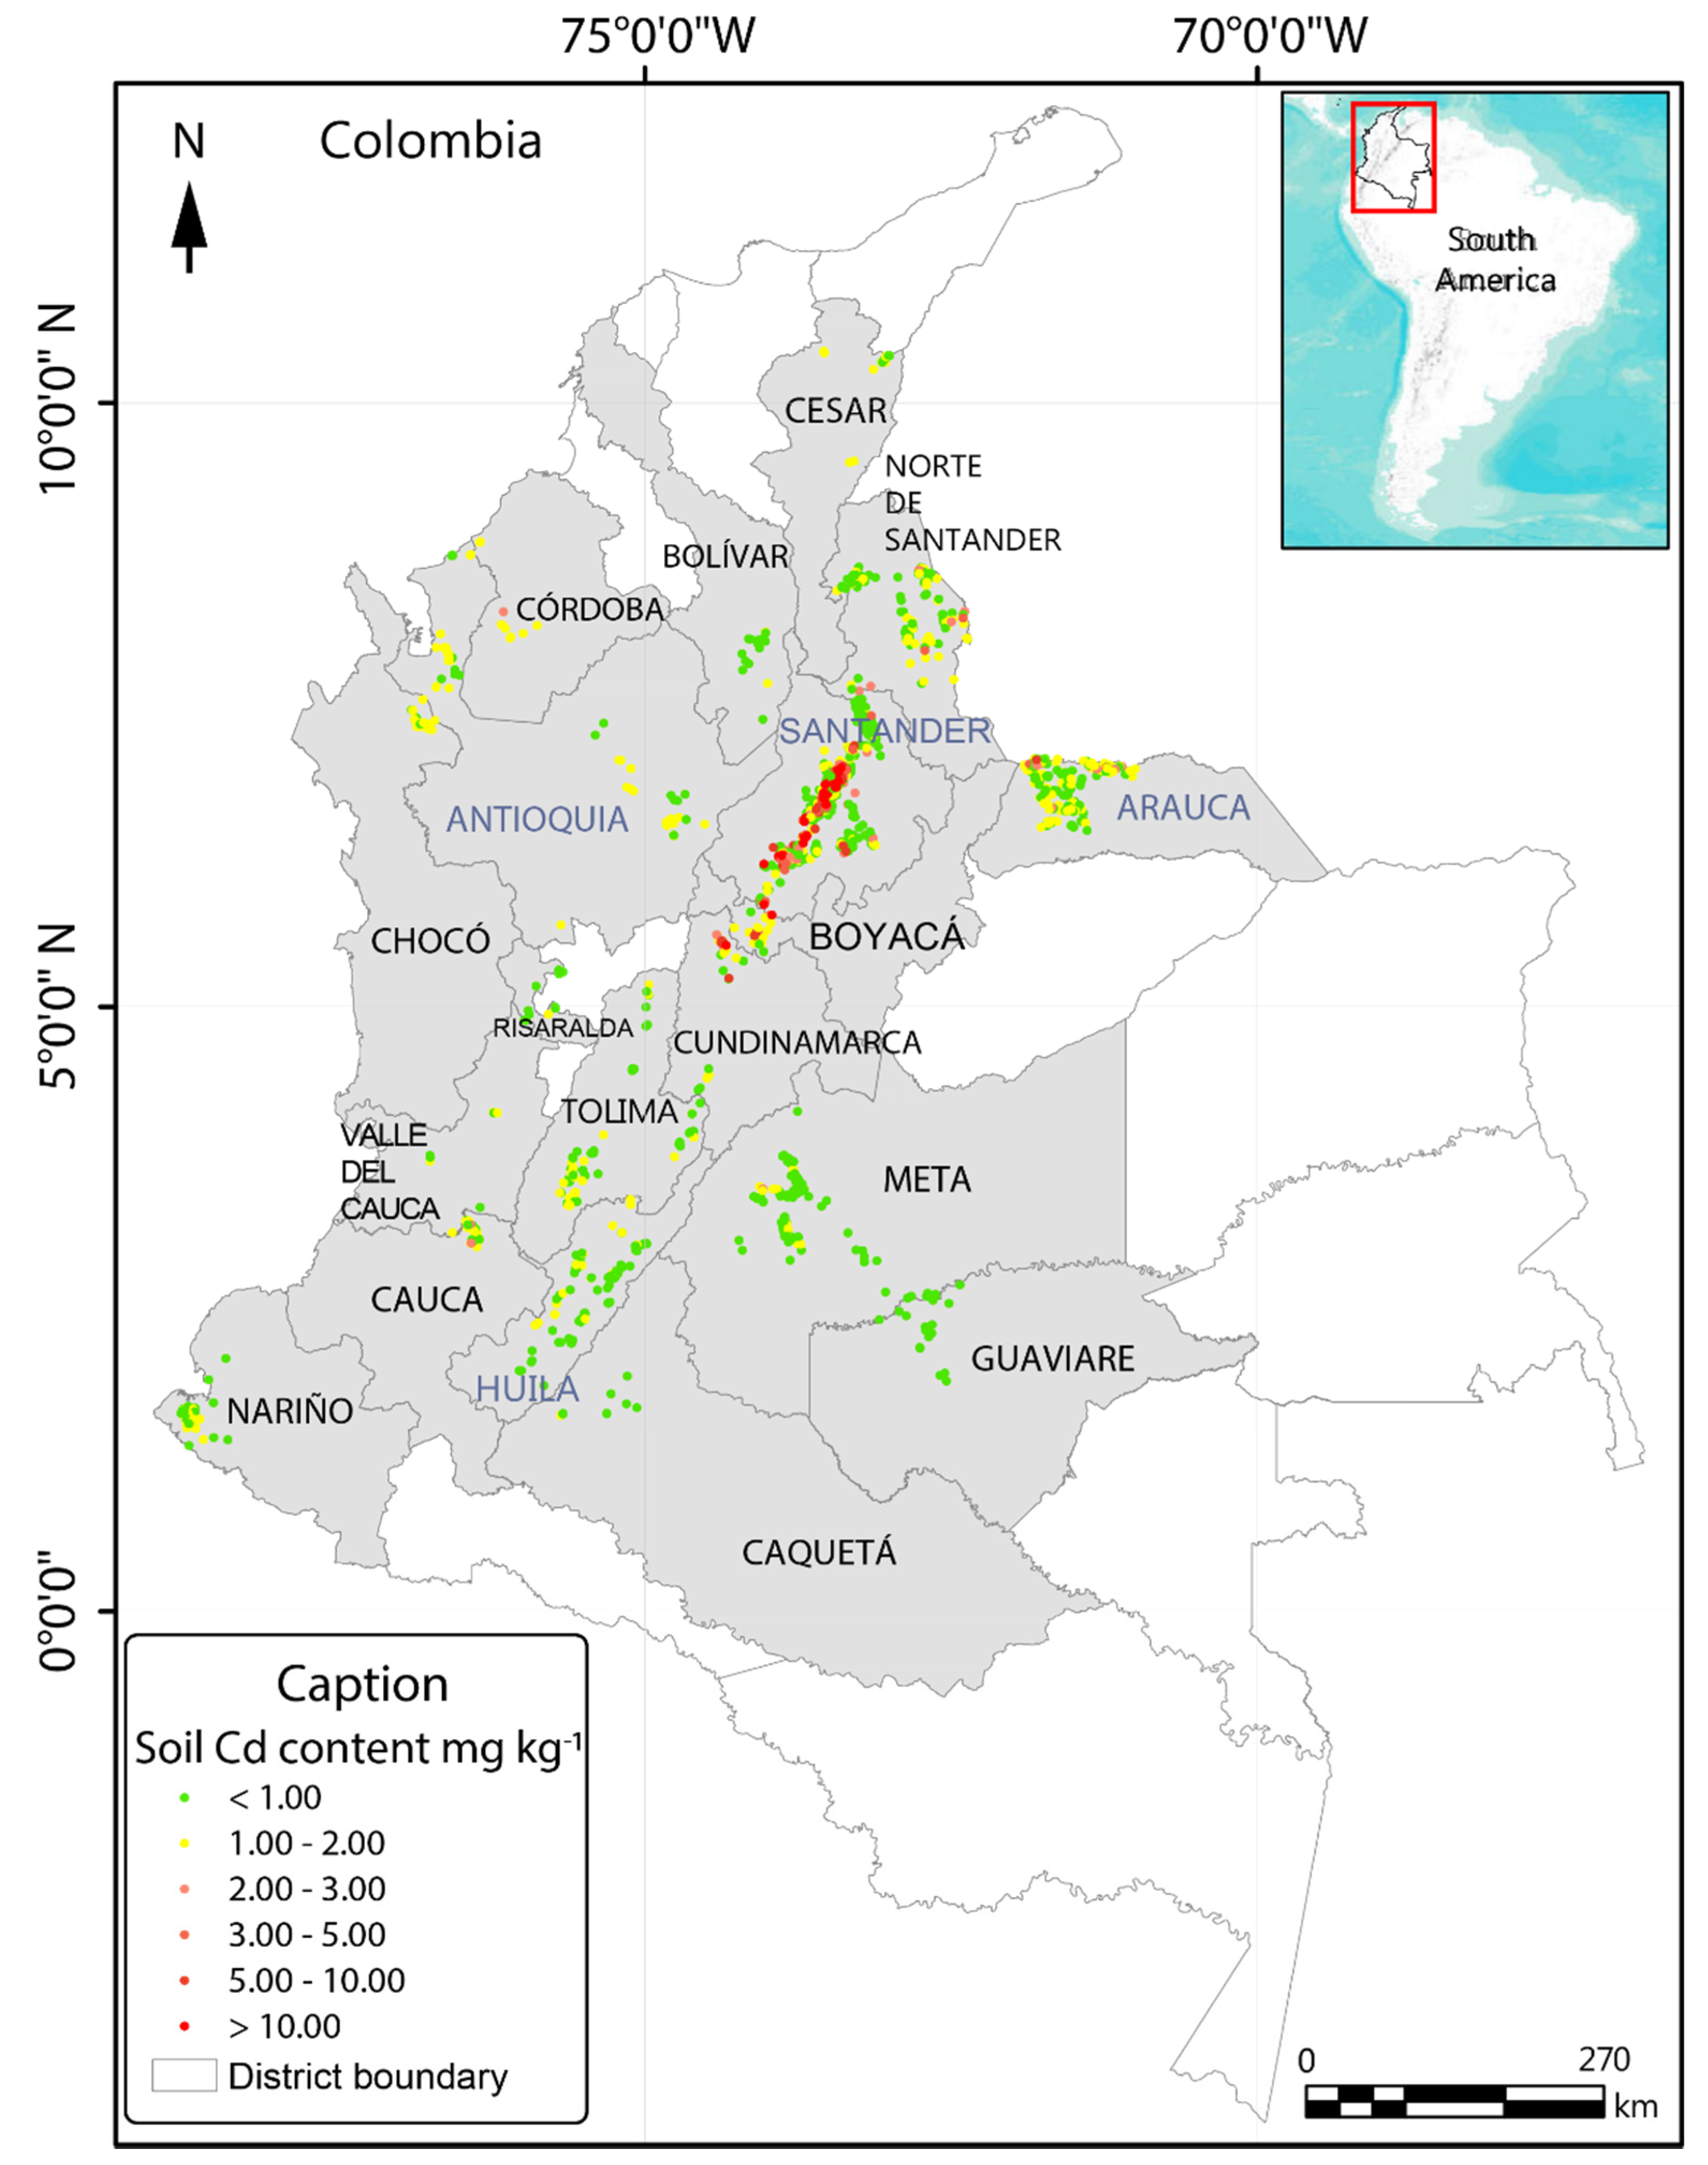
2.6. Cd Distribution Assessment in Cacao-Growing Soils
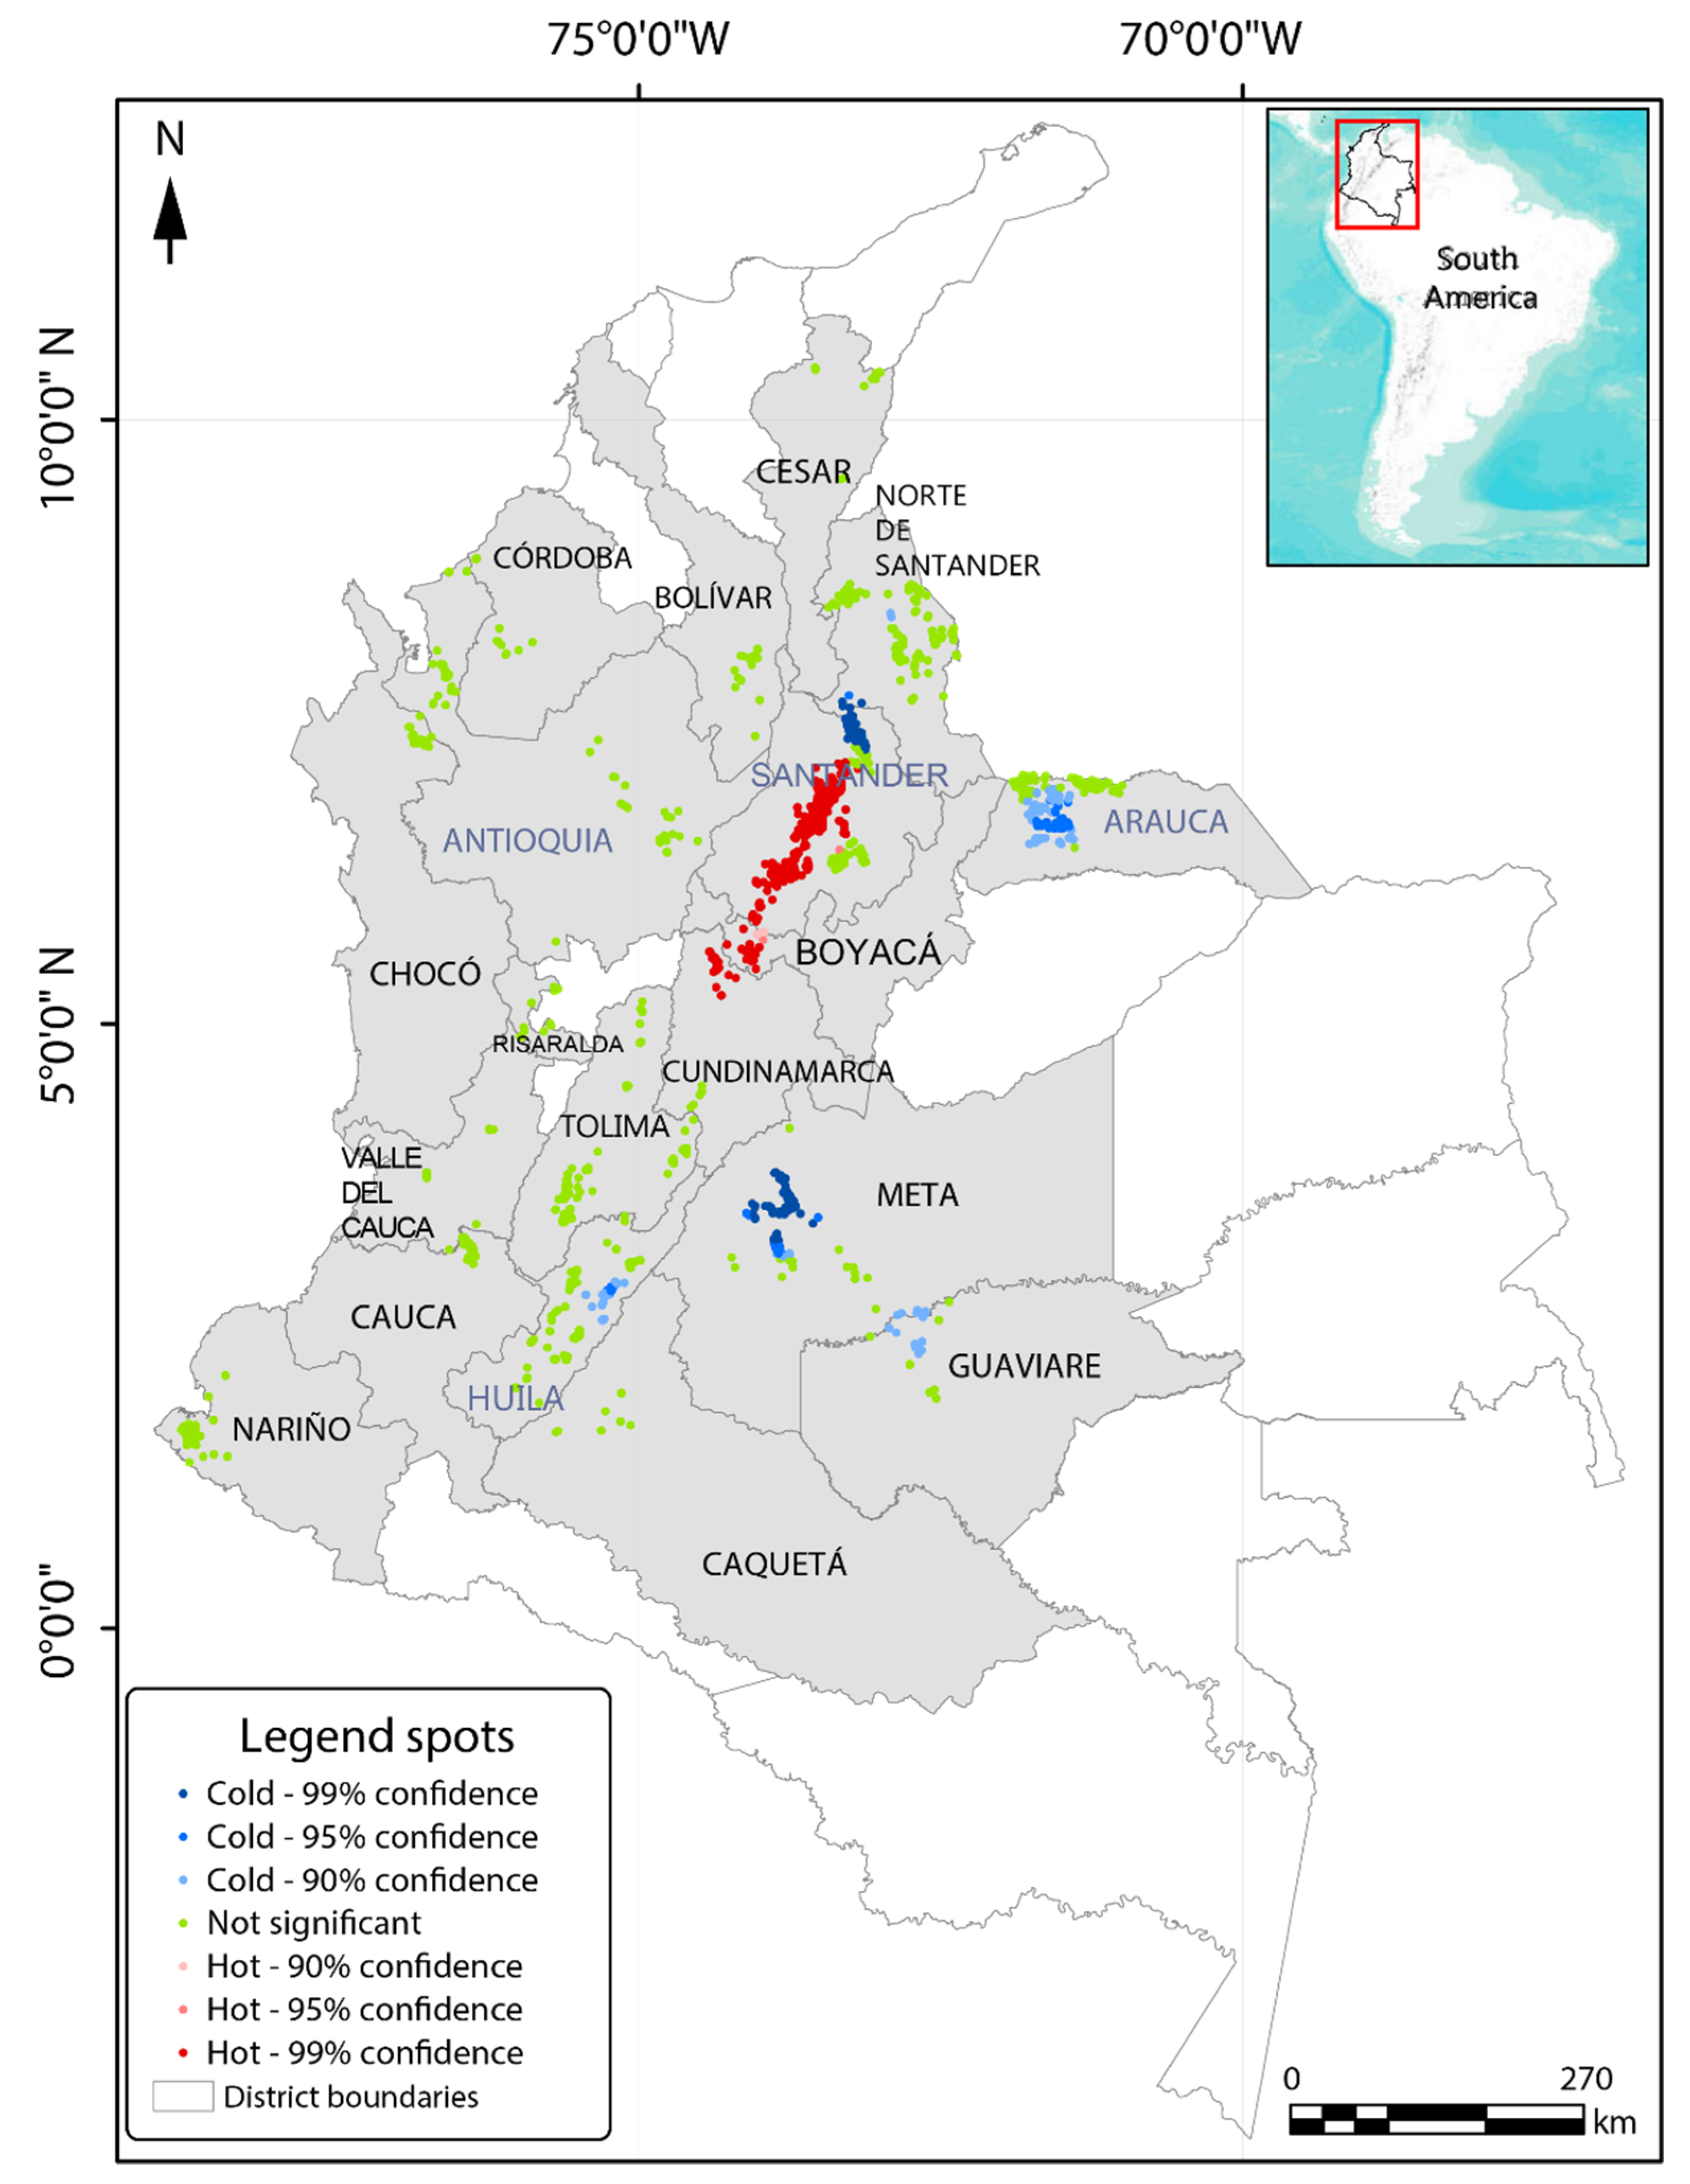
2.6.1. Distribution of Hotspots and Coldspots
2.6.2. Analyzing the Main Cacao-Producing Districts by Cold/Hotspots
3. Results
3.1. Descriptive Analysis of the Soil Samples
3.2. Ability of Soil Parameters to Predict Cd Content
Estimation of Association Networks
3.3. Analyzing the Cd Distribution by Hotspot and Coldspot
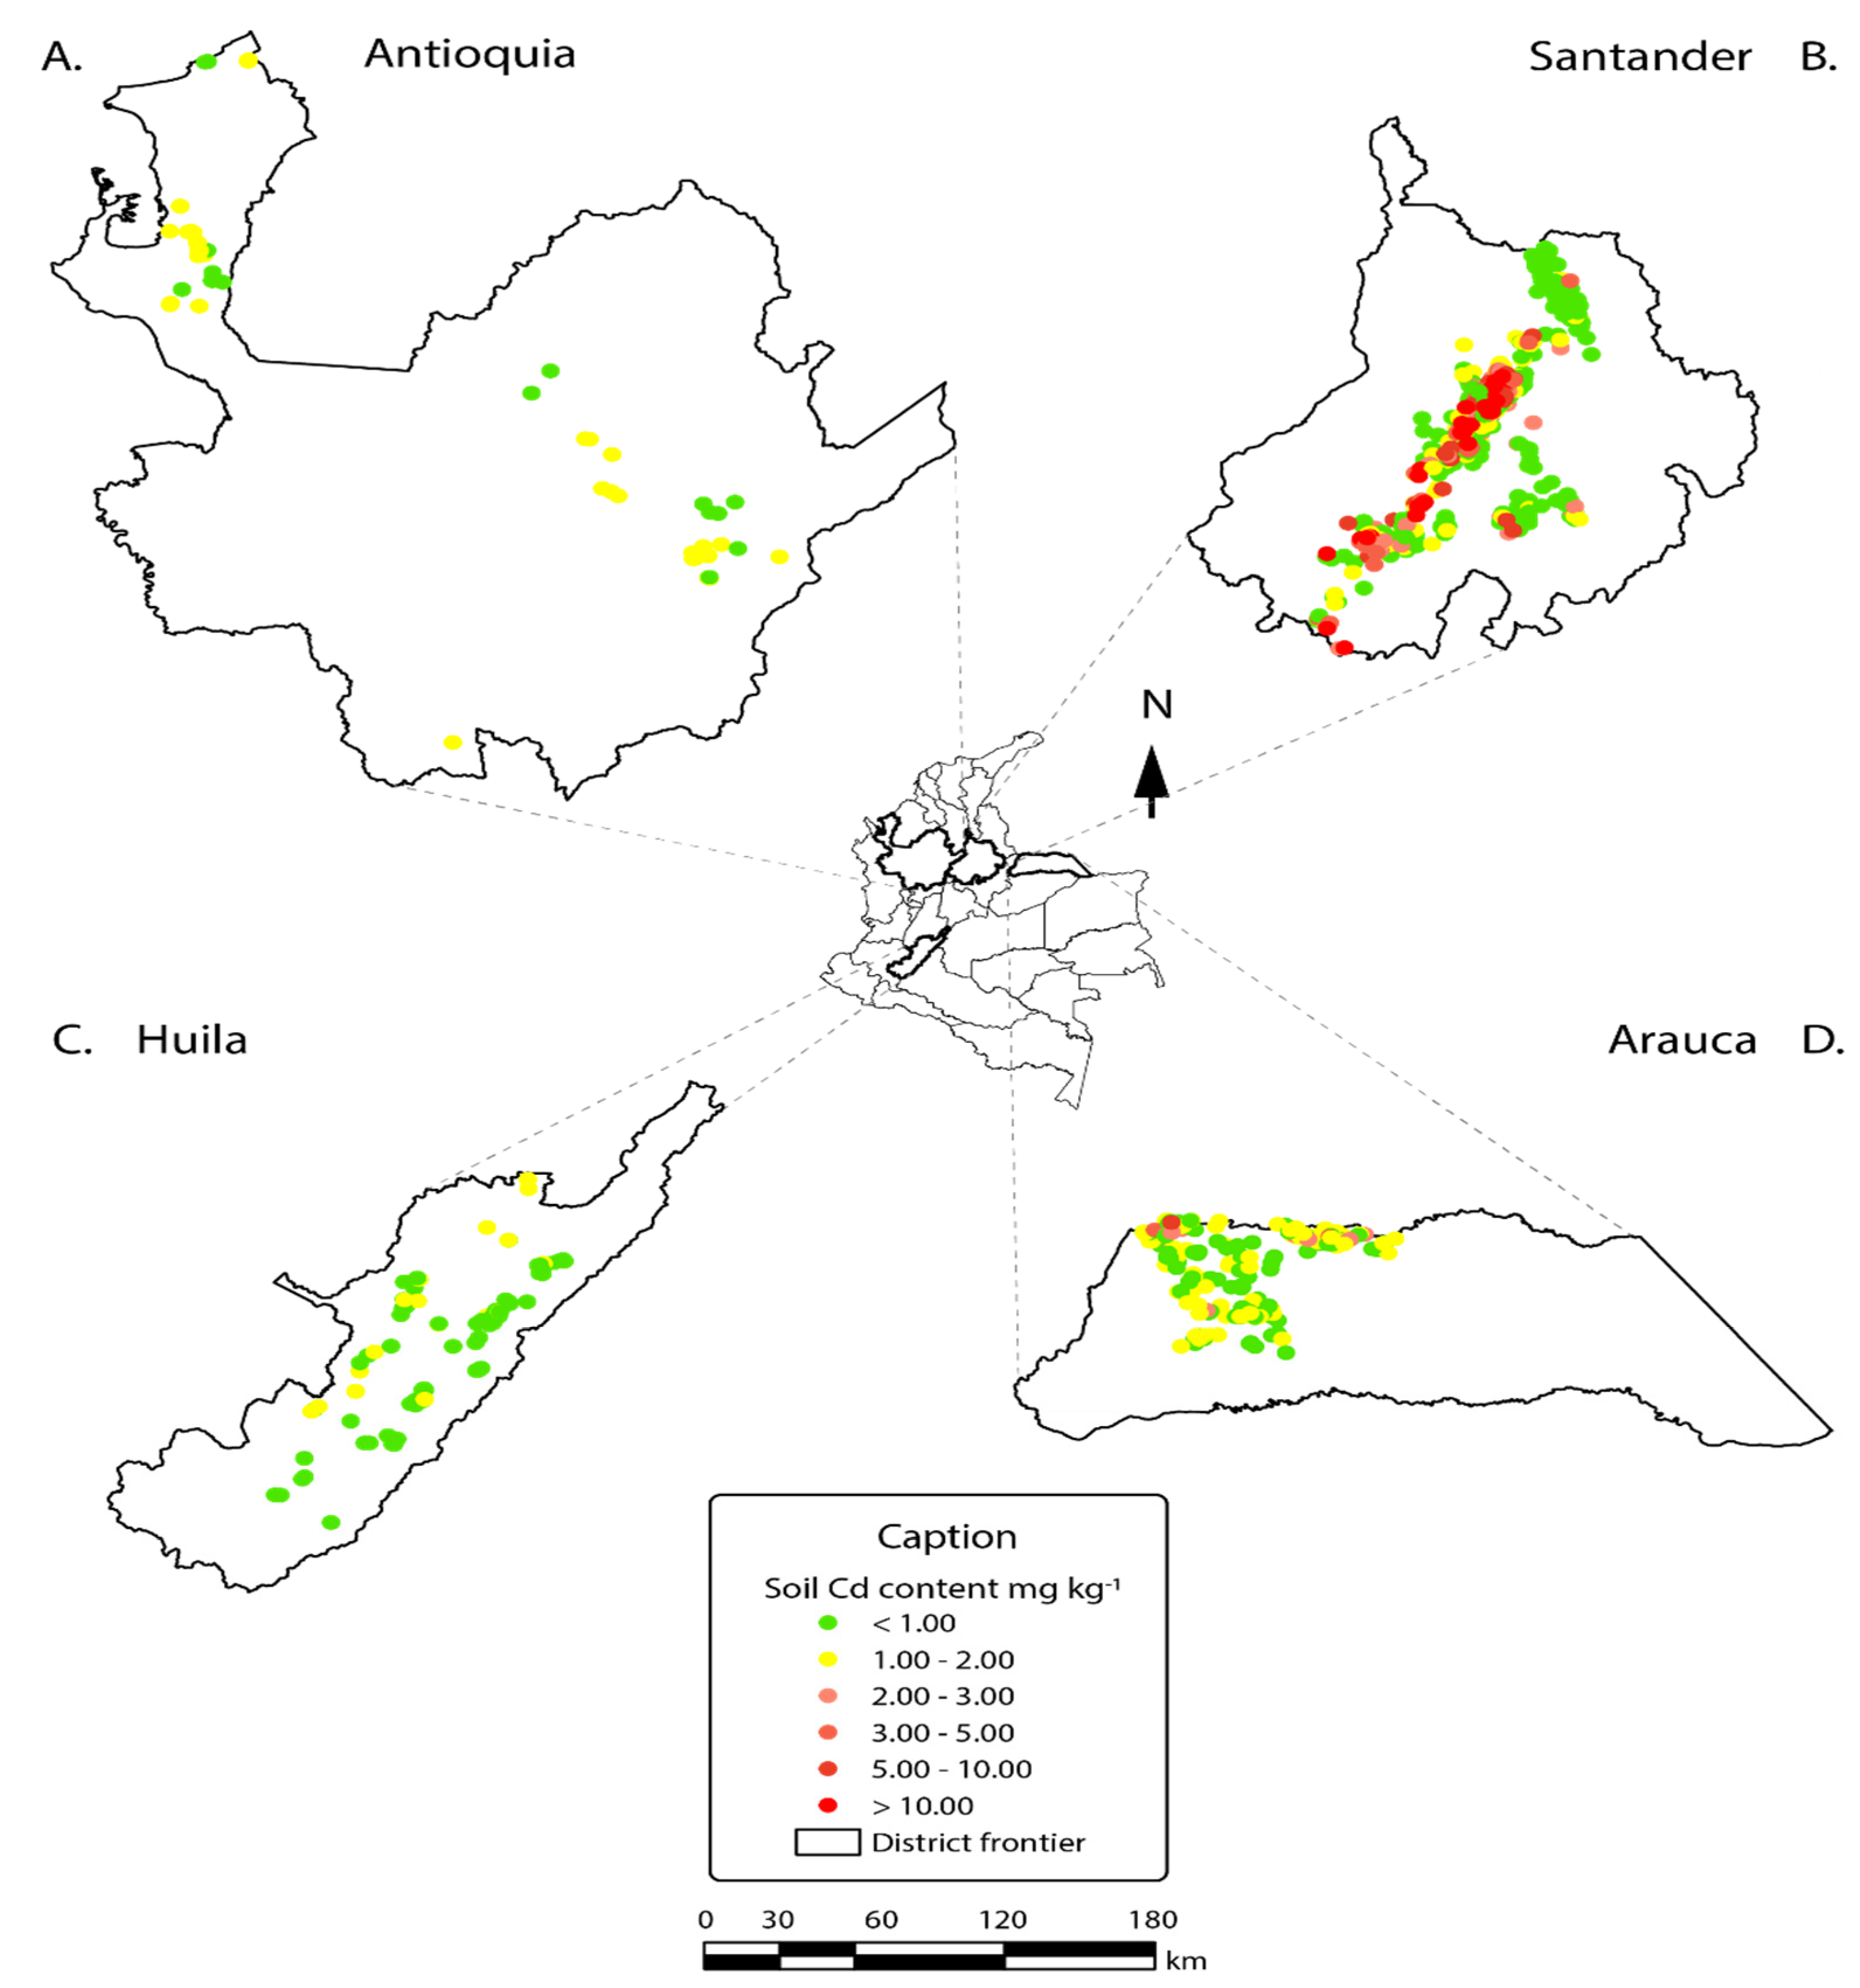
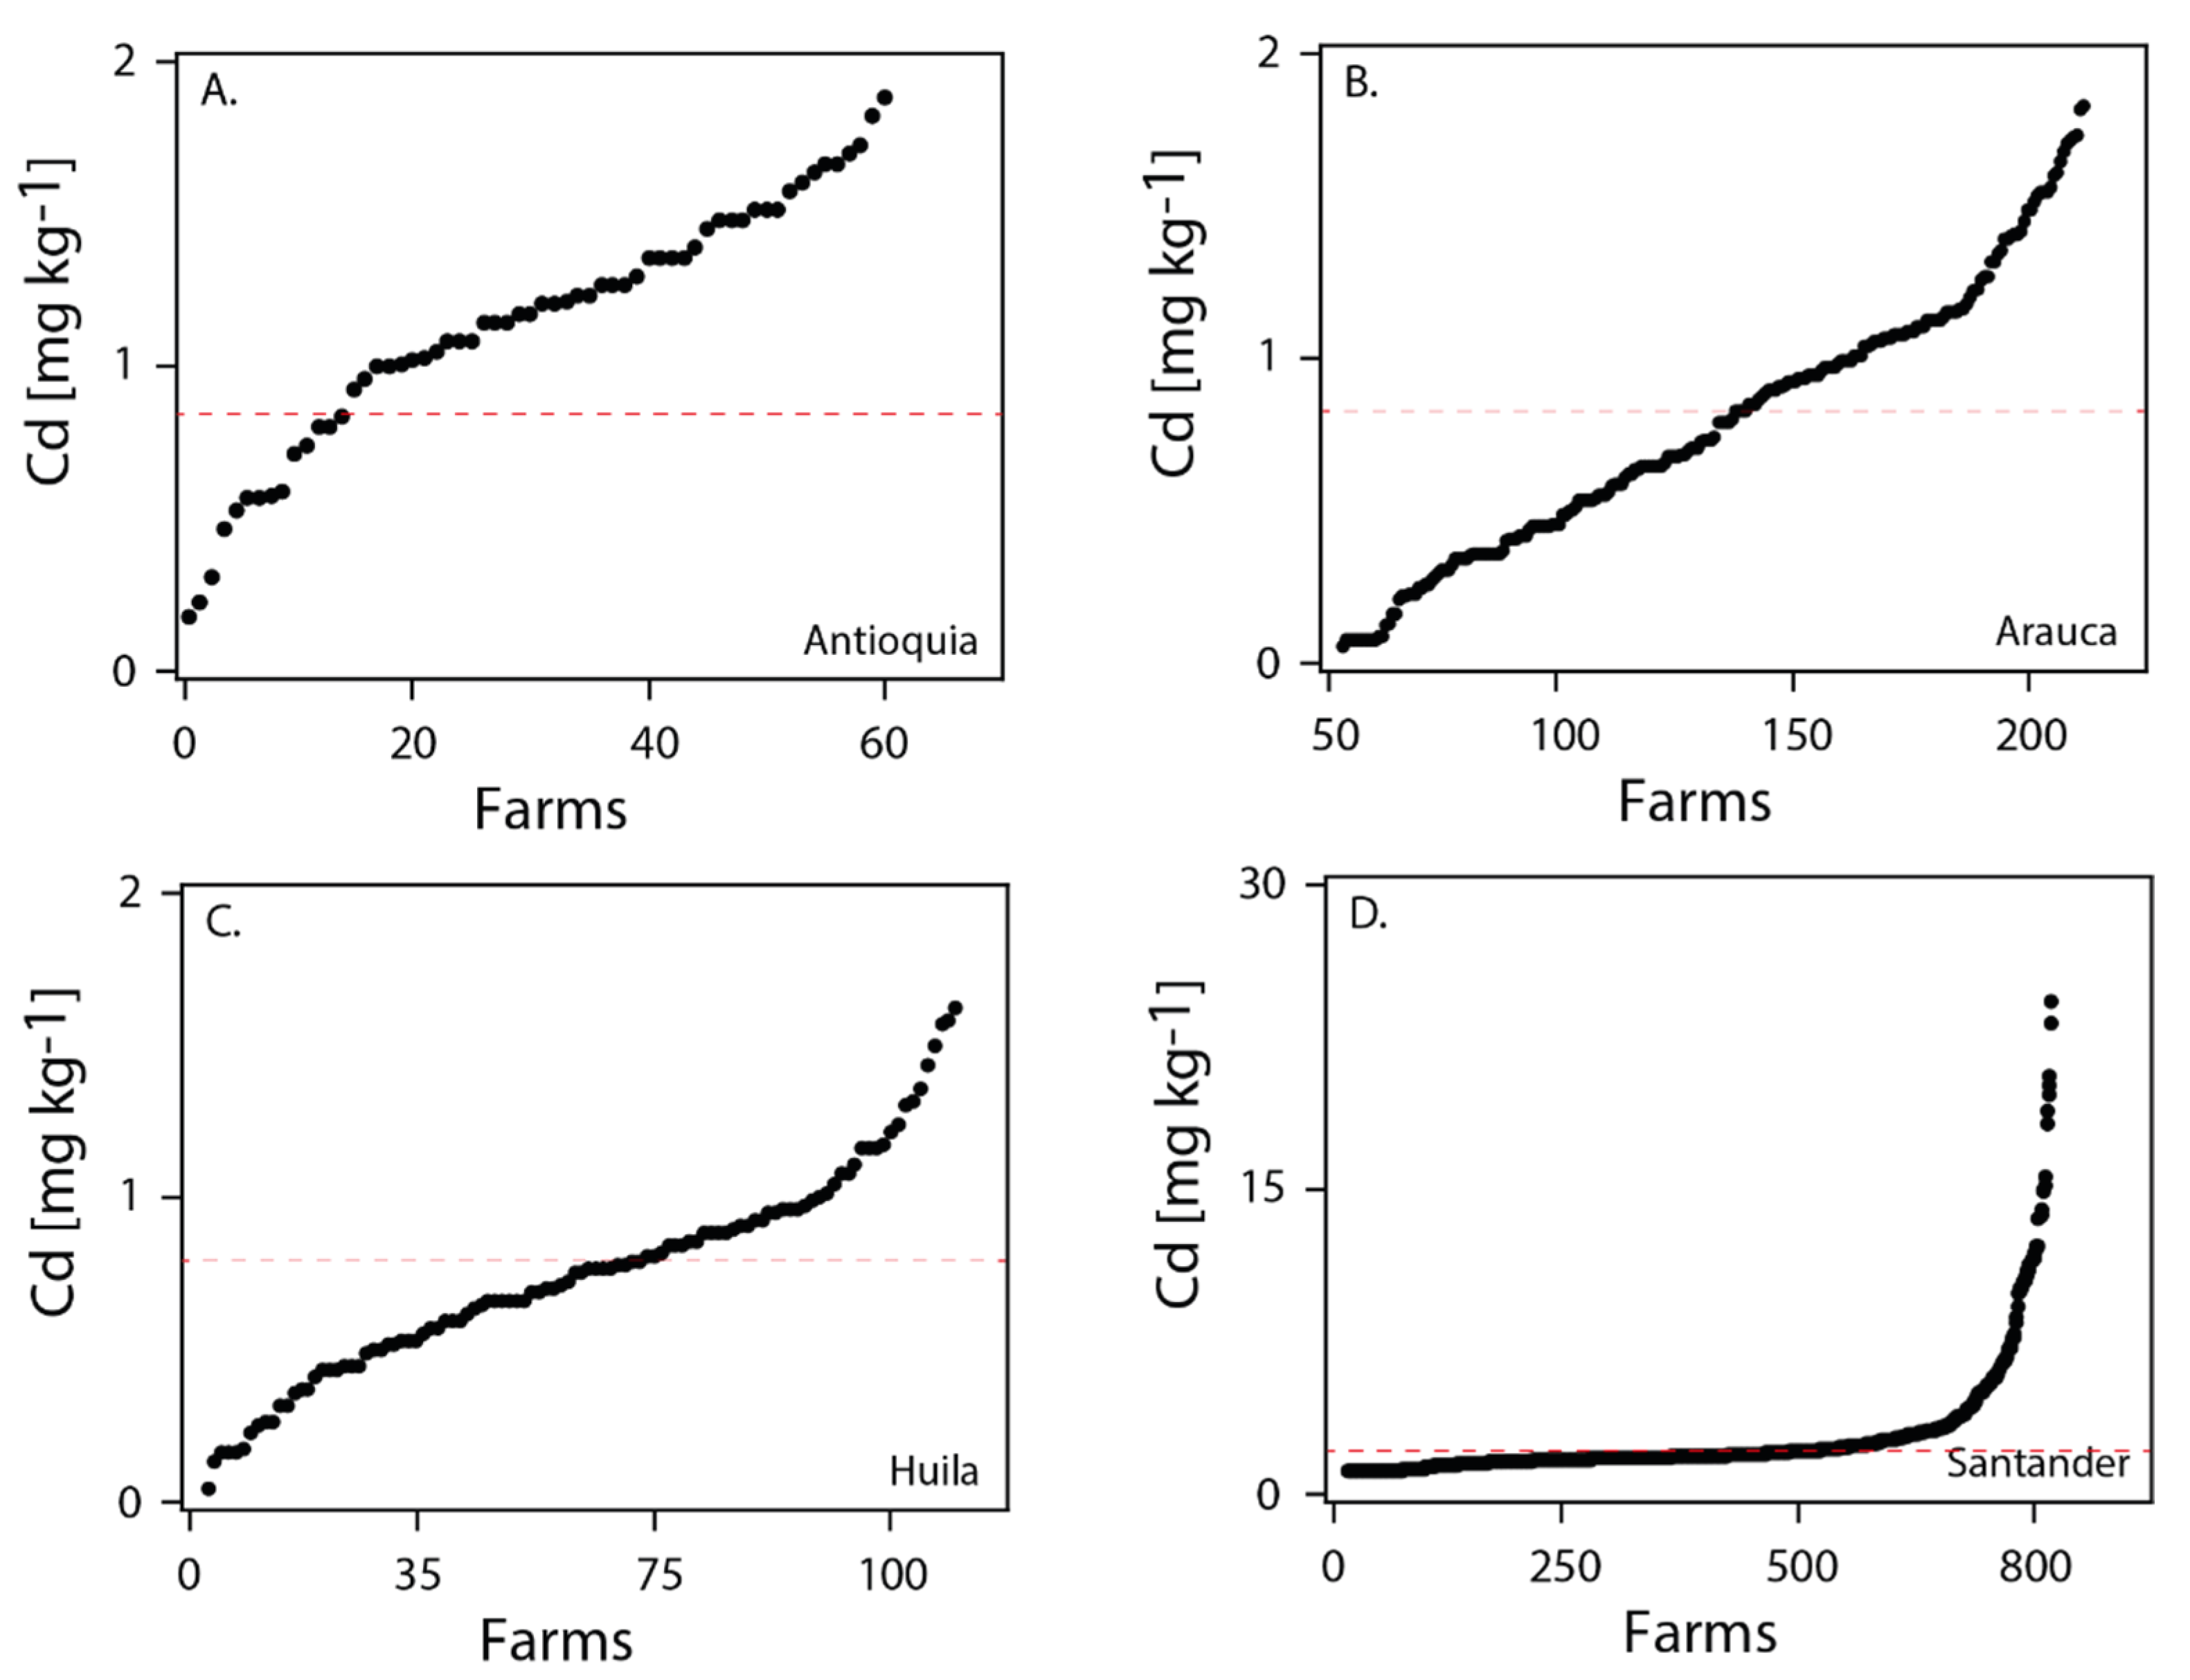
3.4. Pseudototal Cd Content in the Productive Cacao-Growing Districts in Colombia
4. Discussion
4.1. Ability of Soil Parameters to Predict Cd Content
4.2. Estimation of Association Networks
4.3. Biological Meaning of the Findings
5. Conclusions
Supplementary Materials
Author Contributions
Funding
Acknowledgments
Conflicts of Interest
References
- Wieczorek, J.; Baran, A.; Urbański, K.; Mazurek, R.; Klimowicz-Pawlas, A. Assessment of the pollution and ecological risk of lead and cadmium in soils. Environ. Geochem. Health 2018, 40, 2325–2342. [Google Scholar] [CrossRef]
- Tavakoli, M.; Hojjati, S.M.; Kooch, Y. Lead and cadmium spatial pattern and risk assessment around coal mine in Hyrcanian forest, north Iran. Int. J. Environ. Eng. 2019, 13, 199–202. [Google Scholar]
- Argüello, D.; Chavez, E.; Lauryssen, F.; Vanderschueren, R.; Smolders, E.; Montalvo, D. Soil properties and agronomic factors affecting cadmium concentrations in cacao beans: A nationwide survey in Ecuador. Sci. Total Environ. 2019, 649, 120–127. [Google Scholar] [CrossRef] [PubMed]
- Bravo, D.; Benavides-Erazo, J. The use of a two-dimensional electrical resistivity tomography (2D-ERT) as a technique for cadmium determination in cacao crop soils. Appl. Sci. 2020, 10, 4149. [Google Scholar] [CrossRef]
- Gramlich, A.; Tandy, S.; Gauggel, C.; López, M.; Perla, D.; Gonzalez, V.; Schulin, R. Soil cadmium uptake by cocoa in Honduras. Sci. Total Environ. 2018, 612, 370–378. [Google Scholar] [CrossRef] [PubMed]
- Khan, M.A.; Khan, S.; Khan, A.; Alam, M. Soil contamination with cadmium, consequences and remediation using organic amendments. Sci. Total Environ. 2017, 601–602, 1591–1605. [Google Scholar] [CrossRef]
- EU. Commission Regulation (EU) No 488/2014 of 12 May 2014 Amending Regulation (EC) No 1881/2006 as Regards Maximum Levels of Cadmium in Foodstuffs; European Commission: Brussels, Belgium, 2014; Volume 488, p. 2014. [Google Scholar]
- Alloway, B.J.; Steinnes, E. Anthropogenic additions of cadmium to soils. In Cadmium in Soils and Plants; McLaughlin, M.J., Singh, B.R., Eds.; Springer: Dordrecht, The Netherlands, 1999; pp. 97–123. [Google Scholar] [CrossRef]
- Codex Alimentarius Commission. Joint FAO/WHO Food Standards Program Codex Committee on Food Import and Export Inspection and Certification Systems; Discussion Paper on the Need for Further Guidance on Traceability/Product: 2007; Codex Alimentarius Commission: Rome, Italy, 2007. [Google Scholar]
- Bravo, D.; Pardo-Díaz, S.; Benavides-Erazo, J.; Rengifo-Estrada, G.; Braissant, O.; Leon-Moreno, C. Cadmium and cadmium-tolerant soil bacteria in cacao crops from northeastern Colombia. J. Appl. Microbiol. 2018, 124, 1175–1194. [Google Scholar] [CrossRef] [PubMed]
- Christensen, T.H.; Haung, P.M. Solid phase cadmium and the reactions of aqueous cadmium with soil surfaces. In Cadmium in Soils and Plants; McLaughlin, M.J., Singh, B.R., Eds.; Springer: Dordrecht, The Netherlands, 1999; pp. 65–96. [Google Scholar] [CrossRef]
- Barraza, F.; Moore, R.E.T.; Rehkämper, M.; Schreck, E.; Lefeuvre, G.; Kreissig, K.; Coles, B.J.; Maurice, L. Cadmium isotope fractionation in the soil–cacao systems of Ecuador: A pilot field study. RSC Adv. 2019, 9, 34011–34022. [Google Scholar] [CrossRef]
- He, Z.L.; Xu, H.P.; Zhu, Y.M.; Yang, X.E.; Chen, G.C. Adsorption—Desorption characteristics of cadmium in variable charge soils. J. Environ. Sci. Health A Toxic Hazard. Subst. Environ. Eng. 2005, 40, 805–822. [Google Scholar] [CrossRef]
- Irfan, M.; Hayat, S.; Ahmad, A.; Alyemeni, M.N. Soil cadmium enrichment: Allocation and plant physiological manifestations. Saudi J. Biol. Sci. 2013, 20, 1–10. [Google Scholar] [CrossRef]
- Arévalo-Gardini, E.; Canto, M.; Alegre, J.; Arévalo-Hernández, C.O.; Loli, O.; Julca, A.; Baligar, V. Cacao agroforestry management systems effects on soil fungi diversity in the peruvian Amazon. Ecol. Indic. 2020, 115, 1–11. [Google Scholar] [CrossRef]
- Qiu, M.; Yuan, C.; Yin, G. Effect of terrain gradient on cadmium accumulation in soils. Geoderma 2020, 375, 1–9. [Google Scholar] [CrossRef]
- Naidu, R.; Bolan, N.S.; Kookana, R.S.; Tiller, K.G. Ionic-strength and pH effects on the sorption of cadmium and the surface charge of soils. Eur. J. Soil Sci. 1994, 45, 419–429. [Google Scholar] [CrossRef]
- Grant, C.A.; Bailey, L.D.; Mclaughlin, M.J.; Singh, B.R. Management factors which influence cadmium concentrations in crops. In Cadmium in Soils and Plants; McLaughlin, M.J., Singh, B.R., Eds.; Springer: Dordrecht, The Netherlands, 1999; pp. 151–198. [Google Scholar] [CrossRef]
- Kirkham, M.B. Cadmium in plants on polluted soils: Effects of soil factors, hyperaccumulation, and amendments. Geoderma 2006, 137, 19–32. [Google Scholar] [CrossRef]
- Mongkhonsin, B.; Nakbanpote, W.; Meesungnoen, O.; Prasad, M.N.V. Chapter 4—Adaptive and tolerance mechanisms in herbaceous plants exposed to cadmium. In Cadmium Toxicity and Tolerance in Plants; Hasanuzzaman, M., Prasad, M.N.V., Fujita, M., Eds.; Academic Press: Cambridge, MA, USA, 2019; pp. 73–109. [Google Scholar] [CrossRef]
- Pereira de Araújo, R.; Furtado de Almeida, A.-A.; Silva Pereira, L.; Mangabeira, P.A.O.; Olimpio Souza, J.; Pirovani, C.P.; Ahnert, D.; Baligar, V.C. Photosynthetic, antioxidative, molecular and ultrastructural responses of young cacao plants to Cd toxicity in the soil. Ecotoxicol. Environ. Saf. 2017, 144, 148–157. [Google Scholar] [CrossRef] [PubMed]
- Mourato, M.; Pinto, F.; Moreira, I.; Sales, J.; Leitão, I.; Martins, L.L. The effect of Cd stress in mineral nutrient uptake in plants. In Cadmium Toxicity and Tolerance in Plants; Hasanuzzaman, M., Prasad, M.N.V., Fujita, M., Eds.; Academic Press: Cambridge, MA, USA, 2019; pp. 327–348. [Google Scholar] [CrossRef]
- Bishop, C.M. Pattern Recognition and Machine Learning; Springer: New York, NY, USA, 2006; p. 738. [Google Scholar]
- Ver Hoef, J. Sampling and geostatistics for spatial data. Ecoscience 2002, 9, 152–161. [Google Scholar] [CrossRef]
- FEDECACAO. Departamento de Estadística y Recaudos; Report of February 2020; Online Version: Nelsy Yanira Alvarado; Federación Nacional de Cacaoteros: Bogotá, Colombia, 2020; Available online: https://www.fedecacao.com.co/portal/index.php/es/2015-2002-2012-2017-2020-2059/nacionales (accessed on 2 December 2020).
- Almeida, A.-A.F.D.; Valle, R.R. Ecophysiology of the cacao tree. Braz. J. Plant Physiol. 2007, 19, 425–448. [Google Scholar] [CrossRef]
- Staff, S. Keys to Soil Taxonomy, 12th ed.; USDA, Natural Resources Conservation Service, United States Department of Agriculture: Washington, DC, USA, 2014; Volume 1. [Google Scholar]
- Chavez, E.; He, Z.L.; Stoffella, P.J.; Mylavarapu, R.S.; Li, Y.C.; Moyano, B.; Baligar, V.C. Concentration of cadmium in cacao beans and its relationship with soil cadmium in southern Ecuador. Sci. Total Environ. 2015, 533, 205–214. [Google Scholar] [CrossRef] [PubMed]
- Lorentzen, E.M.L.; Kingston, H.M.S. Comparison of microwave-assisted and conventional leaching using EPA method 3050B. Anal. Chem. 1996, 68, 4316–4320. [Google Scholar] [CrossRef]
- Łukowski, A.; Olejniczak, J.I. Fractionation of cadmium, lead and copper in municipal solid waste incineration bottom ash. J. Ecol. Eng. 2020, 21, 1–5. [Google Scholar] [CrossRef]
- Scaccabarozzi, D.; Castillo, L.; Aromatisi, A.; Milne, L.; Búllon Castillo, A.; Muñoz-Rojas, M. Soil, site, and management factors affecting cadmium concentrations in cacao-growing soils. Agronomy 2020, 10, 806. [Google Scholar] [CrossRef]
- Mehlich, A. New extractant for soil test evaluation of phosphorus, potassium, magnesium, calcium, sodium, manganese and zinc. Commun. Soil Sci. Plant 1978, 9, 477–492. [Google Scholar] [CrossRef]
- Shuman, L.M.; Duncan, R.R. Soil exchangeable cations and aluminum measured by ammonium chloride, potassium chloride, and ammonium acetate. Commun. Soil Sci. Plant 1990, 21, 1217–1228. [Google Scholar] [CrossRef]
- Bray, R.H.; Kurtz, L.T. Determination of total, organic, and available forms of phosphorus in soils. Soil Sci. 1945, 59, 39–46. [Google Scholar] [CrossRef]
- Rodríguez-Garay, F.A.; Camacho-Tamayo, J.H.; Rubiano-Sanabria, Y. Spatial variability of the chemical properties of the soil in the coffee yield and quality. Cienc. Tecnol. Agropecu. 2016, 17, 237–254. [Google Scholar]
- Hastie, T.; Tibshirani, R.; Friedman, J. The Elements of Statistical Learning: Data Mining, Inference, and Prediction; Springer Science & Business Media: Berlin, Germany, 2009. [Google Scholar] [CrossRef]
- Khare, K.; Oh, S.Y.; Rajaratnam, B. A convex pseudolikelihood framework for high dimensional partial correlation estimation with convergence guarantees. J. R. Stat. Soc. B 2015, 77, 803–825. [Google Scholar] [CrossRef]
- R-core_Team. R: A Language and Environment for Statistical Computing; R Foundation for Statistical Computing: Viena, Austria, 2020. [Google Scholar]
- Getis, A.; Ord, J.K. The Analysis of Spatial Association by Use of Distance Statistics. Geogr. Anal. 1992, 24, 189–206. [Google Scholar] [CrossRef]
- Peeters, A.; Zude, M.; Käthner, J.; Ünlü, M.; Kanber, R.; Hetzroni, A.; Gebbers, R.; Ben-Gal, A. Getis Ord’s hot and cold spot statistics as a basis for multivariate spatial clustering of orchard tree data. Comput. Electron. Agric. 2015, 111, 140–150. [Google Scholar] [CrossRef]
- Ministry of the Environment Finland. Government Decree on the Assessment of Soil Contamination and Remediation Needs (214/2007); Ministry of the Environment Helsinki: Helsinki, Finland, 2007. [Google Scholar]
- Provoost, J.; Cornelis, C.; Swartjes, F. Comparison of soil clean-up standards for trace elements between countries: Why do they differ? J. Soils Sediments 2006, 6, 173–181. [Google Scholar] [CrossRef]
- Van der Voet, E. Environmental Risks and Challenges of Anthropogenic Metals Flows and Cycles; Report 3 of the Global Metal Flows Working Group of the International Resource Panel of UNEP; United Nations Environment Program: Paris, France, 2013; Volume 1, pp. 1–234. [Google Scholar]
- Tóth, G.; Hermann, T.; Da Silva, M.R.; Montanarella, L. Heavy metals in agricultural soils of the European Union with implications for food safety. Environ. Int. 2016, 88, 299–309. [Google Scholar] [CrossRef]
- Carlón, C. Derivation methods of soil screening values in Europe. In A Review and Evaluation of National Procedures towards Harmonization; European Commission, Ed.; Joint Research Centre Ispra: Ispra, Italy, 2007; pp. 1–306. [Google Scholar]
- Fadigas, F.D.S.; Sobrinho, N.M.B.D.A.; Mazur, N.; Cunha dos Anjos, L.H. Estimation of reference values for cadmium, cobalt, chromium, copper, nickel, lead, and zinc in Brazilian soils. Commun. Soil Sci. Plant 2006, 37, 945–959. [Google Scholar] [CrossRef]
- Rodríguez Albarrcín, H.S.; Darghan Contreras, A.E.; Henao, M.C. Spatial regression modeling of soils with high cadmium content in a cocoa producing area of central Colombia. Geoderma Reg. 2019, 16, 1–13. [Google Scholar] [CrossRef]
- Nogueira, T.A.R.; Abreu-Junior, C.H.; Alleoni, L.R.F.; He, Z.; Soares, M.R.; Santos Vieira, C.D.; Lessa, L.G.F.; Capra, G.F. Background concentrations and quality reference values for some potentially toxic elements in soils of São Paulo State, Brazil. J. Environ. Manag. 2018, 221, 10–19. [Google Scholar] [CrossRef] [PubMed]
- Nagajyoti, P.C.; Lee, K.D.; Sreekanth, T. Heavy metals, occurrence and toxicity for plants: A review. Environ. Chem. Lett. 2010, 8, 199–216. [Google Scholar] [CrossRef]
- Kabata-Pendias, A. (Ed.) Trace Elements in Soils and Plants; CRC Press: Boca Raton, FL, USA, 2010; Volume 4, p. 520. [Google Scholar]
- IDEAM. Estudio Nacional del Agua 2014; IDEAM: Bogota, Colombia, 2015; pp. 1–70. [Google Scholar]
- Centro de Productividad y Competitividad del Oriente, CPC. Caracterización de la Producción de Cacao en Santander y Análisis de la Presencia de Cadmio en Suelos y Cultivos: Informe Técnico Proyecto Determinar el Origen y Las Posibles Causas de Contaminación de Cadmio y su Distribución en 6 Municipios Productores de Cacao (Theobrama cacao L.) del Departamento de Santander; CPC, Ed.; Corpoica: Santander, Colombia; Bucaramanga, Colombia, 2014; Volume 1, pp. 1–66. [Google Scholar]
- SGC. Atlas Geoquímico de Colombia—Distribución por Técnicas de Descomposición de la Muestra; SGC: Boca Raton, FL, USA, 2019; Volume 1, p. 70. [Google Scholar]
- Montaño, P.C.; Nova, G.; Bayona, G.; Mahecha, H.; Ayala, C.; Jaramillo, C.; De La Parra, F. Análisis de secuencias y procedencia en sucesiones sedimentarias de grano fino: Un ejemplo de la formación Umir y base de la formación Lisama, en el sector de Simacota (Santander, Colombia). Boletín Geología 2016, 38, 51–72. [Google Scholar] [CrossRef]
- Morales, W.; Carmona, I. Estudio de algunos elementos traza en la cuenca Cesar-Ranchería, Colombia. Boletín Ciencias Tierra 2007, 20, 75–88. [Google Scholar]
- Lo, A.; Chernoff, H.; Zheng, T.; Lo, S.-H. Why significant variables aren’t automatically good predictors. Proc. Natl. Acad. Sci. USA 2015, 112, 13892–13897. [Google Scholar] [CrossRef]
- Peng, J.; Wang, P.; Zhou, N.; Zhu, J. Partial correlation estimation by joint sparse regression models. J. Am. Stat. Assoc. 2009, 104, 735–746. [Google Scholar] [CrossRef]
- Léon-Moreno, C.; Rojas, J.; Palencia, G.; Mantilla, J.; Mateus, H.; Castilla, C.; Romero, M.; Ramírez, L.E.; Alvaro, C. Contenido Total y Niveles de Disponibilidad de los Metales Pesados Cadmio, Mercurio, Arsenico y Plomo e Impacto Sobre la Calidad del Grano en Suelos Productores de Cacao (Theobroma cacao L.) de Colombia; Corpoica, Ed.; Corpoica: Bogota, Colombia, 2012; Volume 1, pp. 1–166. [Google Scholar]
- Romero-Estévez, D.; Yánez-Jácome, G.S.; Simbaña-Farinango, K.; Navarrete, H. Content and the relationship between cadmium, nickel, and lead concentrations in Ecuadorian cocoa beans from nine provinces. Food Control 2019, 106, 1–8. [Google Scholar] [CrossRef]
- Dos Santos, M.L.S.; de Almeida, A.-A.F.; da Silva, N.M.; Oliveira, B.R.M.; Silva, J.V.S.; Junior, J.O.S.; Ahnert, D.; Baligar, V.C. Mitigation of cadmium toxicity by zinc in juvenile cacao: Physiological, biochemical, molecular and micromorphological responses. Environ. Exp. Bot. 2020, 179, 1–15. [Google Scholar] [CrossRef]
- Bravo, D. Cadmium tolerant bacteria: Current trends and applications in agriculture. Lett. Appl. Microbiol. 2021. accepted. [Google Scholar]
- Rowley, M.C.; Grand, S.; Spangenber, J.; Verrecchia, E. Evidence linking calcium to increased organo-mineral association in soils. Biogeochemistry 2021, 1–19. [Google Scholar] [CrossRef]
- Rowley, M.C.; Grand, S.; Verrecchia, É.P. Calcium-mediated stabilisation of soil organic carbon. Biogeochemistry 2018, 137, 27–49. [Google Scholar] [CrossRef]
- León-Moreno, C.; Pérez, J.I.; Ramírez, L.; Castilla, C.; Monsalve, D.; Benavides, J.; Rengifo, G. Zonificación de la Presencia de Cadmio en Suelo y Grano Seco en Diez Departamentos Cacaoteros de Colombia; Corpoica, Ed.; Corpoica: Bogota, Colombia, 2013; Volume 1, pp. 1–20. [Google Scholar]


| District | n | Mean | Median | Min | Max | SD | Cv | Sk | Kt |
|---|---|---|---|---|---|---|---|---|---|
| Antioquia | 60 | 1.14 | 1.19 | 0.20 | 1.86 | 0.39 | 0.34 | −0.46 | −0.39 |
| Arauca | 232 | 1.11 | 1.05 | 0.28 | 5.64 | 0.61 | 0.55 | 2.33 | 12.80 |
| Bolívar | 17 | 0.40 | 0.01 | 0.01 | 1.41 | 0.51 | 1.26 | 0.58 | −1.42 |
| Boyacá | 17 | 1.82 | 1.25 | 0.56 | 6.17 | 1.62 | 0.89 | 1.90 | 2.21 |
| Caquetá | 7 | 0.45 | 0.41 | 0.04 | 1.19 | 0.36 | 0.81 | 0.95 | −0.30 |
| Cauca | 47 | 1.32 | 1.33 | 0.45 | 2.34 | 0.38 | 0.29 | 0.20 | 0.06 |
| Cesar | 20 | 1.01 | 1.09 | 0.31 | 1.63 | 0.38 | 0.38 | −0.53 | −0.71 |
| Chocó | 27 | 1.31 | 1.24 | 0.85 | 1.91 | 0.29 | 0.22 | 0.53 | −0.56 |
| Córdoba | 11 | 1.63 | 1.68 | 1.11 | 2.04 | 0.31 | 0.19 | −0.21 | −1.44 |
| Cundinamarca | 32 | 2.83 | 1.60 | 0.53 | 13.30 | 2.86 | 1.01 | 1.81 | 3.29 |
| Guaviare | 25 | 0.44 | 0.36 | 0.14 | 0.99 | 0.23 | 0.53 | 0.91 | −0.05 |
| Huila | 105 | 0.83 | 0.83 | 0.29 | 1.49 | 0.26 | 0.31 | 0.33 | −0.08 |
| Meta | 116 | 0.61 | 0.65 | 0.01 | 2.29 | 0.43 | 0.70 | 0.40 | 0.71 |
| Nariño | 45 | 0.91 | 0.93 | 0.20 | 1.38 | 0.24 | 0.27 | −0.64 | 0.82 |
| Norte de Santander | 150 | 1.08 | 0.97 | 0.09 | 4.51 | 0.62 | 0.58 | 2.06 | 7.01 |
| Risaralda | 12 | 0.70 | 0.74 | 0.21 | 1.01 | 0.22 | 0.31 | −0.65 | −0.38 |
| Santander | 821 | 1.90 | 0.83 | 0.01 | 27.00 | 3.29 | 1.73 | 3.87 | 17.64 |
| Tolima | 84 | 0.98 | 0.91 | 0.24 | 1.77 | 0.34 | 0.35 | 0.34 | −0.43 |
| Valle del Cauca | 9 | 0.91 | 0.86 | 0.63 | 1.16 | 0.20 | 0.22 | −0.08 | −1.75 |
| Input Variables | Response Variable * | Model/Method | PC | MSE | MAE |
|---|---|---|---|---|---|
| LEO | Cd | ANN | 0.73 | 2.51 | 0.72 |
| LEO + LL | Cd | RF | 0.73 | 2.50 | 0.68 |
| LQE | Cd | RF | 0.71 | 2.63 | 0.73 |
| LQE + LL | Cd | RF | 0.72 | 2.58 | 0.70 |
| LEE | Cd | RF | 0.72 | 2.61 | 0.73 |
| LEE + LL | Cd | RF | 0.72 | 2.55 | 0.70 |
| LEO | Cd.PCorr.Lab * | RF | 0.73 | 2.59 | 0.73 |
| LEO + LL | Cd.PCorr.Lab | RF | 0.74 | 2.49 | 0.68 |
| LQE | Cd.PCorr.Lab | RF | 0.72 | 2.62 | 0.73 |
| LQE + LL | Cd.PCorr.Lab | RF | 0.72 | 2.65 | 0.70 |
| LEE | Cd.PCorr.Lab | RF | 0.72 | 2.60 | 0.73 |
| LEE + LL | Cd.PCorr.Lab | RF | 0.72 | 2.65 | 0.70 |
| Place | Type | Number | Confidence Level [%] | Number |
|---|---|---|---|---|
| National | Hotspot | 703 | 99 | 698 |
| 95 | 2 | |||
| 90 | 3 | |||
| Coldspot | 352 | 99 | 168 | |
| 95 | 68 | |||
| 90 | 116 | |||
| Randomless | 782 | Not significant | 782 | |
| Santander | Hotspot | 660 | 99 | 657 |
| 95 | 1 | |||
| 90 | 2 | |||
| Coldspot | 89 | 99 | 88 | |
| 90 | 1 | |||
| Randomless | 72 | Not significant | 72 | |
| Arauca | Coldspot | 108 | 95 | 45 |
| 90 | 63 | |||
| Randomless | 124 | Not significant | 124 | |
| Huila | Coldspot | 105 | 95 | 12 |
| 90 | 20 | |||
| Randomless | 73 | Not significant | 73 | |
| Antioquia | Randomless | 60 | Not significant | 60 |
Publisher’s Note: MDPI stays neutral with regard to jurisdictional claims in published maps and institutional affiliations. |
© 2021 by the authors. Licensee MDPI, Basel, Switzerland. This article is an open access article distributed under the terms and conditions of the Creative Commons Attribution (CC BY) license (https://creativecommons.org/licenses/by/4.0/).
Share and Cite
Bravo, D.; Leon-Moreno, C.; Martínez, C.A.; Varón-Ramírez, V.M.; Araujo-Carrillo, G.A.; Vargas, R.; Quiroga-Mateus, R.; Zamora, A.; Rodríguez, E.A.G. The First National Survey of Cadmium in Cacao Farm Soil in Colombia. Agronomy 2021, 11, 761. https://doi.org/10.3390/agronomy11040761
Bravo D, Leon-Moreno C, Martínez CA, Varón-Ramírez VM, Araujo-Carrillo GA, Vargas R, Quiroga-Mateus R, Zamora A, Rodríguez EAG. The First National Survey of Cadmium in Cacao Farm Soil in Colombia. Agronomy. 2021; 11(4):761. https://doi.org/10.3390/agronomy11040761
Chicago/Turabian StyleBravo, Daniel, Clara Leon-Moreno, Carlos Alberto Martínez, Viviana Marcela Varón-Ramírez, Gustavo Alfonso Araujo-Carrillo, Ruy Vargas, Ruth Quiroga-Mateus, Annie Zamora, and Edwin Antonio Gutiérrez Rodríguez. 2021. "The First National Survey of Cadmium in Cacao Farm Soil in Colombia" Agronomy 11, no. 4: 761. https://doi.org/10.3390/agronomy11040761
APA StyleBravo, D., Leon-Moreno, C., Martínez, C. A., Varón-Ramírez, V. M., Araujo-Carrillo, G. A., Vargas, R., Quiroga-Mateus, R., Zamora, A., & Rodríguez, E. A. G. (2021). The First National Survey of Cadmium in Cacao Farm Soil in Colombia. Agronomy, 11(4), 761. https://doi.org/10.3390/agronomy11040761