Article

Analyses of Chloroplast Genome of Eutrema japonicum Provide New Insights into the Evolution of Eutrema Species

College of Horticulture, Sichuan Agricultural University, Chengdu 611130, China
*
Author to whom correspondence should be addressed.
These authors contributed equally to this work.
Agronomy 2021, 11(12), 2546; https://doi.org/10.3390/agronomy11122546
Submission received: 30 November 2021 / Revised: 12 December 2021 / Accepted: 13 December 2021 / Published: 15 December 2021

Abstract

:
Wasabi (Eutrema japonicum) is a vegetable of Brassicaceae family, currently cultivated in East Asia. It is rich in nutritional and has a spicy flavour. It is regarded as a rare condiment worldwide. Its genetic profile for yield improvement and the development of E. japonicum germplasm resources remains unknown. Cognizant of this, this study sequenced and assembled the chloroplast (cp) genome of E. japonicum to enrich our genomic information of wasabi and further understand genetic relationships within the Eutrema species. The structural characteristics, phylogeny, and evolutionary relationship of cp genomes among other Brassicaceae plants were analyzed and compared to those of Eutrema species. The cp genome of E. japonicum has 153,851 bp with a typical quadripartite structure, including 37 tRNA genes, 8 rRNA genes, and 87 protein-coding genes. It contains 290 simple sequence repeats and prefers to end their codons with an A or T, which is the same as other Brassicaceae species. Moreover, the cp genomes of the Eutrema species had a high degree of collinearity and conservation during the evolution process. Nucleotide diversity analysis revealed that genes in the IR regions had higher Pi values than those in LSC (Large single copy) and SSC (Small single copy) regions, making them potential molecular markers for wasabi diversity studies. The analysis of genetic distance between Eutrema plants and other Brassicacea plants showed that intraspecies variation was found to be low, while large differences were found between genera and species. Phylogenetic analysis based on 29 cp genomes revealed the existence of a close relationship amongst the Eutrema species. Overall, this study provides baseline information for cp genome-based molecular breeding and genetic transformation studies of Eutrema plants.

1. Introduction

Wasabi (Eutrema japonicum (Miq.) Koidz., syn. Wasabi japonica (Miq.) Mastum.,) is a perennial herbaceous species of the Brassicaceae family. It is currently cultivated in East Asia, contain China and Japan [1]. All parts of wasabi are edible, and it contains many nutrients such as proteins, fats, vitamin C, and natural active ingredients in its rhizomes. Wasabi’s unique isothiocyanate has a bactericidal anti-cancer effect [2,3,4] and is the source of both its spicy taste and aroma [5]. Cognizant of this, wasabi has been widely used as an invaluable condiment worldwide. Wasabi thrives in unique growing conditions. Its suitable growth and development areas are high-cold mountains with an altitude of 2000–3500 m and an optimum temperature of 12–18 °C. Temperatures below 8 °C affect its growth, while above 18 °C affect its rhizome development [6]. As such, wasabi has a limited growing area in contrast to its great market demand worldwide.
The chloroplast (cp) is the photosynthetic site of plants characterized by a unique genetic material [7]. Generally, the cp genome has a typical quadripartite structure consisting of four distinct regions: a large single-copy region (LSC), a small single-copy region (SSC), and a pair of reverse repeats (IRa and IRb) [8]. It has a relatively unique sequence that is widely used in comparative genomics and phylogenetic analysis. Evolutionary studies postulate that closely related plants have more similar cp genomes. Different species have varying lengths of the cp genome because of the differential contraction and expansion of their IR regions [9]. Use of DNA barcodes alone to distinguish closely related species is very difficult because of the short gene segments and small number of phylogenetic information sites [10]. Cognizant of this, cp genomes have been used to reveal speciation origin and phylogenetic relationships between species [11]. To date, the cp genome sequences of cash crops such as Cannabis sativa [12], Citrus limon [13], and Momordica charantia L. [14] have been assembled, thus providing abundant idioplasmatic data for deeper evaluation and molecular breeding of these species. In recent years, studies of wasabi have primarily focused on its nutritional components and cultivation techniques [15,16]. A previous study sequenced the cp genome of E. japonicum, revealing that E. tenue (Gifu) had a close relationship with E. yunnanense, and asserted that they should be considered as a different species from other E. tenue species [17]. However, it only studied the phylogenetic relationships of Eutrema species. The evolution of and comparison between wasabi and other related species remain unknown. As such, studying the genetic diversity of E. japonicum germplasm resources provides baseline information required for breeding high-yielding wasabi varieties of standard quality. Herein, we sequenced and assembled the cp genome of a new wasabi variety, ‘Chuankui No. 1′. The sequence provides information regarding the genome structure, gene content, and functional annotation of the chloroplast. This study also includes a comparative analysis of the cp genome sequences of seven cultivated wasabi varieties of Eutrema species. In addition, a phylogenetic tree was constructed based on the cp genomes of 29 plants belonging to the family Brassicaceae. Our results show the genetic relationship between E. japonicum and its related species and provide a theoretical basis for improving the yield and development of E. japonicum germplasm resources.

2. Materials and Methods

2.1. Plant Material

The wasabi material ‘Chuankui No. 1′ used herein was an excellent line selected from a high-yielding local wasabi cultivar with edible stem and leaves grown in Gudui township, Leibo City, Sichuan province, China (28°36′ N, 103°10′ E, 2300 m altitude). The growth area is cold and humid, with a relative humidity of 80% to 90% suitable for wasabi growth. Fresh tender leaves from three biological replicates of six-month-old plants were collected and frozen in liquid nitrogen, and stored at −80 °C until further use.

2.2. DNA Extraction and Sequencing

Total genomic DNA was extracted from the frozen leaves following a modified CTAB protocol [18]. The DNA samples were then subjected to quality and quantity checks using 1% agarose gel electrophoresis and spectrophotometric methods measured by a Nanodrop ND1000 spectrophotometer [19]. High-quality cp DNA was used to prepare a library with an insert size of 350 bp, which was then sequenced on an Illumina Novaseq platform [20] at Nanjing Genepioneer Biotechnologies Inc. (Nanjing, China).

2.3. Genome Assembly and Gene Annotation

The raw data obtained from the sequenced library were filtered using Fastp software (version 0.20.0, https://github.com/OpenGene/fastp, accessed on 27 August 2020) to remove adapter and primer sequences and reads with an average quality value less than Q5 and more than five Ns. Clean reads were assembled into the cp genome using SPAdes software (v3.10.1, http://cab.spbu.ru/software/spades/, accessed on 27 August 2020). The k-mer values set were 55, 87, and 121. Gapfiller (v2.1.1, https://sourceforge.net/projects/gapfiller/, accessed on 27 August 2020) was used to fill in the gaps to obtain the complete circular cp genome.
Two annotation methods were used to improve the accuracy of annotation results. The Prodigal (v2.6.3, https://www.gitub.com/hyattpd/Prodigal, accessed on 27 August 2020), Hmmer (v3.1b2, http://www.hmmer.org/, accessed on 27 August 2020), and Aragorn software packages (v1.2.38, http://130.235.244.92/ARAGORN/, accessed on 27 August 2020) were first used to annotate the CDS, rRNA, and tRNA, respectively. A BLASTn search was then performed using the reference cp genomes published on NCBI to obtain the annotation results. Both annotation results were analyzed to remove incorrect and redundant annotations and to determine the boundaries of multiple exons [21,22]. Subsequently, OrganellarGenomeDRAW (OGDRAW) software was employed to draw the circular cp genome map with annotations [23]. The complete E. japonicum cp genome data were deposited in GenBank of NCBI at (https://www.ncbi.nlm.nih.gov/, accessed on 24 May 2021) under accession No. MZ328719.

2.4. Analysis of the Chloroplast Genome

The size and location of dispersed repeats in the cp genome, including the forward, reverse, complement, and palindromic repeats, were detected using REPuter (https://bibiserv.cebitec.uni-bielefeld.de/reputer?id=reputer_view_submission, accessed on 28 August 2020). A hamming distance of 3 and a minimum repeat size of 30 bp were set as the search parameters [24]. In the same line, MISA software (v1.0, http://pgrc.ipk-gatersleben.de/misa/misa.html, accessed on 28 August 2020) was employed to identify the simple sequence repeats (SSRs). The parameters set for identifying the repeat units were 8, 5, 3, 3, 3, and 3 for mono-, di-, tri-, tetra-, pen-, and hexa-nucleotide, respectively. The codon usage of the protein-coding genes was analyzed using Perl scripts, followed by a calculation of the relative synonymous codon usage (RSCU) values to determine usage bias.

2.5. Comparative Analysis of the Chloroplast Genome

2.5.1. Analysis of Non-Synonymous Mutation Rate (Ka), Synonymous Mutation Rates (Ks) and Ka/Ks, and Nucleotide Diversity (Pi) Value

Sequences of seven Eutrema plants, including Eutrema tenue (LC500907.1), Eutrema tenue (LC500908.1), and Eutrema japonicum (LC500903.1), Eutrema japonicum (LC500902.1), Eutrema yunnanense (KT270357.1), Eutrema heterophyllum (KT270358.1), and Eutrema japonicum (LC500900.1) with published chloroplast data, were selected for calculating the Ka, Ks, Ka/Ks, and Pi value using the cp genome data obtained herein. The Ka and Ks of each pair of homologous genes were calculated using v2.0 KaKs calculator software (https://sourceforge.net/projects/kakscalculator2/, accessed on 29 August 2020) to obtain the Ka/Ks ratio which reflected the gene selection pressure. Ka/Ks > 1, Ka/Ks = 1, and Ka/Ks < 1 indicated that the genes were under purifying, neutral, and positive selection pressure, respectively [25]. The eight cp genome sequences were aligned using MAFFT (v7.310, https://mafft.cbrc.jp/alignment/software/, accessed on 29 August 2020), and the slide window analysis was subsequently carried out using DnaSP (http://www.ub.edu/dnasp, accessed on 29 August 2020) to determine the Pi value [26].

2.5.2. Comparative Analysis of the Chloroplast Genome Structure

The IR border regions of the eight Eutrema species were compared and visualized using the SVG module in Perl. Subsequent comparisons and analyses of the cp genome structure for the eight species were then performed using the CGVIEW software [27] (http://stothard.afns.ualberta.ca/cgview_server/, accessed on 30 August 2020). The whole-genome architecture rearrangement and comparison were generated using the default algorithm settings of Mauve software (http://darlinglab.org/mauve, accessed on 30 August 2020) [28].

2.5.3. Genetic Distance Analysis

The protein-coding genes were extracted from 30 cp genome of Brassicaceae species (Table S1), and were aligned separately using MAFFT (v7.427) [29]. Then the genetic distances were calculated using the ape package default parameters of the R language. Indels were deleted to evaluate genetic distance.

2.5.4. Phylogenetic Analysis

Phylogenetic analysis was performed based on the genetic distance analysis. The common CDS sequences were subjected to multi-sequence alignment using the default parameters of MAFFT software. The aligned data were then connected and trimmed using the trimAI software (v1.4.rev15). The maximum likelihood (ML) phylogenetic trees of the 30 sequences were estimated using RAxML v8.2.10 (https://cme.hits.org/exelixis/software.html, accessed on 30 August 2020) under the GTRGAMMA model, with 1000 rapid bootstrap replicates [30].

3. Results

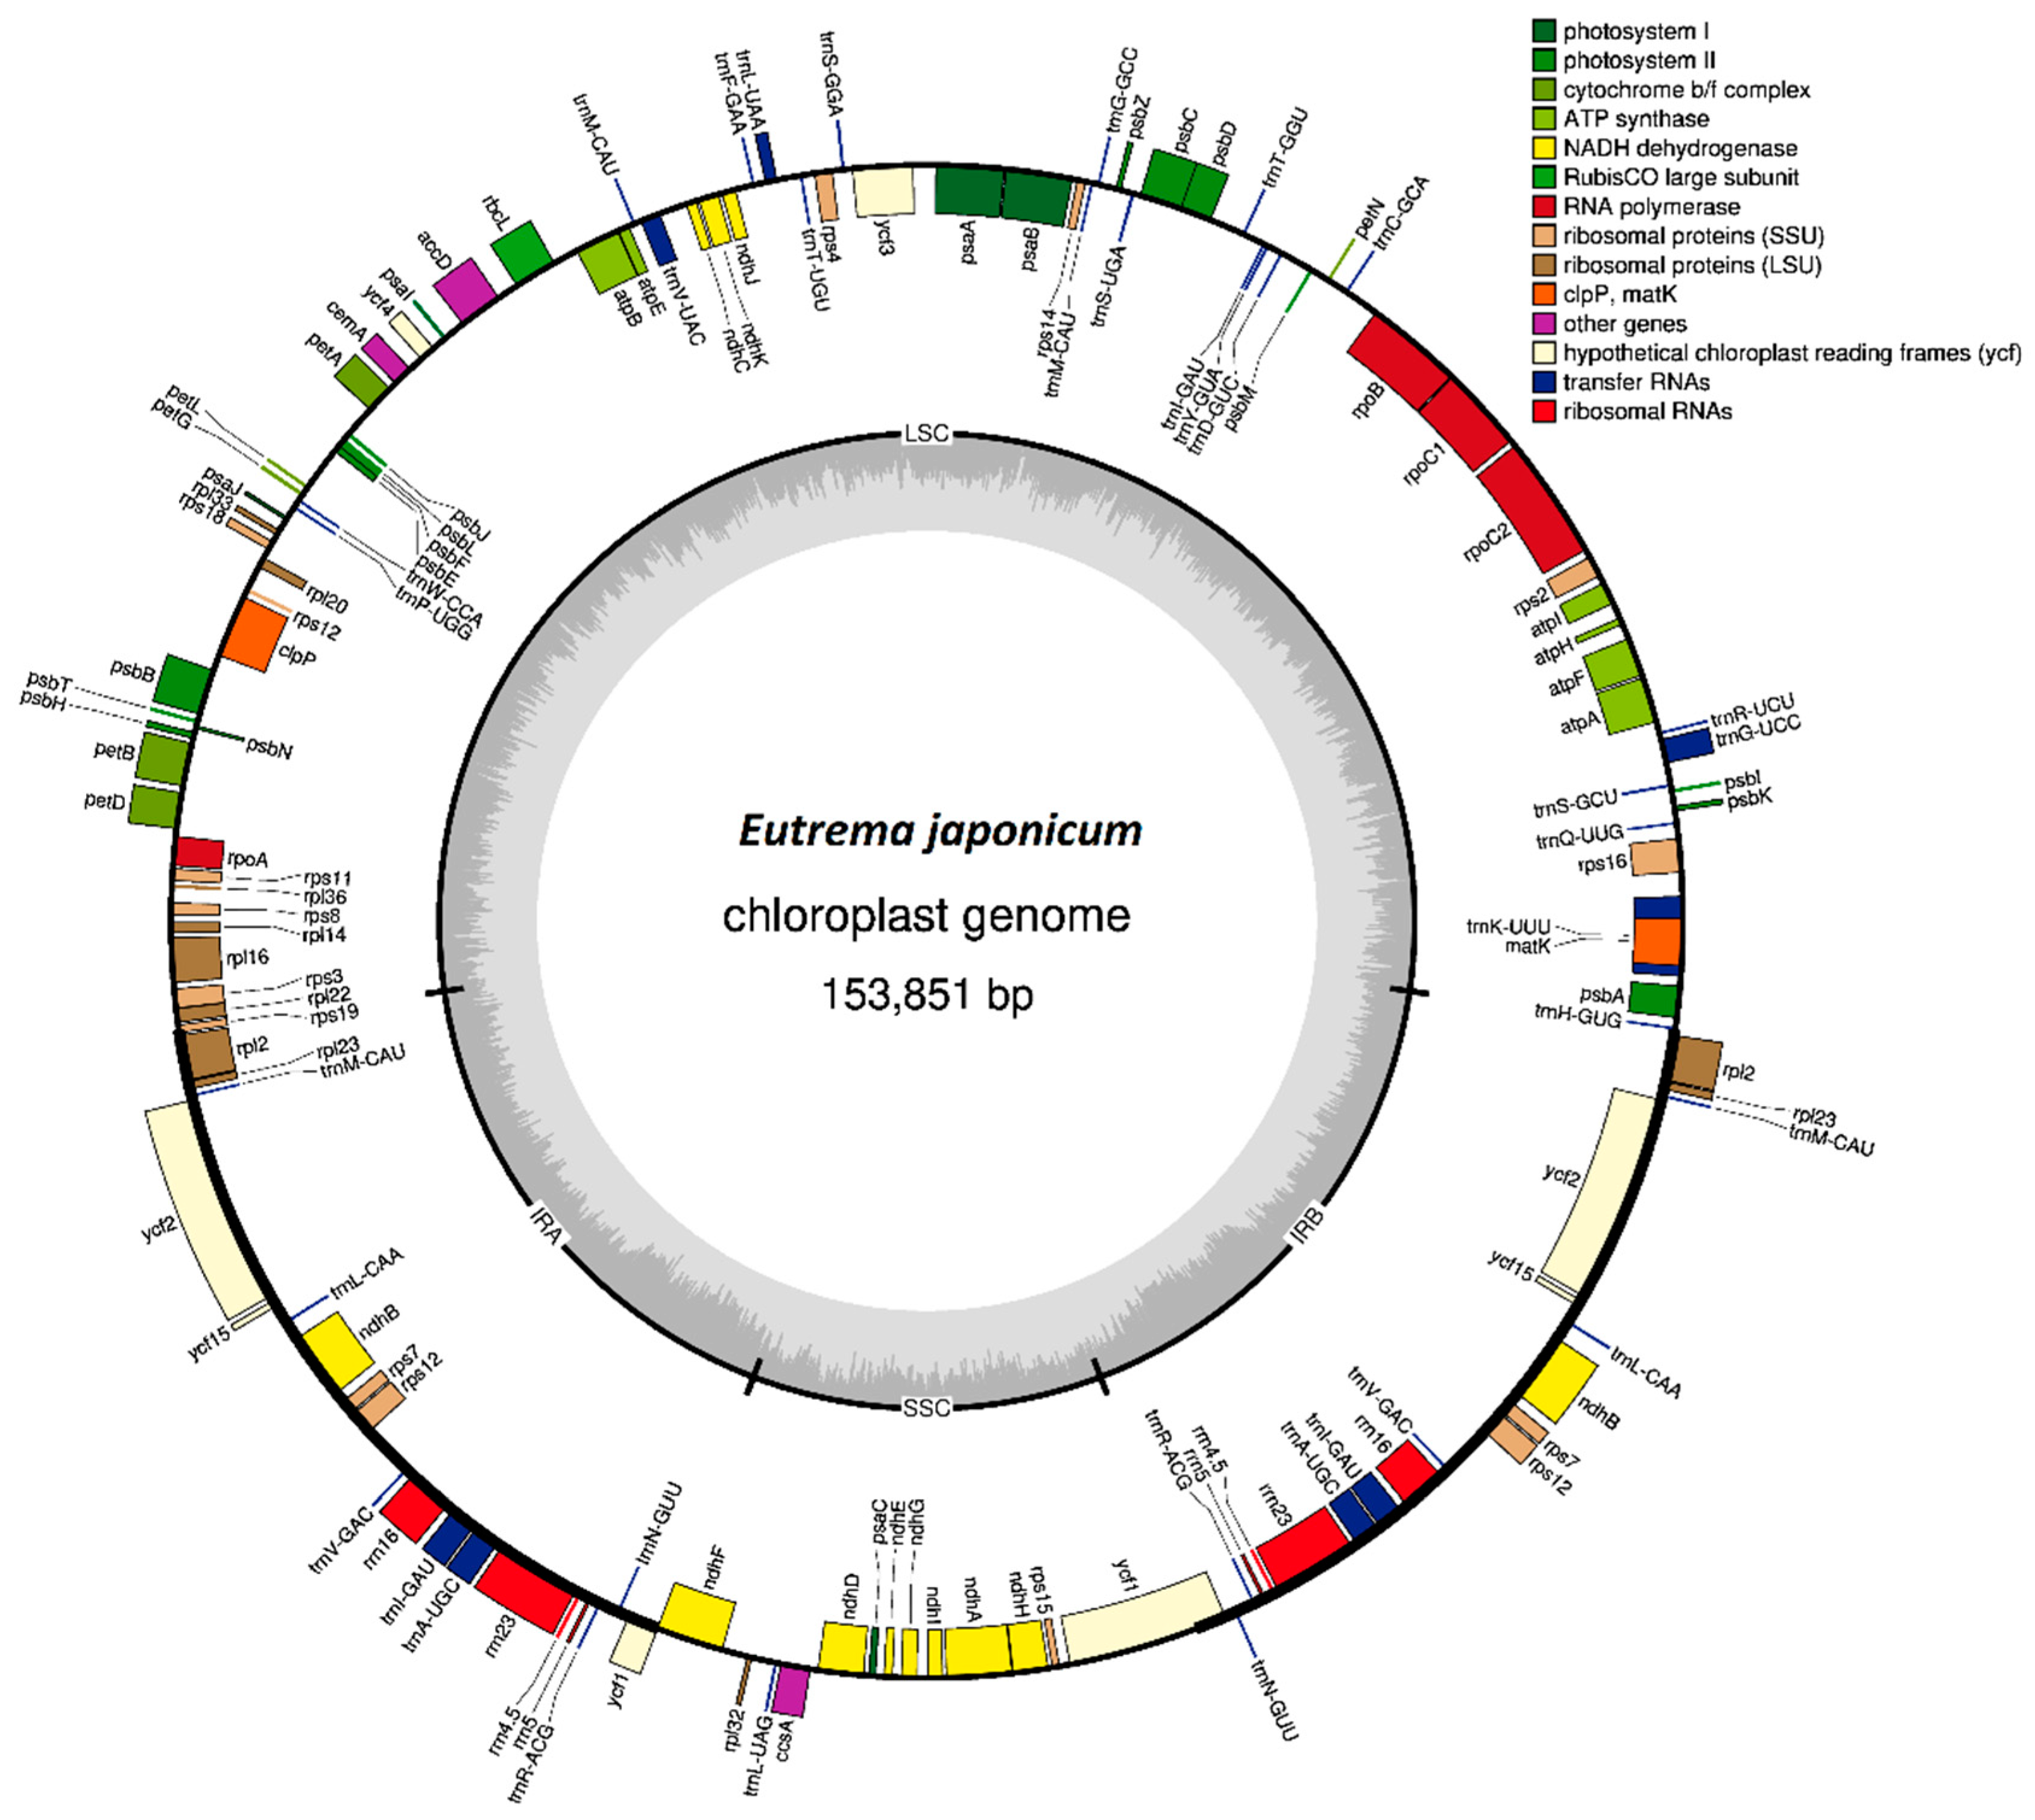
3.1. Annotation and Features of the Chloroplast Genome

The cp genome of wasabi exhibited a typical quadripartite structure, consisting of a large single copy (LSC), a small single copy (SSC), and a pair of inverted repeats (IR) (Figure 1). A total of 26,343,729 clean reads were assembled. The complete cp genome length was 153,851 bp, in which the lengths of the LSC, SSC, and IR regions were 84,006 bp, 17,811 bp, and 52,034 bp, respectively.
The cp genome of wasabi contained 132 functional genes, including 37 tRNA genes, 8 rRNA genes, and 87 protein-coding genes (Table 1). Among them, 17 genes, including 8 protein-coding genes (ndhB, rpl2, rpl23, rps12, rps7, ycf1, ycf15, and ycf2), 5 tRNA genes (trnA-UGC, trnL-CAA, trnN-GUU, trnR-ACG, and trnV-GAU), and 4 rRNA genes (rrn16, rrn23, rrn4.5, and rrn5), had two copies. One tRNA gene (trnI-GAU) had three copies, while another (trnM-CAU) had four copies. The GC content of the IR, LSC, and SSC regions were 42.48%, 34.06%, and 29.38%, respectively, with an overall GC content of 36.37%. The four rRNA genes were distributed in the IR regions, thus contributing to the higher GC content than the other regions.
Previous studies have postulated that introns play an important regulatory role in gene expression, primarily by enhancing the expression of foreign genes which control the related traits [31]. Herein, 18 genes had introns. Among them, 10 protein-coding genes and 6 tRNA genes had one intron each, while 2 protein-coding genes (clpP and ycf3) had two introns each. The introns ranged between 321 bp and 2550 bp in length, with the trnK-UUU gene having the longest intron. Notably, the number and types of genes and introns were consistent with those of the reference sequences, indicating that the cp genome of Eutrema species is highly conserved.

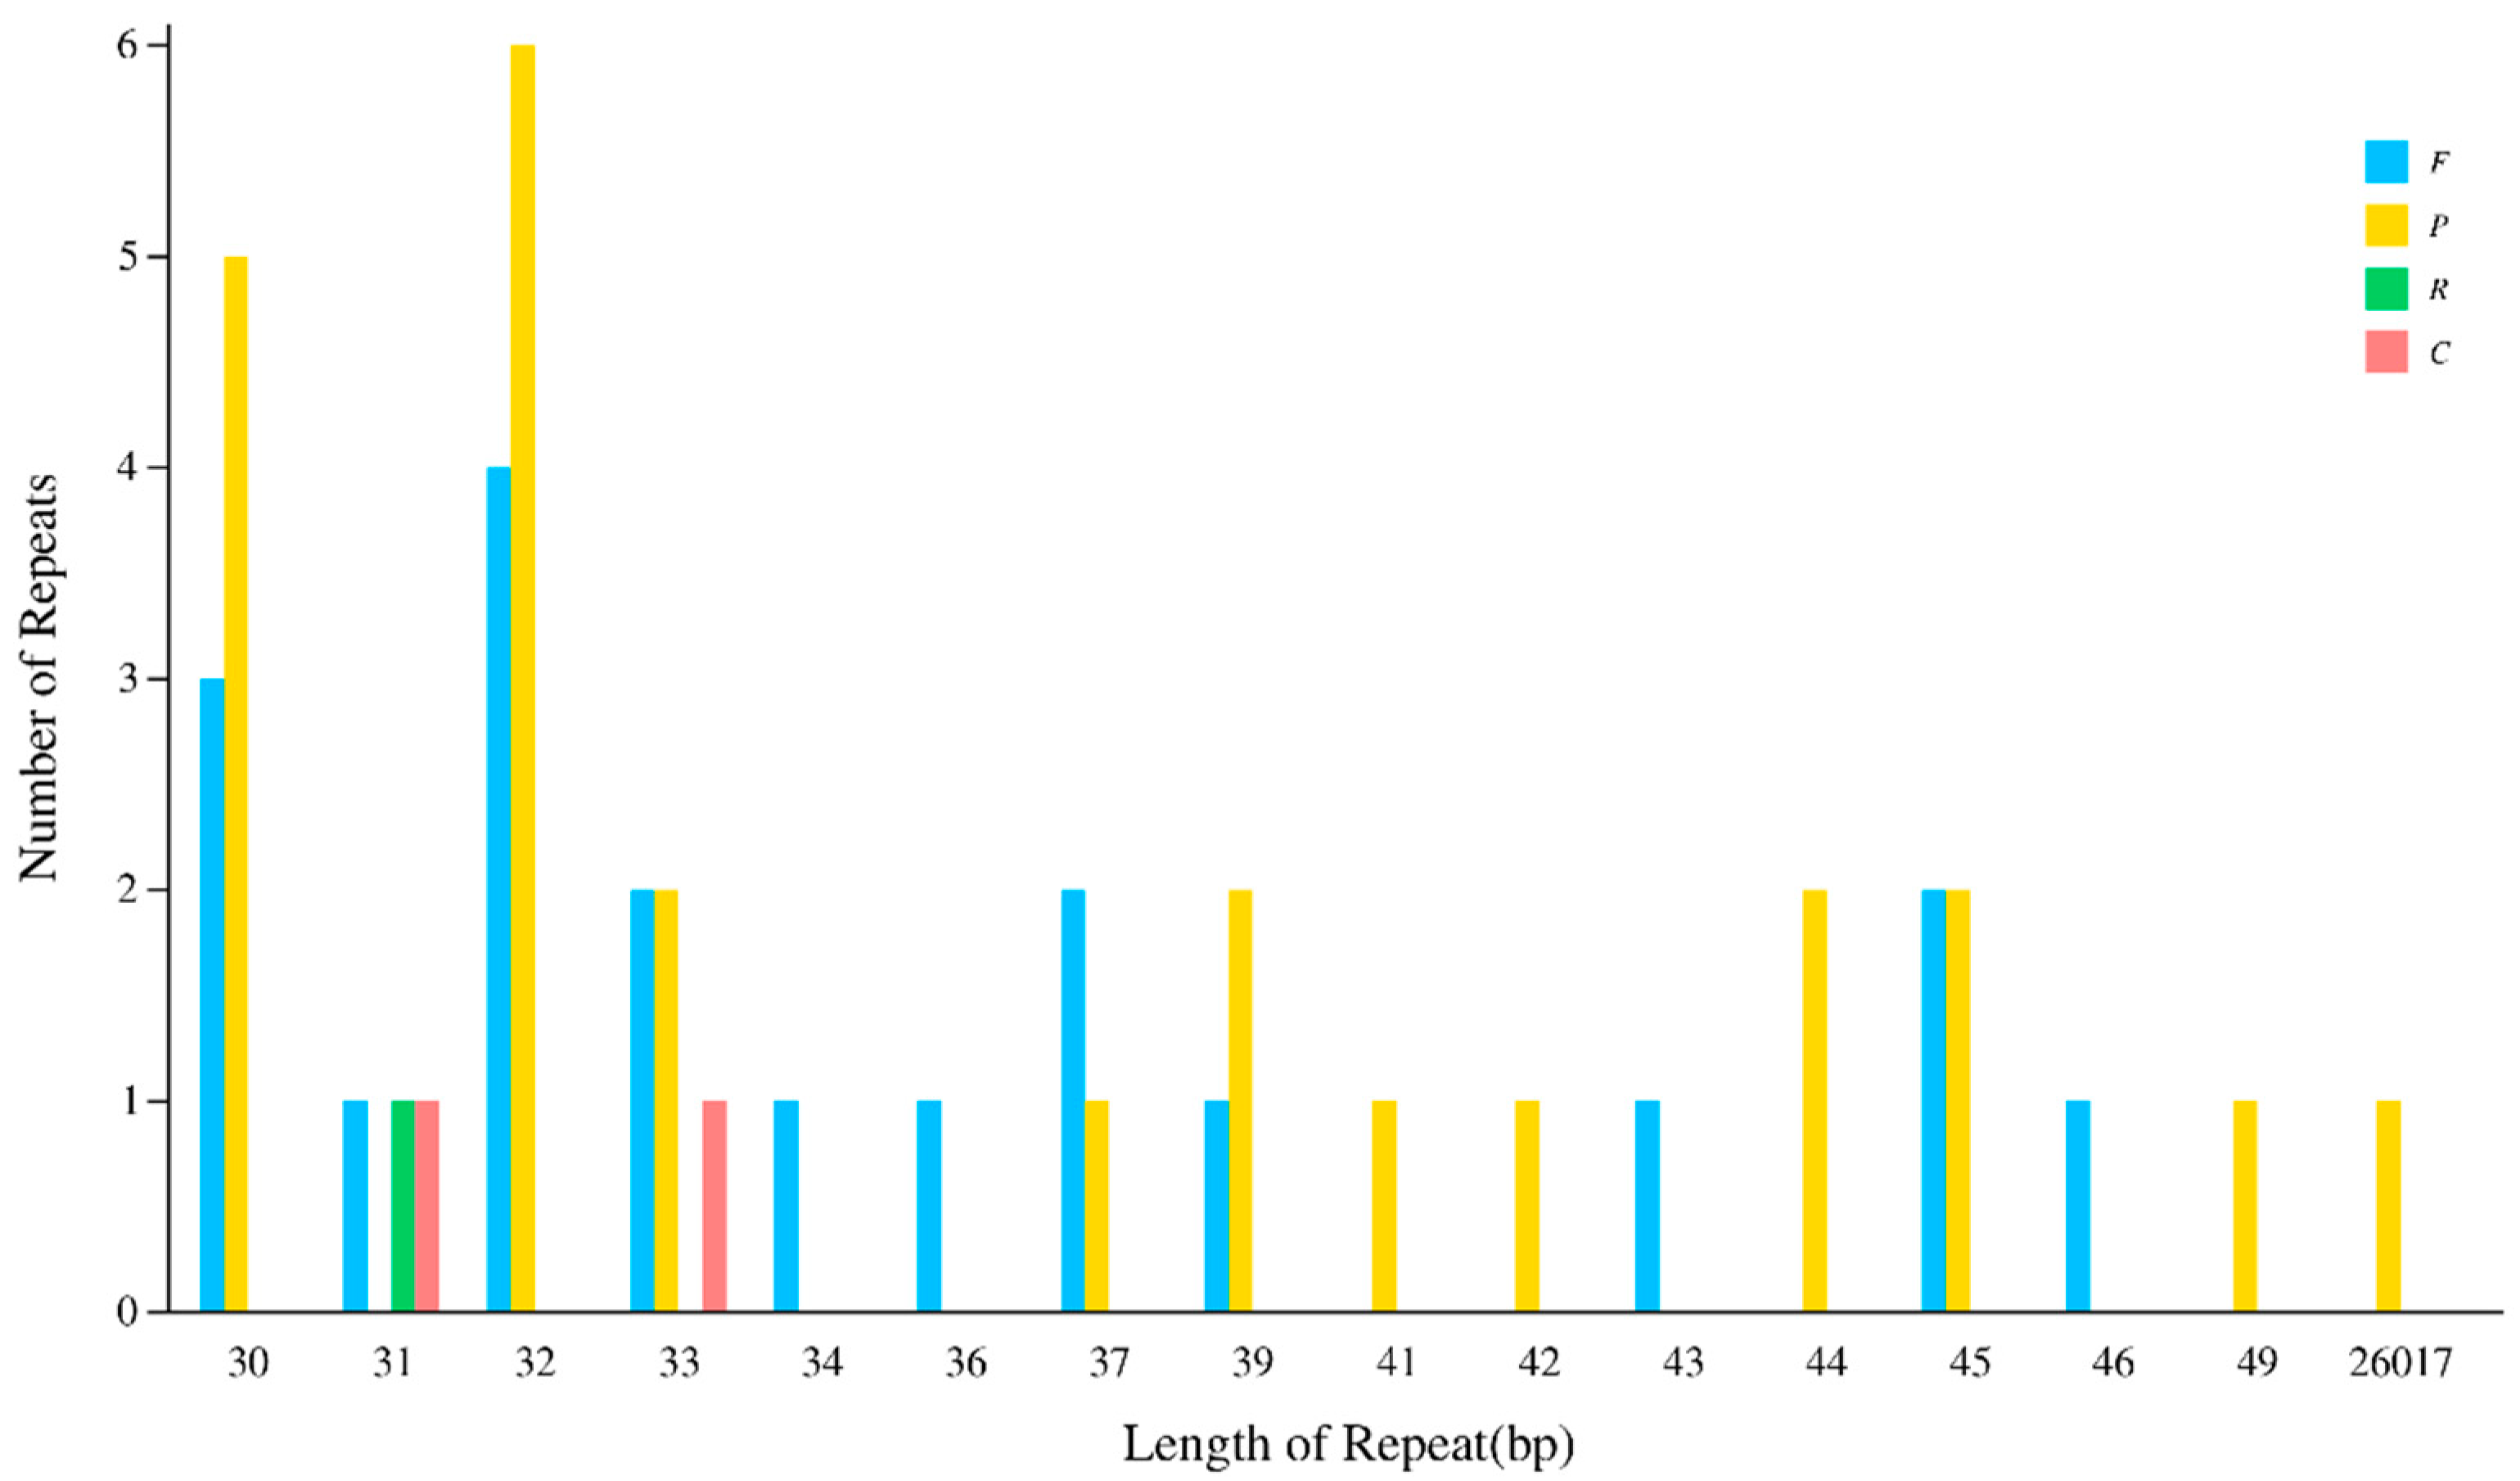
3.2. Analysis of Repeat Sequences

Differences in the repeat sequences amongst cp genomes can provide analytical markers for genetic diversity studies because the chloroplast has relatively unique genetic sequences whose evolution rate is much lower than that of nuclear DNA [32]. Herein, 290 SSR sites were detected, including 126 mono-, 14 di-, 59 tri-, 9 tetra-, and 2 penta-nucleotides with lengths of between 8 and 20 bp. Amongst the mono-nucleotide repeat type, there were 217 sites composed of A/T, and 9 sites composed of G/C. The repeat of eight mono-nucleotide of T appeared 57 times (Figure 2), revealing the base composition preference of the SSRs. In the same line, most SSRs were located in the intergenic region, with 19.7%, 14.5%, and 65.9% of the SSRs located in the SSC, IR, and LSC region. Previous studies also postulate that dispersed repeats may promote rearrangements and increase the population’s genetic diversity [33]. Herein, 46 dispersed repeats, including 19 forward repeats (F), 24 palindrome repeats (P), 1 reverse repeat (R), and 2 complimentary repeats (C), were detected in the cp genome. Most repeats ranged between 30 and 49 bp in length, and the longest repeat was 26,017 bp in length (Figure 3).

3.3. Codon Usage Analysis

The RSCU impacts gene function because it reflects the origin and evolution of genes or even species, thereby providing a basis for studying species evolution at the molecular level [34]. Herein, the protein-coding genes comprised 26,643 codons. Leucine, isoleucine, and serine were the highest encoded amino acids with 2839, 2300, and 2037 codons, respectively, while cysteine was the least encoded, with 324 codons. Amongst the codons, 18,930 codons had an RSCU value greater than 1.00. Amongst them, 1138 codons ended with a G (AUG and UUG), while 17,792 codons ended with an A or U, indicating that the protein-coding genes in the cp genome preferred using an A or U at the end of the codon (Table 2).

3.4. Analysis of Synonymous and Non-Synonymous Substitution Rates

The gene selection pressure among the eight Eutrema plants was calculated using 87 protein-coding genes having some degree of mutation (Table 3 and Table S2). Notably, the Ka/Ks values of all gene pairs were <0.5, suggesting that most protein-coding genes were facing intense purifying selection pressure. For instance, all the tested genes in the comparison of E. japonicum vs. E. heterophyllum (KT270358.1) had Ka/Ks values < 1 except for ccsA and rpoA. Similarly, the only two genes, ndhF and rpoC2, that could be calculated in E. japonicum vs. E. japonicum (LC500900.1), had Ka/Ks values < 1. These findings suggested that the cp genes of different plants were subject to different selection pressures. In contrast to the cp genome of E. japonicum, the Ka/Ks values of the rpoC2 gene in the comparison of E. japonicum with other species were <1, indicating that the rpoC2 gene was purified in different Eutrema species (Table S2).

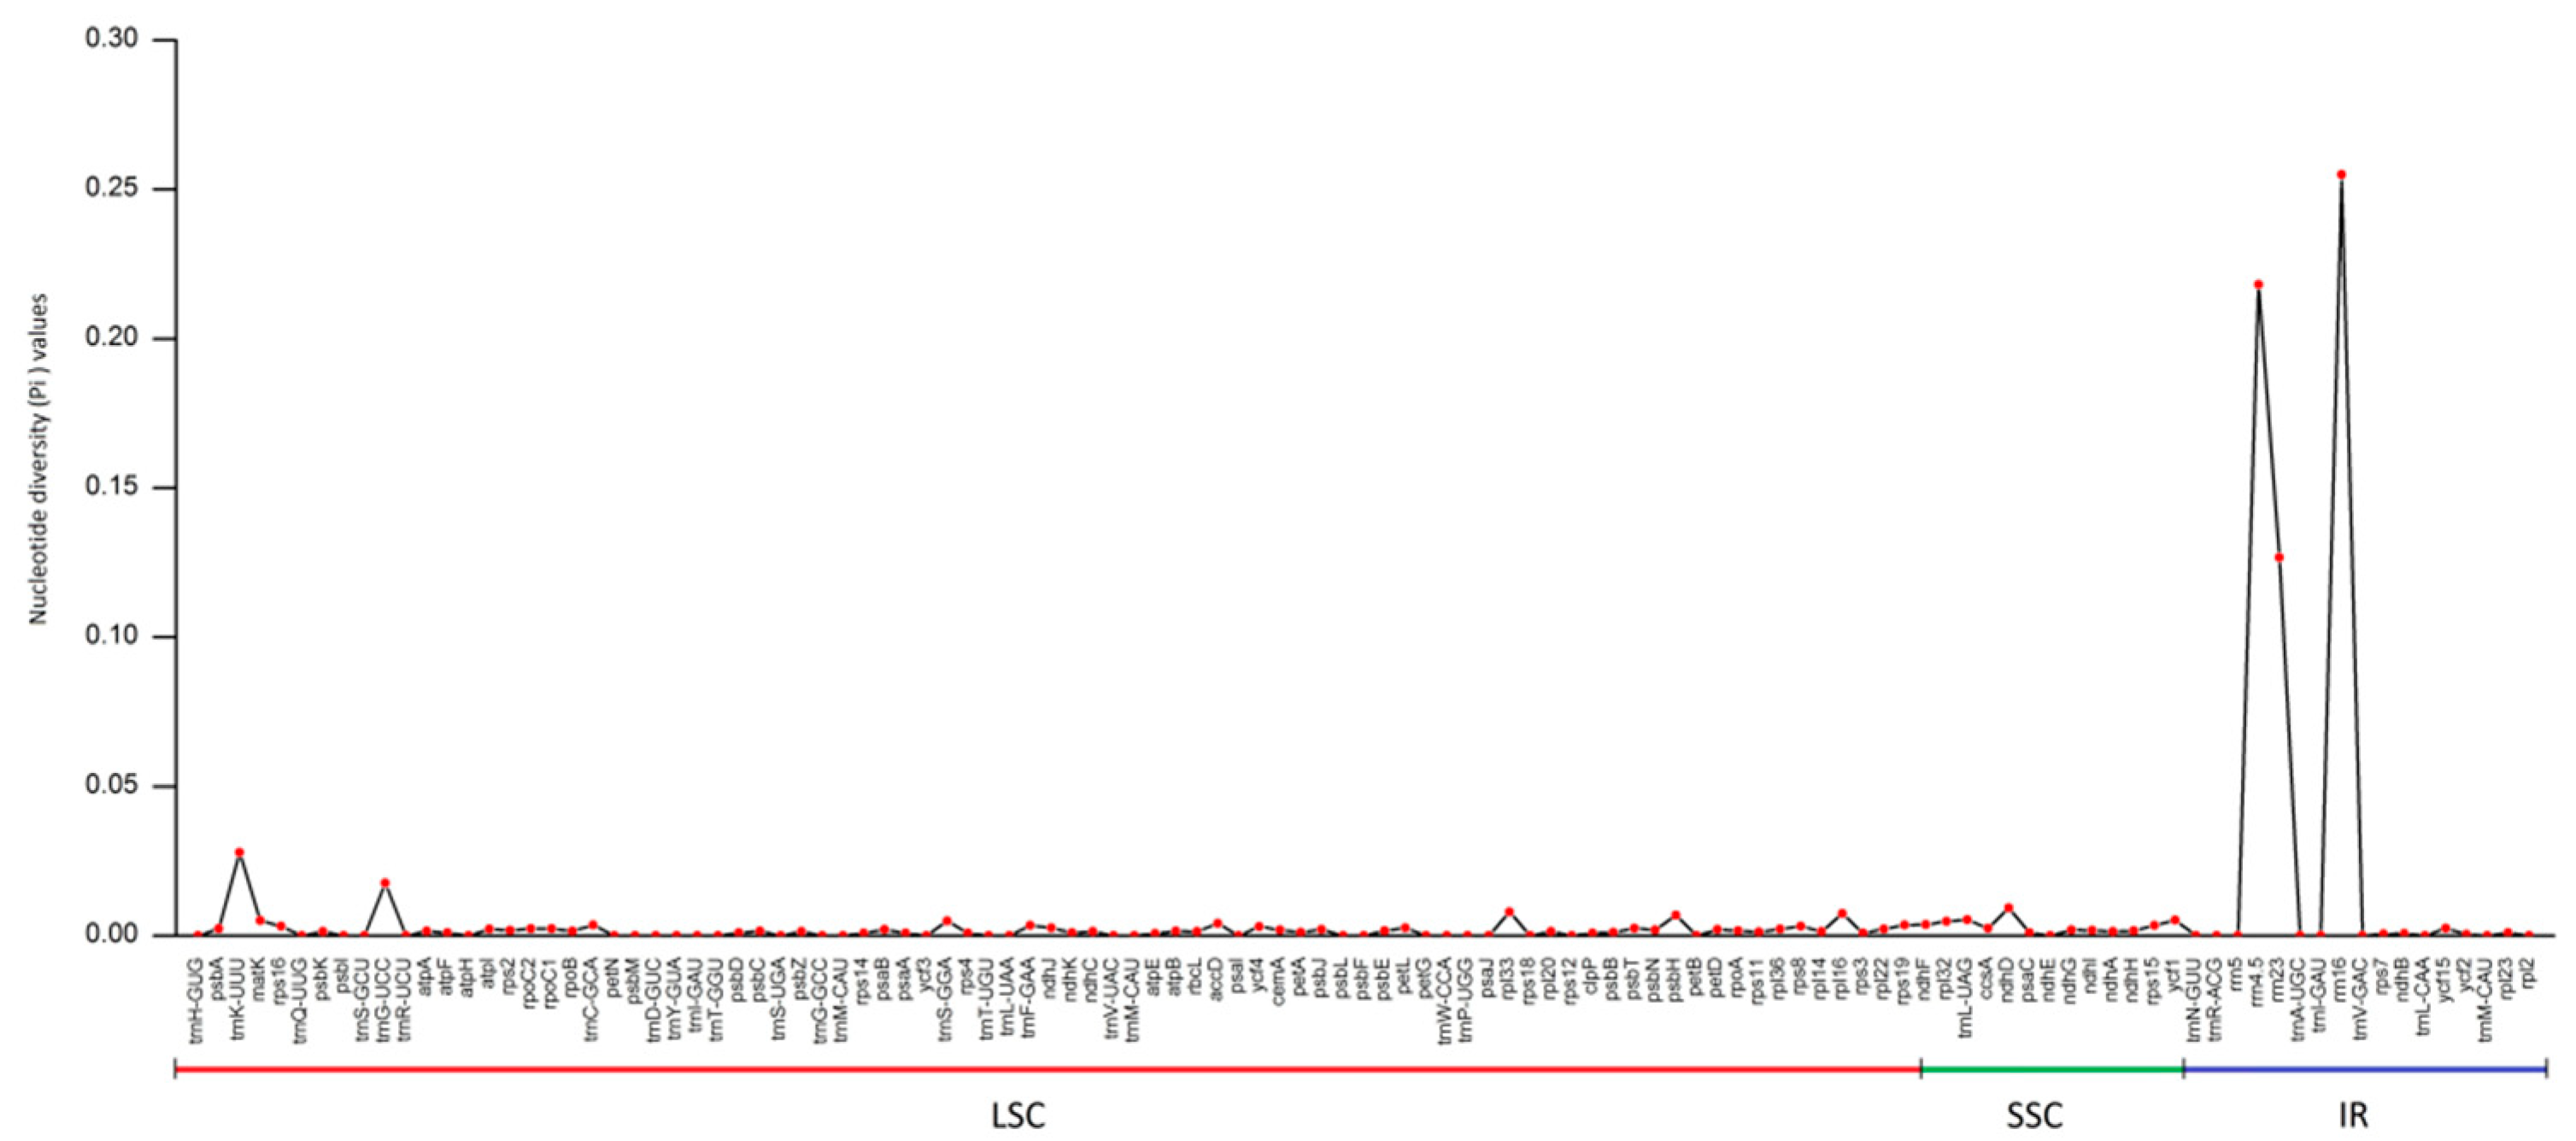
3.5. Nucleotide Diversity Analysis

The cp genomes contain highly variable and clustered regions called hotspots [35]. Herein, the Pi values of 113 genes were calculated to identify the hotspots in the cp genomes of Eutrema plants. Among them, 73 genes had Pi values ranging between 0.00047 and 0.254999. A higher mutation level was detected in the IR region, followed by the SSC and LSC regions, respectively. The rrn16 gene had the highest Pi value (Pi = 0.25499), followed by rrn4.5 (Pi = 0.21805) and rrn23 (Pi = 0.12611), respectively (Figure 4). These findings further indicated that there exists moderate differentiation in the cp genome sequences of the Eutrema species.

3.6. Expansion and Contraction Analysis of the IR Regions

The eight Eutrema plants had a similar gene structure, with the difference in the cp genome length primarily occurring in the LSC region (Figure 5). Notably, Eutrema japonicum had the most similar chloroplast genome to E. japonicum (LC500900.1), with only a 1 bp difference in the SSC region. IR boundary analysis revealed that the LSC/IRb boundary of these species was in the rps19 gene box. Similarly, the ycf1 gene was in both the IRb/SSC and the SSC/IRa boundary. In the same line, the segment length in the SSC region was 4253 bp in all the eight species except for KT270358.1, which had a length of 4239 bp. Notably, the genes across the SSC/IRa and SSC/IRb were identical because of the inverted duplication of the IR regions, suggesting that the IR boundary region of the eight Eutrema species was relatively conserved.

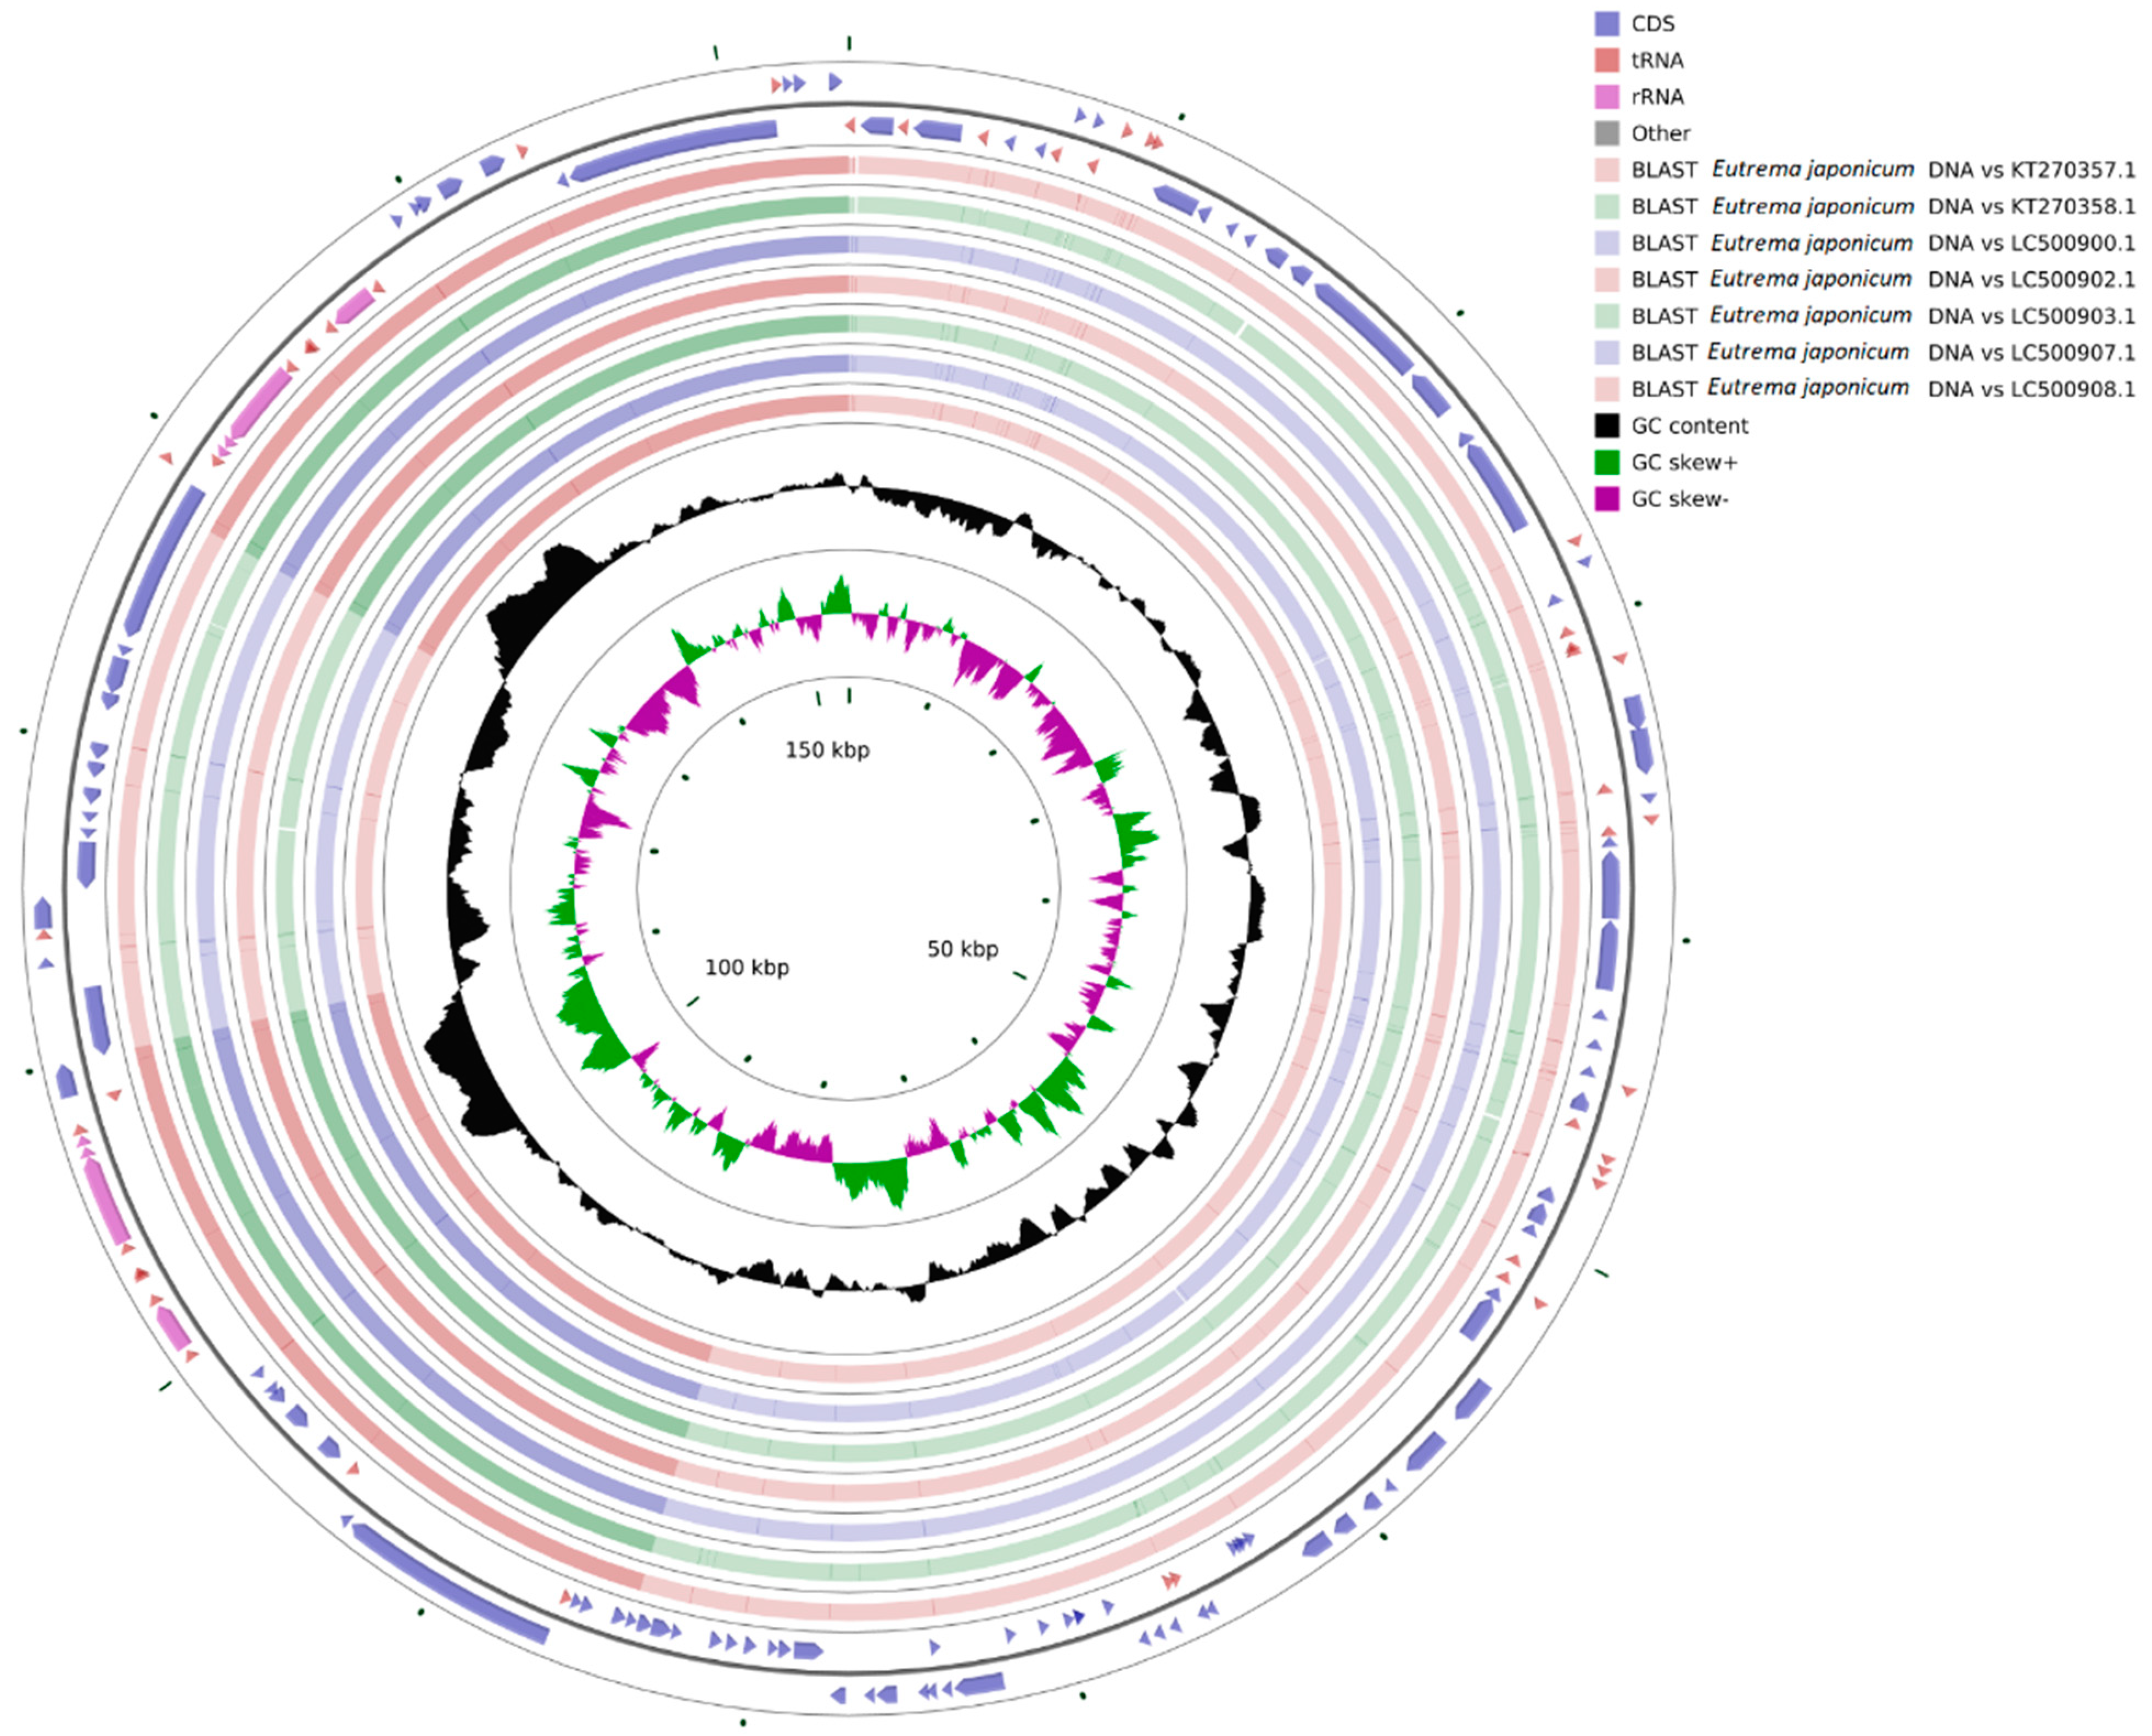
3.7. Genome Comparison and Collinearity Analysis

The annotated cp genome sequence of E. japonicum was used as a reference to analyze the sequence similarity between E. japonicum and other Eutrema species using CGview. There was a high similarity in the protein-coding regions of the cp genomes amongst the species. The coding regions of their rRNA were also greatly identical and had a high GC content. The four rRNA genes in the IR regions caused them to have a higher GC content than LSC and SSC contents (Figure 6). The collinearity analysis further revealed no large-scale gene rearrangements in the cp genome sequences of the eight species. In contrast, the sequences exhibited a high degree of collinearity, with differences only in the genome size, intron deletion, and IR expansion and contraction (Figure 7). These findings suggested that the cp genome of Eutrema species maintains a high degree of collinearity and conservation during the evolution process.

3.8. Genetic Divergence Analysis

The genetic differentiation of Eutrema plants can be measured by genetic distance. The genetic distance between Eutrema plants and other Brassicacea plants is from 0.0207 to 0.0086, showing that the genetic distance is small, but the difference between species is large. Eutrema species have the smallest genetic distance with Schrenkiella species, while have the largest with Capsella species. Among all the eight Eutrema plants, the genetic distance was between 0 (Eutrema japonicum MZ328719 vs. Eutrema japonicum LC500900.1) to 0.0042 (Eutrema tenue LC500908.1 vs. Eutrema heterophyllum KT270358.1). The results indicate that the differentiation degree in species is low, and the relationships in Eutrema species are close. Among which, wasabi has the closest relationship with Eutrema japonicum LC500900.1 with a genetic distance of 0, and it has the more distant relationship with Eutrema heterophyllum KT270358.1 with a genetic distance of 0.0041 (Figure 8).

3.9. Phylogenetic Analysis

Based on the calculation of genetic distance, E. japonicum maintained a high genetic similarity with the Brassicaceae plants (Figure 9). In the same line, Eutrema plants had a close relationship with Sinapis and Brassica plants. E. japonicum had a very close relationship with E. japonicum (LC500900.1) and formed a monophyletic branch, while E. tenue (LC500907.1) and E. yunnanense (KT270357.1) grouped separately. All Eutrema plants are clustered in the same branch with high support rates between the nodes. The evolutionary tree further revealed the significant differences between E. japonicum and E. heterophyllum (KT270358.1), despite the highly similar cp genomes of Eutrema species. These results were consistent with those of IR boundary analysis, suggesting that our analysis was accurate.

4. Discussion

4.1. Evolution of the Chloroplast Genome

To reconstruct plant phylogenies for interspecific classification, cp genomes have been widely used because of their highly conserved organizations and sequences [36]. Herein, the cp genome of E. japonicum exhibits a typical quadripartite structure, with 87 protein-coding genes, 37 tRNA genes, and 8 rRNA genes. The IR regions have the richest GC content (42.48%), followed by the LSC (34.06%) and SSC (29.38%) regions. The difference is attributed to the distribution of the 4 rRNA genes in the IR regions. These results are consistent with those of other studies of Brassicaceae species [37]. Compared to nuclear DNA, the types and number of chloroplast genes are certainly the same, proving the slow evolution rate and highly conserved feature of cp genomes. Cognizant of this, differences in the repeat sequences of the cp genome can be used as molecular markers for genetic diversity studies. The generation of forward repeats is usually related to the activity of transposons. These activities lead to genome structure changes that can be used as genetic markers for phylogenetic relationship studies [38]. In the same line, SSRs constitute an important part of the cp genome of higher plants and are powerful molecular markers for phylogenetic studies [39]. Herein, 290 SSRs primarily located in the LSC region were identified in the cp genome of E. japonicum. A large proportion of the mono-nucleotides were A and T. Their distribution in the genome was uneven, and their diversity was highly attributed to genome rearrangements. This finding was consistent with those obtained in Raphanus sativus L. [40] and Sinapis alba [37] implying that polyA and polyT repeats are common features of the cp genomes, while two pentanucleotides SSRs (ATCAA/TATCT) were only detected in the cp genome of E. japonicum but not in those of related species. The repeat sequences play an important role in genome rearrangement [41]. Herein, most repeats were forward repeats (F) and palindrome repeats (P). A large palindrome repeat, 26,017 bp in length, was found in the cp genome of E. japonicum, while other species like Nasturtium officinale R. Br. did not have such long repeats [42]. Cognizant of this, these repeat motifs will prove to be an informative source for developing markers for phylogenetic analysis, and can be used to identify different species.
The relative synonymous codon usage reflects the species’ gene expression and protein synthesis features to some extent [43]. As such, they provide a basis for studying species evolution at the molecular level. Herein, codons encoding leucine, isoleucine, and serine accounted for 26.93% of all codons, while those encoding cysteine accounted for only 1.22% of the total. This finding was consistent with the results observed in the cp genomes of other species like Psoralea corylifolium (L.) Medik [43] and menyanthaceae species [44]. E. japonicum was also similar to its related species, Sinapis alba, which prefers to end the protein-coding codons with A or U [37]. This phenomenon suggests that codon usage arises from the adaptive evolution of cp genomes and strongly implies that the gene composition of the cp genome in most higher plants is highly conserved.

4.2. Comparison Analysis of the Chloroplast Genome

The expansion and contraction of the IR regions are the primary reasons for changes in the length of the angiosperm cp genomes [45]. A comparison of the IR boundary of E. japonicum with that of seven Eutrema species revealed differences in 248 bases in the LSC region between the cp genomes. These differences were attributed to insertions or deletions of intergenic segments in the genes. For instance, the rps19 gene is located at the LSC/IRb boundary, with 113–119 bp located in the IRb region. This result is consistent with that of other Brassicaceae plants [37], suggesting that it is a common feature in the cp genome of plant species in the Brassicaceae family. Despite the cp genome length of E. heterophyllum (KT270358.1) and E. japonicum having a difference of only 24 bp, the position change of the rpl2, ycf1, ndhF, and trnN genes ranged between 1–14 bp. This difference was the largest amongst the Eutrema species compared to E. japonicum. This result was consistent with that of phylogenetic tree analysis, suggesting that E. heterophyllum (KT270358.1) is the most different Eutrema species.
Nucleotide diversity analysis helps to detect the hotspots containing evolutionary information for use as potential molecular markers [46]. Herein, higher Pi values were mainly detected in the IR regions of the cp genome of Eutrema species. This finding was inconsistent with those of other studies which report higher Pi values in the LSC and SSC regions than in the IR regions [35,47,48]. Notably, there were three genes: rrn4.5, rrn23, and rrn16, with extremely high Pi values in the IR region. The three were associated with high mutation rates and were thus deemed hotspots of the Eutrema species’ cp genome. As such, they could be used as potential molecular evolutionary markers for Eutrema species and provide a theoretical basis for further development of Eutrema species germplasm resources.
In contrast to E. japonicum, the Ka/Ks values of all genes of the seven Eutrema species were less than 0.5, suggesting that most protein-coding genes were undergoing intense purification selection pressure. There were 30 genes detected in the E. japonicum vs. E. heterophyllum (KT270358.1) comparison, but only 2 in the E. japonicum vs. E. japonicum (LC500900.1) comparison. This result was consistent with those of IR boundary and phylogenetic tree analysis. Amongst the genes compared, rpoC2 was different in seven species, while ndhF was mutated in six species. Previous studies postulated that rpoC2 is related to the self-replication of plants, while ndhF is closely related to plant photosynthesis. Both genes play an important role in improving the energy conversion efficiency of plants [49]. High mutation frequencies of genes between different species are deemed to occur as plants adapt to the environment. Cognizant of this, these genes can be used as molecular markers to distinguish the species closely related to Eutrema species.

4.3. Phylogenetic Analysis

The cp genomes of Eutrema species were highly conserved, but there were still differences. The genetic divergence analysis showed that the differentiation degree within Brassicaceae species was low, but it could be efficiently distinguished through genetic distance. The genetic distance of Schrenkiella parvula was the smallest, and a previous study showed that Schrenkiella parvula used to be classified as Eutrema parvula [50]. However, the genetic distance of Schrenkiella parvula is far larger than that within Eutrema species. To some extent, the genetic distance proved that Schrenkiella parvula did not belong to the Eutrema genus. Despite the genetic distance in Eutrema species being small, differences within species still existed, indicating that the cp sequences of Eutrema species were undergoing different evolution directions.
The results of phylogenetic analysis are consistent with those of genetic divergence analysis, and they further revealed that E. japonicum has a close genetic relationship with Eutrema species. Despite numerous results herein suggesting that the cp genomes of E. japonicum and seven Eutrema species are relatively conserved, some differences exist between species. Herein, the phylogenetic and genome structure analysis of the wasabi cp genome enriched the plant DNA information and laid a foundation for cp genome-based molecular breeding and genetic transformation studies of Eutrema plants.

5. Conclusions

The present study describes the comparative nucleotide sequences of E. japonicum chloroplasts. The wasabi chloroplast genome (153,851 bp) was fully sequenced and compared to seven Eutrema species. Herein, 37 rRNA genes, 8 rRNA genes and 87 protein-coding genes were detected. Phylogenetic analysis showed that E. japonicum has a close genetic relationship with Eutrema species. Three potential hotspots (rrn16, rrn4.5 and rrn23) were identified in the IR region, and were developed as molecular markers. These molecular markers could distinguish the related wasabi species, providing a theoretical basis for further studying and breeding of Eutrema species’ germplasm resources.

Supplementary Materials

The following are available online at https://www.mdpi.com/article/10.3390/agronomy11122546/s1, Table S1: Reference sequences of 30 Brassicacea species used in the construction of phylogenetic trees. Table S2: Synonymous (Ks) and non-synonymous (Ks) substitution rate between E. japonica and other seven Eutrema species.

Author Contributions

Conceptualization, M.L. and Y.Z.; data curation, R.Z.; formal analysis, M.L., R.Z. and K.Z.; investigation, J.L.; software, J.X.; writing—original draft preparation, R.Z.; writing—review and editing, M.L.; funding acquisition, Y.Z. All authors have read and agreed to the published version of the manuscript.

Funding

This research was funded by the Sichuan Science and Technology Program (grant number 2020ZHFP0066 and 2021ZHFP0027) and the Shuangzhi project of Sichuan Agricultural University (grant number 035-993546).

Institutional Review Board Statement

Not applicable.

Informed Consent Statement

Not applicable.

Data Availability Statement

The cp genome sequence of W. japonica generated in this study were deposited at: https://www.ncbi.nlm.nih.gov/genbank/ (accessed on 1 December 2021) under the accession numbers MZ328719.

Conflicts of Interest

The authors declare no conflict of interest.

References

  1. Hsuan, S.W.; Chyau, C.C.; Hung, H.Y.; Chen, J.H.; Chou, F.P. The induction of apoptosis and autophagy by Wasabia japonica extract in colon cancer. Eur. J. Nutr. 2016, 55, 491–503. [Google Scholar] [CrossRef] [PubMed]
  2. Murillo, G.; Mehta, R.G. Cruciferous Vegetables and Cancer Prevention. Nutr. Cancer 2001, 41, 17–18. [Google Scholar] [CrossRef]
  3. Mancuso, M. Wasaby (Wasabia japonica): A Natural Antimicrobial Agent for Food Preservation. J. Fish. Livest. Prod. 2017, 5, 1. [Google Scholar] [CrossRef]
  4. Nhung, N.H.; Yoshiaki, K.; Toshio, S.; Ryosuke, E. Effects of supporting materials in in vitro acclimatization stage on ex vitro growth of wasabi plants. Sci. Hortic. 2020, 261, 109042. [Google Scholar] [CrossRef]
  5. Li, J.L.; Lee, W.; Lee, W.J.; Auh, J.H.; Kim, S.; Yoon, J. Extraction of allyl isothiocyanate from wasabi (Wasabia japonica Matsum) using supercritical carbon dioxide. Food Sci. Biotechnol. 2010, 19, 405–410. [Google Scholar] [CrossRef]
  6. Palmer, J. Germination and growth of wasabi (Wasabia japonica (Miq.) Matsumara). N. Z. J. Crop Hortic. Sci. 2012, 18, 2–164. [Google Scholar] [CrossRef] [Green Version]
  7. Daniell, H.; Lin, C.S.; Yu, M.; Chang, W.J. Chloroplast genomes: Diversity, evolution, and applications in genetic engineering. Genome Biol. 2016, 17, 134. [Google Scholar] [CrossRef] [Green Version]
  8. Wen, F.; Wu, X.Z.; Jia, M.L.; Liu, X.S.; Liao, L. The complete chloroplast genome of Stauntonia chinensis and compared analysis revealed adaptive evolution of subfamily Lardizabaloideae species in China. BMC Genom. 2021, 22, 161. [Google Scholar] [CrossRef]
  9. Chen, N.; Sha, L.N.; Dong, Z.Z.; Tang, C.; Wang, Y.; Kang, H.Y.; Zhang, H.Q.; Yan, X.B.; Zhou, Y.H.; Fan, X. Complete structure and variation of the chloroplast genome of Agropyron cristatum (L.) Gaertn. Gene 2018, 640, 86–96. [Google Scholar] [CrossRef]
  10. Liang, C.L.; Wang, L.; Lei, J.; Duan, B.Z.; Ma, W.S.; Xiao, S.M.; Qi, H.J.; Wang, Z.; Liu, Y.Q.; Shen, X.F.; et al. A Comparative Analysis of the Chloroplast Genomes of Four Salvia Medicinal Plants. Engineering 2019, 5, 907–915. [Google Scholar] [CrossRef]
  11. Zuo, R.H.; Jiang, P.; Sun, C.B.; Chen, C.W.; Lou, X.J. Analysis of the chloroplast genome characteristics of Rhus chinensis by de novo sequencing. Chin. J. Biotechnol. 2020, 36, 772–781. [Google Scholar] [CrossRef]
  12. Deng, G.; Yang, M.; Zhao, K.Y.; Yang, Y.; Huang, X.; Cheng, X. The complete chloroplast genome of Cannabis sativa variety Yunma 7. Mitochondrial DNA B 2021, 6, 531–532. [Google Scholar] [CrossRef] [PubMed]
  13. Wang, S.H.; Deng, G.Z.; Gao, J.Y.; Liu, H.M.; Zhou, X.Y.; Yue, J.Q.; Dong, M.C.; Yang, F.; Zhou, D.G.; Guo, L.N.; et al. Characterization of the complete chloroplast genome of ‘Yunning No.1′ lemon (Citrus limon). Mitochondrial DNA B 2021, 6, 425–427. [Google Scholar] [CrossRef]
  14. Rasheed, S.; Zaidi, S.; Azim, M.K. The chloroplast genome sequence of Momordica charantia L. (bitter gourd). Gene Rep. 2020, 21, 100963. [Google Scholar] [CrossRef]
  15. Yang, J.H.; Li, Z.P.; Lian, J.M.; Qi, G.N.; Shi, P.B.; He, J.W.; Hu, Z.Y.; Zhang, M.F. Brassicaceae transcriptomes reveal convergent evolution of super-accumulation of sinigrin. Commun. Biol. 2020, 3, 779. [Google Scholar] [CrossRef]
  16. Hashimoto, K.; Tashima, K.; Imai, T.; Matsumoto, K.; Horie, S. The rodent model of impaired gastric motility induced by allyl isothiocyanate, a pungent ingredient of wasabi, to evaluate therapeutic agents for functional dyspepsia. J. Pharm. Sci. 2021, 145, 122–129. [Google Scholar] [CrossRef]
  17. Haga, N.; Kobayashi, M.; Michiki, N.; Takano, T.; Baba, F.; Kobayashi, K.; Ohynagi, H.; Ohgane, J.; Yano, K.; Ynmane, K. Complete chloroplast genome sequence and phylogenetic analysis of wasabi (Eutrema japonicum) and its relatives. Sci. Rep. 2019, 9, 14377. [Google Scholar] [CrossRef]
  18. Aboul-Maaty, N.A.F.; Oraby, H.A.S. Extraction of high-quality genomic DNA from different plant orders applying a modified CTAB-based method. Bull. NRC 2019, 43, 25. [Google Scholar] [CrossRef] [Green Version]
  19. Li, M.Y.; Xie, F.J.; Li, J.; Sun, B.; Luo, Y.; Zhang, Y.; Chen, Q.; Wang, Y.; Zhang, F.; Zhang, Y.T.; et al. Tumorous Stem Development of Brassica Juncea: A Complex Regulatory Network of Stem Formation and Identification of Key Genes in Glucosinolate Biosynthesis. Plants 2020, 9, 1006. [Google Scholar] [CrossRef]
  20. Yao, J.J.; Zhao, F.Y.; Xu, Y.J.; Zhao, K.H.; Quan, H.; Su, Y.J.; Hao, P.Y.; Liu, J.; Yu, B.X.; Yao, M.; et al. Complete Chloroplast Genome Sequencing and Phylogenetic Analysis of Two Plants. BioMed Res. Int. 2020, 2020, 4374801. [Google Scholar] [CrossRef]
  21. Bankevich, A.; Nurk, S.; Antipov, D.; Gurevich, A.A.; Dvorkin, M.; Kulikov, A.S.; Lesin, V.M.; Nikolenko, S.I.; Pham, S.; Prjibelski, A.D.; et al. SPAdes: A new genome assembly algorithm and its applications to single-cell sequencing. J. Comput. Biol. 2012, 19, 455–477. [Google Scholar] [CrossRef] [PubMed] [Green Version]
  22. Boetzer, M.; Pirovano, W. Toward almost closed genomes with GapFiller. Genome Biol. 2012, 13, 821–829. [Google Scholar] [CrossRef] [PubMed] [Green Version]
  23. Lohse, M.; Drechsel, O.; Bock, R. OrganellarGenomeDRAW (OGDRAW): A tool for the easy generation of high-quality custom graphical maps of plastid and mitochondrial genomes. Curr. Genet. 2007, 52, 267–274. [Google Scholar] [CrossRef]
  24. Kurtz, S.; Choudhuri, J.V.; Ohlebusch, E.; Schleiermacher, C.; Stoye, J.; Giegerich, R. REPuter: The manifold applications of repeat analysis on a genomic scale. Nucleic Acids Res. 2001, 29, 4633–4642. [Google Scholar] [CrossRef] [Green Version]
  25. Wu, M.L.; Li, Q.; Hu, Z.G.; Li, X.W.; Chen, S.L. The Complete Amomum kravanh Chloroplast Genome Sequence and Phylogenetic Analysis of the Commelinids. Molecules 2017, 22, 1875. [Google Scholar] [CrossRef] [Green Version]
  26. Librado, P.; Rozas, J. DnaSP v5: A software for comprehensive analysis of DNA polymorphism data. Bioinformatics 2009, 25, 1451–1452. [Google Scholar] [CrossRef] [PubMed] [Green Version]
  27. Grant, J.R.; Stothard, P. The CGView Server: A comparative genomics tool for circular genomes. Nucleic Acids Res. 2008, 36, W181–W184. [Google Scholar] [CrossRef]
  28. Darling, A.C.E.; Mau, B.; Blattner, R.F.; Perna, T.N. Mauve: Multiple Alignment of Conserved Genomic Sequence With Rearrangements. Genome Res. 2004, 14, 1394–1403. [Google Scholar] [CrossRef] [Green Version]
  29. Katoh, K.; Standley, D.M. MAFFT Multiple Sequence Alignment Software Version 7: Improvemems in Performance and Usability. Mol. Biol. Evol. 2013, 30, 772–780. [Google Scholar] [CrossRef] [Green Version]
  30. Cui, N.; Liao, B.S.; Liang, C.L.; Li, S.F.; Zhang, H.; Xu, J.; Li, X.W.; Chen, S.L. Complete chloroplast genome of Salvia plebeia: Organization, specific barcode and phylogenetic analysis. Chin. J. Nat. Med. 2020, 18, 563–572. [Google Scholar] [CrossRef]
  31. Jiao, Y.; Jia, H.M.; Li, X.W.; Chai, M.L.; Jia, H.J.; Chen, Z.; Wang, G.Y.; Chai, C.Y.; Weg, V.D.E.; Gao, Z.S. Development of simple sequence repeat (SSR) markers from a genome survey of Chinese bayberry (Myrica rubra). BMC Genom. 2012, 13, 201. [Google Scholar] [CrossRef] [Green Version]
  32. Singh, R.B.; Mahenderakar, M.D.; Jugran, A.K.; Singh, R.K.; Srivastava, R.K. Assessing genetic diversity and population structure of sugarcane cultivars, progenitor species and genera using microsatellite(SSR)markers. Gene 2020, 753, 144800. [Google Scholar] [CrossRef]
  33. Wang, L.; He, N.; Li, Y.; Fang, Y.M.; Zhang, F.L. Complete Chloroplast Genome Sequence of Chinese Lacquer Tree (Toxicodendron vernicifluum, Anacardiaceae) and Its Phylogenetic Significance. BioMed Res. Int. 2020, 2020, 9014873. [Google Scholar] [CrossRef] [Green Version]
  34. Gu, C.H.; Dong, B.; Xu, L.; Tenmbrock, L.R.; Zheng, S.Y.; Wu, Z.Q. The Complete Chloroplast Genome of Heimia myrtifolia and Comparative Analysis within Myrtales. Molecules 2018, 23, 846. [Google Scholar] [CrossRef] [Green Version]
  35. Jiang, W.L.; Tan, W.; Gao, H.; Yu, X.L.; Zhang, H.Y.; Bian, Y.H.; Wang, Y.; Tian, X.X. Transcriptome and complete chloroplast genome of Glycyrrhiza inflata and comparative analyses with the other two licorice species. Genomics 2020, 112, 4179–4188. [Google Scholar] [CrossRef]
  36. Sheng, J.J.; Yan, M.; Wang, J.; Zhao, L.L.; Zhou, F.S.; Hu, Z.L.; Jin, S.R.; Diao, Y. The complete chloroplast genome sequences of five Miscanthus species, and comparative analyses with other grass plastomes. Ind. Crop. Prod. 2021, 162, 113248. [Google Scholar] [CrossRef]
  37. Du, X.Y.; Zeng, T.; Feng, Q.; Hu, L.J.; Luo, X.; Weng, Q.B.; He, J.F.; Zhu, B. The complete chloroplast genome sequence of yellow mustard (Sinapis alba L.) and its phylogenetic relationship to other Brassicaceae species. Gene 2020, 731, 144340. [Google Scholar] [CrossRef] [PubMed]
  38. Yang, L.; Feng, C.; Cai, M.M.; Chen, J.H.; Ding, P. Complete chloroplast genome sequence of Amomum villosum and comparative analysis with other Zingiberaceae plants. Chin. Herb. Med. 2020, 12, 375–383. [Google Scholar] [CrossRef]
  39. Jun, L.; Xie, D.F.; Guo, X.L.; Zheng, Z.Y.; He, X.J.; Zhou, S.D. Comparative Analysis of the Complete Plastid Genome of Five Bupleurum Species and New Insights into DNA Barcoding and Phylogenetic Relationship. Plants 2020, 9, 543. [Google Scholar] [CrossRef]
  40. Jeong, Y.M.; Chung, W.H.; Mum, J.H.; Kim, N.; Yu, H.J. De novo assembly and characterization of the complete chloroplast genome of radish (Raphanus sativus L.). Gene 2014, 551, 39–48. [Google Scholar] [CrossRef]
  41. Nie, X.J.; Lv, S.Z.; Zhang, Y.X.; Du, X.H.; Biradar, S.S.; Tan, X.F.; Wan, F.H.; Song, W.N. Complete chloroplast genome sequence of a major invasive species, crofton weed (Ageratina adenophora). PLoS ONE 2018, 7, e36869. [Google Scholar] [CrossRef] [Green Version]
  42. Yan, C.; Du, J.C.; Gao, L.; Li, Y.; Hou, X.L. The complete chloroplast genome sequence of watercress (Nasturtium officinale R. Br.): Genome organization, adaptive evolution and phylogenetic relationships in Cardamineae. Gene 2019, 699, 24–36. [Google Scholar] [CrossRef]
  43. Tan, W.; Gao, H.; Zhang, H.Y.; Yu, X.L.; Tian, X.X.; Jiang, W.L.; Zhou, K. The complete chloroplast genome of Chinese medicine (Psoralea corylifolia: Molecular structures, barcoding and phylogenetic analysis. Plant Gene 2020, 21, 100216. [Google Scholar] [CrossRef]
  44. Njuguna, A.W.; Li, Z.Z.; Saina, J.K.; Munywoki, J.M.; Gichira, A.W.; Gituru, R.W.; Wang, Q.F.; Chen, J.M. Comparative analyses of the complete chloroplast genomes of nymphoides and menyanthes species (menyanthaceae). Aquat. Bot. 2019, 156, 73–81. [Google Scholar] [CrossRef]
  45. Niu, Y.T.; Jabbour, F.; Barrett, R.L.; Ye, J.F.; Zhang, Z.Z.; Lu, K.Q.; Lu, L.M.; Chen, Z.D. Combining complete chloroplast genome sequences with target loci data and morphology to resolve species limits in Triplostegia (Caprifoliaceae). Mol. Phylogenet. Evol. 2018, 129, 15–26. [Google Scholar] [CrossRef]
  46. Wang, W.C.; Chen, S.Y.; Zhang, X.Z. Whole-Genome Comparison Reveals Heterogeneous Divergence and Mutation Hotspots in Chloroplast Genome of Eucommia ulmoides Oliver. Int. J. Mol. Sci. 2018, 19, 1037. [Google Scholar] [CrossRef] [Green Version]
  47. Cui, Y.X.; Zhou, J.G.; Chen, X.L.; Xu, Z.C.; Wang, Y.; Sun, W.; Song, J.Y.; Yao, H. Complete chloroplast genome and comparative analysis of three Lycium (Solanaceae) species with medicinal and edible properties. Gene Rep. 2019, 17, 100464. [Google Scholar] [CrossRef]
  48. Zhang, T.T.; Xing, Y.P.; Xu, L.; Bao, G.H.; Zhan, Z.L.; Yang, Y.Y.; Wang, J.H.; Li, S.N.; Zhang, D.C.; Kang, T.G. Comparative analysis of the complete chloroplast genome sequences of six species of Pulsatilla Miller, Ranunculaceae. Chin. Med. 2019, 14, 104–802. [Google Scholar] [CrossRef] [Green Version]
  49. Liu, H.Y.; Yu, Y.; Deng, Y.Q.; Li, J.; Huang, Z.X.; Zhou, S.D. The Chloroplast Genome of Lilium henrici: Genome Structure and Comparative Analysis. Molecules 2018, 23, 1276. [Google Scholar] [CrossRef] [PubMed] [Green Version]
  50. Cheeseman, J.M. The evolution of halophytes, glycophytes and crops, and its implications for food security under saline conditions. New Phytol. 2015, 206, 557–570. [Google Scholar] [CrossRef]
Figure 1. Plastid genome map of Eutrema japonicum. Genes shown outside the circle are forward encoded, while genes inside are reverse encoded. The grey area in the inner circle refers to the GC content.
Agronomy 11 02546 g001
Figure 2. Number of SSRs identified in the cp genome of Eutrema japonicum. The X-axis represents the repeat units of SSRs, while the Y-axis represents the number of SSRs.
Agronomy 11 02546 g002
Figure 3. Number of dispersed repeats in the cp genome of Eutrema japonicum. The X-axis represents the types of dispersed repeats, while the Y-axis represents the number of dispersed repeats. F: forward repeat; P: palindrome repeat; R: reverse repeat; C: complementary repeat.
Agronomy 11 02546 g003
Figure 4. Nucleotide diversity (Pi) values among Eutrema plants. The X-axis represents the gene name, while the Y-axis represents the Pi value.
Agronomy 11 02546 g004
Figure 5. Comparison of IR-SC border position across cp genomes of seven Eutrema species. Thin lines between each colored boxes represent the connection points. Number above the gene features indicates the length of each gene and the distance between the ends of genes and the border sites.
Agronomy 11 02546 g005
Figure 6. Comparison analysis between Eutrema japonicum and six Eutrema species. The outer two circles describe the gene length and direction of the genome. The inner circles describe the similarity results compared with cp genomes of six Eutrema species.
Agronomy 11 02546 g006
Figure 7. Alignment of the cp genomes of Eutrema japonicum and seven Eutrema species. The lines between each long square represent a collinearity relationship, while the short square represents the gene position of each cp genome. The blocks with white, red, and green colors represent CDS, tRNA and rRNA, respectively.
Agronomy 11 02546 g007
Figure 8. Genetic distances of cp genomes of 30 Brassicaceae plants. The numbers in boxes refer to the genetic distance between Eutrema japonicum and other 29 Brassicaceae plants. The shades of different colors represent the distance between Eutrema japonicum and other plants. Lighter color means a close relationship, while darker color means a distant relationship.
Agronomy 11 02546 g008
Figure 9. The maximum likelihood (ML) phylogenetic tree based on 30 species. Numbers beside nodes indicate bootstrap support values.
Agronomy 11 02546 g009
Table 1. List of genes in the Eutrema japonicum chloroplast genome.
CategoryGene GroupGene Name
PhotosynthesisSubunits of
photosystem I
psaA, psaB, psaC, psaI, psaJ
Subunits of
photosystem II
psbA, psbB, psbC, psbD, psbE, psbF, psbH, psbI, psbJ, psbK, psbL, psbM, psbN, psbT, psbZ
Subunits of NADH dehydrogenasendhA *, ndhB * (2), ndhC, ndhD, ndhE, ndhF, ndhG, ndhH, ndhI, ndhJ, ndhK
Subunits of cytochrome b/f complexpetA, petB *, petD *, petG, petL, petN
Subunits of ATP synthaseatpA, atpB, atpE, atpF *, atpH, atpI
Large subunit of rubiscorbcL
Subunits photochlorophyllide reductase
Self-replicationProteins of large ribosomal subunitrpl14, rpl16 *, rpl2 * (2), rpl20, rpl22, rpl23(2), rpl32, rpl33, rpl36
Proteins of small ribosomal subunitrps11, rps12 * (2), rps14, rps15, rps16 *, rps18, rps19, rps2, rps3, rps4, rps7(2), rps8
Subunits of RNA polymeraserpoA, rpoB, rpoC1 *, rpoC2
Ribosomal RNAsrrn16(2), rrn23(2), rrn4.5(2), rrn5(2)
Transfer RNAstrnA-UGC * (2), trnC-GCA, trnD-GUC, trnF-GAA, trnG-GCC, trnG-UCC *, trnH-GUG, trnI-GAU, trnI-GAU * (3), trnK-UUU *, trnL-CAA(2), trnL-UAA *, trnL-UAG, trnM-CAU(4), trnN-GUU(2), trnP-UGG, trnQ-UUG, trnR-ACG(2), trnR-UCU, trnS-GCU, trnS-GGA, trnS-UGA, trnT-GGU, trnT-UGU, trnV-GAC(2), trnV-UAC *, trnW-CCA, trnY-GUA
Other genesMaturasematK
ProteaseclpP **
Envelope membrane proteincemA
Acetyl-CoA carboxylaseaccD
C-type cytochrome synthesis geneccsA
Translation initiation factor-
other-
Genes of
unknown function
Conserved hypothetical chloroplast ORFycf1(2), ycf15(2), ycf2(2), ycf3 **, ycf4
* means a gene with one intron; ** means a gene with two introns. The number in parentheses means the number of gene copies.
Table 2. RSCU analysis of protein coding regions in Eutrema japonicum.
Amino AcidCodonNumberRSCUAmino AcidCondonNumberRSCU
AlaGCA3881.128ProCCA3051.1348
GCC2050.596CCC1980.7368
GCG1560.4536CCG1470.5468
GCU6271.8228CCU4251.5812
CysUGC850.5246GlnCAA7481.5682
UGU2391.4754CAG2060.4318
AspGAC1890.361ArgAGA4761.8078
GAU8581.639AGG1650.6264
GluGAA10541.5122CGA3661.3896
GAG3400.4878CGC1100.4176
PheUUC5280.6588CGG1220.4632
UUU10751.3412CGU3411.2948
GlyGGA7381.6696SerAGC1240.3654
GGC1630.3688AGU4091.2048
GGG2820.638UCA4111.2108
GGU5851.3236UCC3080.9072
HisCAC1500.4816UCG2020.5952
CAU4731.5184UCU5831.7172
IleAUA7380.9627ThrACA4181.2268
AUC4240.5529ACC2470.7248
AUU11381.4844ACG1460.4284
LysAAA11601.5354ValACU5521.62
AAG3510.4646GUA5051.4296
LeuCUA3950.8346GUC1840.5208
CUC1840.3888GUG2060.5832
CUG1730.3654GUU5181.4664
CUU6011.2702TrpUGG4581
UUA9542.016TyrUAC1810.3706
UUG5321.1244UAU7961.6294
MetAUG6061.9868Ter *UAA491.6896
GUG40.0132UAG240.8277
AsnAAC3040.4662UGA140.4827
AAU10001.5338
* means the gene with one intron.
Table 3. KaKs statistics of Eutrema japonicum.
GroupsEach GeneAll Genes
Ka/Ks > 1Ka/Ks = 1Ka/Ks < 1KaKsKa/Ks
Eutrema japonicum vs. KT270357.100100.0246120190.073345970.34
Eutrema japonicum vs. KT270358.120280.2355501010.637147080.37
Eutrema japonicum vs. LC500900.10020.8743970581.9318231370.45
Eutrema japonicum vs. LC500902.11050.8867637041.964693810.45
Eutrema japonicum vs. LC500903.10030.8770176511.955584730.45
Eutrema japonicum vs. LC500907.100110.8959882462.027936390.44
Eutrema japonicum vs. LC500908.10060.8829249661.962880910.45
Publisher’s Note: MDPI stays neutral with regard to jurisdictional claims in published maps and institutional affiliations.

