Article

Comparative Metagenomic and Metabolomic Profiling of Rhizospheres of Panax notoginseng Grown under Forest and Field Conditions

1
Key Laboratory for Forest Resources Conservation and Utilization in the Southwest Mountains of China, Ministry of Education, Southwest Landscape Architecture Engineering Research Center of National Forestry and Grassland Administration, Southwest Forestry University, Kunming 650224, China
2
Department of Entomology, Agricultural Research Organization (ARO), Gilat Research Center for Arid & Semi-Arid Agricultural Research, Rishon LeZion 85280, Israel
3
Katif Research Center, Sedot Negev, the Ministry of Science, Technology & Space, Netivot 85200, Israel
*
Author to whom correspondence should be addressed.
Same contribution.
Agronomy 2021, 11(12), 2488; https://doi.org/10.3390/agronomy11122488
Submission received: 4 November 2021 / Revised: 27 November 2021 / Accepted: 1 December 2021 / Published: 8 December 2021

Abstract

:
The present study investigated the potential changes in the structure of bacterial communities and their functional profiles in the rhizospheres of Panax notoginseng cultivated under field (CK) and pine forest conditions (T). The rhizospheres of two-year-old P. notoginseng plants were used to extract DNA for metagenomic sequencing and metabolites for metabolomic profiling. The results revealed a higher root weight (p < 0.05) in plants grown under the forest than CK. The rhizospheric bacterial community comprised mainly three dominant phyla including Acidobacteria, Proteobacteria, and Candidatus rokubacteria which accounted for 75% of the total microbial population. Among them, Acidobacteria was the most abundant bacterial taxa, accounting for 42.4% and 40.4% of the total populations in CK and T, respectively. Relative abundances of bacterial genera revealed that Bradyrhizobium, Candidatus koribacter and Edaphobacter, were the dominant genera in both groups. Comparatively, a higher Proteobacteria to Acidobacteria ratio was observed in forest rhizospheres than in field conditions. Candidatus Rokubacteria and Candidatus nitrostelea were identified as biomarker taxa in forest rhizospheres, while the same could be said for taxa belonging to betaproteobacteria and gammaproteobacteria, Burkholderiales and Verrucomicrobia for field rhizospheres. No differential metabolite contents were observed between the two rhizosphere groups, indicating no adverse effects of P. notoginseng cultivation on the soil quality under forest plantation.

1. Introduction

Panax notoginseng is a perennial herb of P. ginseng, which has a long history of medicinal uses all over the world, particularly in China. It is characterized as a unique Chinese herbal medicine. Its roots and flowers have medicinal uses and are complimentary ingredients of Yunnan Baiyao, Xuesaitong and other Chinese patent medicines owing to its blood-enhancing effects [1]. P. notoginseng production has always been challenging due to the optimum growth environment and serious continuous cropping obstacles, contributing to its short supply [2]. The main active contents of P. notoginseng are usually affected by various climatic factors and soil properties [2,3]. Nevertheless, the microbial communities inhabiting the rhizosphere directly affect the metabolites of host plants with an impact on the efficacy of herbal drugs [4].
Studies have shown that the cultivation of P. ginseng decreased the diversity of rhizosphere bacteria while increasing the fungal diversity at the root growth stage in comparison to other plant developmental (vegetative, flowering and fruiting) stages [5]. The soil microbiome plays a crucial role in sustaining the stability and health of the soil ecological systems. The structure and diversity of soil microbes can affect the soil quality and plant health beneficially or adversely [6]. Hence, it is important to study the variations in the soil microbial communities under different cropping systems and modes of cultivation.
Farmers cannot cultivate P. notoginseng on the same land continuously for several years or even decades, due to its high requirements for soil quality [7]. Continuous planting of P. notoginseng results in root rot and rusty roots due to a higher incidence of soilborne diseases [8,9]. This scenario is leading to a sharp increase in large-scale deforestation, which is not only damaging forest resources but is also threatening the sustainability of P. notoginseng as a medicinal crop. Moreover, it is also creating a conflict between entrepreneurs related to P. notoginseng business and the forest industry that requires urgent attention. Many studies have indicated that factors responsible for discontinuous planting obstacles include a decline in soil quality, incidence of soilborne diseases, abrupt changes in community structure of soil microbes, and autotoxicity of P. notoginseng [9,10,11]. This scenario necessitates investigating the cultivation of P. notoginseng under forests, to evaluate its subsequent effects on the soil microbiome and metabolites. It is imperative to understand how P. notoginseng plantation can affect soil quality under forest conditions. The planting of P. notoginseng under forest conditions can yield high-quality organic P. notoginseng owing to pollution-free soil and environment, in comparison to traditional cultivation under field conditions [5].
Furthermore, it is worth mentioning that wild species of P. notoginseng mainly grow in the forest. Forests are the largest terrestrial ecosystems on earth, and P. notoginseng grown under the pine trees can increase biodiversity. Plant diversity not only increases the accumulation of photosynthate-fixed carbon but also enhances the carbon input from the rhizosphere to the microbial community [12], subsequently resulting in improved microbial activity and carbon storage [13]. Coniferous forests, especially artificial coniferous forests, are considered the most suitable for the cultivation of Chinese herbs including P. notoginseng [14]. The artificial coniferous forest has the advantages of clear spacing between plants, little shrubs with an underdeveloped root system, and convenient soil preparation [15]. The volatiles of pine needles can effectively inhibit the occurrence of diseases of roots in P. notoginseng which can potentially improve growth and yield.
Therefore, it is important to compare the differences in metabolites of the rhizospheres of P. notoginseng cultivated under different modes (under forest and field conditions), to provide insights into interventional strategies for further improving the growth and quality of P. notoginseng [16,17]. In the present study, we performed the metagenomic and metabolomic profiling of P. notoginseng to evaluate the effect of the host plant on soil microbial communities and metabolites of rhizosphere. The effect of two cultivation modes on the secondary metabolism of P. notoginseng was studied to identify the potential effects on structure, diversity and biomarkers of microbial communities. The present study generated baseline data on the effects of cultivation of P. notoginseng on soil quality, and will serve as a theoretical basis for forest sustainable management along with improvement in growth and yield of P. notoginseng.

2. Materials and Methods

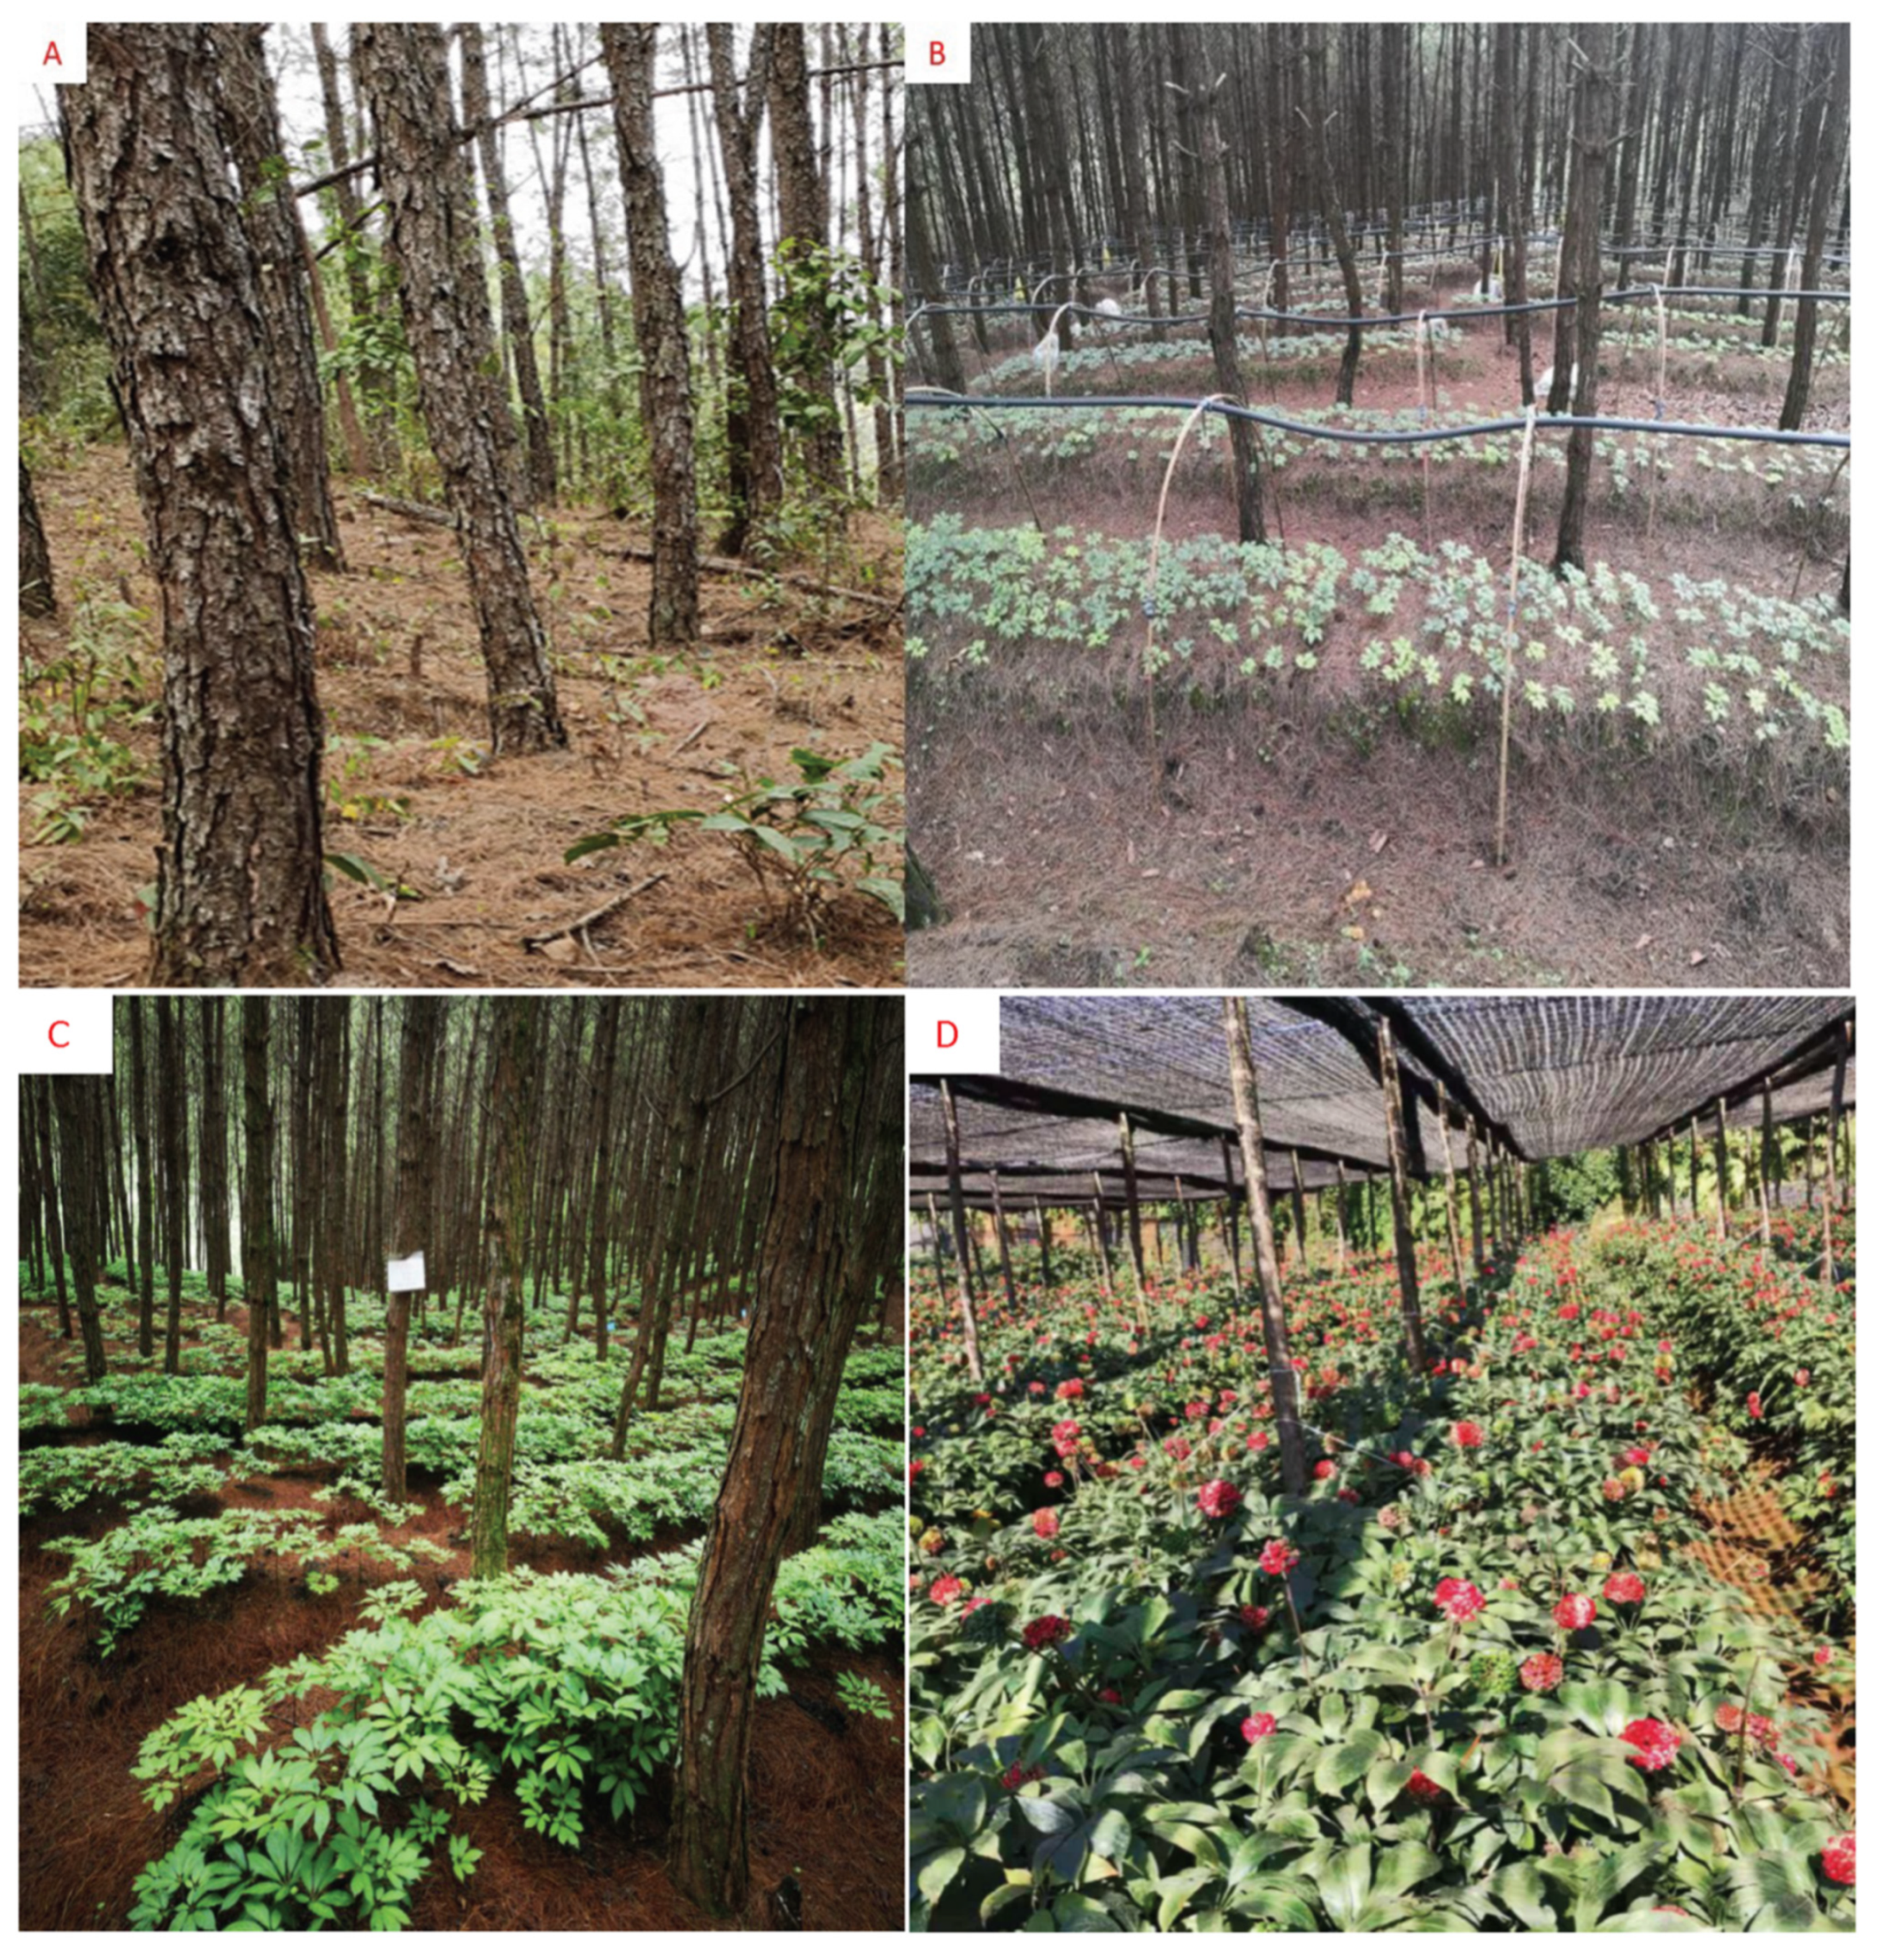
2.1. Experimental Sites and Collection of Rhizosphere Samples

The rhizosphere soil samples of P. notoginseng cultivated under Simao pine forest and in the field for two years ([email protected]) were collected on 20 March 2021, from the Sanqi Base, Zhutang Township, Lancang County, Yunnan Province (22°73′ N, 20°93′ E) at an altitude of 1457.39 m (Figure 1). The pH value of the soil ranged from 5.5–6.5, and the average annual temperature was 18–25 °C. The P. notoginseng plants were transplanted at the age of one year on 20 cm-high ridges of soil made between the pine trees. The stratified sampling (S-shaped) five-point method was employed to collect three soil samples for each experimental group. The surface layer was topsoil from 0 cm to 10 cm, the root layer from 10–20 cm to 30 cm, and the bottom layer >30 cm. Three understory rhizosphere soil samples (biological replicates) and three field rhizosphere soil samples were randomly collected. Three understory rhizosphere soil samples (T1, T2, and T3) and three field rhizosphere soil samples (CK1, CK2, and CK3) were then randomly prepared. Fresh soil samples were placed into sterile self-sealed bags and quickly brought back to the laboratory in an ice box. Samples were passed through a 20-mesh sieve to remove sundries and stored at −80 °C for later use. Moreover, plant height (length of aboveground parts), root length (length of belowground parts), and root weight were also recorded for both groups.

2.2. DNA Extraction, Library Preparation and Metagenomic Sequencing

DNA from P. notoginseng rhizosphere samples were extracted using a commercial kit (EZNA® Soil DNA Kit, Omega Biotek, Inc., Norcross, GA, USA) following the manufacturer’s instructions. The quantification of DNA was performed by using the NanoDrop 2000-UV spectrophotometer (Thermo Scientific, Waltham, MA, USA), and the quality of DNA was observed by running extracted DNA samples on 1% agarose gel.
For the library preparation, a total of 1 μg DNA from each sample was used. Sequencing libraries were constructed using NEBNext® Ultra™ DNA Library Prep Kit for Illumina (NEB, Ipswich, MA, USA) following the manufacturer’s instructions [18]. Briefly, the DNA samples were fragmented to a size of about 350 bp by sonication, then DNA fragments underwent end-repair, A-tailing, and adapter ligation, purification and PCR amplification for Illumina sequencing. Finally, PCR products were purified (AMPure XP system, Beckman Coulter, Brea, CA, USA) and libraries were analyzed for size distribution by Agilent 2100 Bioanalyzer (Agilent Technologies, Palo Alto, CA, USA) and quantified using real-time PCR [18].
The clustering of the index-coded samples was performed on a cBot Cluster Generation System (Illumina, San Diego, CA, USA) according to the manufacturer’s instructions. After cluster generation, the library preparations were sequenced on an Illumina PE150 platform at Wuhan Metware Biological Technology Co., Ltd. (Wuhan, China) and 150 bp paired-end reads were generated [18].

2.3. Sequence Quality Control and Assembly

For quality control of sequence data, trimming of raw data from the Illumina PE150 platform was used to obtain high-quality clean reads. The quality control criteria included low-quality base (score ≤ 38) 40 bp, ambiguous base (N) 10 bp, and overlap with adapter sequences of 15 bp as a cutoff. Clean data thus obtained were assembled to produce scaffolds using the SOAPdenovo software with parameters “-d 1, m 3, -R, -u, -F” [19]. Scaffolds were divided into scaftigs without gaps (N). Scaftigs with a length shorter than 500 bp were removed for further gene prediction and annotation.

2.4. Gene Prediction and Functional Annotation

The open reading frame (ORF) was predicted by using scaftigs (≥500 bp) from each sample through MetaGeneMark with the default parameters [20]. Redundancy was removed from the predicted ORFs (≥100 nt) by using the Cluster Database at High Identity with Tolerance (CD-HIT) program (with parameters “-c 0.95, g 0, -aS 0.9, g 1, -d 0”) to obtain an initial nonredundant gene catalog (nrGC) for each sample [21]. The reads from each sample were realigned to the nrGC using Bowtie2 with the parameters “-end-to-end, -sensitive, -I 200, -X 400 [22]. The number of reads for each nonredundant gene (Unigenes) was used to calculate the gene abundance. The reads that contained ≤2 sequences in all six rhizosphere samples were removed. The relative abundance of a gene was calculated by using the number of reads and gene length in comparison through the following formula, as described previously [23];
G k = r k L k . 1 i = 1 n r i / L i
where r is the number of reads of the gene in comparison and L is the length of the gene.
The abundance of the gene was used to calculate the basic information statistics, Core/pan and Venn diagram analyses of the genes among different P. notoginseng rhizosphere samples.
The DIAMOND software was used for the alignment of sequencing reads against the NCBI’s NR (Version: 2018.01) database (including bacteria, fungi, archaea, and viruses,) (blastp, e value ≤ 1 × 10⁻⁵) to obtain the phylogenetic information of Unigenes [24]. The phylogenetic information of each gene was determined using the lowest common ancestor-based algorithm (LCA) implemented in MEGAN (version 4, Tübingen, Baden-Württemberg, Germany) [25]. By using the annotation results and gene abundance table, the relative abundance of each taxonomic level (phylum, genus, species, and family) was obtained by adding up the relative abundance of all its members [26]. Kyoto Encyclopedia of Genes and Genomes (KEGG) annotation and clustering of orthologous groups of proteins (COG) of each gene were performed using DIAMOND (blastp, e value ≤ 1 × 10⁻⁵) against the KEGG database [27] and evolutionary genealogy of genes: Non-supervised Orthologous Groups (eggNOG) database (Version: 4.1), respectively [28]. The relative abundance of each function was calculated by adding the abundances of genes annotated to that particular function as described previously [26].

2.5. Statistical Analyses of Metagenomic Data

Metastats method (nonparametric permutation test, p < 0.05, n = 3) was applied to identify differentially abundant features in metagenomic sequence datasets [29]. The p-values were adjusted for false discovery rate (FDR) for multiple testing. A q-value threshold of 0.2 (FDR < 20%) was used for significance to minimize missing true discoveries. Beta diversity for microbial taxa was calculated through principal component analysis (PCA) and the unweighted pair-group method with arithmetic mean (UPGMA) clustering based on Bray–Curtis distances. The heat maps for microbial taxa and functional features were generated using R software Version 3.1.3 and color-coded by row z-scores.
Alpha diversity metrics of different groups were compared by Student’s t-test. For comparative analysis of multiple groups, a one-way analysis of variance (ANOVA) was conducted. The Student’s t-test was used to compare the two groups. Statistical significance was set at * p < 0.05, ** p < 0.01, and *** p < 0.001.

2.6. Metabolomic Analysis of Rhizosphere Samples

2.6.1. Sample Preparation

Fresh soil rhizospheres were harvested, weighed, immediately frozen in liquid nitrogen, and stored at −80 °C until further analysis. Samples were freeze-dried and then ground to a powder in liquid nitrogen before extraction.

2.6.2. Sample Extraction

The freeze-dried soil rhizopshere was crushed using a mixer mill (MM 400, Retsch, Hann, Germany) with a zirconia bead for 1.5 min at 30 Hz. About 500 mg powder was diluted to a 500 μL with methanol: isopropanol: water (3:3:2 V/V/V), vortexed for 3 min and placed under ultrasonication for 30 min. The extracts were centrifuged at 12,000 rpm under 4 °C for 3 min. The supernatant was tranferred to another bottle and extraction was repeated once, then the supernatants were mixed with internal standard and evaporated under nitrogen gas stream. The evaporated samples were transferred to the lyophilizer for freeze-drying. The residue was used for further derivatization.
The derivatization method was as follows: the sample was mixed with 100 μL solution of methoxyamine hydrochloride in pyridine (15 mg/mL) and incubated at 37 °C for 2 h. Then, 100 μL of BSTFA (with 1% TMCS) was added to the mixture and kept at 37 °C for 30 min after vortex-mixing. The n-hexane was added to 50 μL of the derivatization solution to dilute it to 200 μL, filtered with a 0.22 μm organic phase syringe filter, stored in a refrigerator at −20 °C, and tested on the machine within 24 h.

2.6.3. GC–MS/MS Analysis

The Agilent 8890 gas chromatograph coupled with a 5977B mass spectrometer with a DB-5MS column (30 m length × 0.25 mm i.d. × 0.25 μm film thickness, (J&W Scientific, Folsom, CA, USA) was employed for GC–MS/MS analysis of rhizosphere samples. Helium was used as a carrier gas at a flow rate of 1 mL/minutes. Injections (1 μL) were made in the front inlet mode with a split ratio 10:1. The column temperature was held at 40 °C for 1 min, and then raised to 100 °C at 20 °C/minutes, raised to 300 °C at 10 °C/min, and held at 300 °C for 5 min. All samples were analyzed in scan mode. The injector inlet and transfer line temperature were 250 °C and 280 °C, respectively.

2.6.4. Statistical Analysis of Metabolome Data

Unsupervised PCA (principal component analysis) was performed by statistics function prcomp within R (www.r-project.org). The data was unit variance scaled before unsupervised PCA. Hierarchical Cluster Analysis (HCA) was determined using an R package, and results for samples and metabolites were presented as heatmaps with dendrograms. For HCA, normalized signal intensities of metabolites (unit variance scaling) are visualized as a color spectrum. Pearson correlation coefficients between samples were calculated by the cor function in R and presented as heatmaps.
Significantly regulated metabolites between groups were determined by VIP >= 1 and absolute Log2FC (fold change) >= 1. VIP values were extracted from the OPLS-DA result, which also contained score plots and permutation plots which were generated using R package MetaboAnalystR. The data was log-transformed (log2) and mean-centered before OPLS-DA. For the validation of the OPLS-DA model, a permutation test (200 permutations) was performed as described previously [30].

3. Results

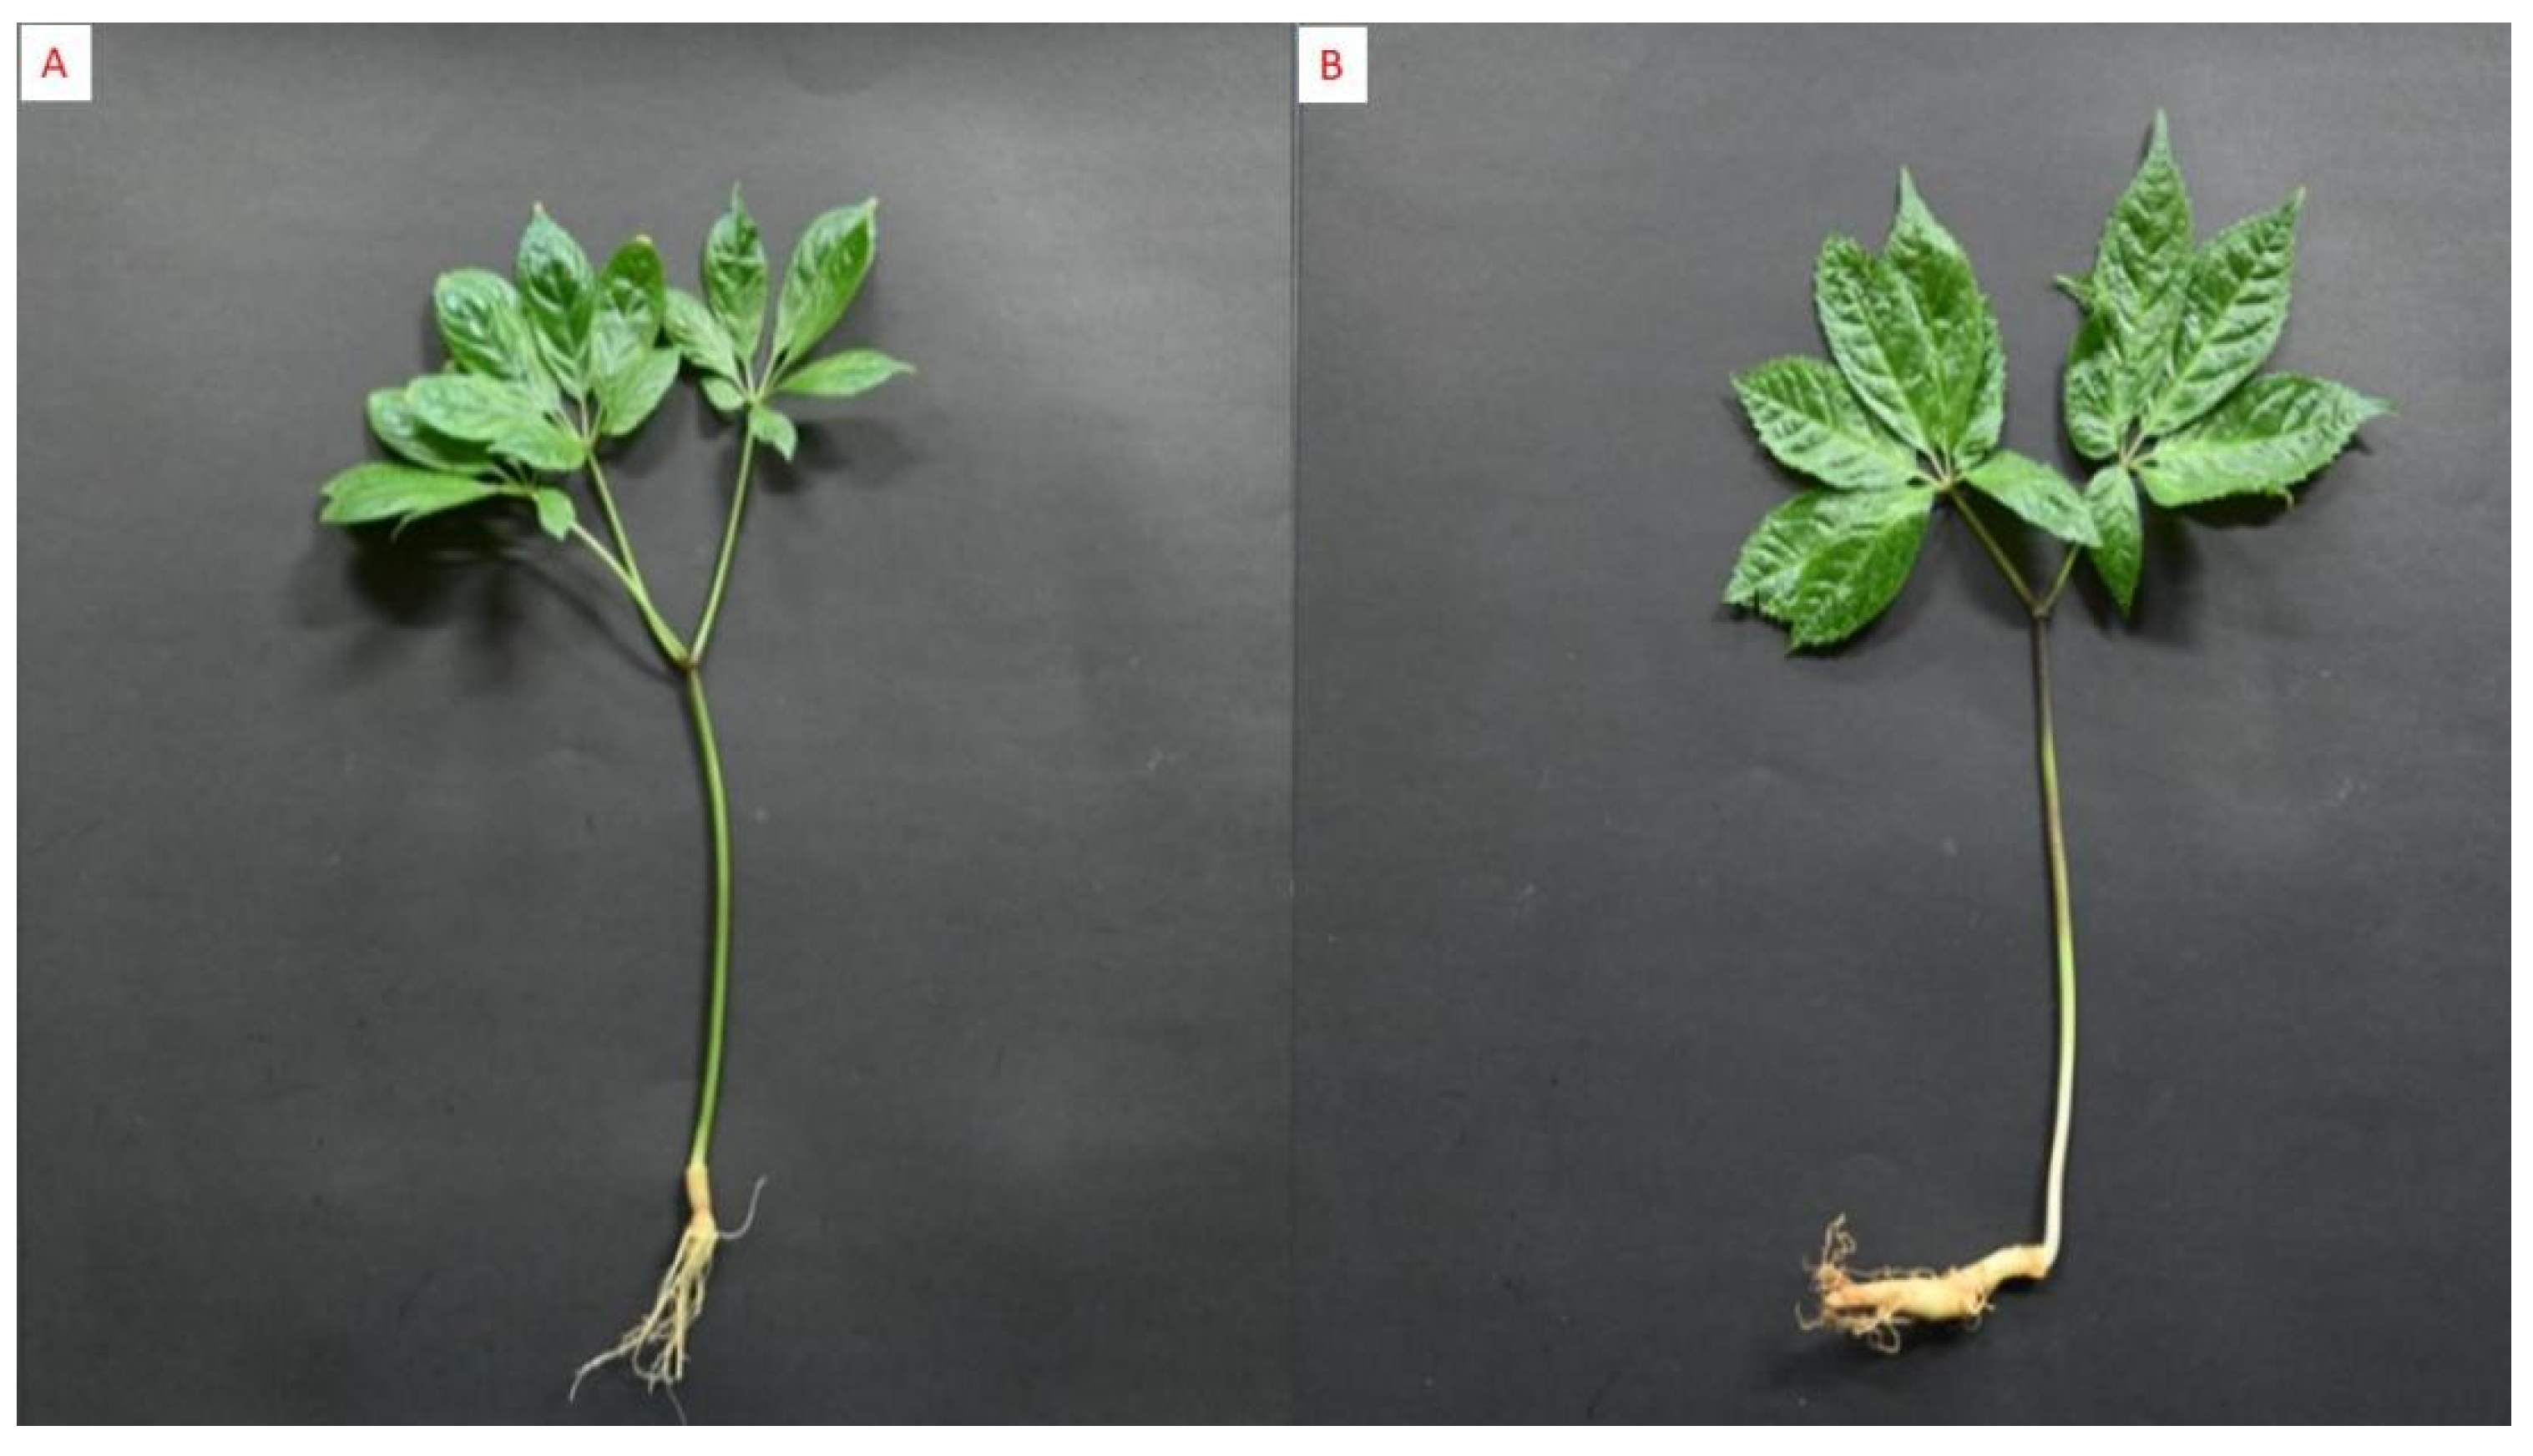
3.1. Growth and Physical Characteristics of P. notoginseng

The results revealed no difference in plant height and root length betwen two-year-old P. notoginseng cultivated under field and forest conditions. However, the root weight was significantly higher (p < 0.05) in plants grown under the forest when compared with the field conditions (Table 1). The physical appearance of the root was also attractive (in terms of color, scent, thickness, shape, and the end of the root) in plants cultivated under forest (Figure 2).

3.2. Metagenomic Sequencing, Assembly and Annotation

The sequencing of metagenomic libraries (three replicated libraries from field plantation (CK1, CK2, and CK3) and three replicated libraries from forest plantation (T1, T2, and T3) was performed. The average ratio of clean data to raw data was 99.87% (Table S1). Sequence assembly using the SOAPdenovo software generated 46,297, 39,912, and 13,787, and 76,400, 25,737, and 10,101 scaftigs longer than 500 bp in CK1–CK3 and T1–T3, respectively. The average scaftig N50 lengths were 727 and 775 bp in CK and T, respectively, and scaftig N90 lengths were 528 and 533 bp in CK and T, respectively (Table S2). Gene prediction using MetaGeneMark software revealed that there were 253,997 nonredundant ORFs from the metagenomic libraries including 88,550 (34.86%) complete ORFs with both initiation and termination codons (Table S2). The number of nonredundant genes was higher in the T group when compared with the CK group (Figure S1).

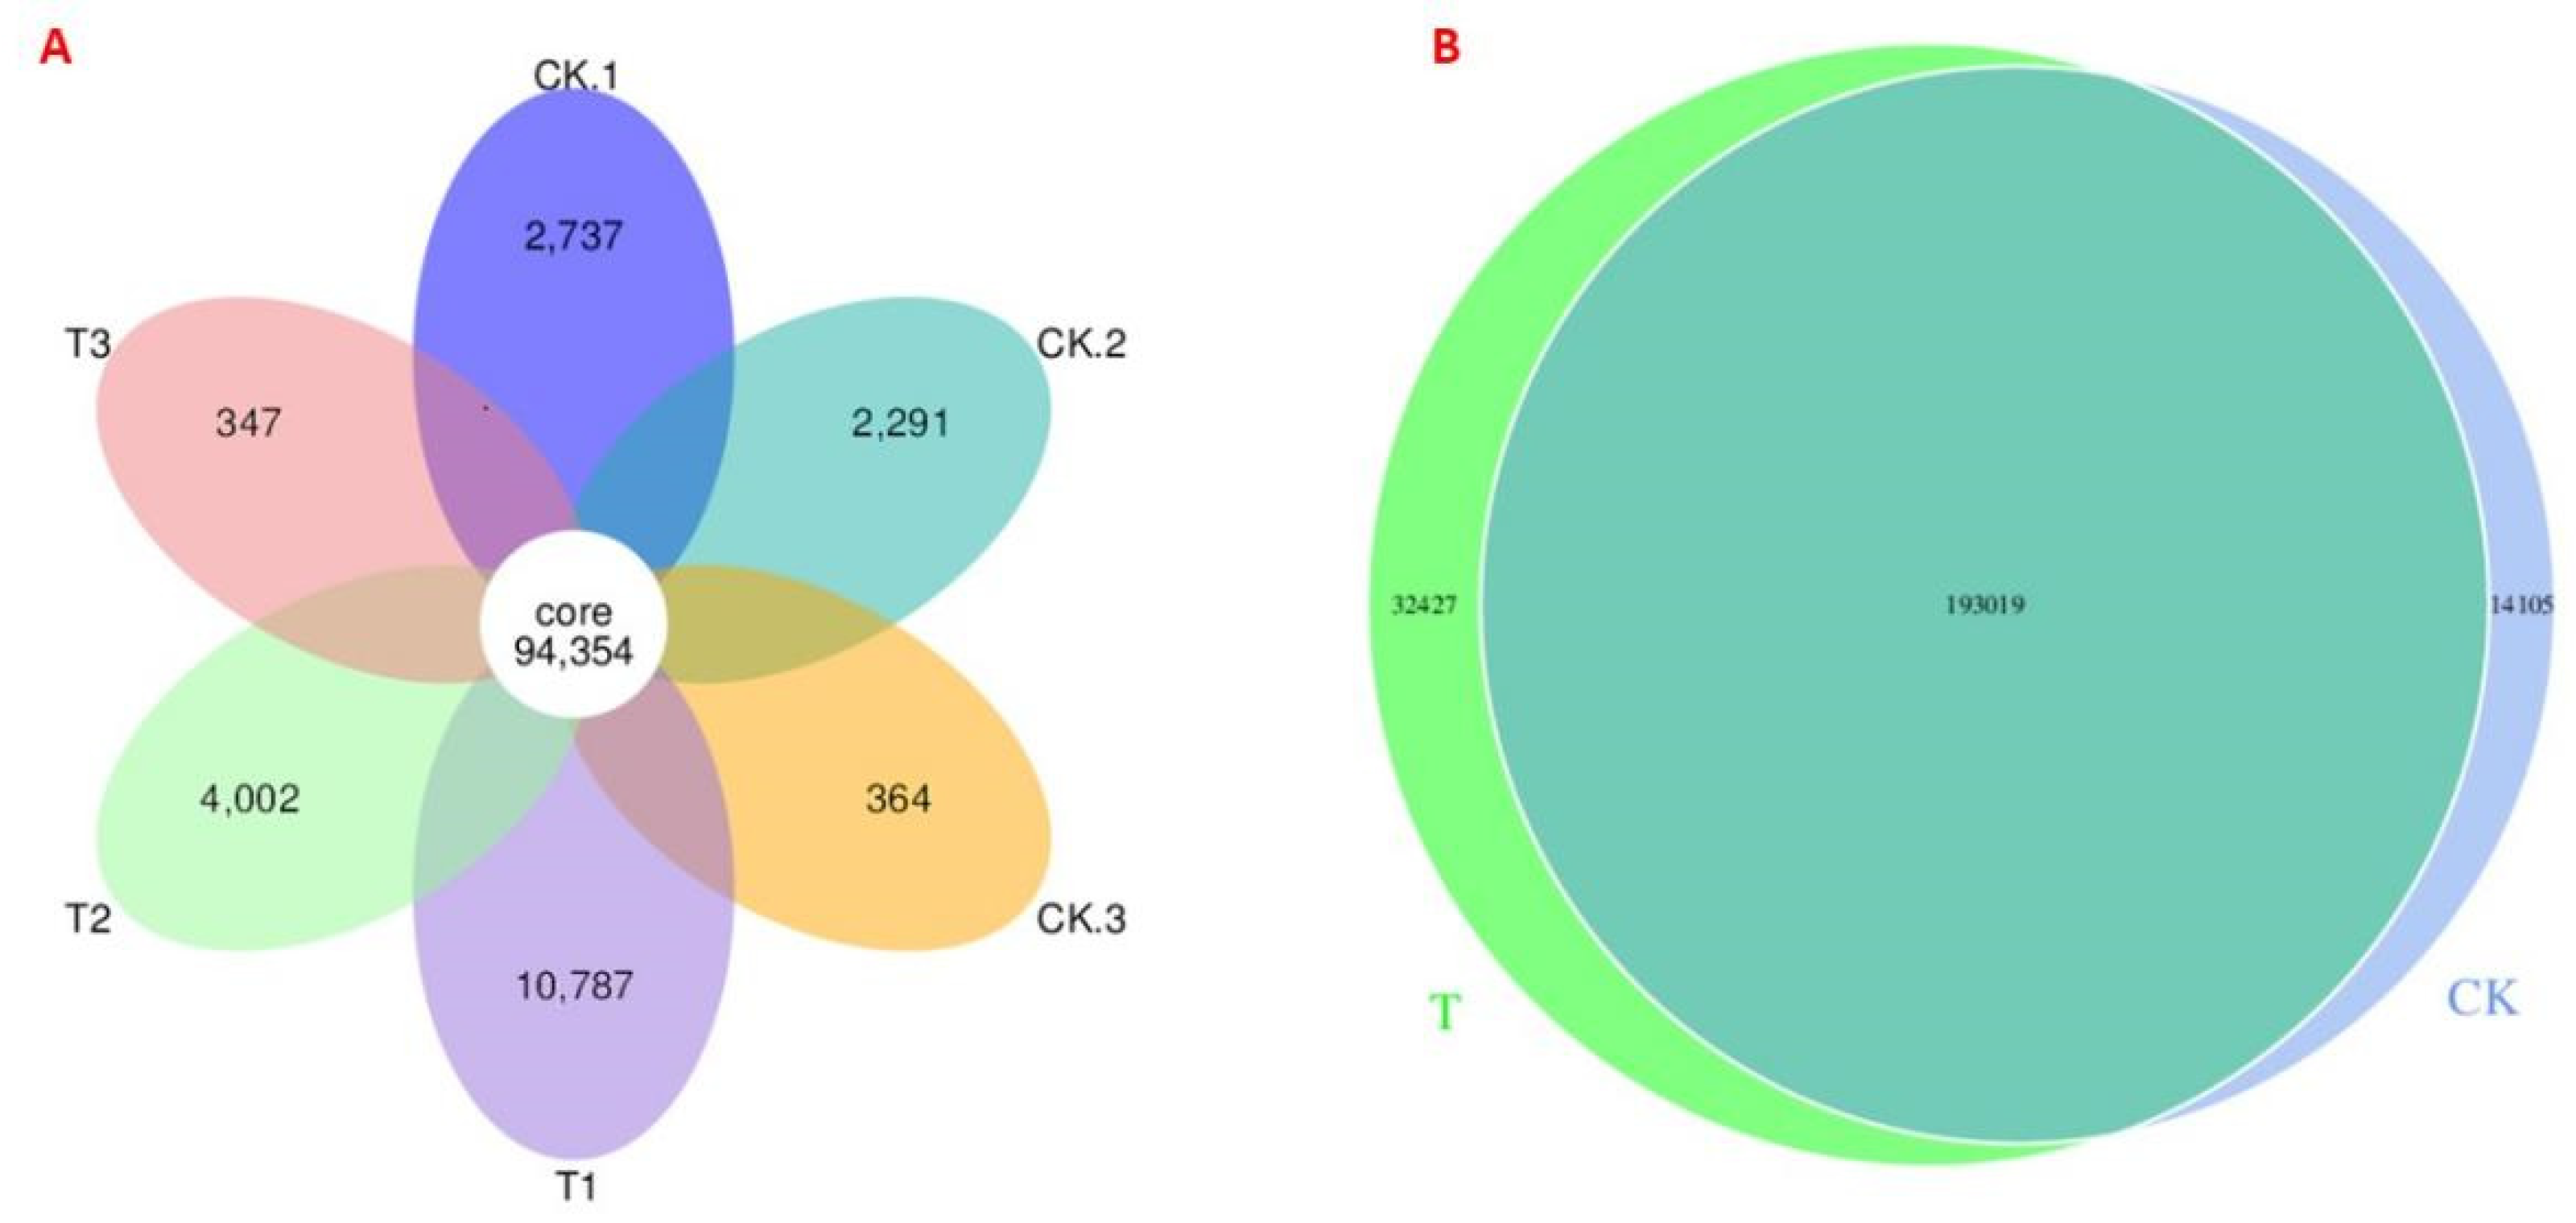
3.3. Pan/Core and Venn Diagram Analysis of Microbial Taxa

Core/pan analysis showed that 94,354 genes were common among all the rhizosphere samples, while a smaller number of sample specific genes were observed (Figure 3A). The number of genes shared between CK and T was 193,019, while 32,427 and 14,105 genes were exclusively found in T and CK, respectively, as revealed by the Venn diagram (Figure 3B).

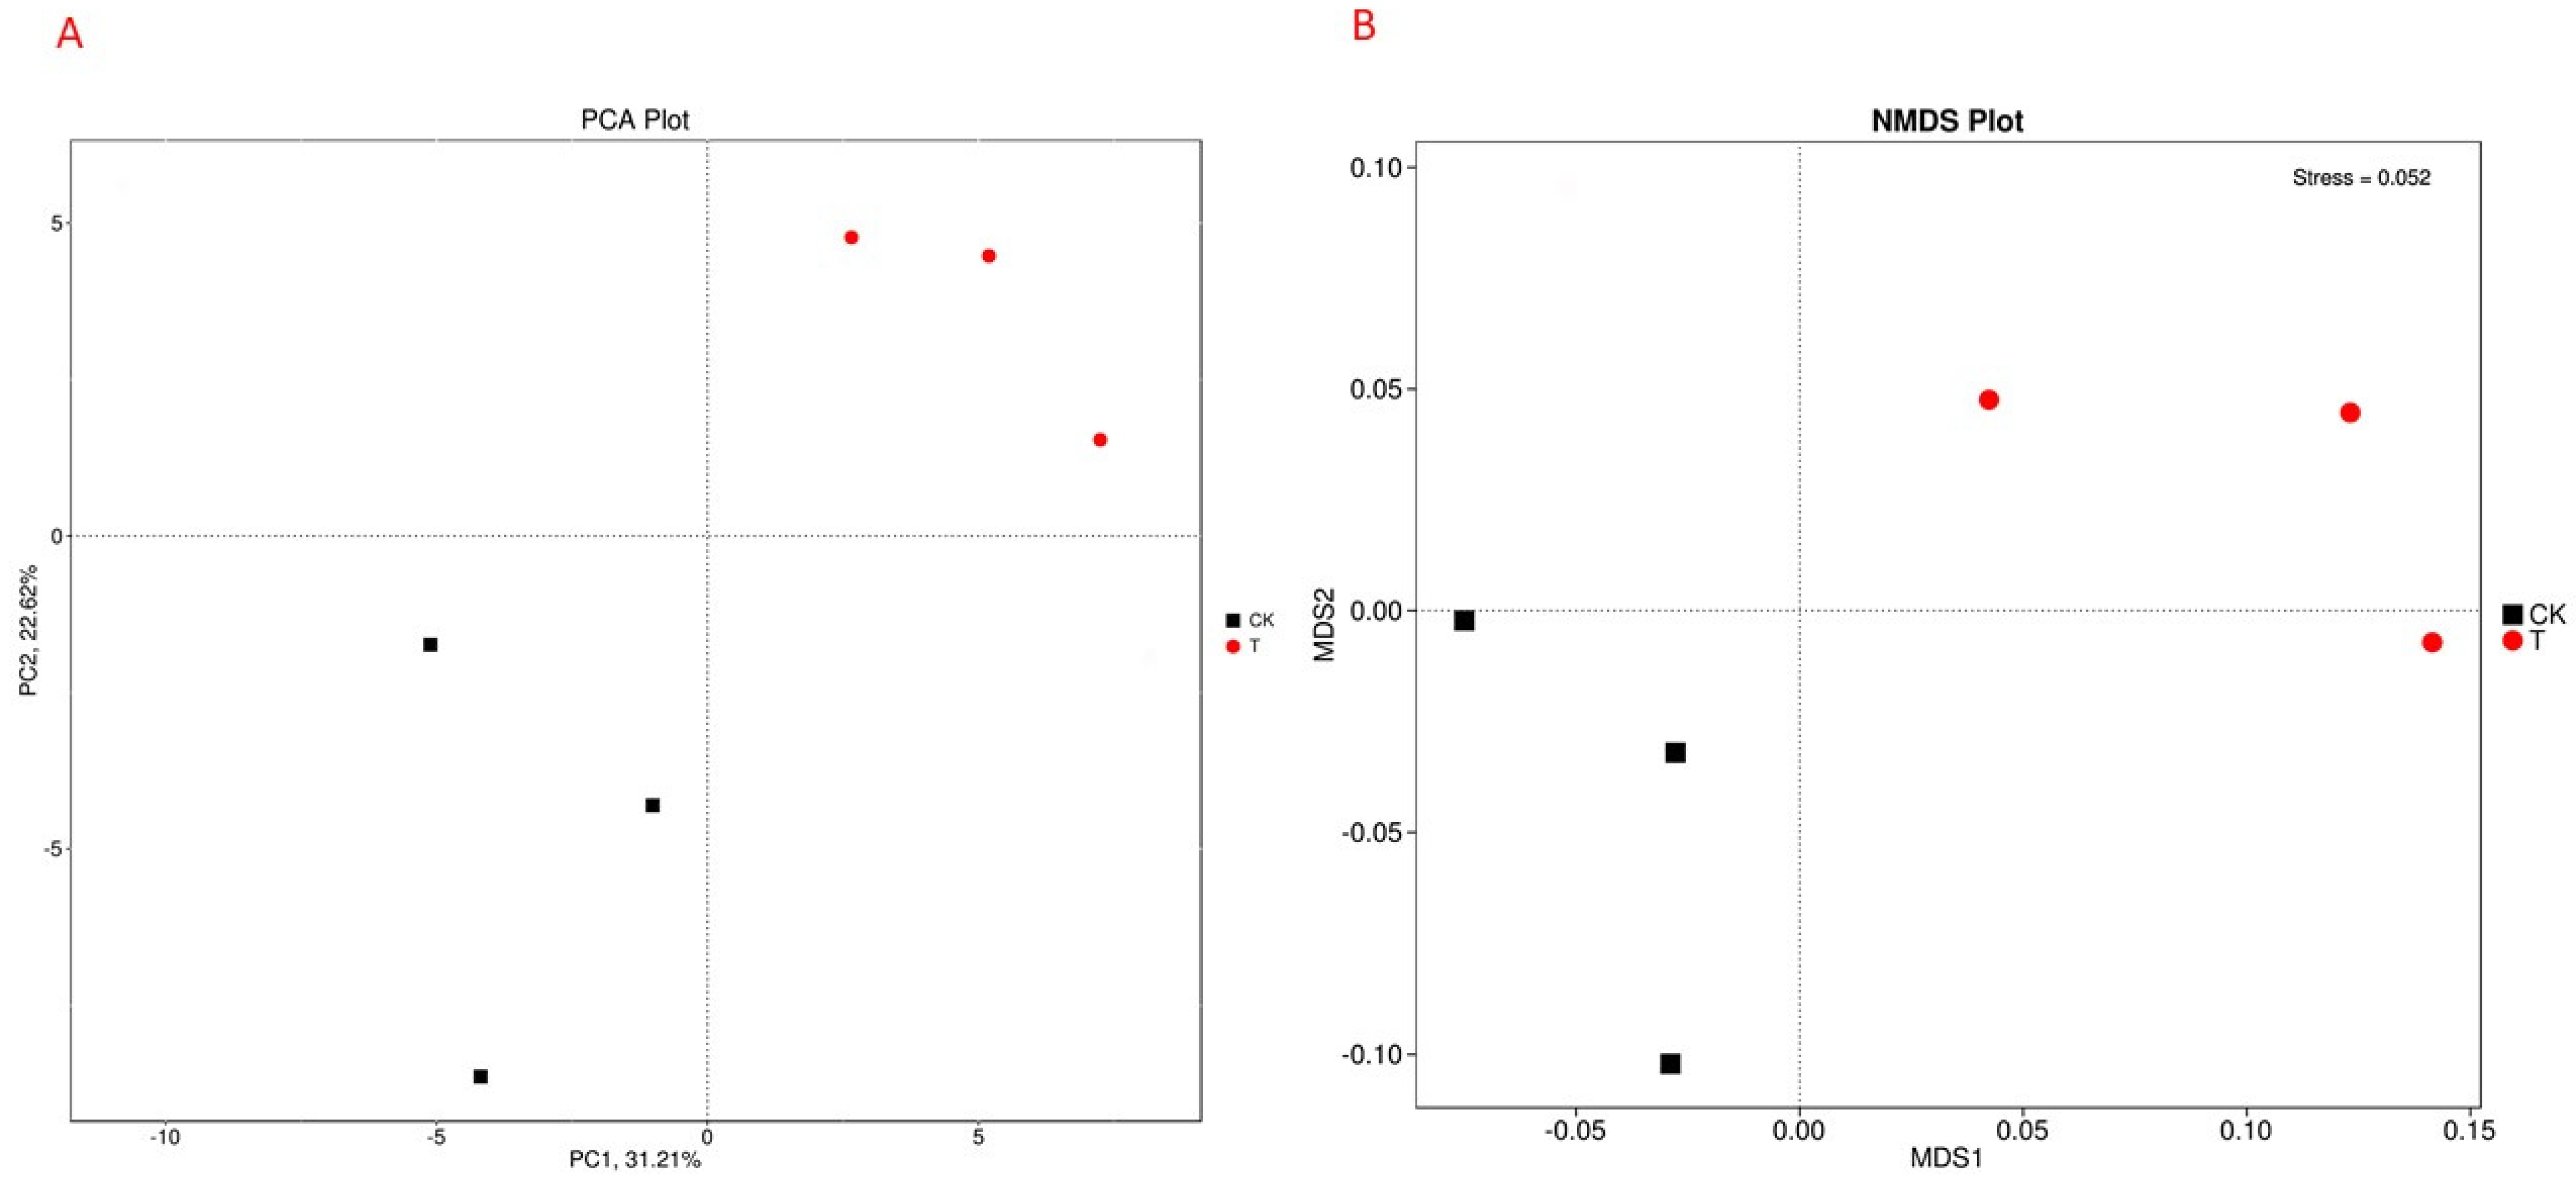
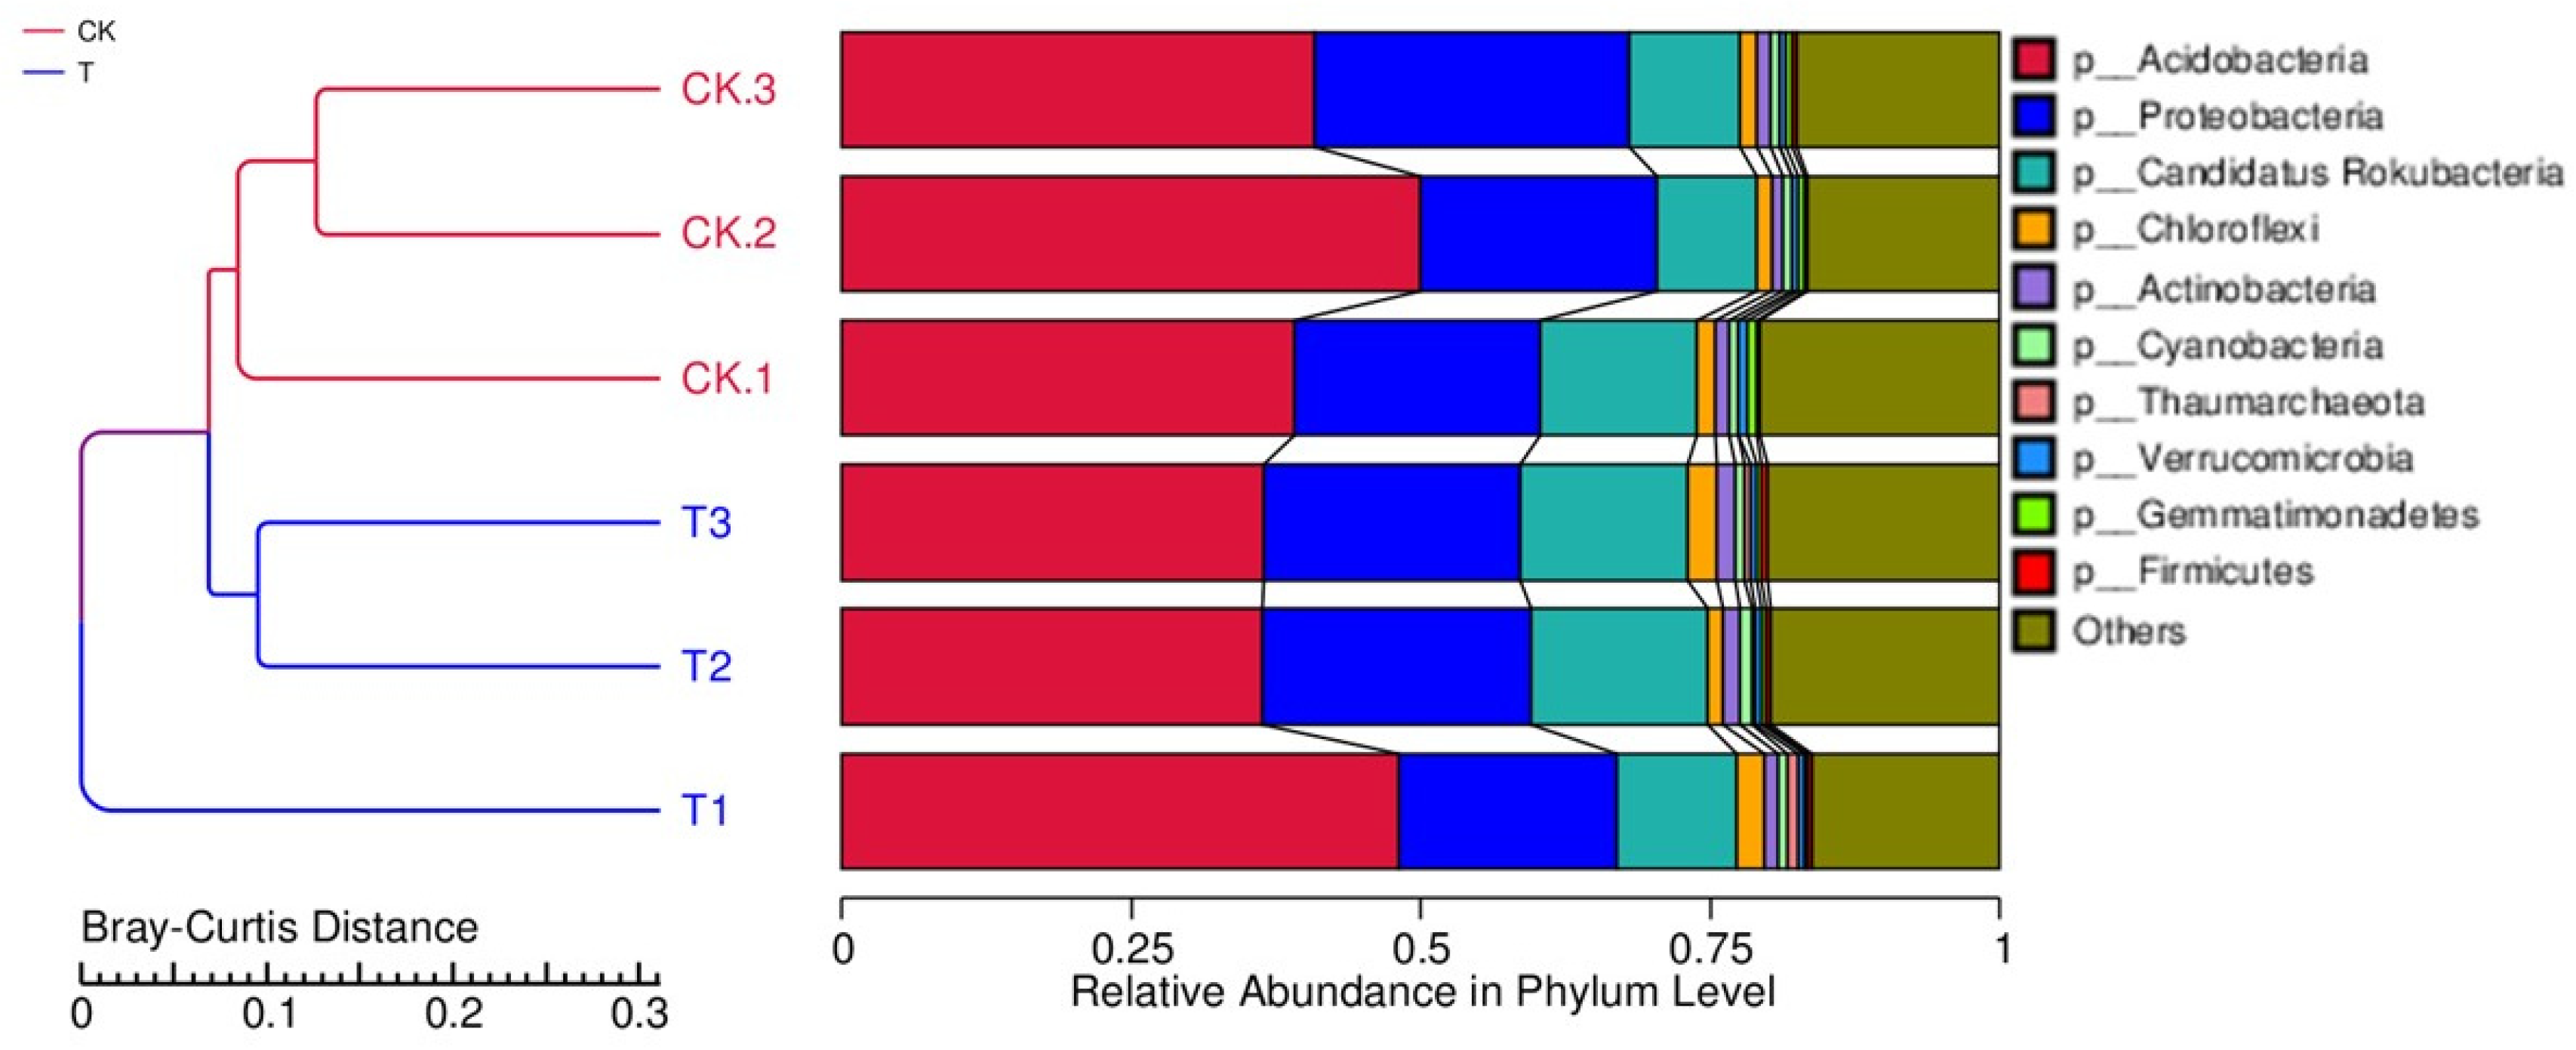
3.4. Phylogenetic Analysis of Rhizosphere Microbial Communities under Field and Forest Conditions

Principal component analysis (PCA) at the phylum level showed distinct differences in microbial communities between T and CK. The first two principal components PC1 and PC2 explained 31.21% and 22.82% of the total variance at phylum level, respectively (Figure 4A). Similarly, nonmetric multidimensional scaling (NMDS) analysis revealed clear separation of samples of both groups (Figure 4B). Furthermore, the unweighted pair–group method with arithmetic mean (UPGMA) clustering based on Bray–Curtis distance revealed a similar microbial community structure for the three replicates in each treatment, and obvious differences between the two treatments (T and CK) (Figure 5).

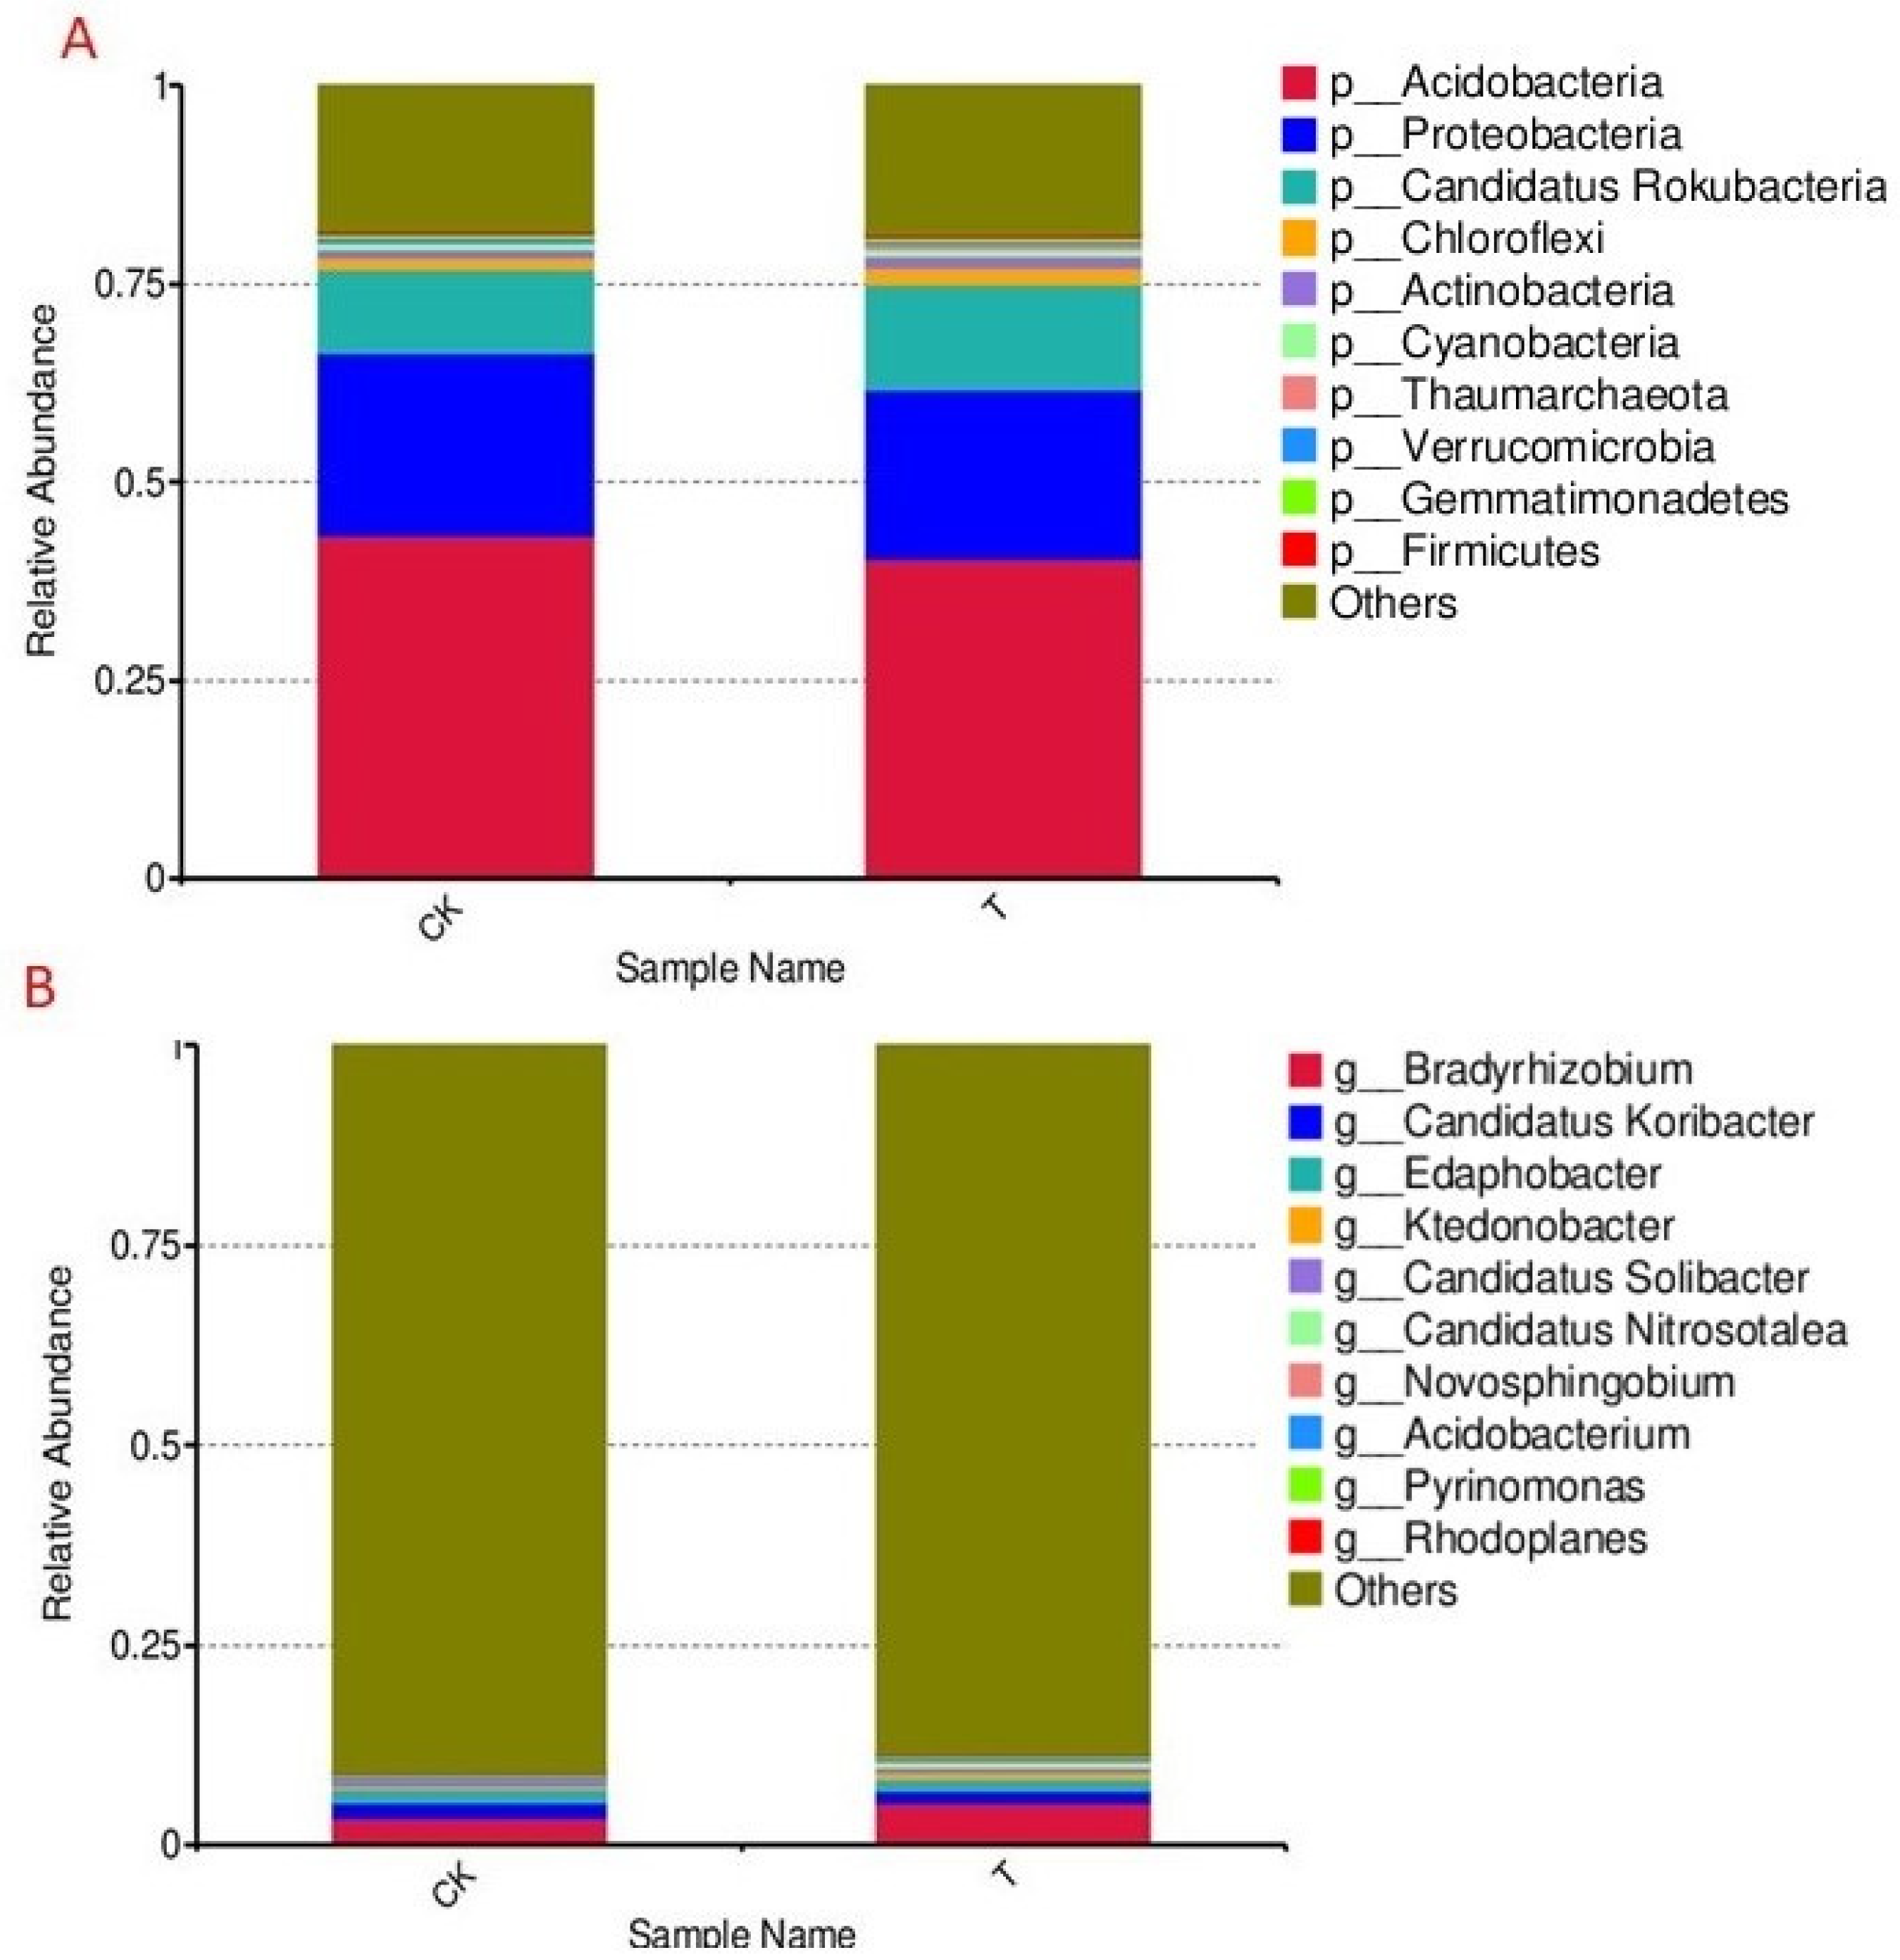
3.5. Relative Abundance of Microbial Communities

Beta diversity was evaluated at phylogenetic levels of operational taxonomic units (OTUs) of bacterial communities. The community composition in different samples was compared using the Bray–Curtis distance matrix between field and pine forest rhizosphere of P. ginseng. This study evaluated the effects of the two plantation modes on the soil microbial communities.
Results of relative abundance revealed that the microbial community was comprised mainly of ten phyla, Acidobacteria, Proteobacteria, Candidatus Rokubacteria, Chloroflexi, Actinobacteria, Cyanobacteria, Thaumarchaeota, Verrucomicrobia, Gemmatimonadetes and Firmicutes (Figure 6A). Acidobacteria was the dominant microbial phyla, accounting for 42.4% and 40.4% of the total population in CK and T, respectively. Three dominant phyla, Acidobacteria, Proteobacteria, and Candidatus rokubacteria, accounted for 75% of the total microbial population in both CK and T groups. Relative abundances of bacterial genera revealed that Bradyrhizobium, Candidatus koribacter and Edaphobacter, were the dominant genera in both groups (Figure 6B).
The heat map analysis of top 35 most abundant genera in at least one rhizosphere soil sample revealed clear variations in the relative abundance of bacterial communities between CK and T (Figure 7). The predominant genera showed differences in relative abundance between CK and T. Particularly, the relative abundances of Nitrospira (phylum Candidatus tectomicrobia), Acidobacterium, Candidatus Koribacteria, silvibacterium, Bryobacter, Candidatus solibacter and Granulisola (belonging to phylum Acidobacteria) were higher in the CK group when compared to the T group. However, relative abundances of Candidatus nitrosotalea, Ktedonobacter, Thermogemmatispora, Mycobacterium (phylum Chloroflexi), Afipia and Bradyrhizobium (phylum Protobacteria) were higher in T than in CK (Figure 7).

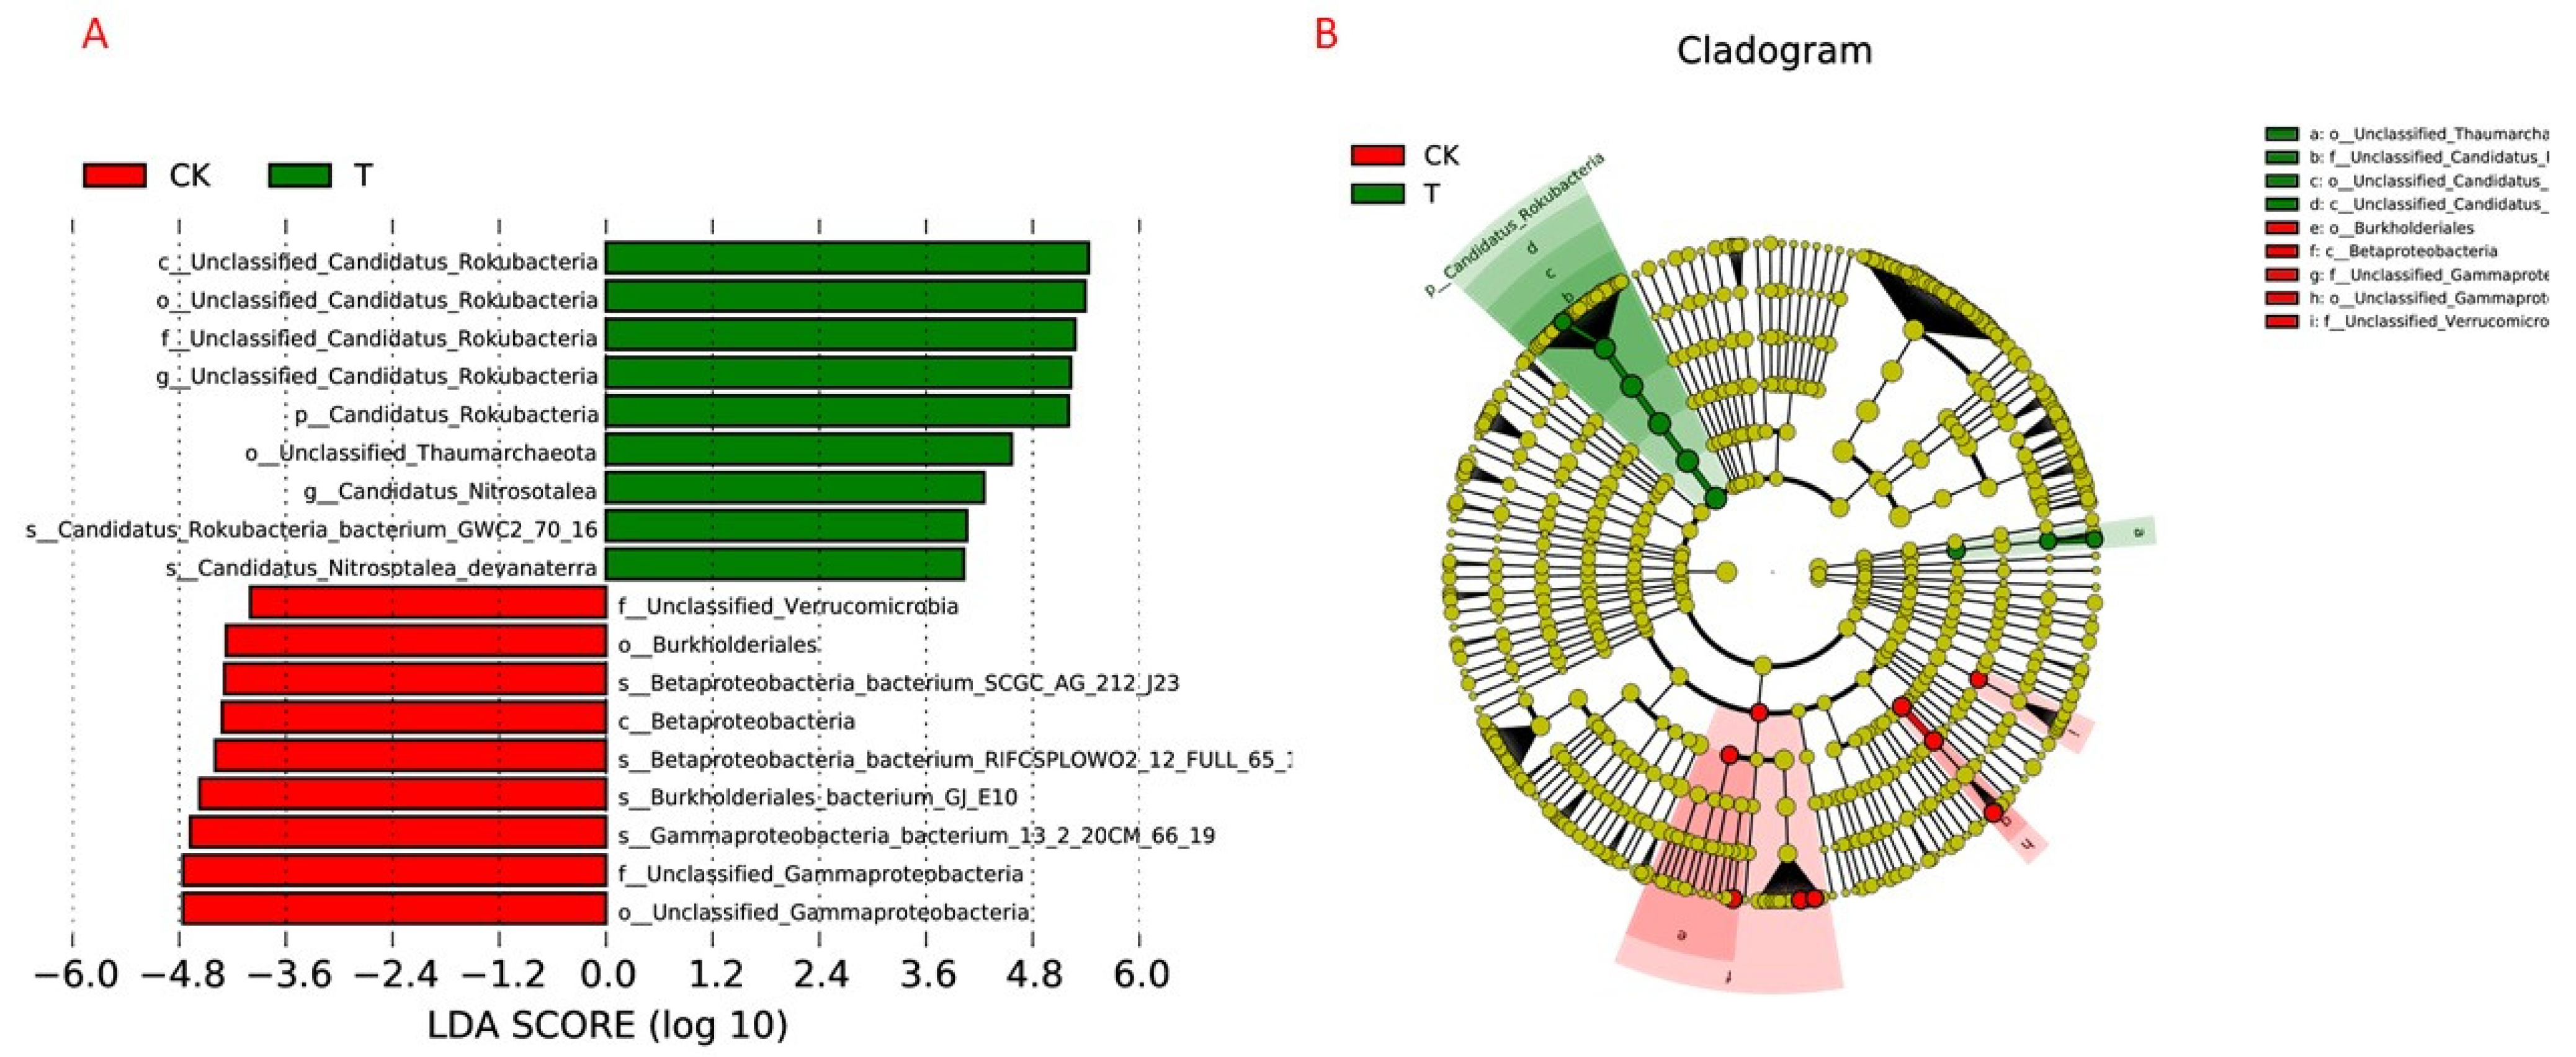
3.6. Biomarker Bacterial Taxa in the P. ginseng Rhizosphere Soil under Field and Forest Conditions

The LEfSe algorithm was utilized to identify bacterial taxa with significantly different relative abundances between the CK and T soil sample rhizospheres (Figure 8A,B). In total, one unclassified taxon for each of Candidatus Rokubacteria, Candidatus Nitrostelea and Thaumarchaetoa were more abundant in T rhizospheres when compared with CK. However, taxa belonging to betaproteobacteria, gammaproteobacteria, Burkholderiales and Verrucomicrobia were more significantly enriched in CK samples compared with T samples (p < 0.05).

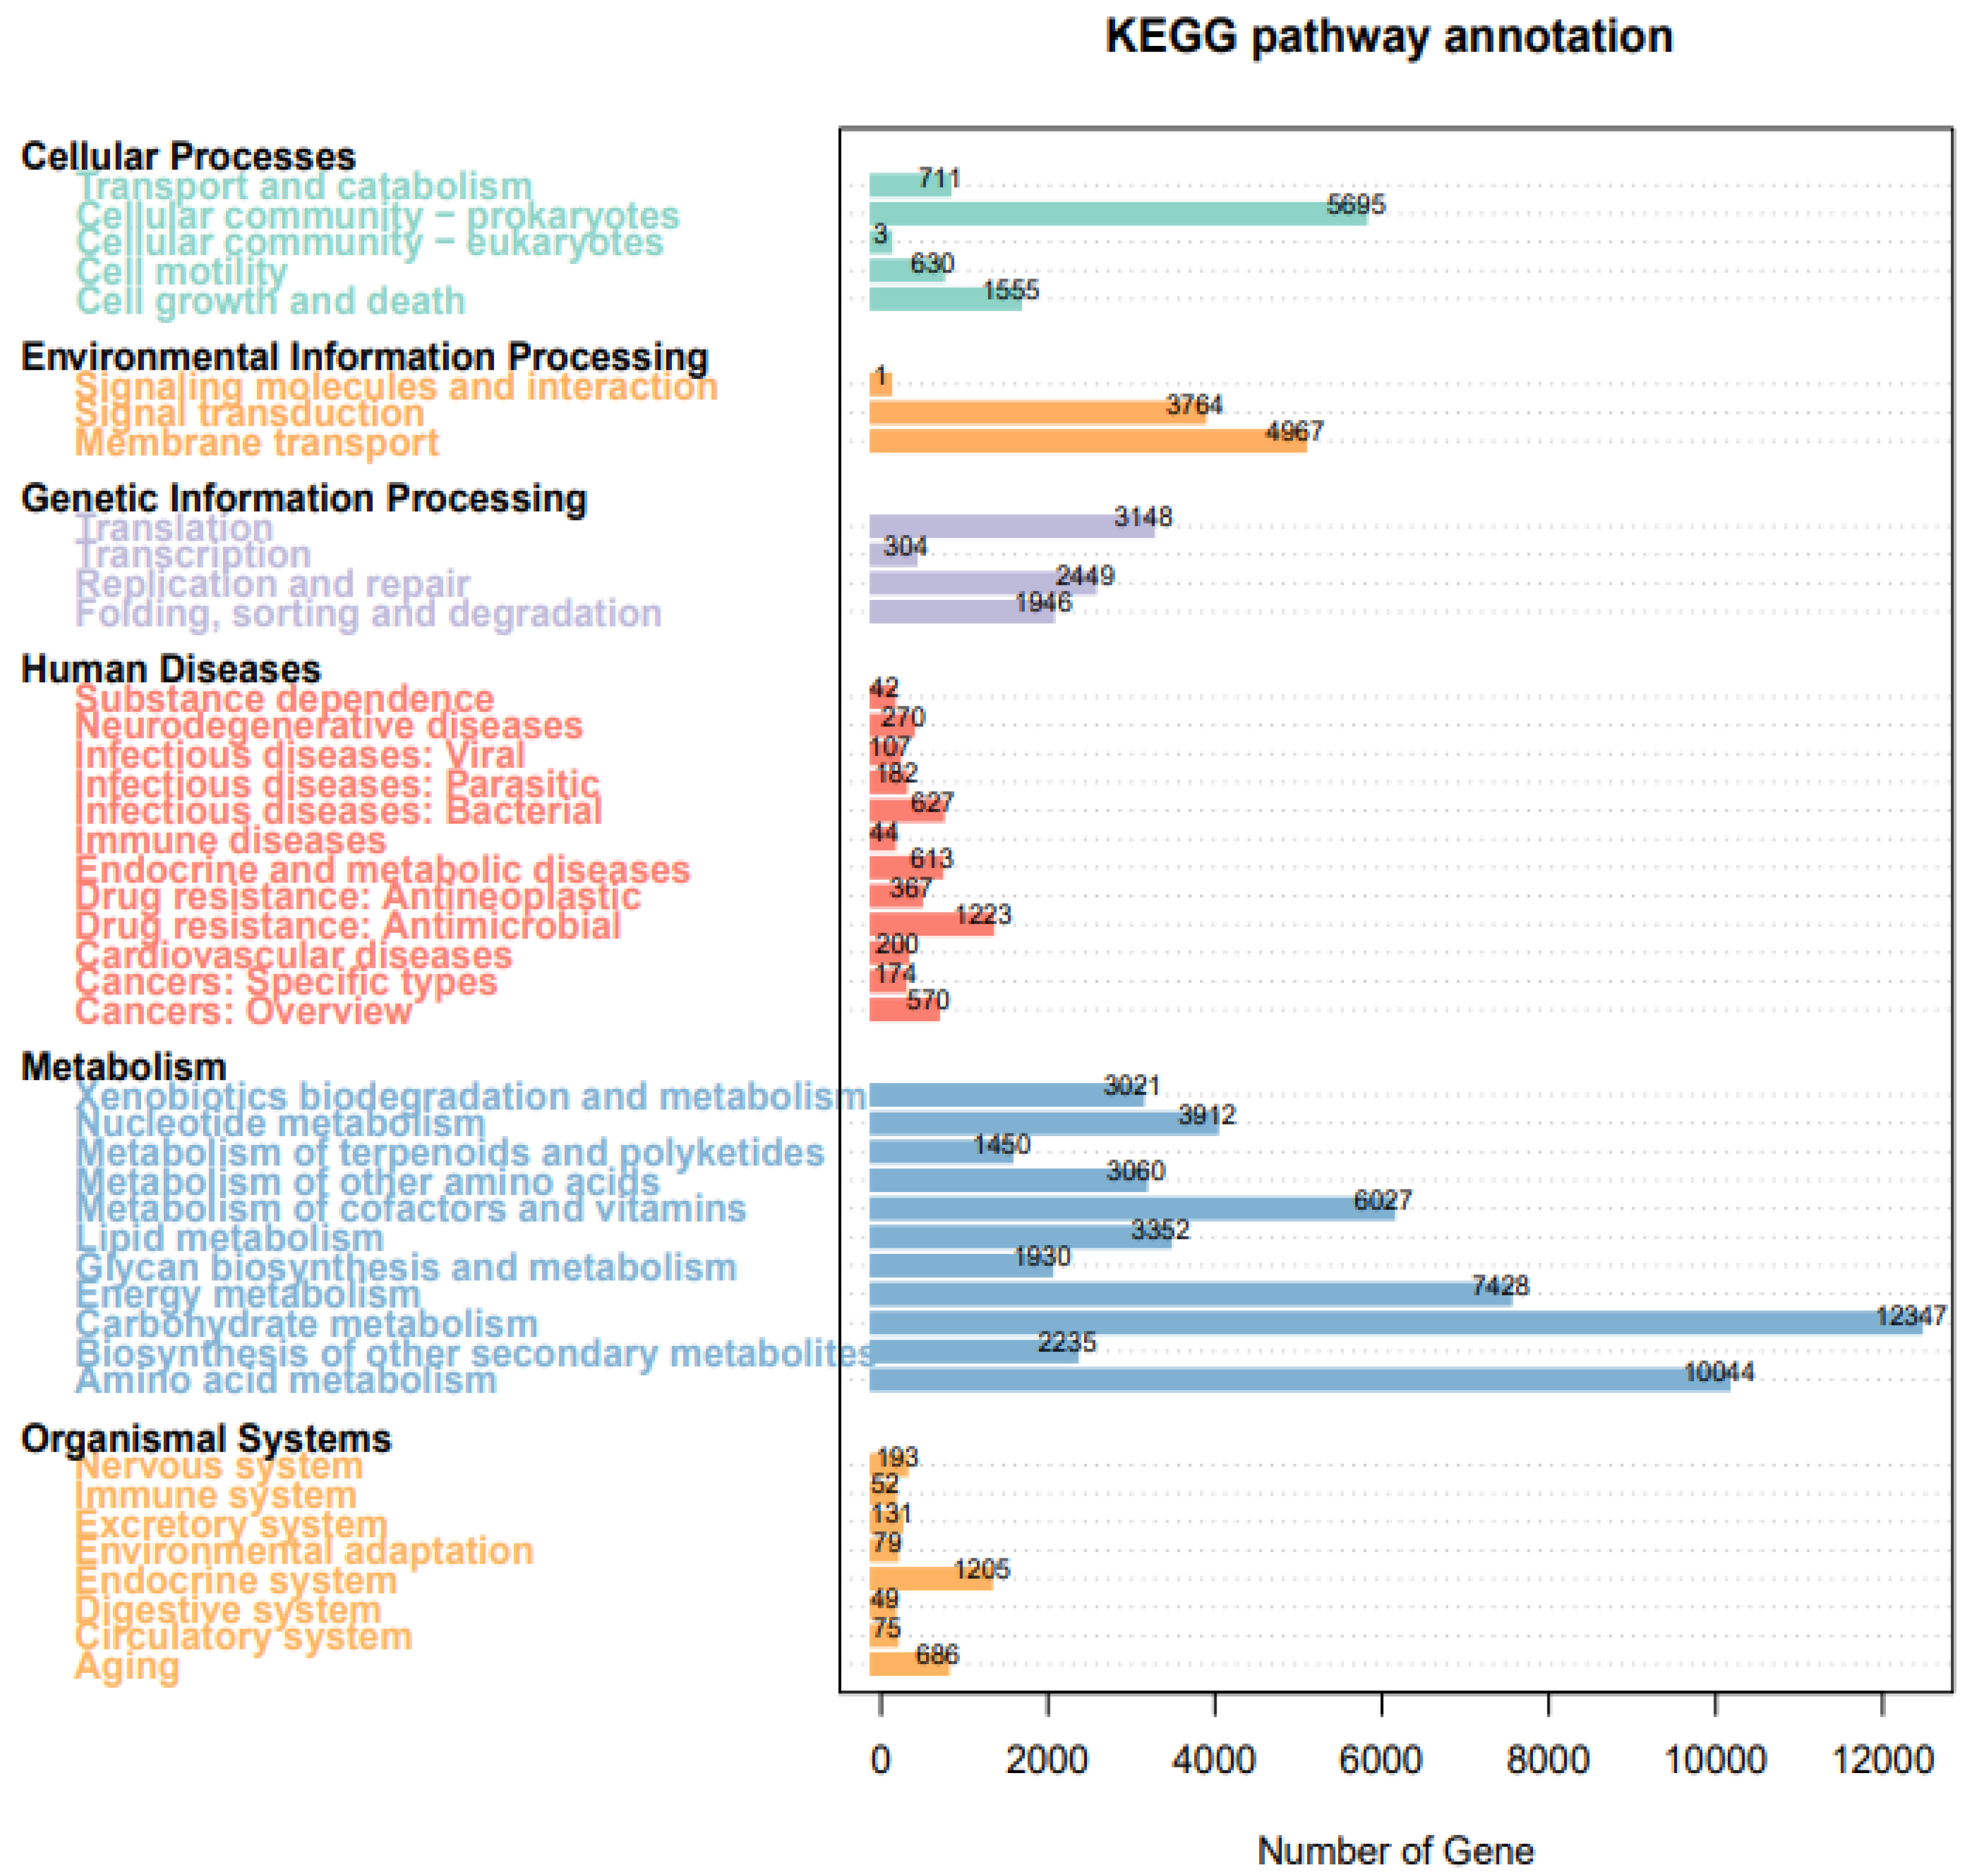
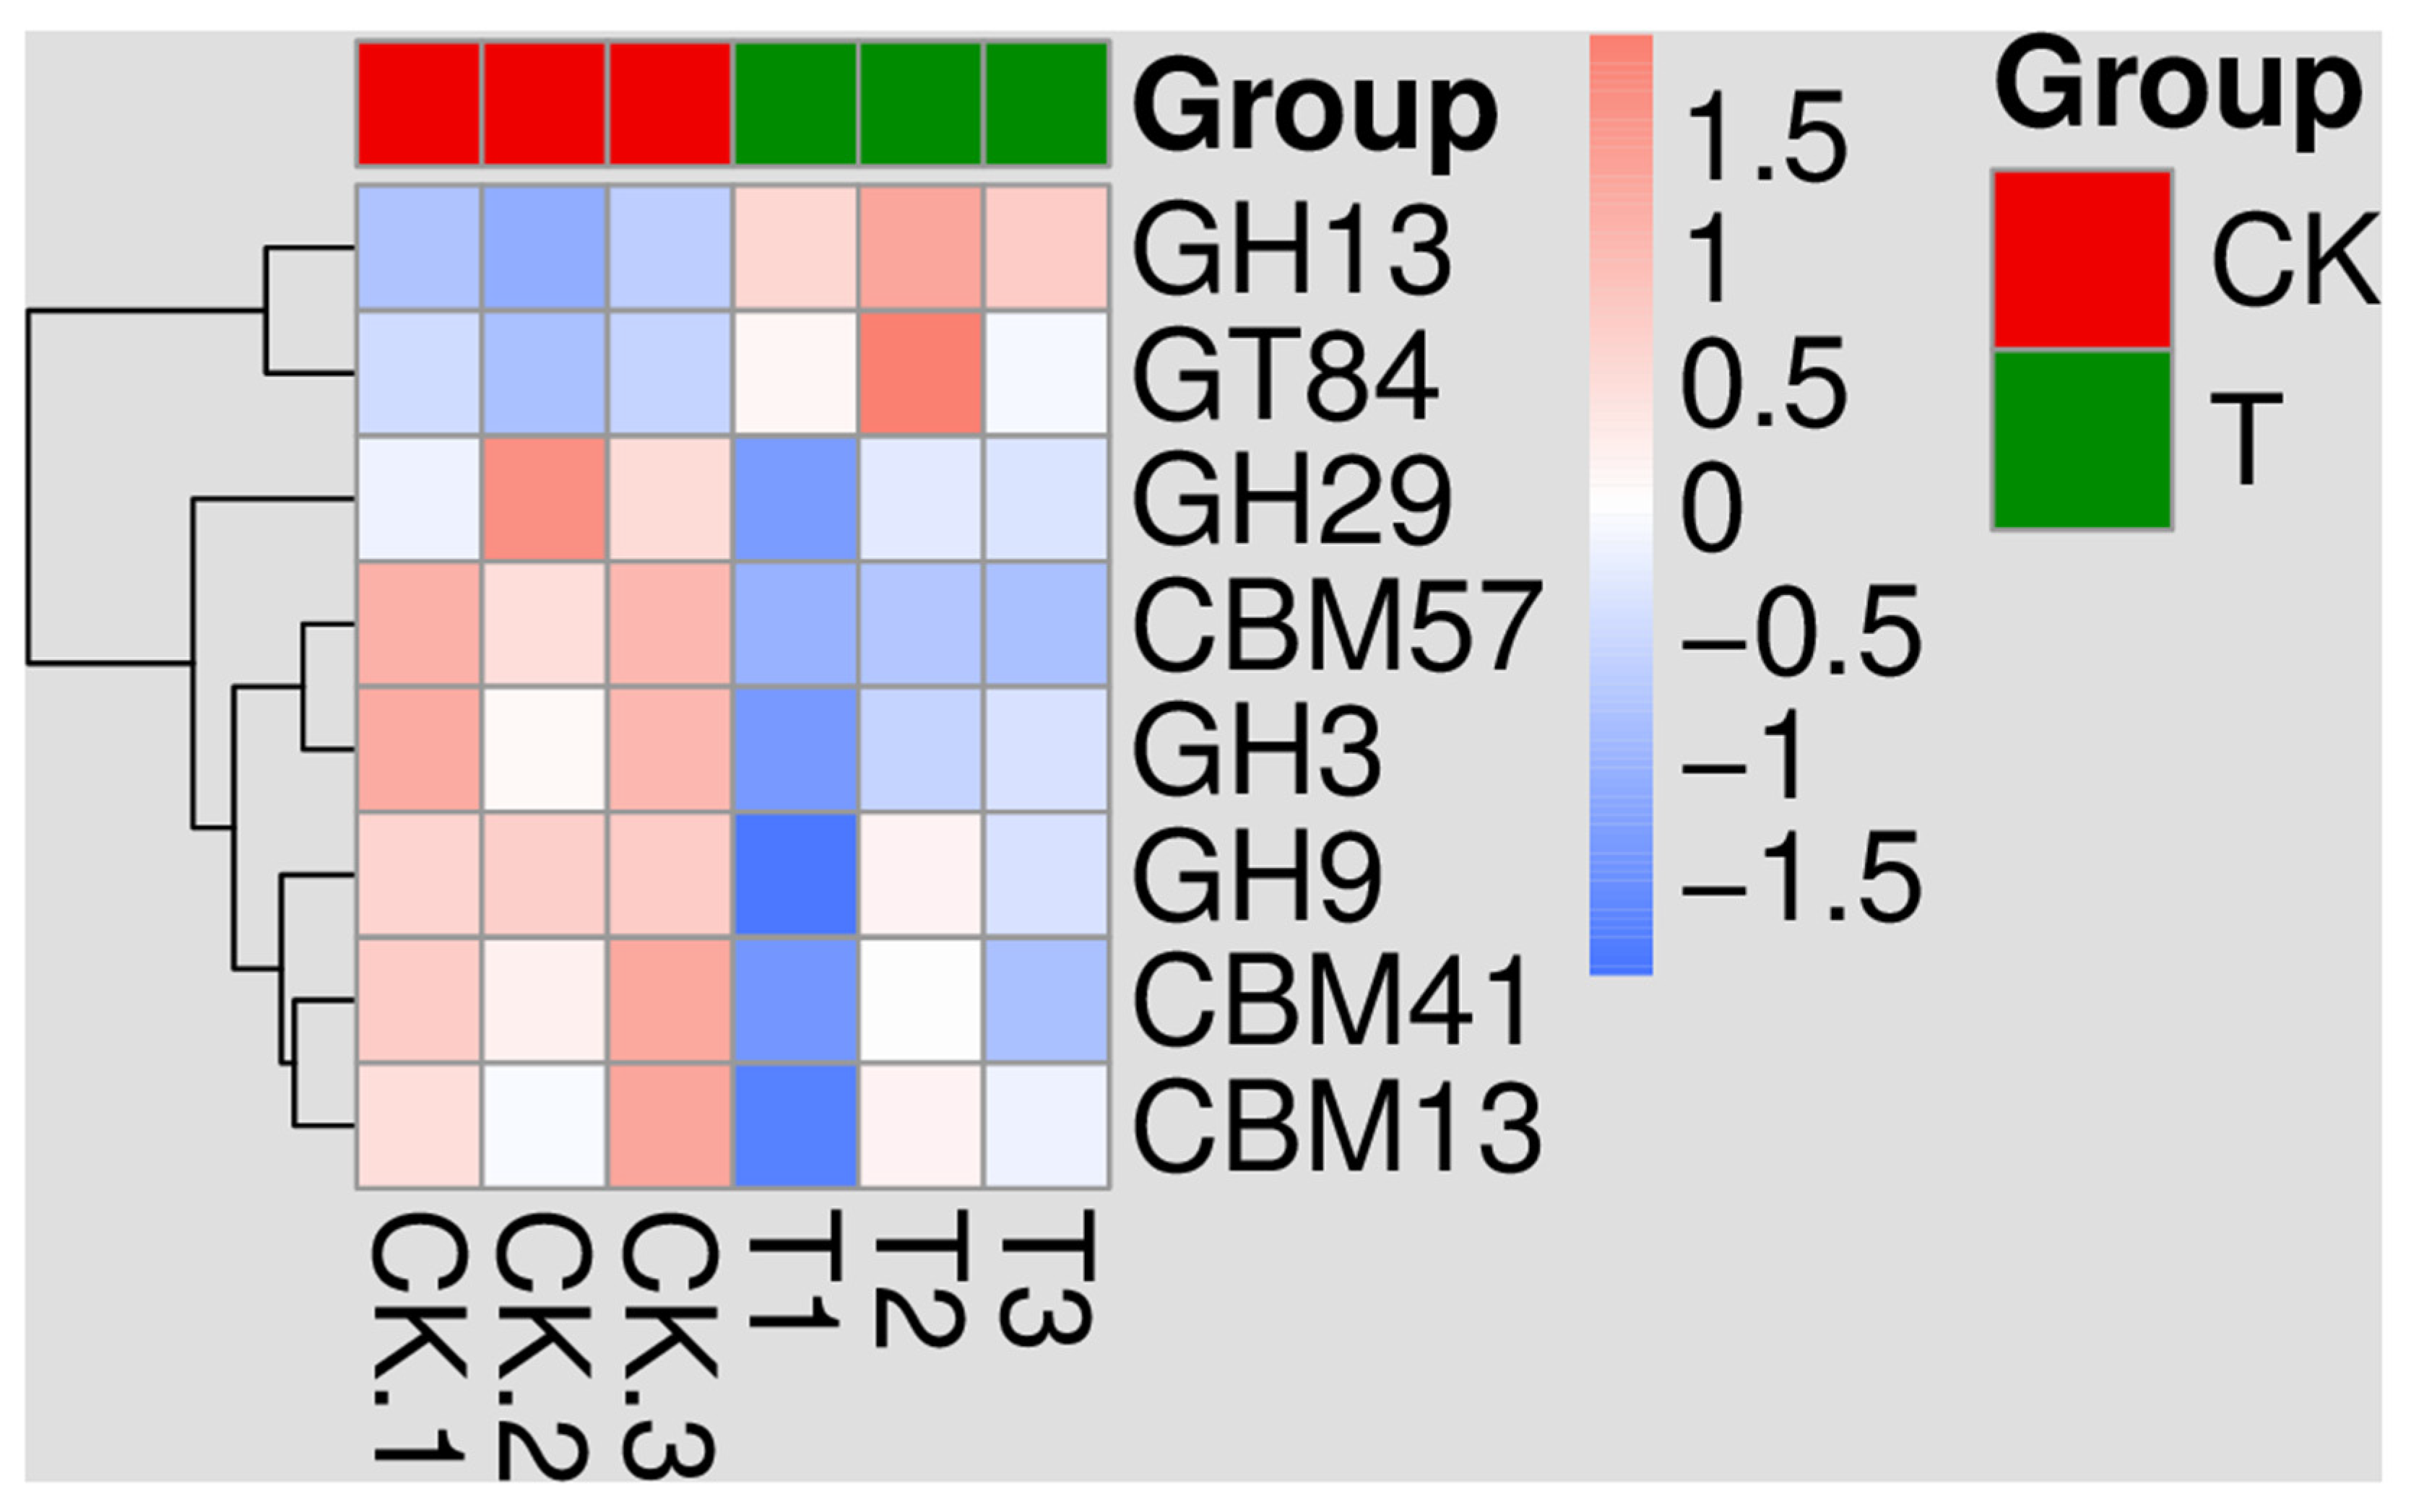
3.7. Kyoto Encyclopedia of Genes and Genomes (KEGG) Analysis

The KEGG analysis revealed that metabolism was the most dominant category especially involving most of the genes associated with the metabolism of carbohydrates, amino acids and energy, followed by and environmental information processing (8732), cellular processes (8594) and genetic information processing (7847) (Figure 9). Pathway analysis revealed that different pathways related to organismal systems, environmental information processing and cellular processes were enriched in the T group, while metabolism, human diseases, and genetic information processing pathways were abundant in the CK group (Figure 8). The analysis of unigenes with known functions in the eggNOG database revealed a higher number of unigenes (16,000) associated with amino acid transport and metabolism, followed by energy production and conservation (13,550), replication, recombination and repair (10,575), and carbohydrate transport and metabolism (99,585) (Figure S2). Similarly, screening analysis in the CAZy database revealed a higher number of unigenes associated with glycoside hydrolases (~3700), followed by glycoside transferases (~2600), carbohydrate-binding modules (~1300) and carbohydrate esterases (~700) (Figure S3).
PCA based on the relative abundances of functions in the KEGG database showed distinct differences in functional potentials of microbial communities between CK and T, as the first and second components of PCA (PC1 & PC2) explained 35.96% and 24.37% of the total variance, respectively (Figure S4). The abundance analysis based on functions (KOs) through the heat map of the top 35 functions revealed clear differences between CK and T (Figure S5). The abundance of K0029 and K2469, K01897 and K00986 was higher in T than CK. However, the abundance of K07303, K15836, K07486 and K07497 was higher in CK than T.
To identify the functions that might be considered as differential biomarkers between groups, we determined the LDA score to estimate the size of the influence of the difference function. The results of KEGG, eggNOG, CAZy from top to bottom showed that the value of LDA score was greater than the threshold value (>3) as presented in Figure S6. Two functions related to glycoside hydrolases (GH) namely GH13 and GT84 were exclusively observed in T, while six functions including three related to carbohydrate-binding modules (CBM) e.g CBM13, CBM41, CBM57, and three related with glycoside hydrolases (GH9, GH29, and GH3), were observed in CK. This means that one function related to glycoside hydrolases and glycoside transferases was specific to the T group as opposed to the CK group. However, three modules related to each of the carbohydrate-binding modules (CBM) and glycoside hydrolases (GH) were exclusively associated with CK (Figure 10).

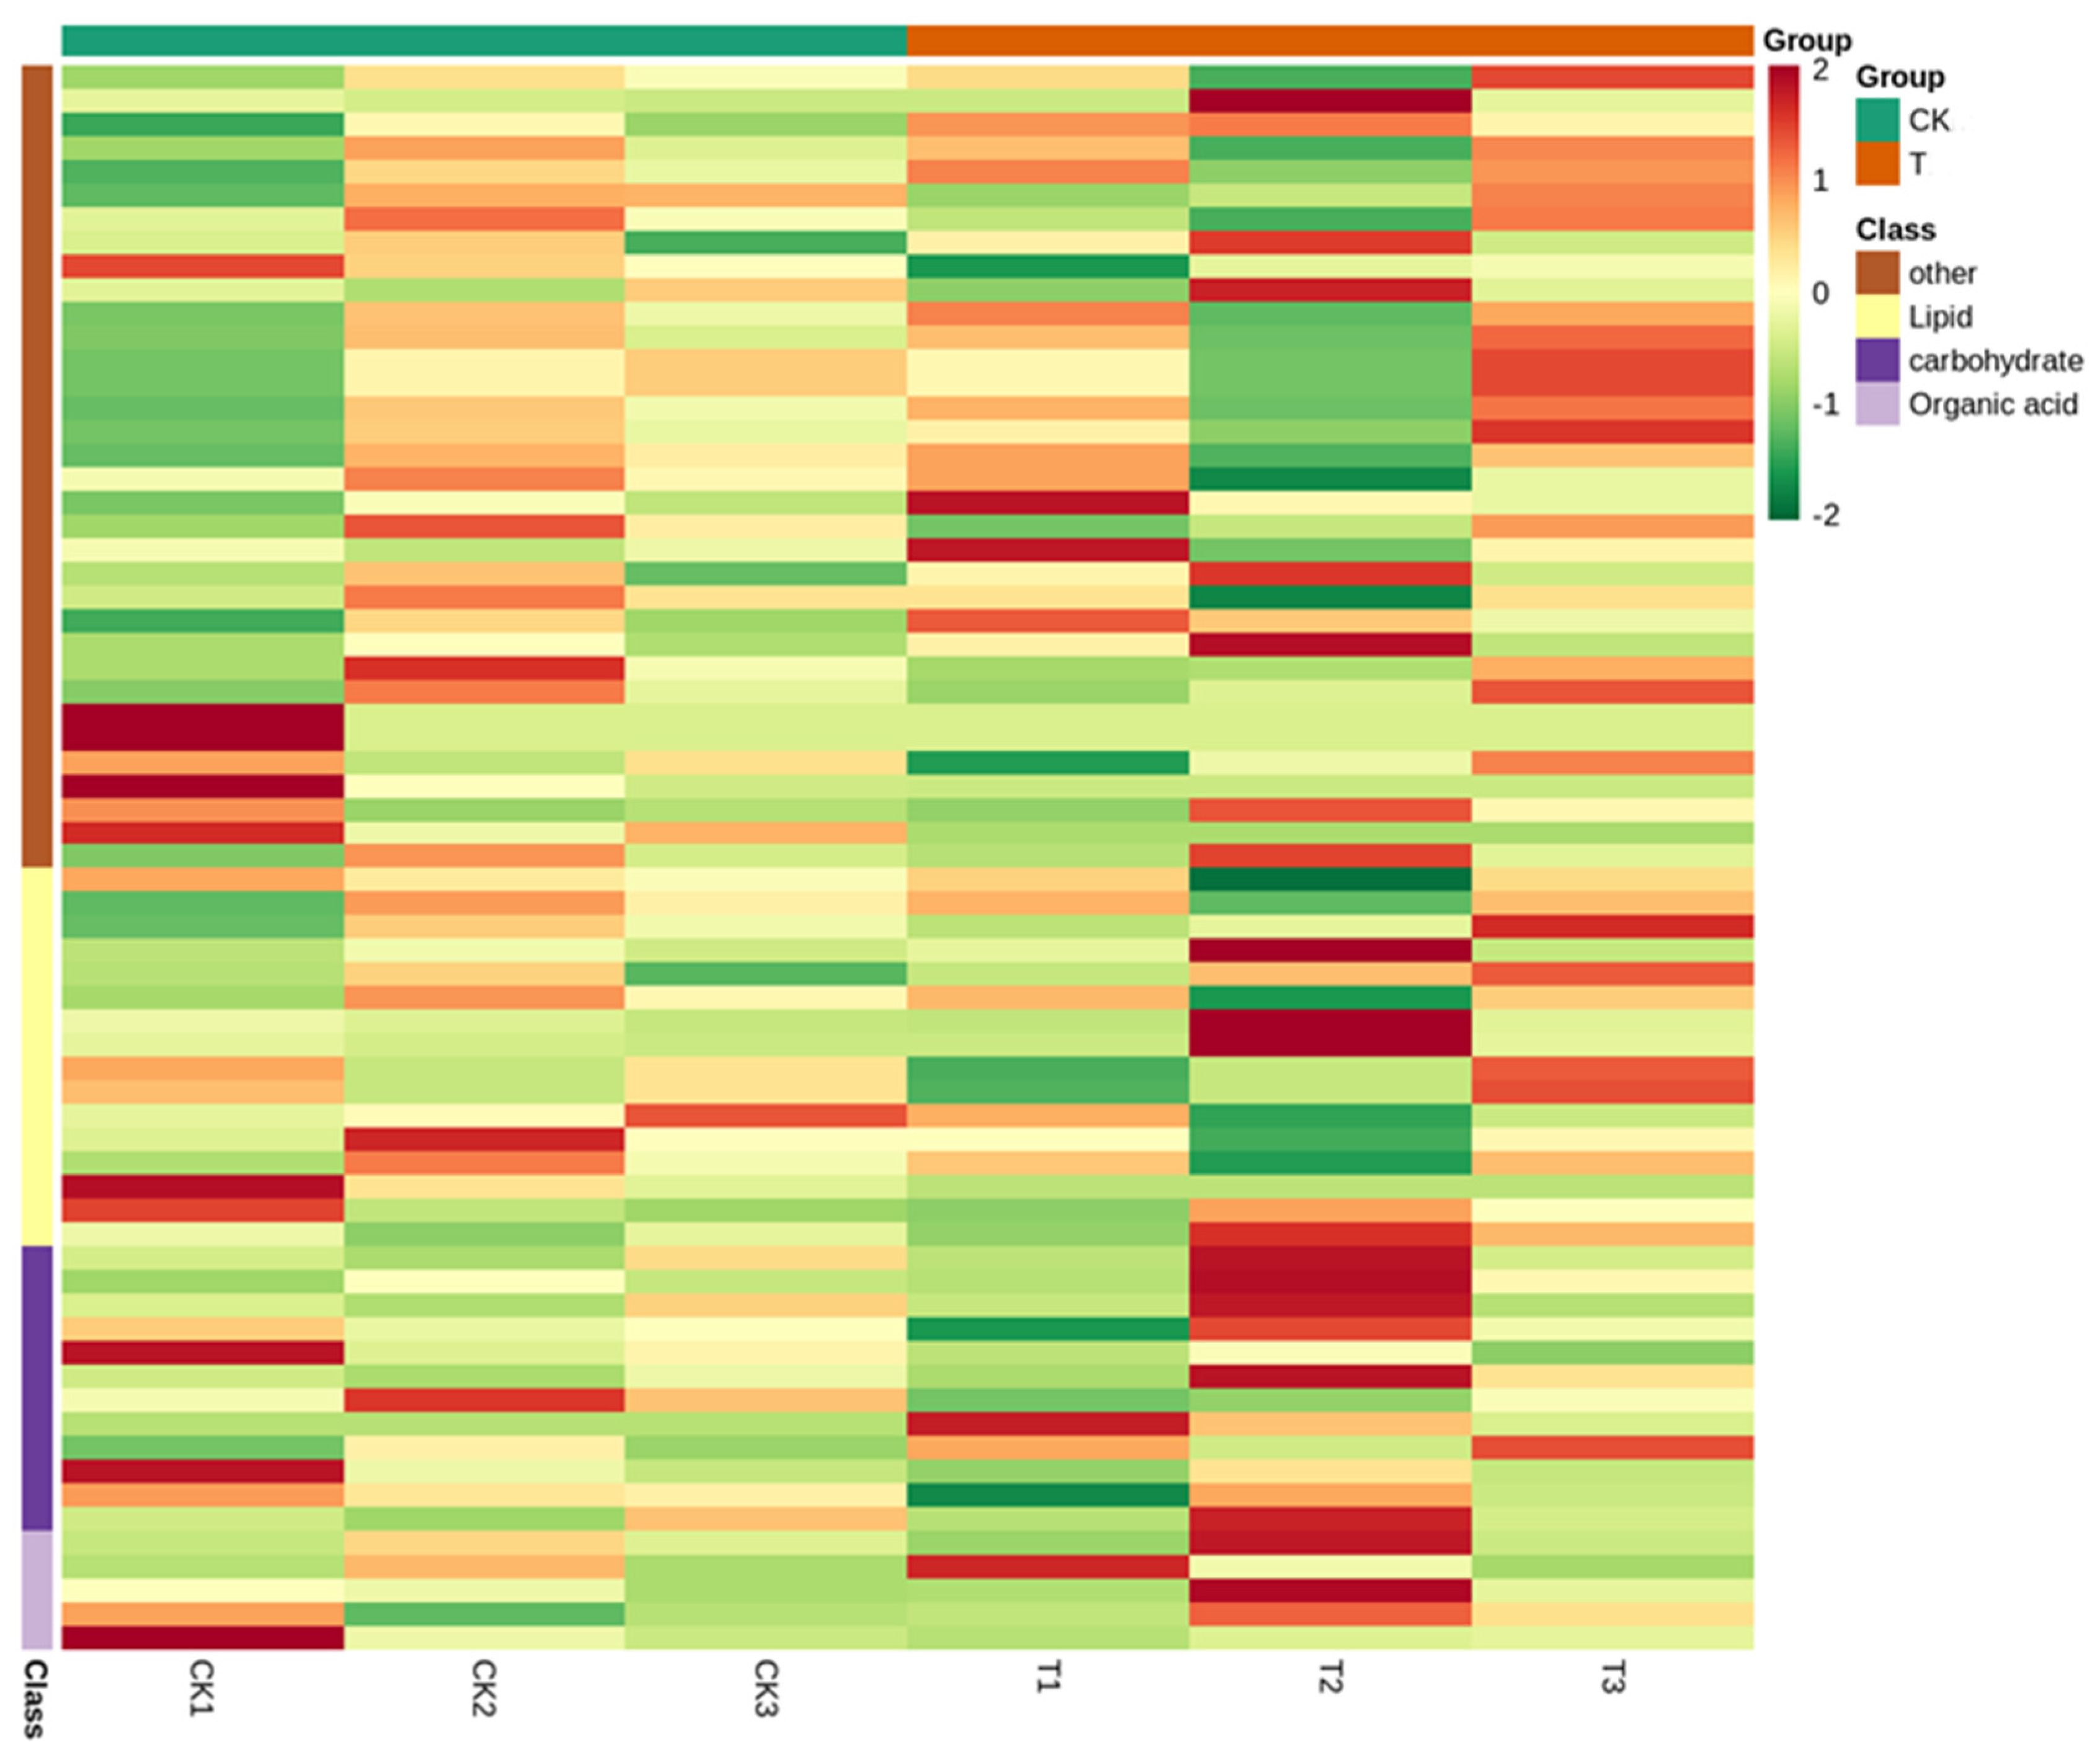
3.8. Differential Metabolite Analysis

We performed a PCA for the targeted clustering of samples based on the abundance of metabolites. The PCA plot clearly separated the two groups (Figure S7), and PC1 explained about 59.8% while PC2 explained 18.02% of the total variation. This result may indicate the substantial differences in the metabolic profile of the P. notoginseng rhizosphere cultivated under field and forest. The heat map analysis of metabolite contents revealed that carbohydrate contents were higher in the T group than the CK group. Moreover, carbohydrate metabolites were more abundant in the T group compared with the CK group (Figure 11). Furthermore, functions related to organic acids were more abundant in the T group than the CK group.
Moreover, PLS-DA analysis was carried out for the targeted clustering of samples based on critical metabolite information. Similarly to the PCA plot, the PLS-DA score plot also revealed a clear separation of the CK and T groups (Figure S8). However, analysis of metabolite data based on the OPLS-DA model was performed for mapping the scores of each group, which further demonstrated the differences between the groups. The T scores and orthogonal T scores of OPLS-DA models revealed limited variations (20.6 and 16.3%, respectively) among metabolites in both groups.
Additionally, to assess the reliability of models, a permutation test was performed with 200 iterations. The results of cross-validation revealed that neither model was overfitted (R2 = 0.98 (p = 0.125), and Q2 = 0.39 (0.5), as presented in Figure S9. The p-value of 0.545 of Y indicates that there are 109 random grouping models in this permutation test that have a better interpretation rate of the Y matrix than this OPLS-DA model. If Q2 is more than 0.5, then it can be considered a valid model, while a value of Q2 > 0.9 and p < 0.05 is the indicator of an excellent model. Due to this reason, further screening of differential metabolites in the rhizosphere of P. notoginseng cultivated in field and forest conditions was not possible owing to the similar set of metabolites in both groups.

4. Discussion

4.1. Growth and Physical Characteristics of P. notoginseng

The rhizosphere is a primary site of direct interaction between the host plant and soil microbes [31,32]. It is well-established that the structure of rhizospheric microbiome is sculpted by the habitat of host plant, phenology and secretions of roots [33,34,35]. In turn, these microbial communities may exert potential impacts on root functions, plus the health and growth of the plants. Due to the potential effects of the rhizospheric microbiome, it is termed the “second genome” of the plant, which is crucial for plant growth and survival [31,36]. Previous studies have reported changes in the structure of microbial communities in the rhizosphere of soils of P. ginseng cultivated under different modes and ages [16,37]. However, limited information is available on differential metabolites and functional characteristics of microbes that vary in different cultivations modes of P. notoginseng.
Root weight is the most important economic parameter related with quantity and quality of the P. notoginseng regarding its medicinal value. In the present study, better growth in terms of root weight was observed in plants grown under the forest conditions. These findings might be attributed partially to the desirable structure of bacterial communities present in forest rhizosphere, particularly the higher Proteobacteria to Acidobacteria ratio. It is well-established that the rhizosphere serves as an important bridge between plants and soil for the exchange of nutrients through plant roots and symbiotic relationships [38]. Moreover, rhizospheric bacteria play a crucial role in nutrient recycling, along with performing many valuable ecological functions including decreasing pathogens while provoking disease resistance [39,40]. Furthermore, volatiles present in pine needles in the forest soil might have imparted beneficial effects in terms of reducing the incidence of root diseases and nutrient absorption and utilization. This is mainly attributed to the polyphenolic contents of pine needles, which possess excellent antimicrobial and antioxidant activities [41].

4.2. Relative Abundance of Microbial Communities

Metagenomic sequencing of rhizospheric soil from P. notoginseng was performed, which revealed almost similar structures of core microbial communities in the P. notoginseng cultivated under field and forest conditions. The PCA showed clear separation of rhizosphere samples of both cultivation modes, and the cluster analysis also revealed noticeable differences in the relative abundance of bacterial communities. However, further investigations are required to elucidate the causative factors responsible for these changes in the rhizospheric microbiome. It is important to investigate the potential effects of root exudates and earlier residues present in the soil on bacterial communities. In the present study, Acidobacterium was the dominant bacterial taxa, accounting for slightly higher relative abundance (42.4%) in CK as compared to T (40.4%).
The Acidobacteria and Proteobacteria were the two dominant bacterial taxa present in both rhizospheres sampled, which is in agreement with earlier studies on P. ginseng [16,42]. In the present study, Acidobacteria to Proteobacteria ratio was slightly higher in the CK rhizosphere than that of T, revealing a shift towards Acidobacteria over Proteobacteria. This seems to be important, as a selective increase in Proteobacteria over Acidobacterium and Gram-positive bacteria in rhizosphere soils has been shown to enhance the prevalence of the Pseudomonas bacterial group, which is associated with plant diseases or negatively-affected plant growth [43,44]. Proteobacteria to Acidobacteria ratio is also considered an index of nutrients available in the soil, as Proteobacteria are associated with eutrophic soil, and Acidobacteria with infertile soil [45,46]. Moreover, Proteobacteria play a key role in global nutrient recycling, including C, N, S, and Fe [47,48], and is prevalent as the most abundant bacterial taxa in rhizosphere soils [49,50,51]. Moreover, a higher relative abundance of Proteobacteria in the rhizosphere has been positively correlated with increased soil nutrient levels and pH [45,52].
Keeping in view the above-mentioned findings, it was expected that the relative abundance of Proteobacteria might be higher in P. notoginseng rhizosphere cultivated under forest conditions compared to that of field conditions. This might be attributed to the differential set of geophysical characteristics (nutrient contents, organic matter and pH) of the rhizospheric soils under forest conditions, where climate and environmental challenges are higher than in plants cultivated under the field conditions. The present study also revealed a higher abundance of Nitrospira in the CK group, which is in agreement with earlier studies reporting a remarkable increase in this bacterial taxon in the P. ginseng rhizospheres of forest soil when compared with farmland [53].

4.3. Biomarker Bacterial Taxa in the P. ginseng Rhizosphere Soil under Field and Forest Conditions

The LEfSe algorithm was used to identify bacterial taxa with significantly different relative abundance between both soil rhizospheres, which revealed Candidatus Rokubacteria, Candidatus nitrostelea and Thaumarchaetoa as biomarker taxa for the forest rhizospheres [54]. Candidatus Rokubacteria play a key role in the N and S recycling and are metabolically versatile [55,56]. Furthermore, the expression of their PQQ alcohol dehydrogenases has been observed in the soil, indicating that these enzymes may be functional in these specific bacteria [56]. Moreover, Thaumarchaetoa being a biomarker taxon in rhizosphere of P. notoginseng cultivated under forest conditions is in agreement with earlier studies, as it was also reported as a biomarker archaea in the rhizosphere of two native plant species of Qinghai–Tibetan Plateau [54]. The archaea hold specific enzymes and peculiar metabolic pathways that support them to endure and flourish under harsh conditions of nutrient-deficient habitats which might reduce their reliance on root secretions when compared to other soil microbes such as bacteria or fungi [57,58]. This indicates the chances of a relatively higher abundance of archaea under the forest rhizospheres than farmland or field conditions, as under these conditions other soil microbes (bacterial and fungal species) might readily consume the nutrients required by the archaea. Moreover, host plants also compete with microbes for nutrients under harsh conditions, reducing the interactions or niche sharing among archaea [59,60].
The identification of beta and gamma proteobacteria (including Burkholderiales) as biomarker taxa in the CK group makes sense, as proteobacterial taxa possess considerable genetic and metabolic diversity with an ability to positively affect plant growth or kill soil pathogens, or conduct N fixation or degrade chemical pollutants which are prevalent under field conditions [61]. The other two biomarker taxa (Promicromonospora, Brachybacterium) belong to Actinobacteria, which has been reported as one of the most abundant bacteria in P. ginseng rhizospheres [42,53], and are famous for their potential for global carbon cycling [62] and the decomposition of soil organic material [63]. Moreover, Actinobacteria has also been used as a biocontrol agent for the effective control of different soil- and seed-borne plant diseases [64].

4.4. Differential Metabolite Analysis

Metagenomic sequencing is a powerful tool for the characterization of metabolic functions of the rhizosphere microbiome and the association of functional genes with the phylogenetic taxa of uncultured organisms [65,66,67]. However, it is noteworthy that a metagenomic approach cannot directly capture expression dynamics of microbial genes, but can only indirectly predict the putative functions [68]. In the present study, KEGG pathway analysis revealed that different pathways related to organism systems, environmental information processing and cellular processes were enriched in the T group, while metabolism, human diseases, and genetic information processing pathways were abundant in the CK group. The abundance of four KOs including maltose dehydrogenase (K0029), DNA gyrase subunit A (K02469), long-chain acyl-CoA synthetase (K01897) and RNA-directed DNA polymerase (K00986) were higher in the T group than the CK group. However, the abundances of isoquinoline 1-oxidoreductase subunit beta (K07303), formate hydrogenlyase transcriptional activator (K15836), transposase (K07486) and putative transposase (K07497) were higher in CK than T.
To identify the different functions that might be considered as differential biomarkers between the two groups, we determined the LDA score to estimate the size of the differential function. The results of KEGG, eggNOG, CAZy analyses revealed that two functions related to carbohydrate-active enzymes, namely Glycoside Hydrolase Family 13 (GH13) and Glycosyl Transferase Family 84 (GT84), were exclusively observed in P. notoginseng cultivated under forest conditions. The GH13 family is the largest family of glycoside hydrolases that act on starch, glycogen, and related oligo- and polysaccharides [69]. There are more than 120 and 90 families of glycoside hydrolases and glycosyl transferases, respectively [70]. Glycoside hydrolases that break-down complex polysaccharides are often associated with one or more carbohydrate-binding modules (CBMs), which facilitate the action of catalytic enzymes on the substrate leading to efficient breakdown of the target substrate [71,72,73]. A combination of CBM and GH modules as a biomarker function in P. notoginseng rhizospheres from field cultivation revealed the indication of more efficient breakdown of carbohydrates compared with other groups [74].
The metabolomic analysis of rhizosphere soils revealed that metabolites related to carbohydrate, lipids and organic acids were higher in P. notoginseng rhizospheres under forest conditions. This may be attributed to a higher relative abundance of actinobacteria and proteobacteria in this group when compared with those of field cultivation. However, the OPLS-DA model used for the identification of differential metabolites in the two rhizospheres revealed that metabolite fractions observed in both groups were similar and no metabolite differing in the rhizospheres of P. notoginseng cultivated in the field and forest conditions was observed. This might be attributed to the almost similar microbial communities identified in both groups even though their relative abundance varied slightly between both rhizospheres. Moreover, earlier studies have shown that variations in the structure of microbial communities might not alter soil functions [75]. Furthermore, studies reported the effects of continuous planting of P. ginseng on farmland and deforestation field on soil microbial diversity and functions [53,76], which revealed significantly poorer microbial diversity and functions in farmland rhizospheres. Additionally, the abundance of pathogenic strains of soil microbes of P. ginseng increased with the cultivation age, resulting in shifts in the normal microbial communities [53]. The present study revealed changes in the relative abundance of microbial communities and their putative functions, but no change in the metabolites of rhizosphere were observed. Better root weight observed in plants grown under the forest conditions indicated the potential desirable effects of a forest rhizosphere regarding plant health and growth, which indicates the successful cultivation of P. notoginseng under forest conditions. However, further investigations on larger cohorts are required to elucidate the long-term effects of different cultivation modes of P. notoginseng on rhizospheric microbial communities and their metabolic functions.

5. Conclusions

Metagenomic sequencing revealed the differential relative abundance of bacterial taxa in rhizospheres of P. notoginseng cultivated under field and forest conditions. Candidatus Rokubacteria and Candidatus nitrostelea were identified as biomarker taxa in forest rhizospheres, while taxa belonging to betaproteobacteria and gammaproteobacteria, Burkholderiales and Verrucomicrobia were differentially enriched in the field rhizospheres. No differential metabolite contents were observed between the two rhizospheric groups, indicating that cultivation of P. notoginseng did not affect the soil quality under forest plantation, at least within two years of cultivation. These findings suggest that P. notoginseng can be successfully cultivated under forest conditions, which would be beneficial for both sustainable forest management as well as for the production of good-quality ginseng, through exploiting the native environment and allelopathic interactions.

Supplementary Materials

The following are available online at https://www.mdpi.com/article/10.3390/agronomy11122488/s1, Table S1. Summary of 16S-seq data and mapped reads. Table S2. Summary for metagenomic sequencing, assembly and annotation. Figure S1. Total number of non-redundant genes detected in rhizospheres from field (CK) and forest (T). Figure S2. The results of eggNOG pathway analysis showing the statistics of Unigenes annotation. The number on the bar graph represents the number of Unigenes on the note; the other axis is the code of each function class of level1 in eggNOG database. Figure S3. The number of Unigenes notes in CAZy is the chart of the number of Unigenes notes from top to bottom. The number on the bar chart represents the number of Unigenes on the comment; the remaining axes are the code for each level1 functional class in each database, and the code is interpreted in the corresponding legend description. Figure S4. PCA analysis based on the functional abundance of KEGG databases at each classification level. CK = P. notoginseng rhizosphere from field, T = P. notoginseng rhizosphere from forest. Figure S5. Cluster heat map of functional abundance (KOs) between CK and T. CK = P. notoginseng rhizosphere from field, T = P. notoginseng rhizosphere from forest. Figure S6. The results of KEGG, eggNOG, CAZy from top to bottom show that the LDA value distribution bar chart shows the function of LDA Score greater than the set value (default setting is 3), i.e., Biomarker with statistical differences between groups, and the length of the bar chart represents the size of the influence of the difference function (i.e., LDA Score). CK = P. notoginseng rhizosphere from field, T = P. notoginseng rhizosphere from forest. Figure S7. Principal component analysis abundance of metabolites in both rhizospheres. CK = P. notoginseng rhizosphere from field, T = P. notoginseng rhizosphere from forest. Figure S8. Analysis of metabolite data based on the OPLS-DA model, mapping the scores of each group demonstrating the differences between the groups. CK = P. notoginseng rhizosphere from field, T = P. notoginseng rhizosphere from forest. Figure S9. The permutation tests for PLS-DA model to detect the accuracy of the model. Q2 indicates the prediction of four random grouping models in this test (200 permutations) and R2 Y indicates the interpretation rate of the Y matrix compared to OPLS-DA model.

Author Contributions

Conceptualization, X.H.; methodology, R.S. and H.G.; software, R.S., H.G. and S.H.; validation, B.X., Y.H., R.S. and X.H.; formal analysis, A.R.H., Y.H. and B.X.; investigation, A.R.H., X.H. and H.G.; resources, X.H.; data curation, X.H.; writing—original draft preparation, R.S. and X.H.; writing—review and editing, R.S., X.H. and S.H.; visualization, B.X., S.H. and H.G.; supervision, X.H.; project administration, H.G., S.H. and R.S.; funding acquisition, X.H. All authors have read and agreed to the published version of the manuscript.

Funding

This work was supported by the China Agriculture Research System of MOF & MARA (CARS-21), Major Science and Technology Project of Yunnan (202102AE090042, 202002AA10007, 2019ZG00901), Major Science and Technology Project of Kunming (2021JH002), High-end Foreign Experts Program of Yunnan (202105AQ130011, 2019013), and the Yunnan Provincial Financial Forestry Science and Technology Promotion Demonstration Special Project (2020) No. TS09.

Institutional Review Board Statement

Not applicable.

Informed Consent Statement

Not applicable.

Data Availability Statement

The raw sequencing data has been submitted to NCBI SRA PRJNA752500. All remaining data used in this manuscript are available in the text and additional files.

Conflicts of Interest

The authors declare no conflict of interest.

References

  1. Sharma, S.K.; Pandit, M. A New Species of Panax L. (Araliaceae) from Sikkim Himalaya, India. Syst. Bot. 2009, 34, 434–438. [Google Scholar] [CrossRef]
  2. Zhang, H.-Z.; Liu, D.-H.; Zhang, D.-K.; Wang, Y.-H.; Cao, L.-J.; Xiao, X.-H.; Huang, L.-Q.; Wang, J.-B. Quality Assessment of Panax notoginseng from Different Regions through the Analysis of Marker Chemicals, Biological Potency and Ecological Factors. PLoS ONE 2016, 11, e0164384. [Google Scholar] [CrossRef] [Green Version]
  3. Zhao, Q.; Wu, Y.-N.; Fan, Q.; Han, Q.-Q.; Paré, P.W.; Xu, R.; Wang, Y.-Q.; Wang, S.-M.; Zhang, J.-L. Improved Growth and Metabolite Accumulation in Codonopsis pilosula (Franch.) Nannf. by Inoculation of Bacillus amyloliquefaciens GB03. J. Agric. Food Chem. 2016, 64, 8103–8108. [Google Scholar] [CrossRef] [PubMed]
  4. Huang, W.; Long, C.; Lam, E. Roles of Plant-Associated Microbiota in Traditional Herbal Medicine. Trends Plant Sci. 2018, 23, 559–562. [Google Scholar] [CrossRef]
  5. Dong, L.; Xu, J.; Zhang, L.; Cheng, R.; Wei, G.; Su, H.; Yang, J.; Qian, J.; Xu, R.; Chen, S. Rhizospheric microbial communities are driven by Panax ginseng at different growth stages and biocontrol bacteria alleviates replanting mortality. Acta Pharm. Sin. B 2018, 8, 272–282. [Google Scholar] [CrossRef]
  6. Köberl, M.; Schmidt, R.; Ramadan, E.M.; Bauer, R.; Berg, G. The microbiome of medicinal plants: Diversity and importance for plant growth, quality and health. Front. Microbiol. 2013, 4, 400. [Google Scholar] [CrossRef] [Green Version]
  7. Zhang, L. Study on discontinuous cultivating of Panax ginseng and its workable solution. J. Jilin Agric. Univ. 2008, 30, 481–485. [Google Scholar]
  8. Zhang, H.; Xue, Q. Research progress in control of continuous cropping obstacle in Ginseng. Acta Agric. Jiangxi 2010, 22, 68–71. [Google Scholar]
  9. Dong, L.; Xu, J.; Feng, G.; Li, X.; Chen, S. Soil bacterial and fungal community dynamics in relation to Panax notoginseng death rate in a continuous cropping system. Sci. Rep. 2016, 6, 31802. [Google Scholar] [CrossRef] [Green Version]
  10. Wu, L. A review on studies of the reason and control methods of succession cropping obstacle of Panax ginseng CA Mey. Spec. Wild Econ. Anim. Plant Res. 2008, 2, 68–72. [Google Scholar]
  11. Ying, Y. Influence of Panax ginseng continuous cropping on metabolic function of soil microbial communities. Chin. Herb. Med. 2012, 4, 329–334. [Google Scholar]
  12. Xun, W.; Liu, Y.; Li, W.; Ren, Y.; Xiong, W.; Xu, Z.; Zhang, N.; Miao, Y.; Shen, Q.; Zhang, R. Specialized metabolic functions of keystone taxa sustain soil microbiome stability. Microbiome 2021, 9, 1–15. [Google Scholar] [CrossRef] [PubMed]
  13. Randewig, D.; Marshall, J.D.; Näsholm, T.; Jämtgård, S. Combining microdialysis with metabolomics to characterize the in situ composition of dissolved organic compounds in boreal forest soil. Soil Biol. Biochem. 2019, 136, 107530. [Google Scholar] [CrossRef]
  14. Chen, W.; Kui, L.; Zhang, G.; Zhu, S.; Zhang, J.; Wang, X.; Yang, M.; Huang, H.; Liu, Y.; Wang, Y.; et al. Whole-Genome Sequencing and Analysis of the Chinese Herbal Plant Panax notoginseng. Mol. Plant 2017, 10, 899–902. [Google Scholar] [CrossRef] [PubMed] [Green Version]
  15. Withers, E.; Hill, P.W.; Chadwick, D.R.; Jones, D.L. Use of untargeted metabolomics for assessing soil quality and microbial function. Soil Biol. Biochem. 2020, 143, 107758. [Google Scholar] [CrossRef]
  16. Xiao, C.; Yang, L.; Zhang, L.; Liu, C.; Han, M. Effects of cultivation ages and modes on microbial diversity in the rhizosphere soil of Panax ginseng. J. Ginseng Res. 2016, 40, 28–37. [Google Scholar] [CrossRef] [Green Version]
  17. Bian, X.; Zhao, Y.; Xiao, S.; Yang, H.; Han, Y.; Zhang, L. Metabolome and transcriptome analysis reveals the molecular profiles underlying the ginseng response to rusty root symptoms. BMC Plant Biol. 2021, 21, 215. [Google Scholar] [CrossRef]
  18. Wang, J.-H.; Lu, J.; Zhang, Y.-X.; Wu, J.; Luo, Y.; Liu, H. Metagenomic analysis of antibiotic resistance genes in coastal industrial mariculture systems. Bioresour. Technol. 2018, 253, 235–243. [Google Scholar] [CrossRef]
  19. Luo, R.; Liu, B.; Xie, Y.; Li, Z.; Huang, W.; Yuan, J.; He, G.; Chen, Y.; Pan, Q.; Liu, Y.; et al. SOAPdenovo2: An empirically improved memory-efficient short-read de novo assembler. GigaScience 2012, 1, 18. [Google Scholar] [CrossRef]
  20. Zhu, W.; Lomsadze, A.; Borodovsky, M. Ab initio gene identification in metagenomic sequences. Nucleic Acids Res. 2010, 38, e132. [Google Scholar] [CrossRef] [Green Version]
  21. Fu, L.; Niu, B.; Zhu, Z.; Wu, S.; Li, W. CD-HIT: Accelerated for clustering the next-generation sequencing data. Bioinformatics 2012, 28, 3150–3152. [Google Scholar] [CrossRef]
  22. Langmead, B.; Salzberg, S.L. Fast gapped-read alignment with Bowtie 2. Nat. Methods 2012, 9, 357–359. [Google Scholar] [CrossRef] [Green Version]
  23. Villar, E.; Farrant, G.K.; Follows, M.; Garczarek, L.; Speich, S.; Audic, S.; Bittner, L.; Blanke, B.; Brum, J.R.; Brunet, C.; et al. Environmental characteristics of Agulhas rings affect interocean plankton transport. Science 2015, 348, 1261447. [Google Scholar] [CrossRef] [Green Version]
  24. Buchfink, B.; Xie, C.; Huson, D.H. Fast and sensitive protein alignment using DIAMOND. Nat. Methods 2015, 12, 59–60. [Google Scholar] [CrossRef]
  25. Huson, D.H.; Mitra, S.; Ruscheweyh, H.-J.; Weber, N.; Schuster, S.C. Integrative analysis of environmental sequences using MEGAN4. Genome Res. 2011, 21, 1552–1560. [Google Scholar] [CrossRef] [PubMed] [Green Version]
  26. Karlsson, F.; Fåk, F.; Nookaew, I.; Tremaroli, V.; Fagerberg, B.; Petranovic, D.; Bäckhed, F.; Nielsen, J. Symptomatic atherosclerosis is associated with an altered gut metagenome. Nat. Commun. 2012, 3, 1245. [Google Scholar] [CrossRef] [Green Version]
  27. Kanehisa, M.; Goto, S.; Sato, Y.; Kawashima, M.; Furumichi, M.; Tanabe, M. Data, information, knowledge and principle: Back to metabolism in KEGG. Nucleic Acids Res. 2014, 42, D199–D205. [Google Scholar] [CrossRef] [PubMed] [Green Version]
  28. Powell, S. Eggnog v4. 0: Nested orthology inference across 3686 organisms. Nucleic Acids Res. 2014, 42, D231–D239. [Google Scholar] [CrossRef] [PubMed]
  29. White, J.R.; Nagarajan, N.; Pop, M. Statistical Methods for Detecting Differentially Abundant Features in Clinical Metagenomic Samples. PLoS Comput. Biol. 2009, 5, e1000352. [Google Scholar] [CrossRef]
  30. Swenson, T.L.; Jenkins, S.; Bowen, B.P.; Northen, T.R. Untargeted soil metabolomics methods for analysis of extractable organic matter. Soil Biol. Biochem. 2015, 80, 189–198. [Google Scholar] [CrossRef] [Green Version]
  31. Berendsen, R.L.; Pieterse, C.M.J.; Bakker, P.A. The rhizosphere microbiome and plant health. Trends Plant Sci. 2012, 17, 478–486. [Google Scholar] [CrossRef]
  32. Priyadharsini, P. Mycorrhizosphere: The Extended Rhizosphere and Its Significance, in Plant-Microbe Interaction: An Approach to Sustainable Agriculture; Springer: Berlin/Heidelberg, Germany, 2016; pp. 97–124. [Google Scholar]
  33. Haichar, F.E.Z.; Marol, C.; Berge, O.; Rangel-Castro, J.I.; Prosser, J.; Balesdent, J.; Heulin, T.; Achouak, W. Plant host habitat and root exudates shape soil bacterial community structure. ISME J. 2008, 2, 1221–1230. [Google Scholar] [CrossRef] [PubMed]
  34. Narula, N.; Kothe, E.; Behl, R.K. Role of root exudates in plant-microbe interactions. J. Appl. Bot. Food Qual. 2012, 82, 122–130. [Google Scholar]
  35. Saleem, M.; Law, A.D.; Sahib, M.R.; Pervaiz, Z.H.; Zhang, Q. Impact of root system architecture on rhizosphere and root microbiome. Rhizosphere 2018, 6, 47–51. [Google Scholar] [CrossRef]
  36. Pieterse, C.M.; Zamioudis, C.; Does, D.V.; Van Wees, S. Signalling Networks Involved in Induced Resistance. Induced Resistance for Plant Defence: A Sustainable Approach to Crop Protection, 2nd ed.; John Wiley and Sons: Hoboken, NJ, USA, 2014; pp. 58–80. [Google Scholar]
  37. Yong, L. Microbial community diversity analysis of Panax ginseng rhizosphere and non-rhizosphere soil using randomly amplified polymorphic DNA method. Open J. Genet. 2012, 2, 20387. [Google Scholar]
  38. Toal, M.E.; Yeomans, C.; Killham, K.; Meharg, A. A review of rhizosphere carbon flow modelling. Plant Soil 2000, 222, 263–281. [Google Scholar] [CrossRef]
  39. Whipps, J.M. Microbial interactions and biocontrol in the rhizosphere. J. Exp. Bot. 2001, 52, 487–511. [Google Scholar] [CrossRef]
  40. Krzyzanowska, D.; Potrykus, M.; Golanowska, M.; Polonis, K.; Gwizdek-Wisniewska, A.; Lojkowska, E.; Jafra, S. Rhizosphere bacteria as potential biocontrol agents against soft rot caused by various pectobacterium and Dickeya spp. strains. J. Plant Pathol. 2012, 94, 367–378. [Google Scholar]
  41. Selvakumar, G.; Saha, S.; Kundu, S. Inhibitory activity of pine needle tannin extracts on some agriculturally resourceful microbes. Indian J. Microbiol. 2007, 47, 267–270. [Google Scholar] [CrossRef] [PubMed] [Green Version]
  42. Vendan, R.T.; Lee, S.H.; Yu, Y.J.; Rhee, Y.H. Analysis of Bacterial Community in the Ginseng Soil Using Denaturing Gradient Gel Electrophoresis (DGGE). Indian J. Microbiol. 2011, 52, 286–288. [Google Scholar] [CrossRef] [Green Version]
  43. Marilley, L.; Aragno, M. Phylogenetic diversity of bacterial communities differing in degree of proximity of Lolium perenne and Trifolium repens roots. Appl. Soil Ecol. 1999, 13, 127–136. [Google Scholar] [CrossRef]
  44. Berggren, I.; Van Vuurde, J.; Mãrtensson, A.M.; Alström, S. Rhizoplane colonisation of peas by Rhizobium leguminosarum bv. viceae and a deleterious Pseudomonas putida. FEMS Microbiol. Ecol. 2005, 52, 71–78. [Google Scholar] [CrossRef] [PubMed] [Green Version]
  45. Smit, E.; Leeflang, P.; Gommans, S.; Broek, J.V.D.; van Mil, S.; Wernars, K. Diversity and Seasonal Fluctuations of the Dominant Members of the Bacterial Soil Community in a Wheat Field as Determined by Cultivation and Molecular Methods. Appl. Environ. Microbiol. 2001, 67, 2284–2291. [Google Scholar] [CrossRef] [Green Version]
  46. Castro, H.F.; Classen, A.; Austin, E.E.; Norby, R.; Schadt, C.W. Soil Microbial Community Responses to Multiple Experimental Climate Change Drivers. Appl. Environ. Microbiol. 2010, 76, 999–1007. [Google Scholar] [CrossRef] [PubMed] [Green Version]
  47. Hedrich, S.; Schlömann, M.; Johnson, D.B. The iron-oxidizing proteobacteria. Microbiology 2011, 157, 1551–1564. [Google Scholar] [CrossRef] [PubMed] [Green Version]
  48. Rosenzweig, N.; Tiedje, J.M.; Quensen, J.F.; Meng, Q.; Hao, J.J. Microbial Communities Associated with Potato Common Scab-Suppressive Soil Determined by Pyrosequencing Analyses. Plant Dis. 2012, 96, 718–725. [Google Scholar] [CrossRef] [Green Version]
  49. She, S.; Niu, J.; Zhang, C.; Xiao, Y.; Chen, W.; Dai, L.; Liu, X.; Yin, H. Significant relationship between soil bacterial community structure and incidence of bacterial wilt disease under continuous cropping system. Arch. Microbiol. 2016, 199, 267–275. [Google Scholar] [CrossRef]
  50. Tian, Y.; Gao, L. Bacterial Diversity in the Rhizosphere of Cucumbers Grown in Soils Covering a Wide Range of Cucumber Cropping Histories and Environmental Conditions. Microb. Ecol. 2014, 68, 794–806. [Google Scholar] [CrossRef]
  51. Xiong, W.; Zhao, Q.; Zhao, J.; Xun, W.; Li, R.; Zhang, R.; Wu, H.; Shen, Q. Different Continuous Cropping Spans Significantly Affect Microbial Community Membership and Structure in a Vanilla-Grown Soil as Revealed by Deep Pyrosequencing. Microb. Ecol. 2014, 70, 209–218. [Google Scholar] [CrossRef]
  52. Liu, D.; Yang, Y.; An, S.; Wang, H.; Wang, Y. The Biogeographical Distribution of Soil Bacterial Communities in the Loess Plateau as Revealed by High-Throughput Sequencing. Front. Microbiol. 2018, 9, 2456. [Google Scholar] [CrossRef] [Green Version]
  53. Tong, A.-Z.; Liu, W.; Liu, Q.; Xia, G.-Q.; Zhu, J.-Y. Diversity and composition of the Panax ginseng rhizosphere microbiome in various cultivation modesand ages. BMC Microbiol. 2021, 21, 18. [Google Scholar] [CrossRef]
  54. Zhang, M.; Chai, L.; Huang, M.; Jia, W.; Guo, J.; Huang, Y. Deciphering the archaeal communities in tree rhizosphere of the Qinghai-Tibetan plateau. BMC Microbiol. 2020, 20, 235. [Google Scholar] [CrossRef]
  55. Bernard, L. Dynamics and identification of soil microbial populations actively assimilating carbon from 13C-labelled wheat residue as estimated by DNA-and RNA-SIP techniques. Environ. Microbiol. 2007, 9, 752–764. [Google Scholar] [CrossRef]
  56. Butterfield, C.N.; Li, Z.; Andeer, P.F.; Spaulding, S.; Thomas, B.C.; Singh, A.; Hettich, R.L.; Suttle, K.B.; Probst, A.J.; Tringe, S.G.; et al. Proteogenomic analyses indicate bacterial methylotrophy and archaeal heterotrophy are prevalent below the grass root zone. PeerJ 2016, 4, e2687. [Google Scholar] [CrossRef] [Green Version]
  57. Moissl-Eichinger, C.; Pausan, M.-R.; Taffner, J.; Berg, G.; Bang, C.; Schmitz, R.A. Archaea Are Interactive Components of Complex Microbiomes. Trends Microbiol. 2018, 26, 70–85. [Google Scholar] [CrossRef] [PubMed]
  58. Spang, A.; Saw, J.; Jørgensen, S.L.; Zaremba-Niedzwiedzka, K.; Martijn, J.; Lind, A.E.; Van Eijk, R.; Schleper, C.; Guy, L.; Ettema, T.J.G. Complex archaea that bridge the gap between prokaryotes and eukaryotes. Nat. Cell Biol. 2015, 521, 173–179. [Google Scholar] [CrossRef] [PubMed] [Green Version]
  59. Harrison, K.A.; Bol, R.; Bardgett, R.D. Do plant species with different growth strategies vary in their ability to compete with soil microbes for chemical forms of nitrogen? Soil Biol. Biochem. 2008, 40, 228–237. [Google Scholar] [CrossRef]
  60. Chen, J.; Carrillo, Y.; Pendall, E.; Dijkstra, F.A.; Evans, R.D.; Morgan, J.A.; Williams, D.G. Soil Microbes Compete Strongly with Plants for Soil Inorganic and Amino Acid Nitrogen in a Semiarid Grassland Exposed to Elevated CO2 and Warming. Ecosystems 2015, 18, 867–880. [Google Scholar] [CrossRef] [Green Version]
  61. Vio, S.A. Paraburkholderia. In Beneficial Microbes in Agro-Ecology; Elsevier: Amsterdam, The Netherlands, 2020; pp. 271–311. [Google Scholar]
  62. Fradin, E.F.; Thomma, B.P. Physiology and molecular aspects of Verticillium wilt diseases caused by V. dahliae and V. albo-atrum. Mol. Plant Pathol. 2006, 7, 71–86. [Google Scholar] [CrossRef]
  63. Upchurch, R.; Chiu, C.-Y.; Everett, K.; Dyszynski, G.; Coleman, D.C.; Whitman, W.B. Differences in the composition and diversity of bacterial communities from agricultural and forest soils. Soil Biol. Biochem. 2008, 40, 1294–1305. [Google Scholar] [CrossRef]
  64. Priyadharsini, P.; Dhanasekaran, D. Diversity of soil Allelopathic Actinobacteria in Tiruchirappalli district, Tamilnadu, India. J. Saudi Soc. Agric. Sci. 2015, 14, 54–60. [Google Scholar] [CrossRef] [Green Version]
  65. Castañeda, L.E.; Barbosa, O. Metagenomic analysis exploring taxonomic and functional diversity of soil microbial communities in Chilean vineyards and surrounding native forests. PeerJ 2017, 5, e3098. [Google Scholar] [CrossRef]
  66. Fierer, N.; Leff, J.W.; Adams, B.J.; Nielsen, U.N.; Bates, S.T.; Lauber, C.L.; Owens, S.; Gilbert, J.A.; Wall, D.H.; Caporaso, J.G. Cross-biome metagenomic analyses of soil microbial communities and their functional attributes. Proc. Natl. Acad. Sci. USA 2012, 109, 21390–21395. [Google Scholar] [CrossRef] [PubMed] [Green Version]
  67. Luo, C.; Rodriguez-R, L.M.; Johnston, E.; Wu, L.; Cheng, L.; Xue, K.; Tu, Q.; Deng, Y.; He, Z.; Shi, J.Z.; et al. Soil Microbial Community Responses to a Decade of Warming as Revealed by Comparative Metagenomics. Appl. Environ. Microbiol. 2013, 80, 1777–1786. [Google Scholar] [CrossRef] [Green Version]
  68. Thomas, T.; Gilbert, J.; Meyer, F. Metagenomics—A guide from sampling to data analysis. Microb. Inform. Exp. 2012, 2, 3. [Google Scholar] [CrossRef] [PubMed] [Green Version]
  69. Stam, M.R. Dividing the large glycoside hydrolase family 13 into subfamilies: Towards improved functional annotations of α-amylase-related proteins. Protein Eng. Des. Sel. 2006, 19, 555–562. [Google Scholar] [CrossRef] [Green Version]
  70. Cantarel, B.L.; Coutinho, P.M.; Rancurel, C.; Bernard, T.; Lombard, V.; Henrissat, B. The Carbohydrate-Active EnZymes database (CAZy): An expert resource for Glycogenomics. Nucleic Acids Res. 2008, 37, D233–D238. [Google Scholar] [CrossRef] [PubMed]
  71. Arantes, V.; Saddler, J.N. Access to cellulose limits the efficiency of enzymatic hydrolysis: The role of amorphogenesis. Biotechnol. Biofuels 2010, 3, 1–11. [Google Scholar] [CrossRef] [Green Version]
  72. Reyes-Ortiz, V.; Heins, R.A.; Cheng, G.; Kim, E.Y.; Vernon, B.C.; Elandt, R.B.; Adams, P.D.; Sale, K.L.; Hadi, M.Z.; Simmons, B.A.; et al. Addition of a carbohydrate-binding module enhances cellulase penetration into cellulose substrates. Biotechnol. Biofuels 2013, 6, 93. [Google Scholar] [CrossRef] [Green Version]
  73. Chalak, A.; Villares, A.; Moreau, C.; Haon, M.; Grisel, S.; D’Orlando, A.; Herpoël-Gimbert, I.; Labourel, A.; Cathala, B.; Berrin, J.-G. Influence of the carbohydrate-binding module on the activity of a fungal AA9 lytic polysaccharide monooxygenase on cellulosic substrates. Biotechnol. Biofuels 2019, 12, 1–10. [Google Scholar] [CrossRef] [Green Version]
  74. Sidar, A.; Albuquerque, E.D.; Voshol, G.P.; Ram, A.F.J.; Vijgenboom, E.; Punt, P.J. Carbohydrate Binding Modules: Diversity of Domain Architecture in Amylases and Cellulases From Filamentous Microorganisms. Front. Bioeng. Biotechnol. 2020, 8, 871. [Google Scholar] [CrossRef] [PubMed]
  75. Chapin, F.S.; Walker, B.H.; Hobbs, R.J.; Hooper, D.U.; Lawton, J.H.; Sala, O.E.; Tilman, D. Biotic Control over the Functioning of Ecosystems. Science 1997, 277, 500–504. [Google Scholar] [CrossRef] [Green Version]
  76. Tan, Y.; Cui, Y.; Li, H.; Kuang, A.; Li, X.; Wei, Y.; Ji, X. Rhizospheric soil and root endogenous fungal diversity and composition in response to continuous Panax notoginseng cropping practices. Microbiol. Res. 2017, 194, 10–19. [Google Scholar] [CrossRef] [PubMed]
Figure 1. Cultivation of P. notoginseng under the forest and field condition. (AC) show growth of P. notoginseng plants under forest, (D) shows P. notoginseng plants cultivated in field.
Agronomy 11 02488 g001
Figure 2. Appearance of two-year-old plants of P. notoginseng grown under field (A) and forest conditions (B).
Agronomy 11 02488 g002
Figure 3. (A) Core/Pan analysis of microbial genes (B) Venn diagram showing shared and unique genes between both rhizosphere groups. CK = P. notoginseng rhizosphere from field (including three replicates CK1, CK2, and CK3), T = P. notoginseng rhizosphere from forest (including three replicates T1, T2 and T3).
Agronomy 11 02488 g003
Figure 4. (A) Principal component analysis revealing differences in both groups (B) NMDS analysis, each point in the figure represents a sample, the distance between points indicates the degree of difference, and samples of the same group are represented by the same color. When stress is less than 0.2, it shows that NMDS analysis has some reliability.
Agronomy 11 02488 g004
Figure 5. The composition and structure of the bacterial community (CK = P. notoginseng rhizosphere from field including three replicates CK1, CK2, and CK3), T = P. notoginseng rhizosphere from forest (including three replicates T1, T2 and T3).
Agronomy 11 02488 g005
Figure 6. Relative abundance of bacterial phyla (A) and genera (B) between two rhizospheres (CK = P. notoginseng rhizosphere from field, T = P. notoginseng rhizosphere from forest).
Agronomy 11 02488 g006
Figure 7. Top 35 most abundant genera in at least one P. notoginseng rhizosphere soil sample through heat map analysis using normalized abundance. The color codes are based on z-scores. (CK = P. notoginseng rhizosphere from field including three replicates CK1, CK2, and CK3), T = P. notoginseng rhizosphere from forest (including three replicates T1, T2 and T3).
Agronomy 11 02488 g007
Figure 8. (A) Linear discriminant analysis effect size (LEfSe) for bacterial taxa between rhizosphere soils of P. notoginseng cultivated under field and forest condition. (B) Cladogram showing significantly enriched bacterial taxa (from phylum to family level). Significant differences are defined at p < 0.05 and LDA score >3.5. (CK = P. notoginseng rhizosphere from field, T = P. notoginseng rhizosphere from forest).
Agronomy 11 02488 g008
Figure 9. The results of KEGG pathway analysis showing the statistics of unigenes annotation. The number on the bar graph represents the number of unigenes on the note; the other axis is the code of each function class of level 1 in each KEGG database.
Agronomy 11 02488 g009
Figure 10. The cluster heat map showing the abundance of the differential functions. The results of KEGG, eggNOG, CAZy are displayed from top to bottom: landscape for sample information, portrait for functional annotation information, cluster tree on the left side of the graph is functional clustering tree, and the value for the middle heat map is the Z value obtained after the relative abundance of each row of functionality has been standardized. (CK = P. notoginseng rhizosphere from field including three replicates CK1, CK2, and CK3), T = P. notoginseng rhizosphere from forest (including three replicates T1, T2 and T3).
Agronomy 11 02488 g010
Figure 11. The heat map of metabolite contents in both rhizosphere groups. Landscape for sample name, vertical for metabolite information, Group for grouping, Class for substance classification, different colors for the relative content of standardized treatment of the resulting values (red for high content, green for low content). CK = P. notoginseng rhizosphere from field, T = P. notoginseng rhizosphere from forest.
Agronomy 11 02488 g011
Table 1. Growth characteristics of two-year-old P. notoginseng plants grown under field and forest conditions.
TraitsFieldForestSEMp Value
Plant height (cm)30.2025.471.420.07
Root length (cm)7.206.980.550.79
Root weight (g)6.188.910.200.001
Publisher’s Note: MDPI stays neutral with regard to jurisdictional claims in published maps and institutional affiliations.

