Article

Charcoal and Sago Bark Ash on pH Buffering Capacity and Phosphorus Leaching

by
Prisca Divra Johan
1,
Osumanu Haruna Ahmed
1,2,3,*,
Latifah Omar
1,2 and
Nur Aainaa Hasbullah
4
1
Department of Crop Science, Faculty of Agricultural Science and Forestry, Universiti Putra Malaysia, Bintulu Sarawak Campus, Bintulu 97008, Malaysia
2
Institut Ekosains Borneo (IEB), Faculty of Agriculture and Forestry Sciences, Universiti Putra Malaysia, Bintulu Sarawak Campus, Bintulu 97008, Malaysia
3
Institute of Tropical Agriculture, Universiti Putra Malaysia (ITAFoS), Serdang 43400, Malaysia
4
Faculty of Sustainable Agriculture, Universiti Malaysia Sabah, Sandakan Campus, Sandakan 90509, Malaysia
*
Author to whom correspondence should be addressed.
Agronomy 2021, 11(11), 2223; https://doi.org/10.3390/agronomy11112223
Submission received: 1 August 2021 / Revised: 16 September 2021 / Accepted: 23 September 2021 / Published: 2 November 2021
(This article belongs to the Section Soil and Plant Nutrition)

Abstract

:
Soil-available P for crop use is limited because of fixation reaction and loss of organic matter through erosion and surface runoff. These factors cause an imbalance between inputs and outputs of P nutrients in acid soils. Several approaches to improve P availability have been proposed, however, little is known about the effectiveness of amending humid mineral acid soils with charcoal and sago bark ash on P dynamics. Thus, pH buffering capacity and leaching studies were conducted to determine: (i) pH buffering capacity upon application of charcoal and sago bark ash and (ii) the influence of charcoal and sago bark ash on P leaching in acid soils. pH buffering capacity was calculated as the negative reciprocal of the slope of the linear regression (pH versus acid addition rate). A leaching study was carried out by spraying distilled water to each container with soil such that leachates through leaching were collected for analysis. The ascending order of the treatments based on their pH buffering capacity and regression coefficient (R2) were soil alone (0.25 mol H+ kg−1 sample), soil with charcoal (0.26 mol H+ kg−1 sample), soil with sago bark ash (0.28 mol H+ kg−1 sample), charcoal alone (0.29 mol H+ kg−1 sample), soil with charcoal and sago bark ash (0.29 mol H+ kg−1 sample), and sago bark ash alone (0.34 mol H+ kg−1 sample). Improvement in the soil pH buffering capacity was partly related to the inherent K, Ca, Mg, and Na contents of charcoal and sago bark ash. In the leaching study, it was noticed that as the rate of sago bark ash decreased, the pH of leachate decreased, suggesting that unlike charcoal the sago bark ash has significant impact on the alkalinity of leachate. Soil exchangeable acidity, Al3+, and H+ reduced significantly following co-application of charcoal and sago bark ash with ERP. This could be attributed to the neutralizing effects of sago bark ash and the high affinity of charcoal for Al and Fe ions. The amount of P leached from the soil with 100% charcoal was lower because charcoal has the ability to capture and hold P-rich water. The findings of this present study suggest that combined use of charcoal and sago bark ash have the potential to mitigate soil acidity and Al toxicity besides improving soil pH buffering capacity and minimizing P leaching. A field trial to consolidate the findings of this work is recommended.

1. Introduction

Phosphorus is one of the essential elements for plant growth and development, although the amount of plant-available P in the humid tropic mineral acid soils is often below plant requirements. Limited availability of P is related to the conversion of soluble P into unavailable forms in the soil, a phenomenon commonly referred as P fixation [1,2]. In acidic soils, P is likely to be adsorbed by Al or Fe oxides and hydroxides such as gibbsite, hematite, and goethite [3]. Phosphorus sorption is governed mainly by the clay mineralogy of soils along with the degree of crystallinity and surface area of the oxides present in soils [4,5]. In alkaline soils, the mechanism of P sorption is dominated by the reaction with CaCO3 to form Ca-P minerals [6]. Pant et al. [7] discovered that Ca-P is only available around neutral pH by forming mono and dicalcium phosphate. Alteration of soil pH controls P retention in soils by adsorption and precipitation reactions of P with Fe and Al oxides, clay minerals, and CaCO3. Thus, soil pH is directly related to the availability of P because it affects the solubility of the compounds holding P. Penn and Camberato [8] suggested that a pH range of 6.5 to 7.0 generally maximizes P availability because there is minimal fixation reaction.
Soil acidification has been a long-term concern for soil scientists and agronomists because it is a serious land-degradation process in many parts of the world [9]. According to Graham and Vance [10], it is estimated that acidification has affected approximately 1.5 billion hectares worldwide. Soil acidification results in toxicities of Al, Mn, and Fe and often occur simultaneously with deficiencies in P, Ca, Mg, and K, leading to poor fertility with overall decrease in soil health [11]. Traditionally, liming is the most common management practice used to neutralize soil acidity. However, it is uneconomical because in some developing countries, most farmers are not able to afford lime. Moreover, the effects of liming on soil pH alteration are temporary and this explains why liming is repeated in the following cropping seasons. In view of this, well buffered soils following organic amendment application have been reported to resist the acidifying effects [12,13]. High cation exchange capacity (CEC) of organic amendments increases soil buffering capacity because in soils with high CEC, more reserve and exchangeable acidity are neutralized [14]. Organic matter buffering originates from weakly acidic functional groups such as carboxylic and phenolic groups that are deprotonated when base is added and accept protons from acidic inputs or when acidity is generated internally by soil processes [15]. Soil pH buffering capacity is governed by dissolution of carbonates, complexation or decomplexation of Al by organic matter, and ion exchange [16].
In agricultural systems, fertilizer mismanagement such as excessive use of P fertilizers induce eutrophication, a process which causes low oxygen concentrations (hypoxia) or total depletion of oxygen (anoxia) in water bodies [17]. When P accumulates in soils in response to excessive fertilizer, P becomes susceptible to transport via surface runoff and subsurface leaching [18,19]. This situation augments timely P fertilizer application to withstand intensive rainfall in the humid tropics [20]. The amount of soluble P leaving an agricultural system is dependent on the level of saturation of the soil sorption sites [21]. With larger levels of saturation, there is less potential P sorption. Moreover, P leaching can be affected by the presence or absence of preferential flow pathways, commonly caused by plant roots, worm channels, and soil fissures, which often occur in clay-textured soils [22,23]. Generally, P leaching is related to low or no anion exchange capacity (AEC) of soils [24]. Electrostatic repulsion of negative charge sites on surfaces of soil colloid cause rapid movement of orthophosphates (negatively charged ions) thereby increasing their concentration in the soil water [25]. Organic amendments have been suggested to reduce nutrient mobility in soils to prevent leaching and runoff losses. The addition of organic matter with wide C:P ratios along with the application of P reduce the amount of P loss by creating more sorption sites [26]. Studies by Ch’ng et al. [27] and Asap et al. [28] demonstrated that compost and biochar can improve soil AEC, thereby minimizing P losses to waterways. Furthermore, humic substances such as humic acids, fulvic acids, and humin released during mineralization of organic matter are capable of holding water seven times their volume, which is even greater than the water holding capacity of clays [29,30].
Although considerable effort has been placed on identifying effective management practices that can improve pH buffering capacity and minimize P transport from agricultural systems to surface waters, the influences of charcoal and sago bark ash on pH buffering capacity and P retention in acid soils remain largely unexplored. Thus, it was hypothesized that combining charcoal and sago bark ash with Egypt rock phosphate (ERP) will enhance P availability by increasing soil pH in addition to reducing the amount of P leached. The pH buffering capacity and leaching studies were conducted in an attempt to answer the question of whether amending charcoal and sago bark ash can significantly improve pH buffering capacity in addition to reduce P leaching of highly weathered acid soils. It is believed that co-application of these two amendments complement each other in the best way possible. For example, addition of charcoal to the soil could improve the CO2 sequestration potential, enhance mineralization, and increase the retention of N and P nutrients in soils, thereby decreasing water pollution risk. Although sago bark ash cannot contribute to the increase in soil C, it can supply a considerable amount of plant nutrients such as P, Ca, K, and Mg. Besides, the increase in soil pH following application of ash could deprotonate functional groups of charcoal, resulting in the formation of negatively charged sites that are able to bind cations. The implications of including charcoal and sago bark ash as soil amendments in agriculture are to reduce the use of chemical fertilizers and reliance on commercial lime. In situations where fertilizers and lime are used sparingly because of logistic or economic constraints, the use of charcoal and sago bark ash could play a dual role as both fertilizer and lime. Alkalinity of amendments will give a good indication of their potential liming ability. Thus, the objectives of these present studies were to determine: (i) ability of charcoal and sago bark ash to resist the changes in soil pH of a mineral acid soil and (ii) retention and leaching of ERP as affected by co-application of charcoal and sago bark ash.

2. Materials and Methods

2.1. Soil Sampling and Selected Physico-Chemical Analyses

The soil used for the pH buffering capacity and leaching studies was Bekenu Series (Typic Paleudults). This soil series was selected because it is commonly cultivated with different crops in Malaysia, although it is characterized by high P fixation because of the high contents of Al and Fe, besides being acidic. The soil was randomly sampled at 0–20 cm depth from an uncultivated secondary forest at Universiti Putra Malaysia Bintulu Sarawak Campus (UPMKB) on the geographical coordinates of 3°12′20″ N, 113°04′20″ E. The area has an elevation of 27.3 m, an annual rainfall of 2993 mm, a mean temperature of 27 °C, and relative humidity of approximately 80%. Thereafter, the soil samples were air-dried, crushed, and sieved to pass through a 2 mm sieve to remove twigs, plant roots, and ironstone concretions. Afterwards, the soil samples were bulked and used subsequently for pH buffering capacity determination and leaching experiments.
The soil was analyzed for soil bulk density using the coring method [31]. Soil texture was determined using the hydrometer method [32]. Soil pH in water and KCl and electrical conductivity (EC) were determined in a 1:2.5 (soil:distilled water/KCl) using a digital pH meter and EC meter [33]. Soil pH in water represents acidity of the soil solution, whereas soil pH in KCl indicates the acidity of the soil solution, plus the reserve acidity of the soil colloids. Soil total carbon was calculated as 58% of the organic matter determined using the loss on ignition method [34]. Total N was determined using the Kjeldahl method [35]. The soil cation exchange capacity (CEC) was determined using the leaching method [36] followed by steam distillation [35]. Soil exchangeable acidity, H+, and Al3+ were determined using the acid-base titration method [37].
Soil total P was extracted using the aqua regia method [38]. Aqua regia solution was prepared by mixing concentrated HCl and concentrated HNO3 in a ratio of 3:1. Then, 2 g of soil was weighed into a 250 mL conical flask, after which 20 mL of aqua regia solution was added. Thereafter, the suspension was heated on a hot plate until the solution turned clear. The suspension was filtered into a 100 mL volumetric flask and made to volume with distilled water. Soil-available P and exchangeable cations (K+, Ca2+, Mg2+, Na+, Mn2+, and Fe2+) were extracted using Mehlich No.1 Double Acid method [39]. Double acid solution (mixture of 0.05 M HCl and 0.025 M H2SO4) was prepared by mixing 4.12 mL of concentrated HCl with 1.40 mL of concentrated H2SO4 in a 1000 mL volumetric flask and made to volume with distilled water. Then, 5 g of soil was weighed and placed into a plastic vial, after which 20 mL of double acid solution was added. Afterwards, the suspension was shaken at 180 rpm for 10 min. The suspension was filtered into a plastic vial using filter paper.
Soil total P and available P were determined using UV-VIS Spectrophotometer (Perkin Elmer Lambda 25, Waltham, MA, USA) at 882 nm wavelength after blue color was developed following the molybdenum blue method described by Murphy and Riley [40]. Acid molybdate stock solution (Reagent A) and ascorbic acid stock solution (Reagent B) were prepared for the blue color development procedure. A standard P solution (standard solution 1) and a standard solution 2 were prepared and used as working solutions ranging from 0 to 0.6 ppm. A 1 to 6 mL of standard solution 2 was pipetted into a 50 mL volumetric flask containing 8 mL of Reagent B and diluted to the volume with distilled water. Therefrom, 8 mL of Reagent B was pipetted into a different 50 mL volumetric flask, after which the sample was added depending on the intensity of the blue color to be developed. The solution was diluted to mark with distilled water. Soil exchangeable cations were determined using Atomic Absorption Spectrometry (AAS) (Analyst 800, Perkin Elmer, Norwalk, CT, USA). The physico-chemical properties of the soil used in pH buffering capacity and leaching studies were within the range reported by Paramananthan [41], except for soil texture. The selected physico-chemical properties of the soil are summarized in Table 1.

2.2. Characterization of Charcoal and Sago Bark Ash

The charcoal used in this present study was obtained from Pertama Ferroalloys Sdn Bhd, Bintulu, Sarawak, Malaysia, whereas the sago bark ash was purchased from Song Ngeng Sago Industries, Dalat, Sarawak, Malaysia. Afterwards, the amendments were analyzed for pH in water and in KCl, EC [33], available P [39,40], and exchangeable K+, Ca2+, Mg2+, Na+, and Fe2+ [39]. The results of these analyses are presented in Table 2.

2.3. pH Buffering Capacity Determination

pH buffering capacity study was carried out in the Soil Science Laboratory of UPMKB. Prior to pH buffering capacity determination, 300 g of soil (from the 2 mm bulked soil sample) was mixed thoroughly with charcoal and sago bark ash in a container according to the treatment evaluated. Amounts of the amendments used were deduced from the literature (charcoal [42,43] and sago bark ash [44,45,46]), where 10 and 5 t ha−1 is equivalent to 15.42 and 7.71 g, respectively, in the 300 g of soil per container. Treatments tested in this study are as follows:
T1:
Soil only
T2:
Charcoal only
T3:
TSago bark ash only
T4:
300 g soil + 15.42 g charcoal
T5:
300 g soil + 7.71 g sago bark ash
T6:
300 g soil + 15.42 g charcoal + 7.71 g sago bark ash
The pH buffering capacity was determined using the titration method developed by Costello and Sullivan [47]. A 5 g of sample of each treatment was weighed into 100 mL plastic vials. From there, 0.25 M H2SO4 was added to the sample at rates of 0, 1, 2, 3, 4, 5, 6, 7, 8, 9, and 10 mL (1 mL = 0.1 mol H+ kg−1 sample). A separate plastic vial was used for each acid addition rate, after which a sufficient amount of distilled water was added to bring the total liquid addition to 50 mL (1:10 sample:distilled water) (For example, if 1 mL of 0.25 M H2SO4 was added, then 49 mL of distilled water was added). The suspension was stirred thoroughly for 10 s after acid addition and equilibrated for 72 h at room temperature (26 °C). Prior to pH measurement at 72 h, the suspension was stirred again for another 10 s. The pH measurement was done using a digital pH meter (SevenEasy pH, Mettler-Toledo GmbH, Greifensee, Switzerland). The pH buffering capacity of the sample or the quantity of acidity needed to reduce pH by one unit was calculated as the negative reciprocal of the slope of the linear regression, sample pH (Y-axis) versus acid addition rate (X-axis):
pH buffering capacity (mol H+ kg−1 sample) = −(1/slope)
where slope is the fitted slope of linear regression line for each sample.

2.4. Laboratory Leaching Experiment

A laboratory leaching study was also conducted in the Soil Science Laboratory of UPMKB. Extracting from the bulked 2 mm soil sample, 1 kg of soil was filled in a polypropylene container. The bottom of the polypropylene container was perforated and covered with filter paper. Charcoal and sago bark ash were mixed thoroughly with soil before commencing the leaching experiment. The samples were moistened to 60% of field capacity and left overnight to equilibrate. Thereafter, Egypt rock phosphate (ERP) was surface applied, after which 250 mL of distilled water was sprayed to each container with soil for first leaching. The first leachates were collected on day five for determination of pH, EC, and amount of P in the leachate. Afterwards, 250 mL of distilled water was sprayed to each container with soil for second leaching and leachates were collected on day 10. The step was repeated at five days interval until the last leachates were collected on day 30. The volume and frequency of distilled water applied were based on the number of rainy days for 30 days from 10-year rainfall data obtained from Drainage and Irrigation Department, Bintulu Division, Sarawak, Malaysia. Soil samples were collected at 30 days of leaching, air-dried, and analyzed for pH, total carbon, exchangeable acidity, Al3+, H+, total P, and available P. Chemical properties of the leachates and soil samples were determined using standard procedures outlined previously in Section 2.1.
The recommended rate P fertilizer used was 60 kg P2O5 ha−1 (214 kg ha−1 ERP). This rate was based on the standard recommendation for maize (Zea mays L.) cultivation [48]. Maize was chosen as a test crop because of its sensitivity, which can reflect nutrient recovery, uptake, and efficiency, and rapid response towards nutrient deficiency. The rate of the fertilizers applied in the leaching study was scaled down to a per plant basis (based on planting density of 27,777 plants ha−1) which was equivalent to 7.7 g of ERP plant−1. Amounts of the charcoal and sago bark ash used were deduced from the literature, as mentioned in Section 2.3, where 10 t ha−1 and 5 t ha−1 were equivalent to 51.4 g and 25.7 g, respectively, for 1 kg of soil per container. The charcoal and sago bark ash rates varied by 25%, 50%, 75%, and 100%, whereas the ERP rate was fixed at 100% of the recommendation rate in all treatments except for S1 (no ERP applied). The treatments evaluated in this leaching study are summarized in Table 3.

2.5. Experimental Design and Statistical Analysis

The treatments were arranged in a completely randomized design (CRD) with three replications. Analysis of variance (ANOVA) was used to detect treatment effects, whereas treatments means were compared using Tukey’s Studentized Range (HSD) Test at p ≤ 0.05. PROC REG was used to test linear regression and to obtain coefficient of determination (R2) for each linear regression equation. The statistical software used was Statistical Analysis System (SAS) version 9.4.

3. Results and Discussion

3.1. pH Buffering Capacity of Soil, Charcoal, and Sago Bark Ash

The effects of soil alone (T1), charcoal alone (T2), sago bark ash alone (T3), soil with charcoal (T4), soil with sago bark ash (T5), and soil with charcoal and sago bark ash (T6) on pH buffering capacity are presented in Table 4. Regardless of treatment, there was a negative linear relationship between soil pH and acid added with the regression coefficients (R2) ≥ 0.90 (Figure 1). In comparison to their pH buffering capacity, the ascending order of the treatments was T1, T4, T5, T2, T6, and T3. Among the treatments, soil alone demonstrated the lowest pH buffering capacity. This is because highly weathered tropical acid soils generally have low pH buffering capacity and are therefore sensitive to acidification. Besides, the pH buffering capacity mainly depends on the CEC and C content [49,50]. Xu et al. [51] opined that soils with greater CEC are rich in cation exchange sites to attract H+, in addition to buffering input of acid to soils. The results agree with a study by Jusop and Ishak [52] which revealed that acid soils are relatively less fertile, and they also have low CEC (<16 cmol/kg clay). Charcoal alone (T2) and the soil with charcoal (T4) demonstrated slightly higher pH buffering capacity compared with soil alone (T1) because these treatments have high organic matter content. Soil pH buffering capacity is believed to increase with application of organic amendments. Protonation or deprotonation is the main mechanism for the organic matter contribution to soil pH buffering capacity [51]. The carboxyl and phenolic hydroxyl of organic matter adsorbs protons with decreasing pH and the opposite is true for releasing protons with increasing pH.
The highest pH buffering capacity of sago bark ash alone (T3) was associated with the alkalinity and neutralizing compounds present in this amendment. Release of base cations from the sago bark ash played a major role in proton consumption by the sago bark ash. However, when the sago bark ash was mixed with soils (T5), the pH buffering capacity declined but remained higher than the soil without any amendment (T1). This is because in the former treatment (T3), the source of acidity was solely the acid added, which was H2SO4, whereas in the latter treatment (T5) the acidity was contributed by both H2SO4 and the soil itself. Although the pH buffering capacity of T2 and T6 were similar (0.29 mol H+ kg−1 sample), T6 demonstrated a better relationship because the R2 was 0.92. In addition, T6 described the pH buffering capacity with the presence of soils, whereas T2 only evaluated the ability of charcoal (without soil) in resisting the changes in pH. The increase in pH buffering capacity by the combination of charcoal, sago bark ash, and soil (T6) suggests that the base cations released from the sago bark ash were mainly because of the dissolution of carbonate and the release of exchangeable base cations adsorbed on negative charge sites from the dissociation of the oxygen-containing functional groups on the charcoal [53].

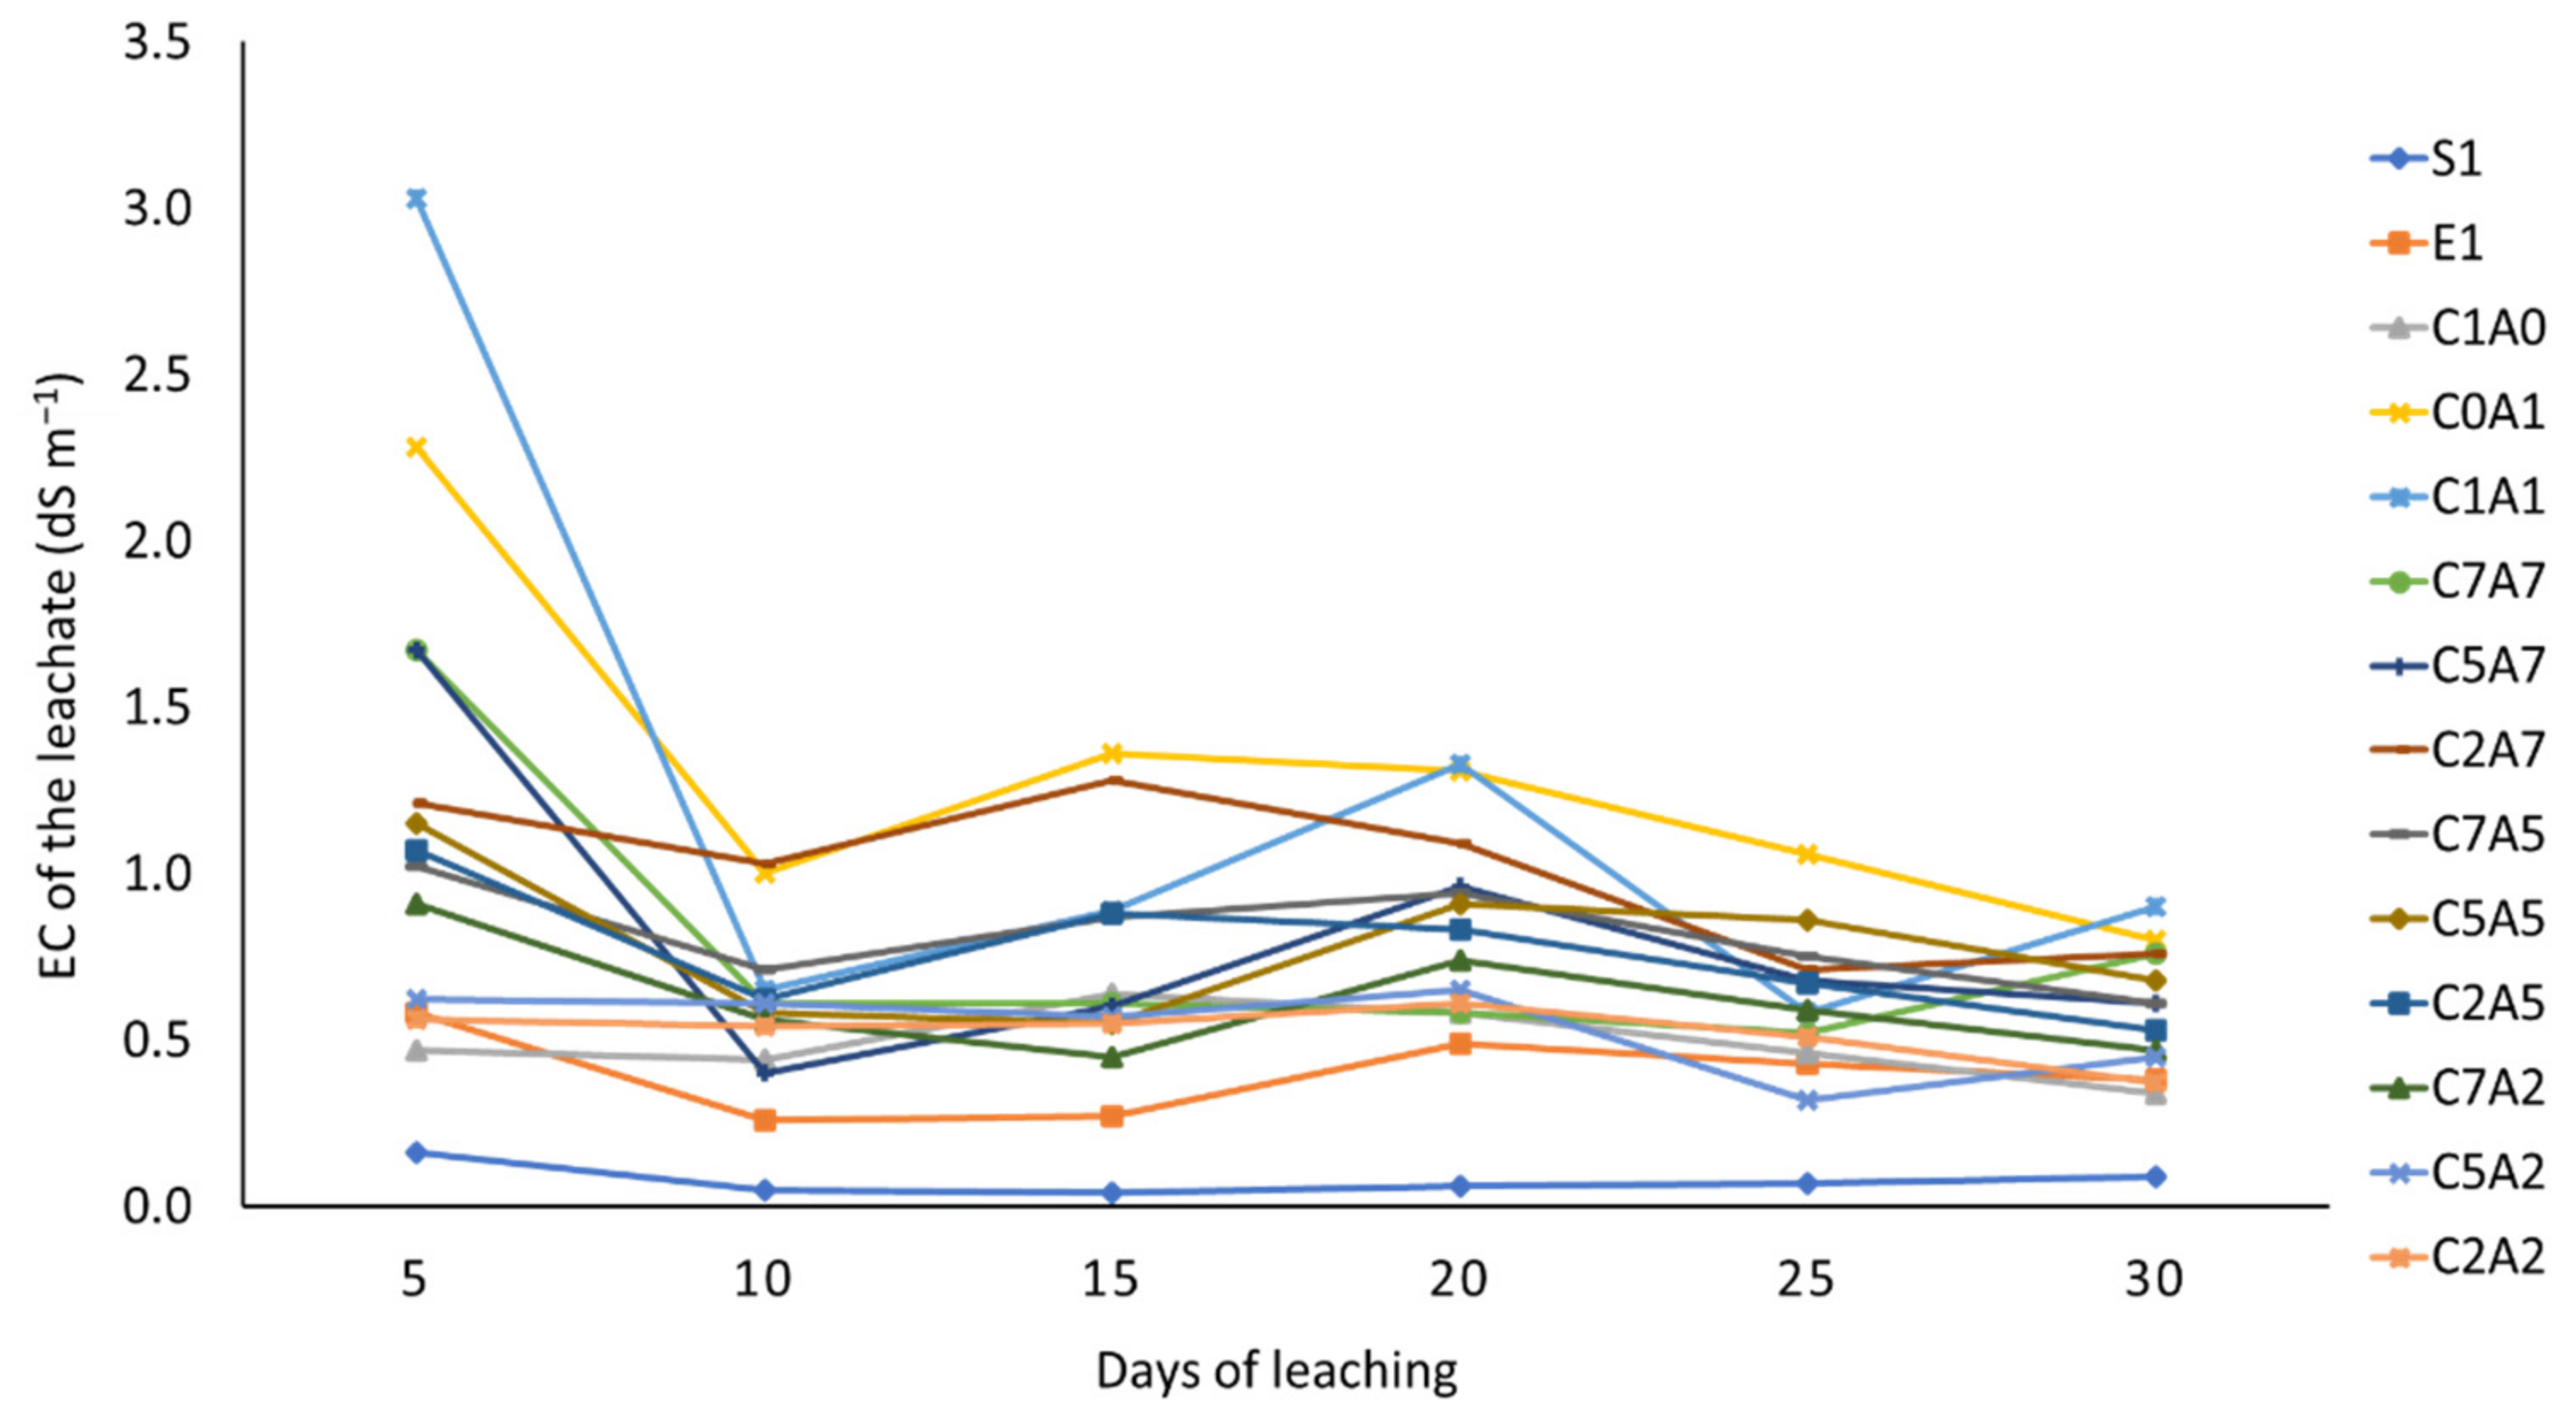
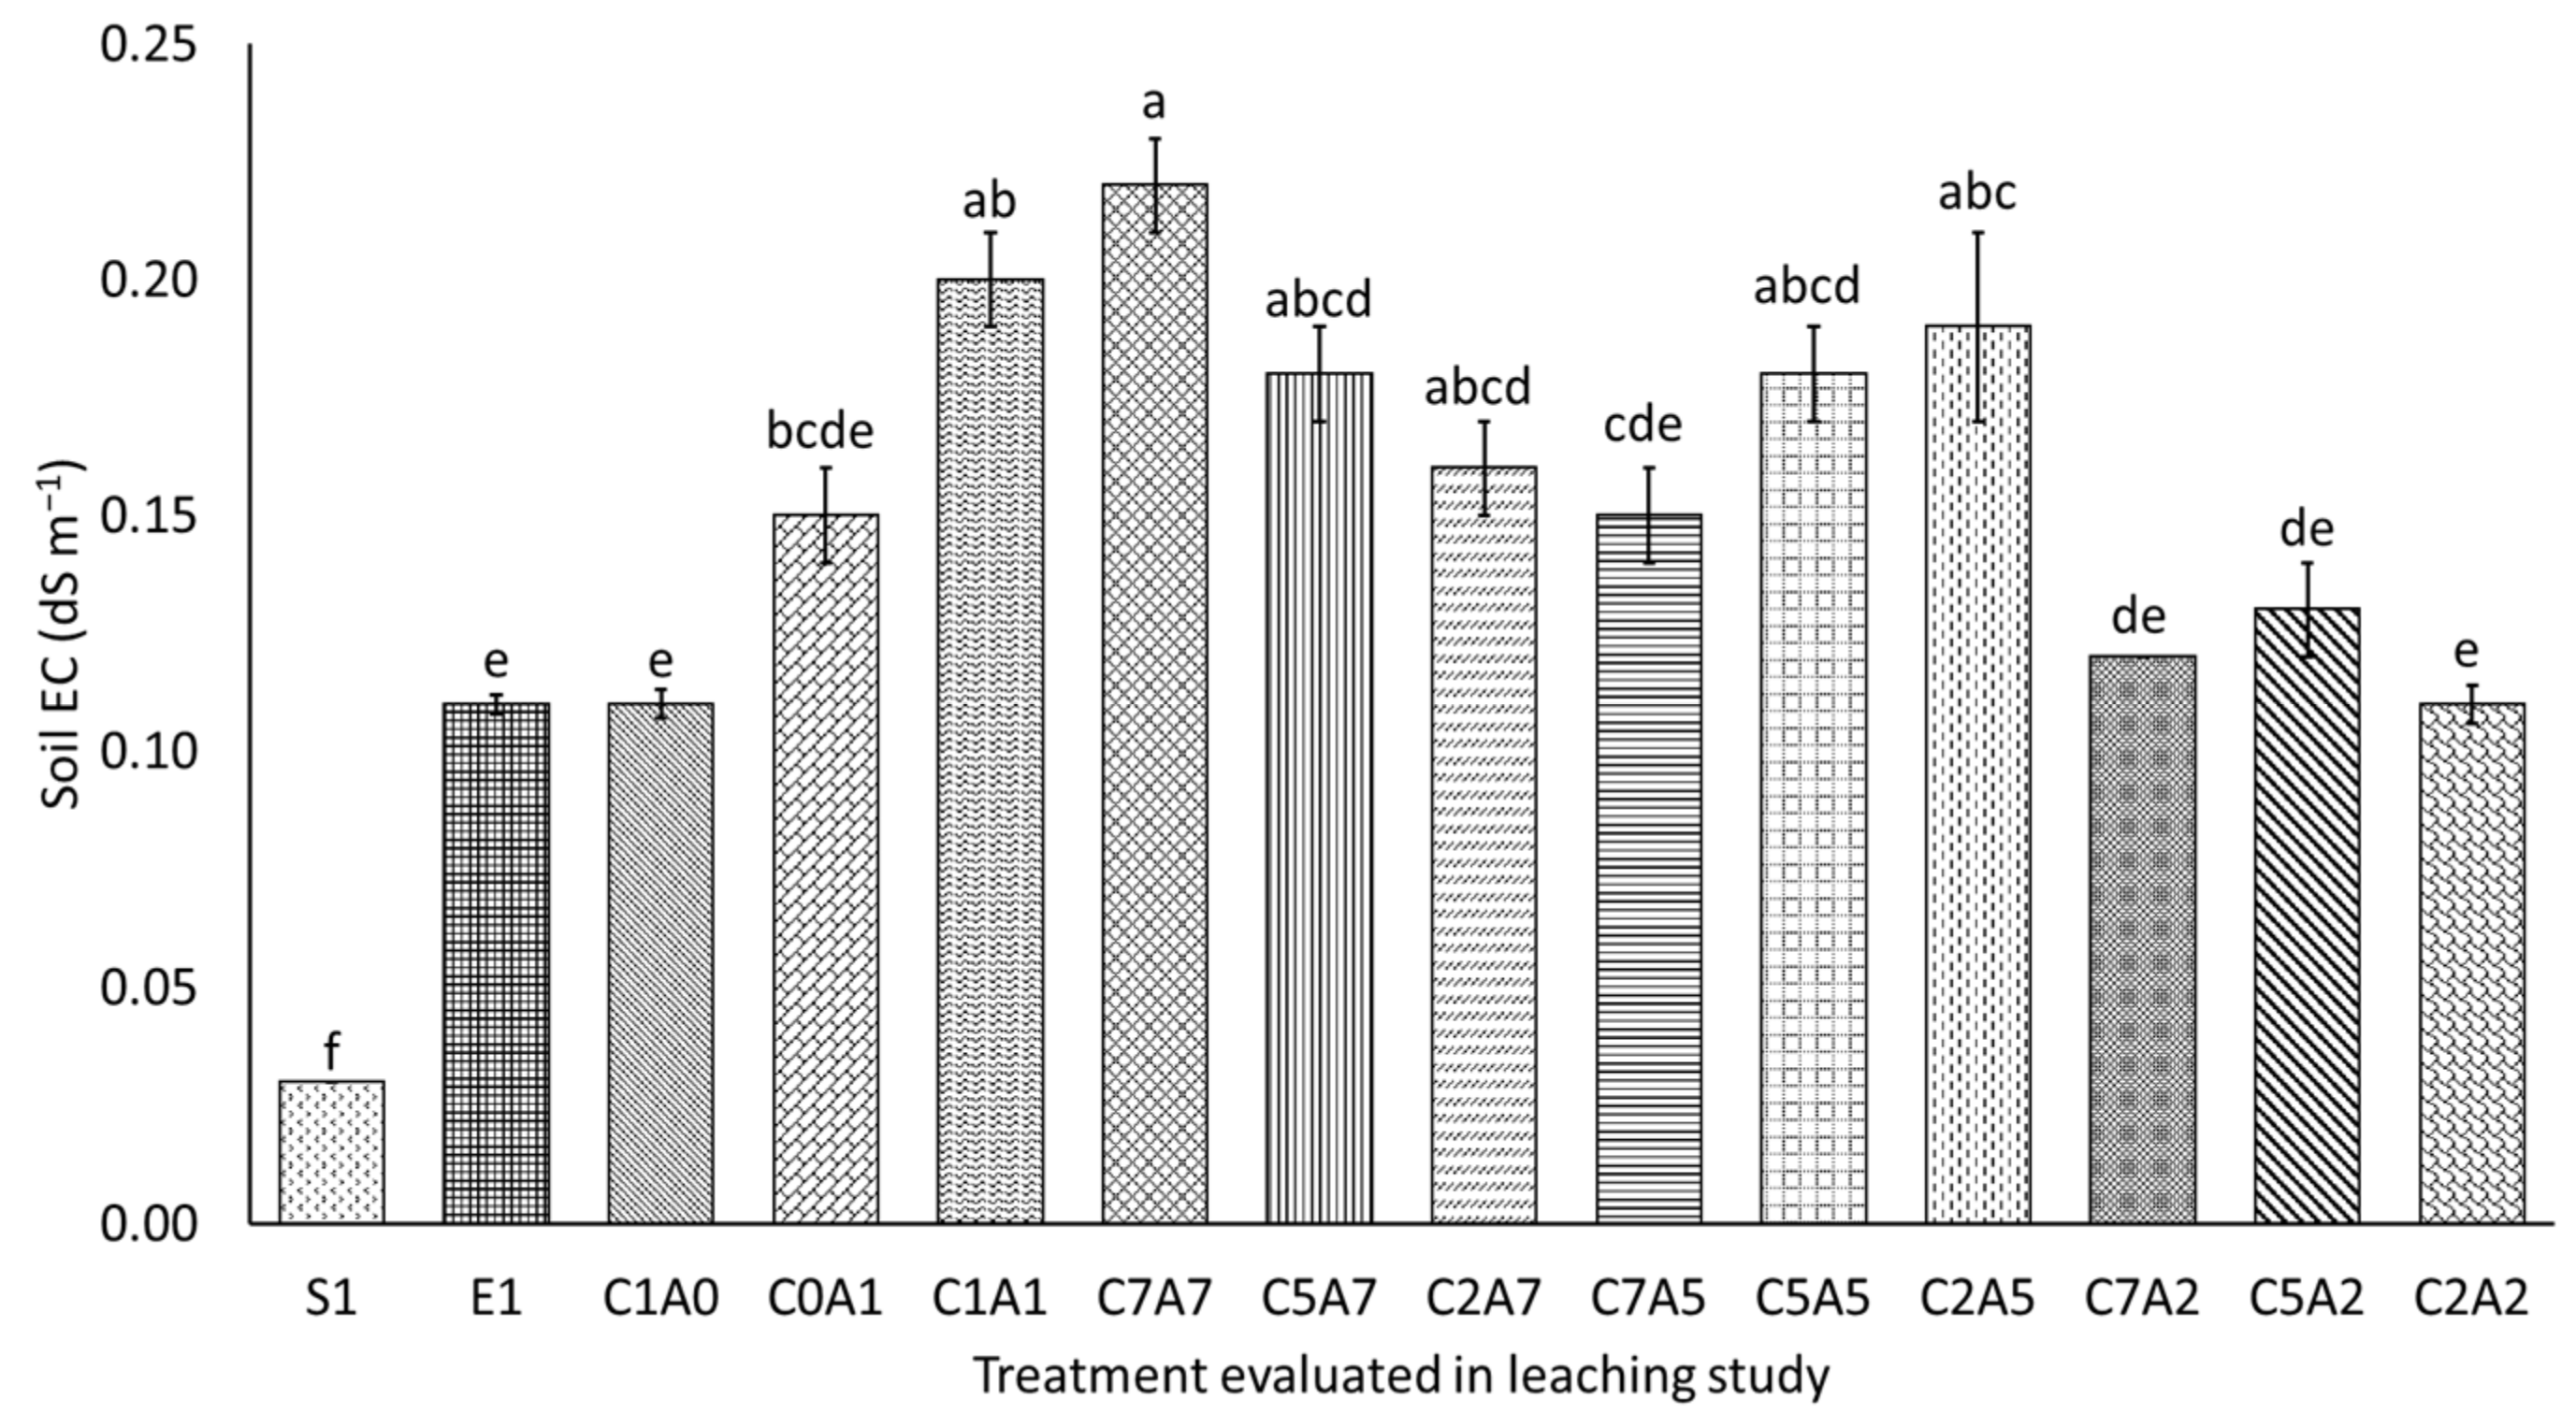
3.2. Treatments on pH and Electrical Conductivity of Leachate over Thirty Days of Leaching

Effects of the treatments on the pH of leachates over 30 days of leaching are presented in Figure 2. Leachate of soil alone (S1) recorded the lowest pH throughout the leaching study. This is possible because of the acidic nature of the soil (Table 1) and no ERP in S1. Application of ERP can contribute to the increase in pH because the dissolution of apatite in rock phosphates consumes H+ ions. pH of C0A1 leachate (soil with 100% sago bark ash) was the highest, followed by leachate C1A1 (soil with combination of 100% charcoal and 100% sago bark ash). The high pH of these two leachates is attributed to Ca and Mg carbonates in the sago bark ash, which qualifies the ash as a liming material. Upon application of ash, change in pH is rapid compared with lime because of the rapidly soluble content of oxides or hydroxides of Ca and Mg of the ash [54]. It was noticed that as the rate of sago bark ash decreased, the pH of leachate decreased. This finding implies that, unlike charcoal, sago bark ash has a significant impact on the alkalinity of leachate, and this is consistent with the higher pH of sago bark ash compared with charcoal (Table 2). pH of the leachates increased after day 10, but after day 15 pH of the leachates decreased, except for E1. The fluctuation of the pH of the leachates might be because of the nonuniformity in the movement of water through the soil during leaching.
Figure 3 reveals that electrical conductivity (EC) of the leachates decreased after day 5, with soil alone (S1) having the lowest EC. The decrease in EC of the leachates showed that continued leaching removed excessive soluble salts from the soil. High soluble salts may cause soil salinity and when Na becomes dominant, saline soils can become sodic. Leachate of the soil with the combination of charcoal and sago bark ash at the rate of 100% (C1A1) demonstrated the highest EC on day 5, followed by C0A1, C7A7, C5A7, and C2A7. The trend suggests that EC of the leachates decreased when the rate of sago bark ash was reduced from 100% to 75%, 50%, and 25%. These observations were consistent with those reported by Bang-Andreasen et al. [55], Demeyer et al. [56], and Arvidsson and Lundkvist [57], who reported a significant correlation between soil pH and EC and the amount of ash applied. In addition, Lim et al. [58] demonstrated that mixing soil with fly ash increased the pH and EC from 5.9 to 7.8 and 0.08 to 0.31 dS m−1, respectively, when the mixing rate was increased from 0 to 15%.

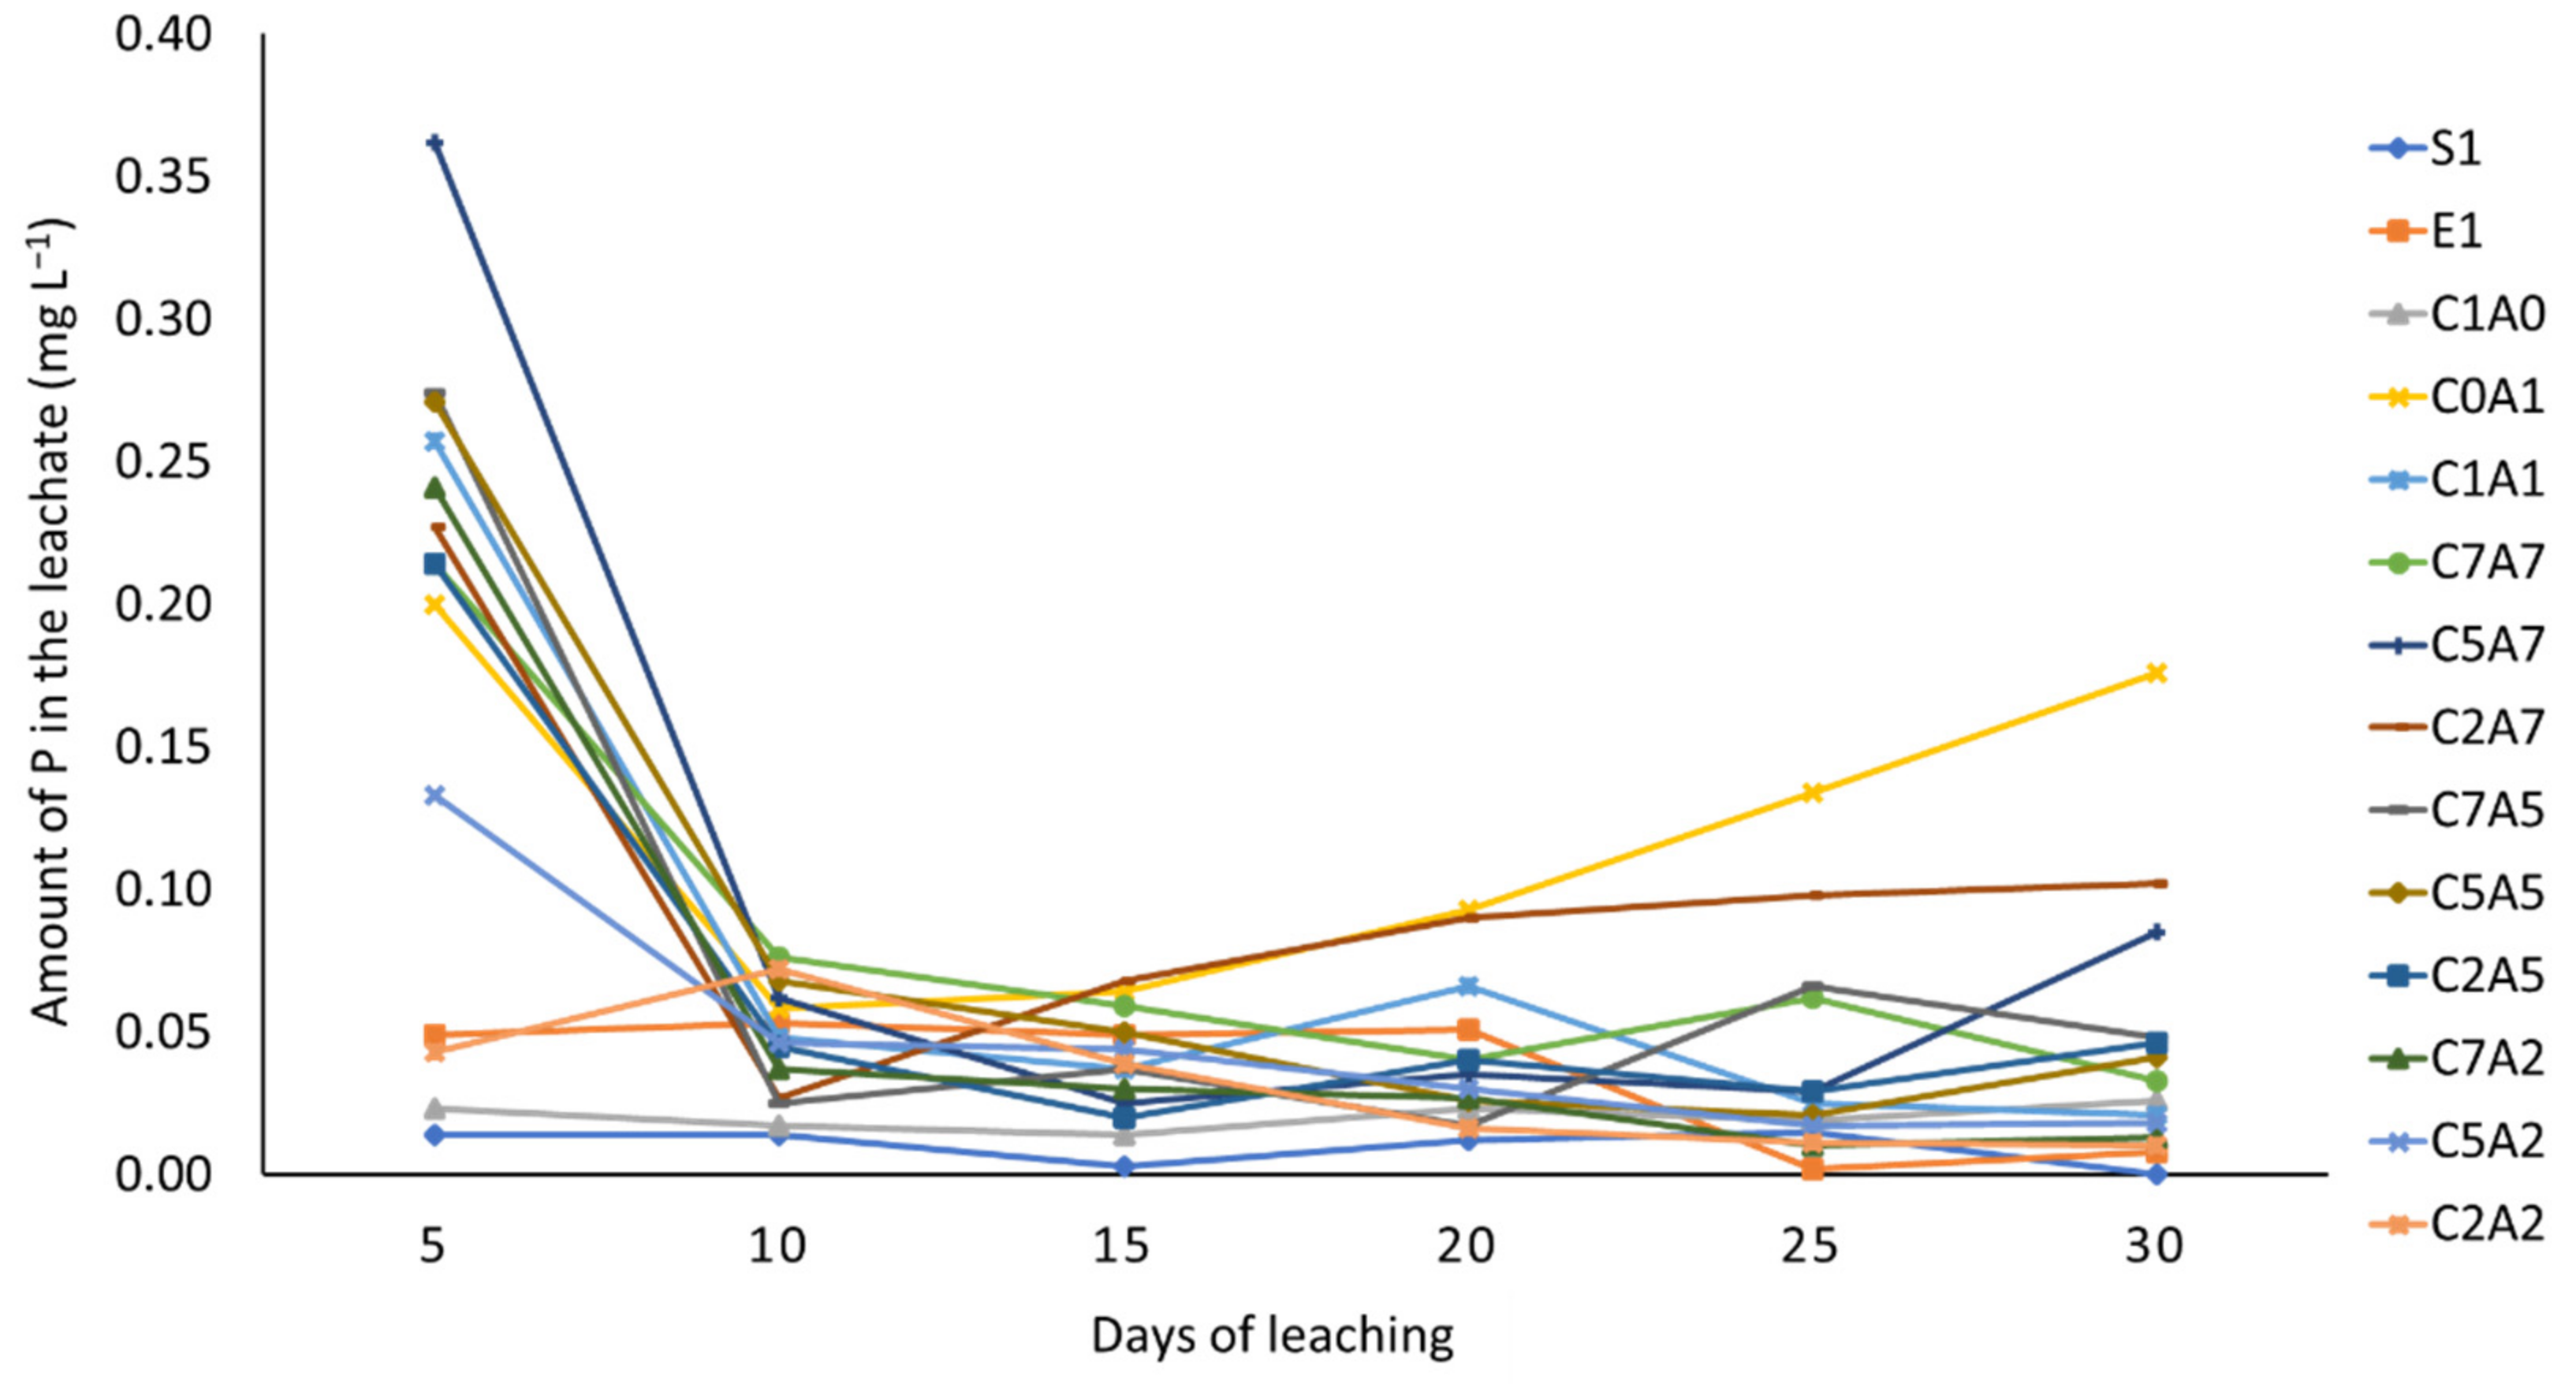
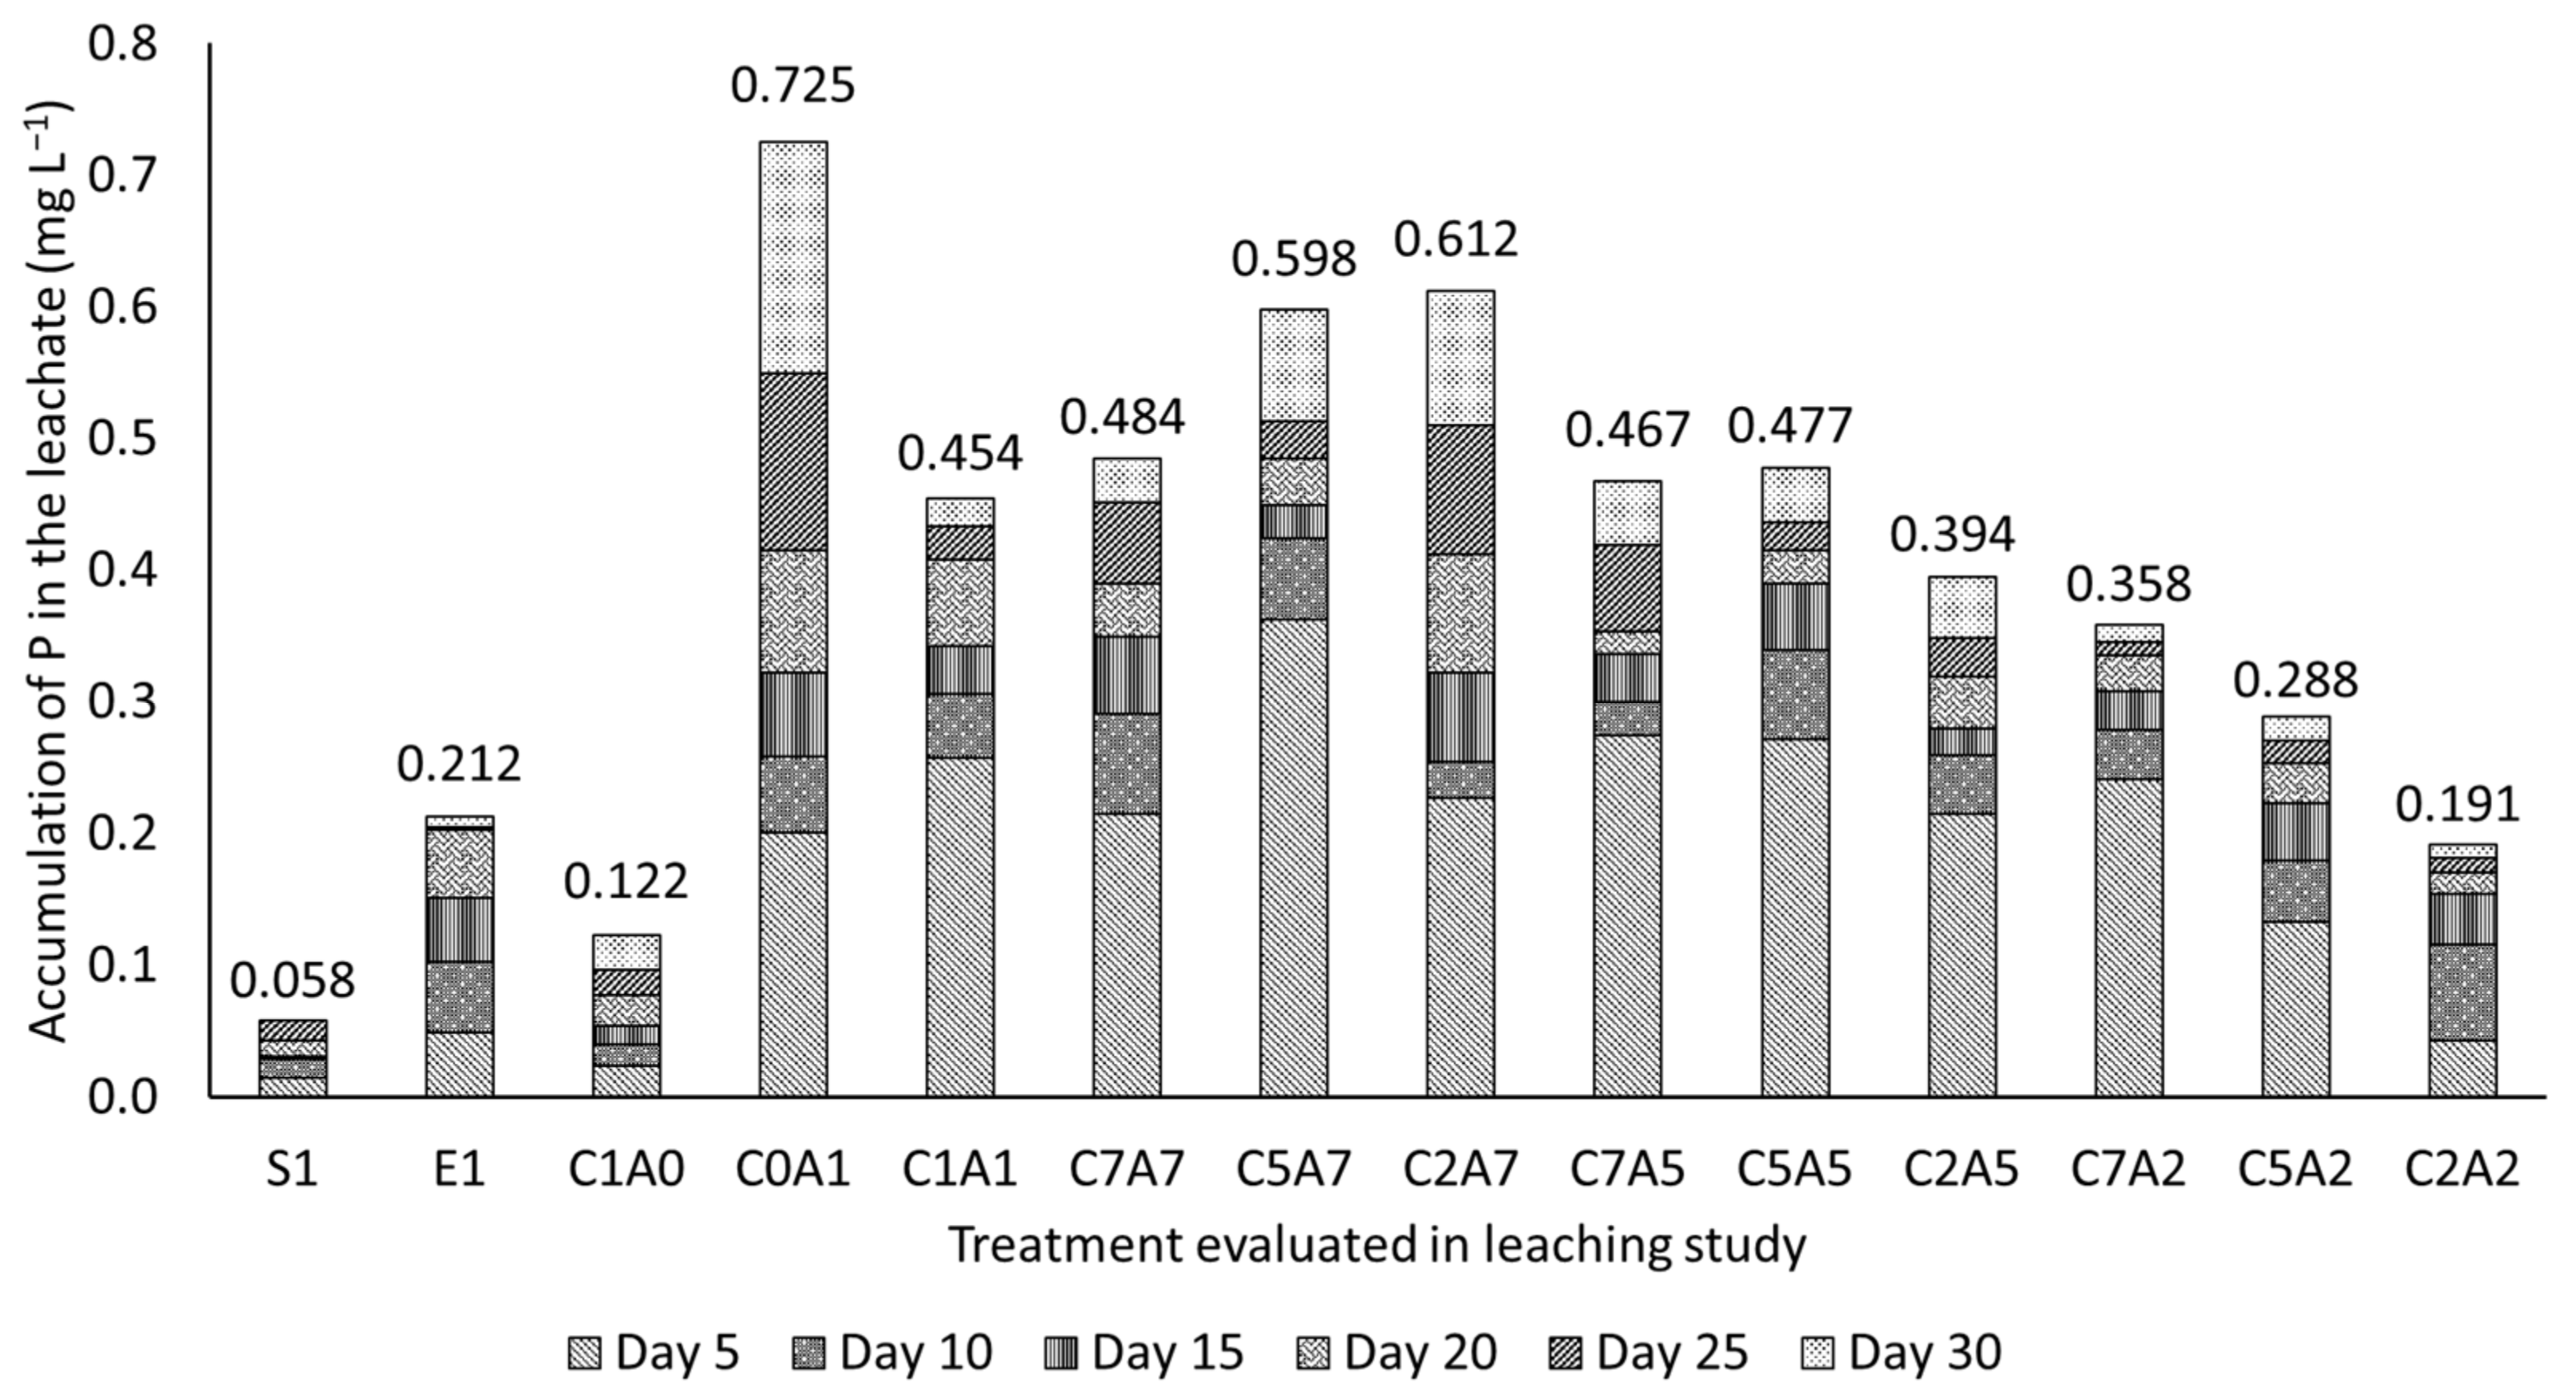
3.3. Effects of Treatments on Phosphorus Availability in Leachate

The P concentrations in the leachates are presented in Figure 4. The amount of P leached from soil alone (S1) was the lowest compared with other treatments because ERP was not applied to the soil. Treatment with ERP alone (E1) had an almost consistent amount of P leached until day 20, but gradually decreased towards the end of the leaching study. This suggests that ERP dissolved slowly to supply P steadily to plants compared with acidulated rock phosphate which dissolves rapidly, and its P might be significantly leached within a short period. After day 5, the concentration of P in the leachates decreased, however, after day 10, an increase in the amounts of P leached were noticed in C0A1 and C2A7. This is partly related to the amounts of charcoal present in those treatments, where in C0A1 there was no application of charcoal, whereas, in C2A7, the amount of charcoal was only 25% of the recommended rate. The increase in the concentration of P loss from C0A1 after day 10 was due to the inherent P contents of the sago bark ash (Table 2). Phosphorus in the leachate of C1A0 (soil with 100% charcoal) was lower because charcoal has the ability to capture and hold P-rich water, preventing it from leaching out. This effect is related to the large internal surface area of the charcoal and the high number of residual pores, where water is retained by capillarity [59,60]. Besides, reduced soil P loss after charcoal addition could be ascribed to the strong adsorption of phosphate by charcoal [61,62,63]. Although C1A1 had 100% charcoal, which can temporarily hold P, the slightly higher in the amount of P leached from this treatment compared with C1A0 could be because of the water-saturated state of charcoal’s pores. This is possible because for C1A1, the leached P may have come from two sources—ERP and sago bark ash—whereas in C1A0, the P leached might have come from ERP only. Having soil P above optimal levels increases the risk of leaching [64].
The cumulative concentration of P leached over 30 days was highest for C0A1 and the lowest for S1 (Figure 5). The lower amount of P leached from E1 is associated with the low dissolution of calcium phosphate, fixation, and precipitation of P in the soil [65]. The results further reveal that the amount of P leached increased when sago bark ash was applied to the soil, regardless of the rate. Besides, the leaching of P was minimum when charcoal alone was used as soil amendment. However, because of its limitation in terms of alkalinity, combining charcoal and sago bark ash could be a better option. The soil with 50% charcoal and 75% sago bark ash (C5A7) had the highest amount of P leached in the first leachate, followed by the treatment with combination of 75% charcoal and 75% sago bark ash (C7A7) in the second leachate, the soil incorporated with 25% charcoal and 75% sago bark ash (C2A7) in the third leachate, and soil with sago bark ash alone (C0A1) in the fourth, fifth, and sixth leachates. These findings indicate that the use of 75% and 100% sago bark ash provides high concentration of readily soluble P. However, because in this leaching study the soil was amended with charcoal and sago bark ash in a closed system without plants, the effects of plant uptake of P were absent, resulting in a substantial amount of P being leached.

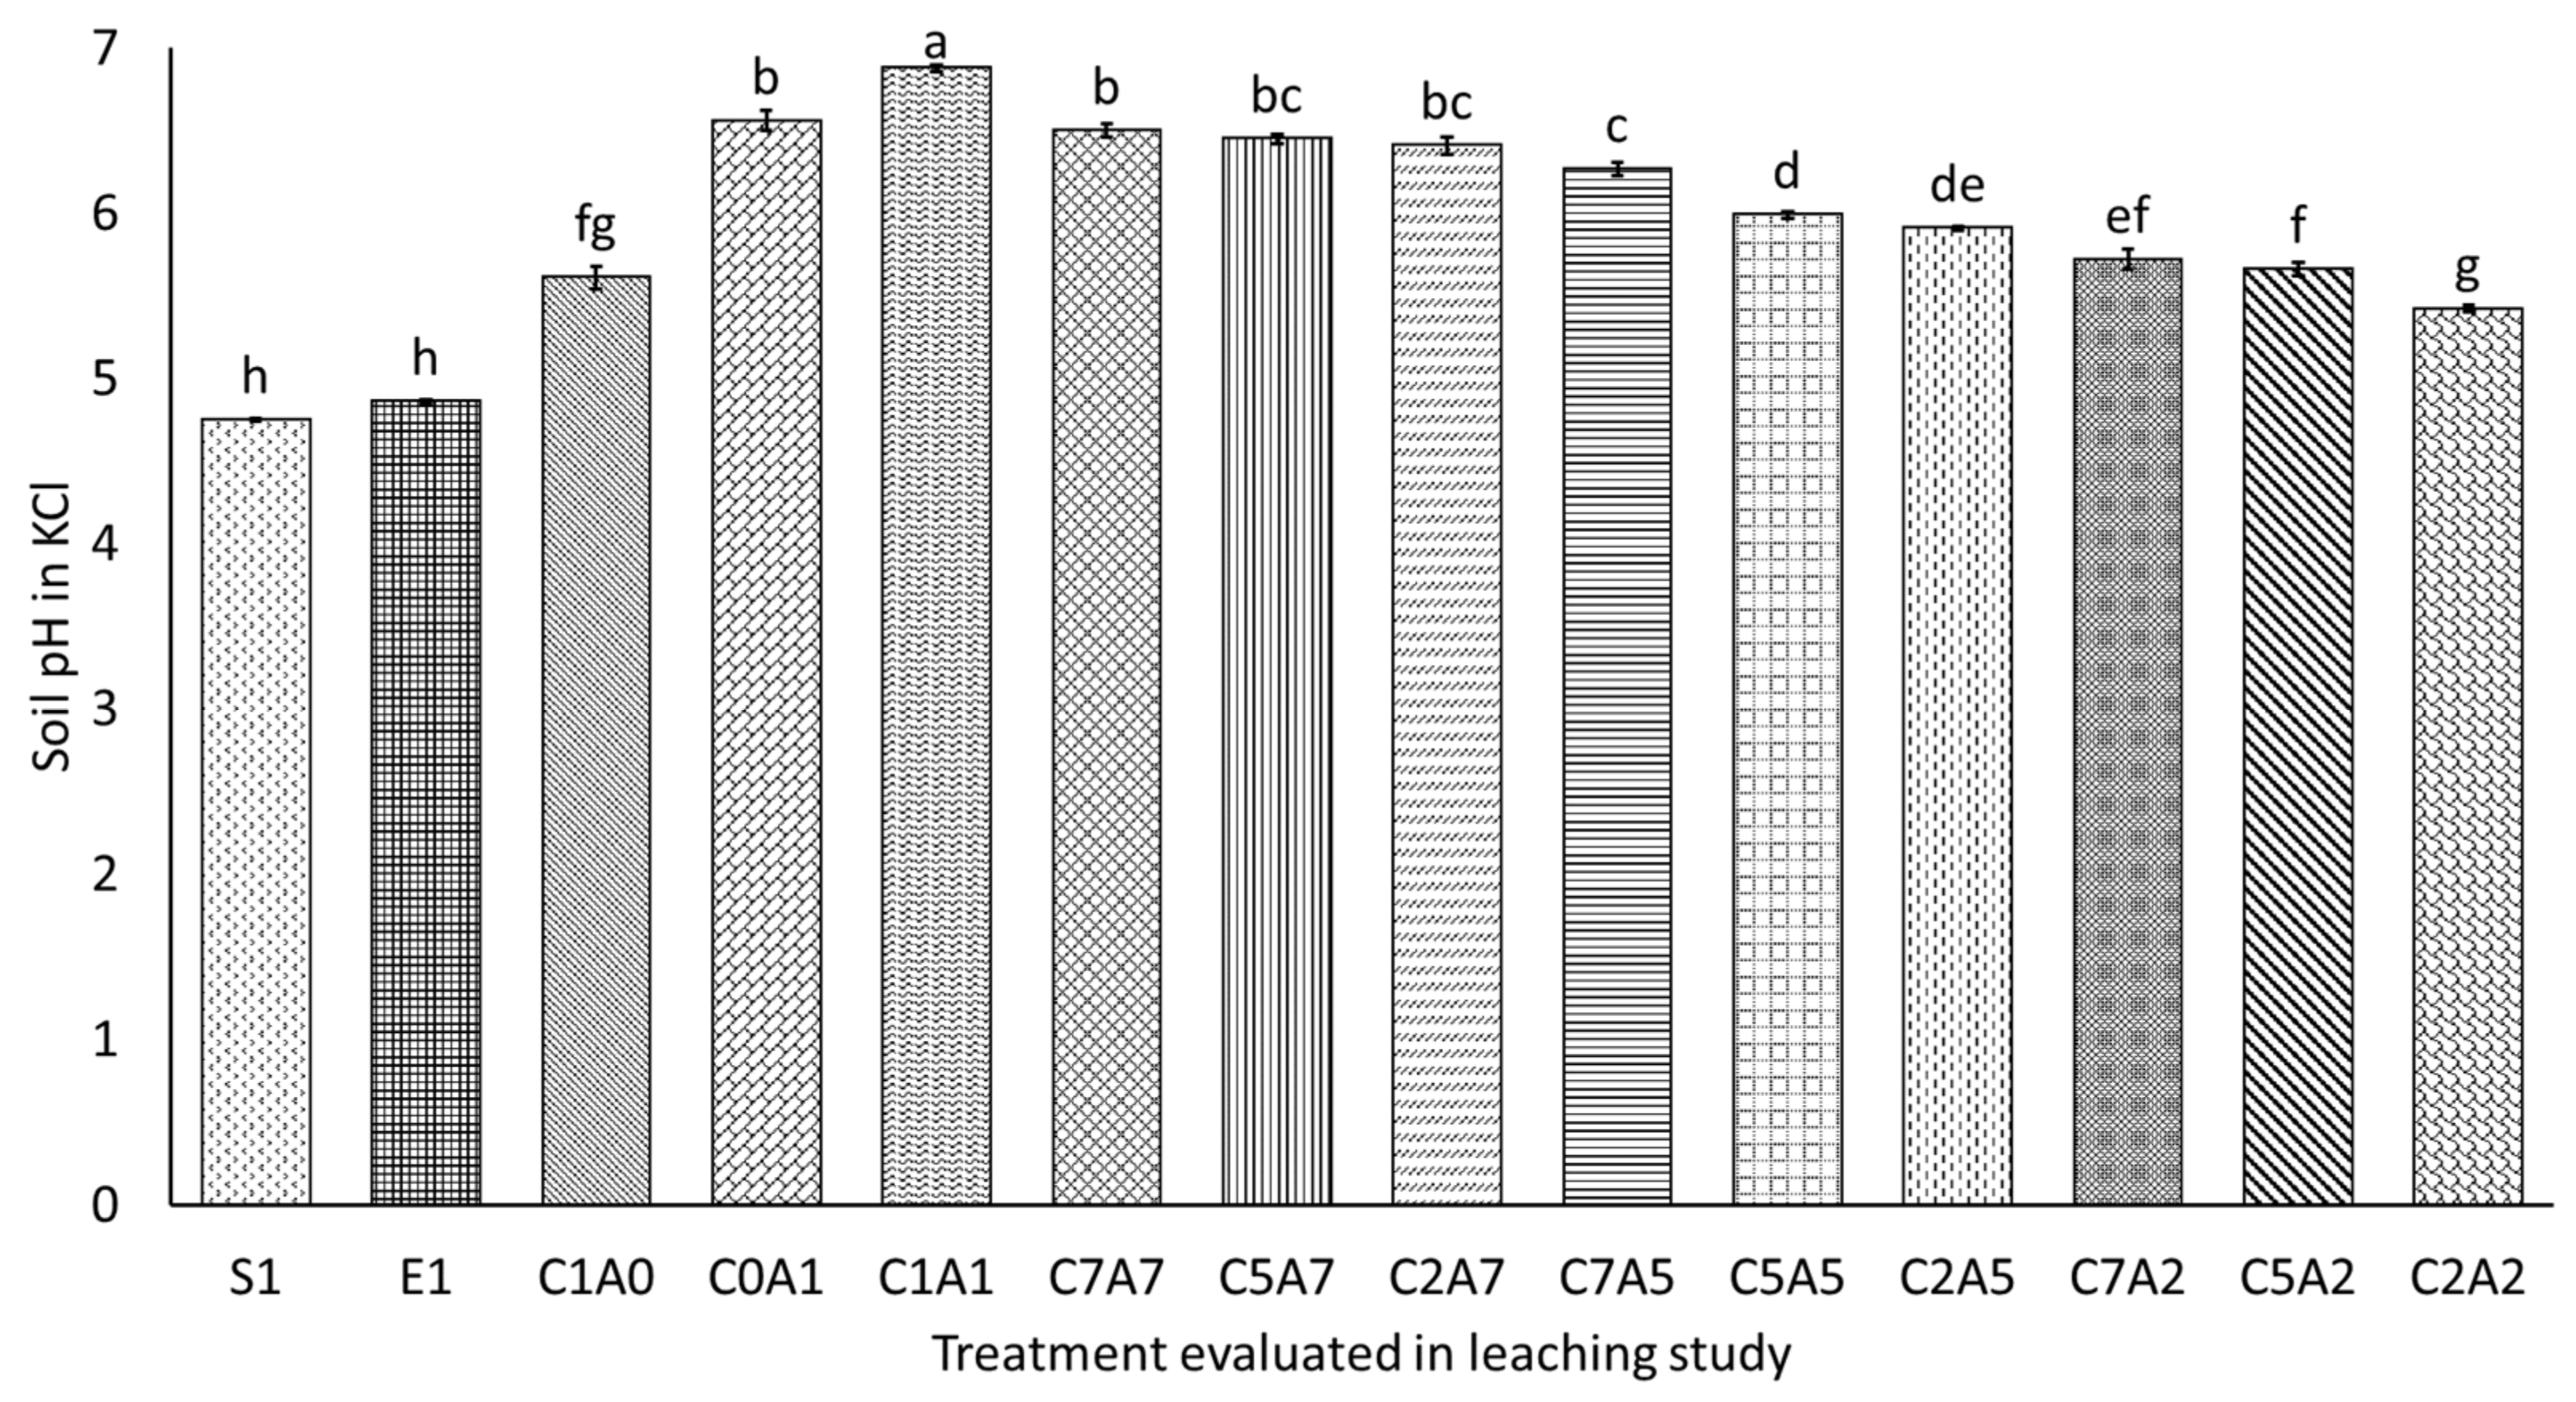
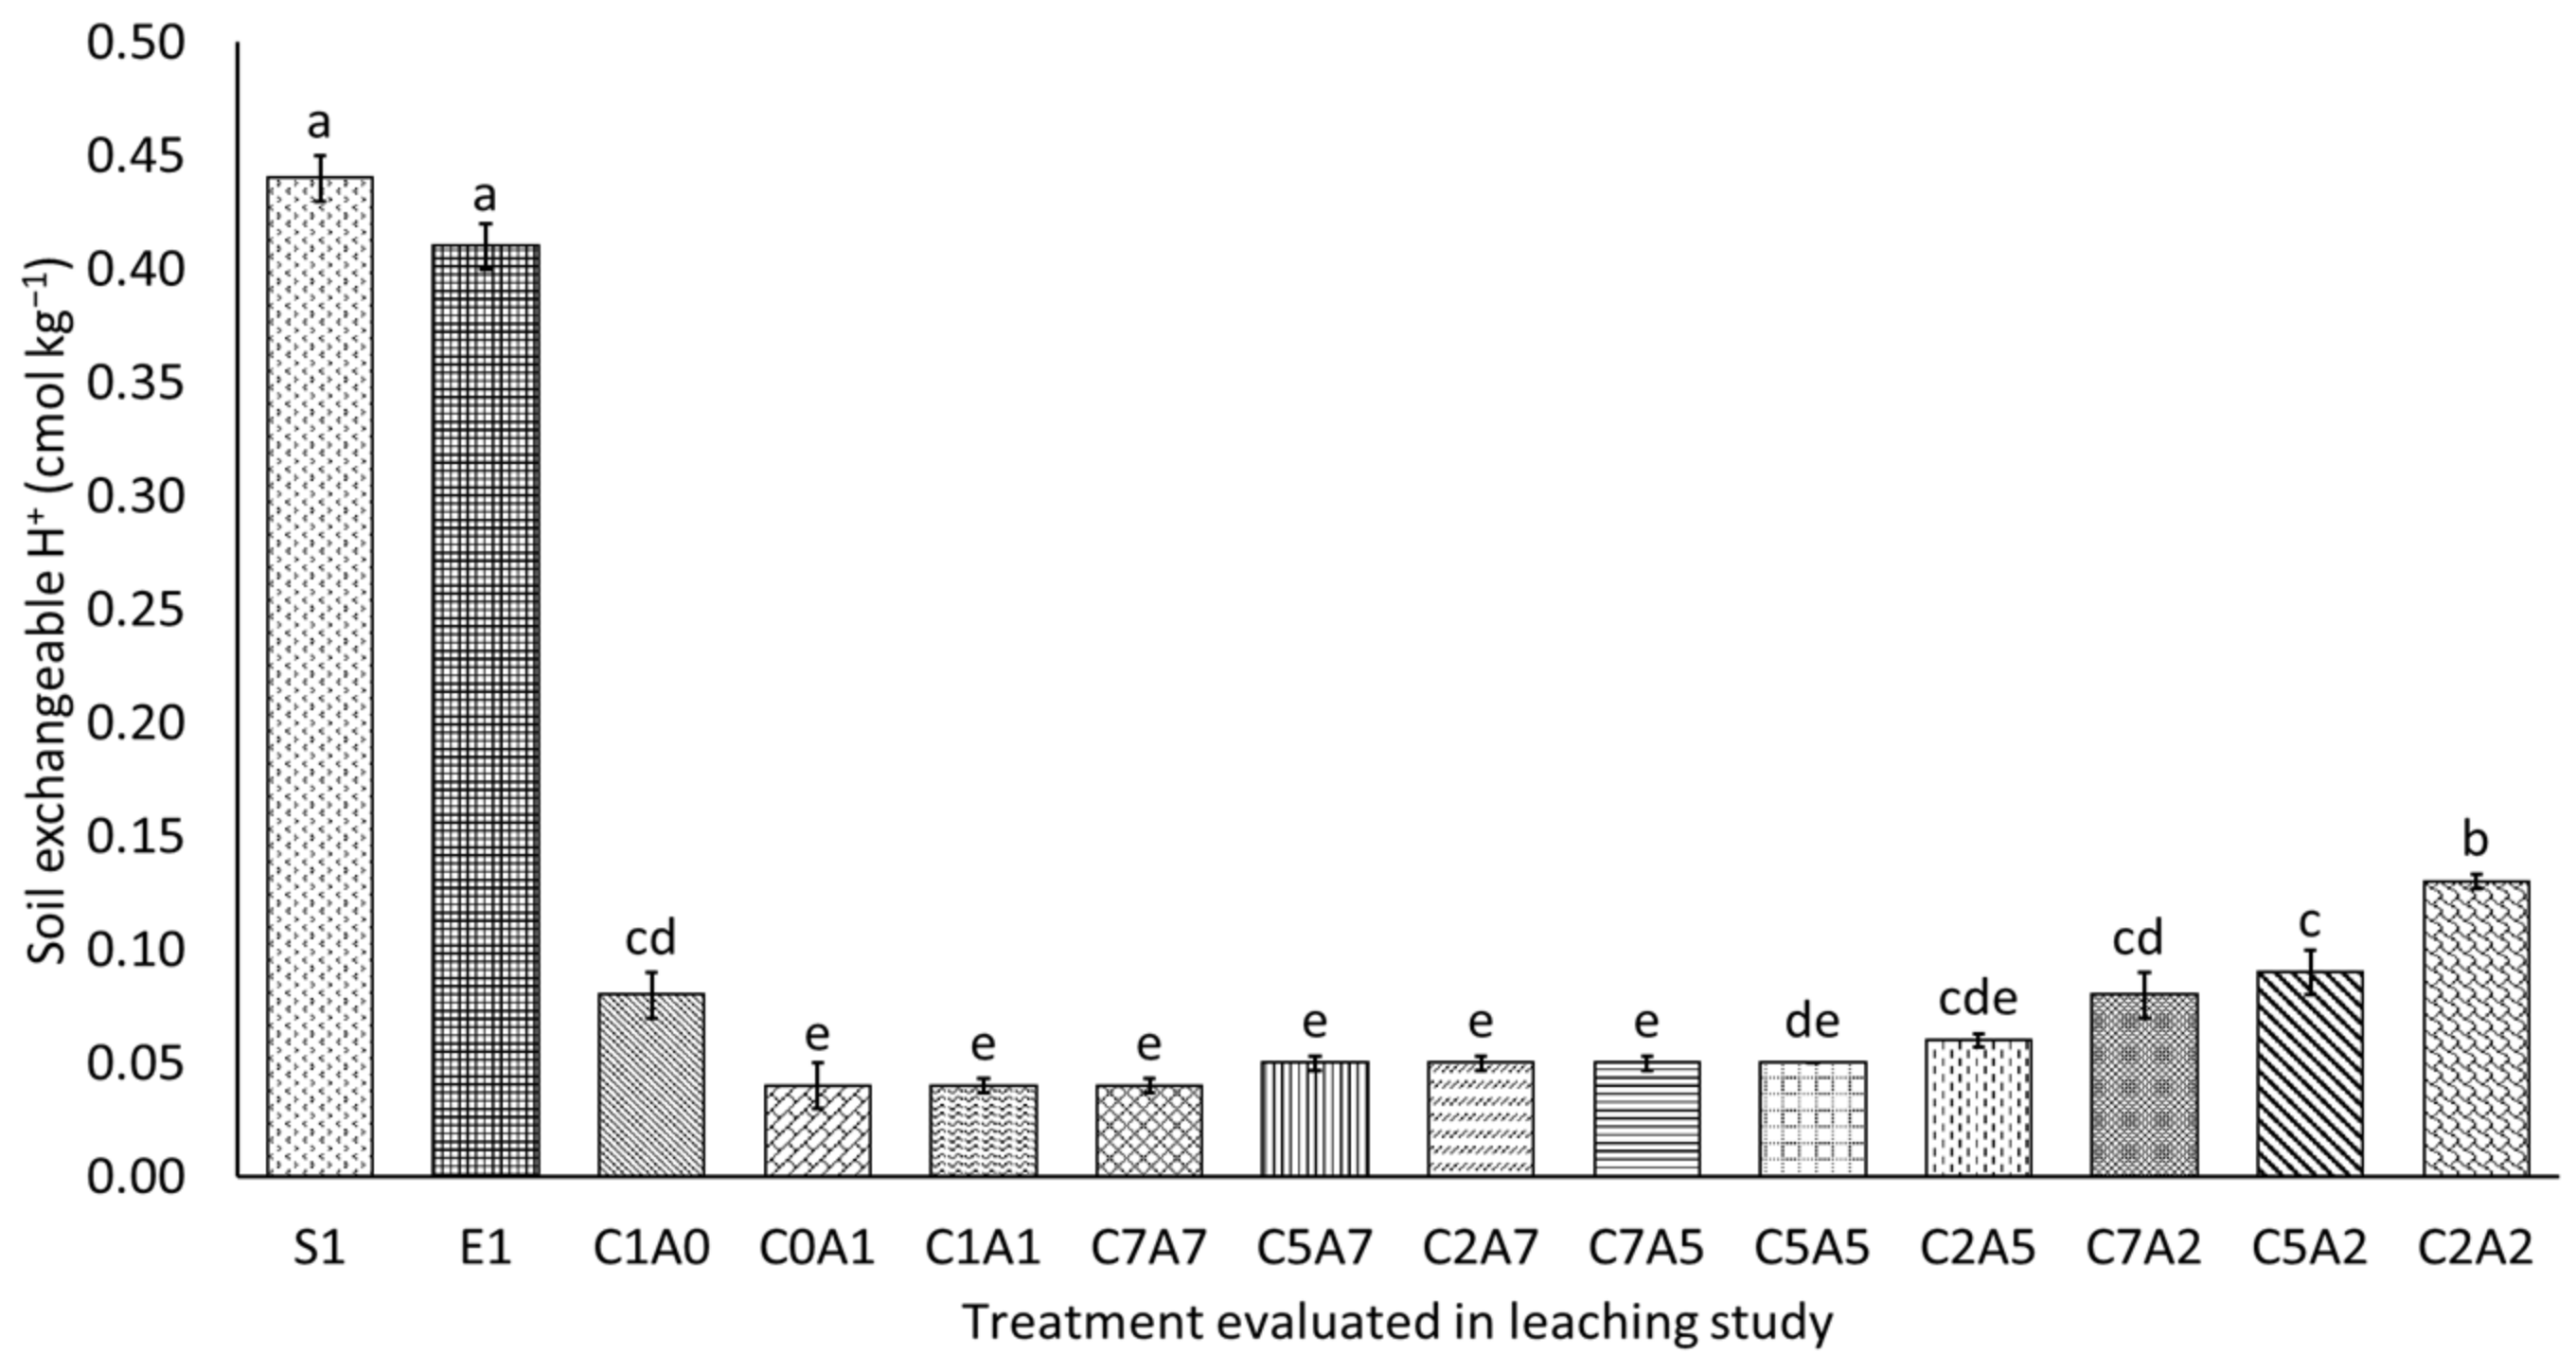
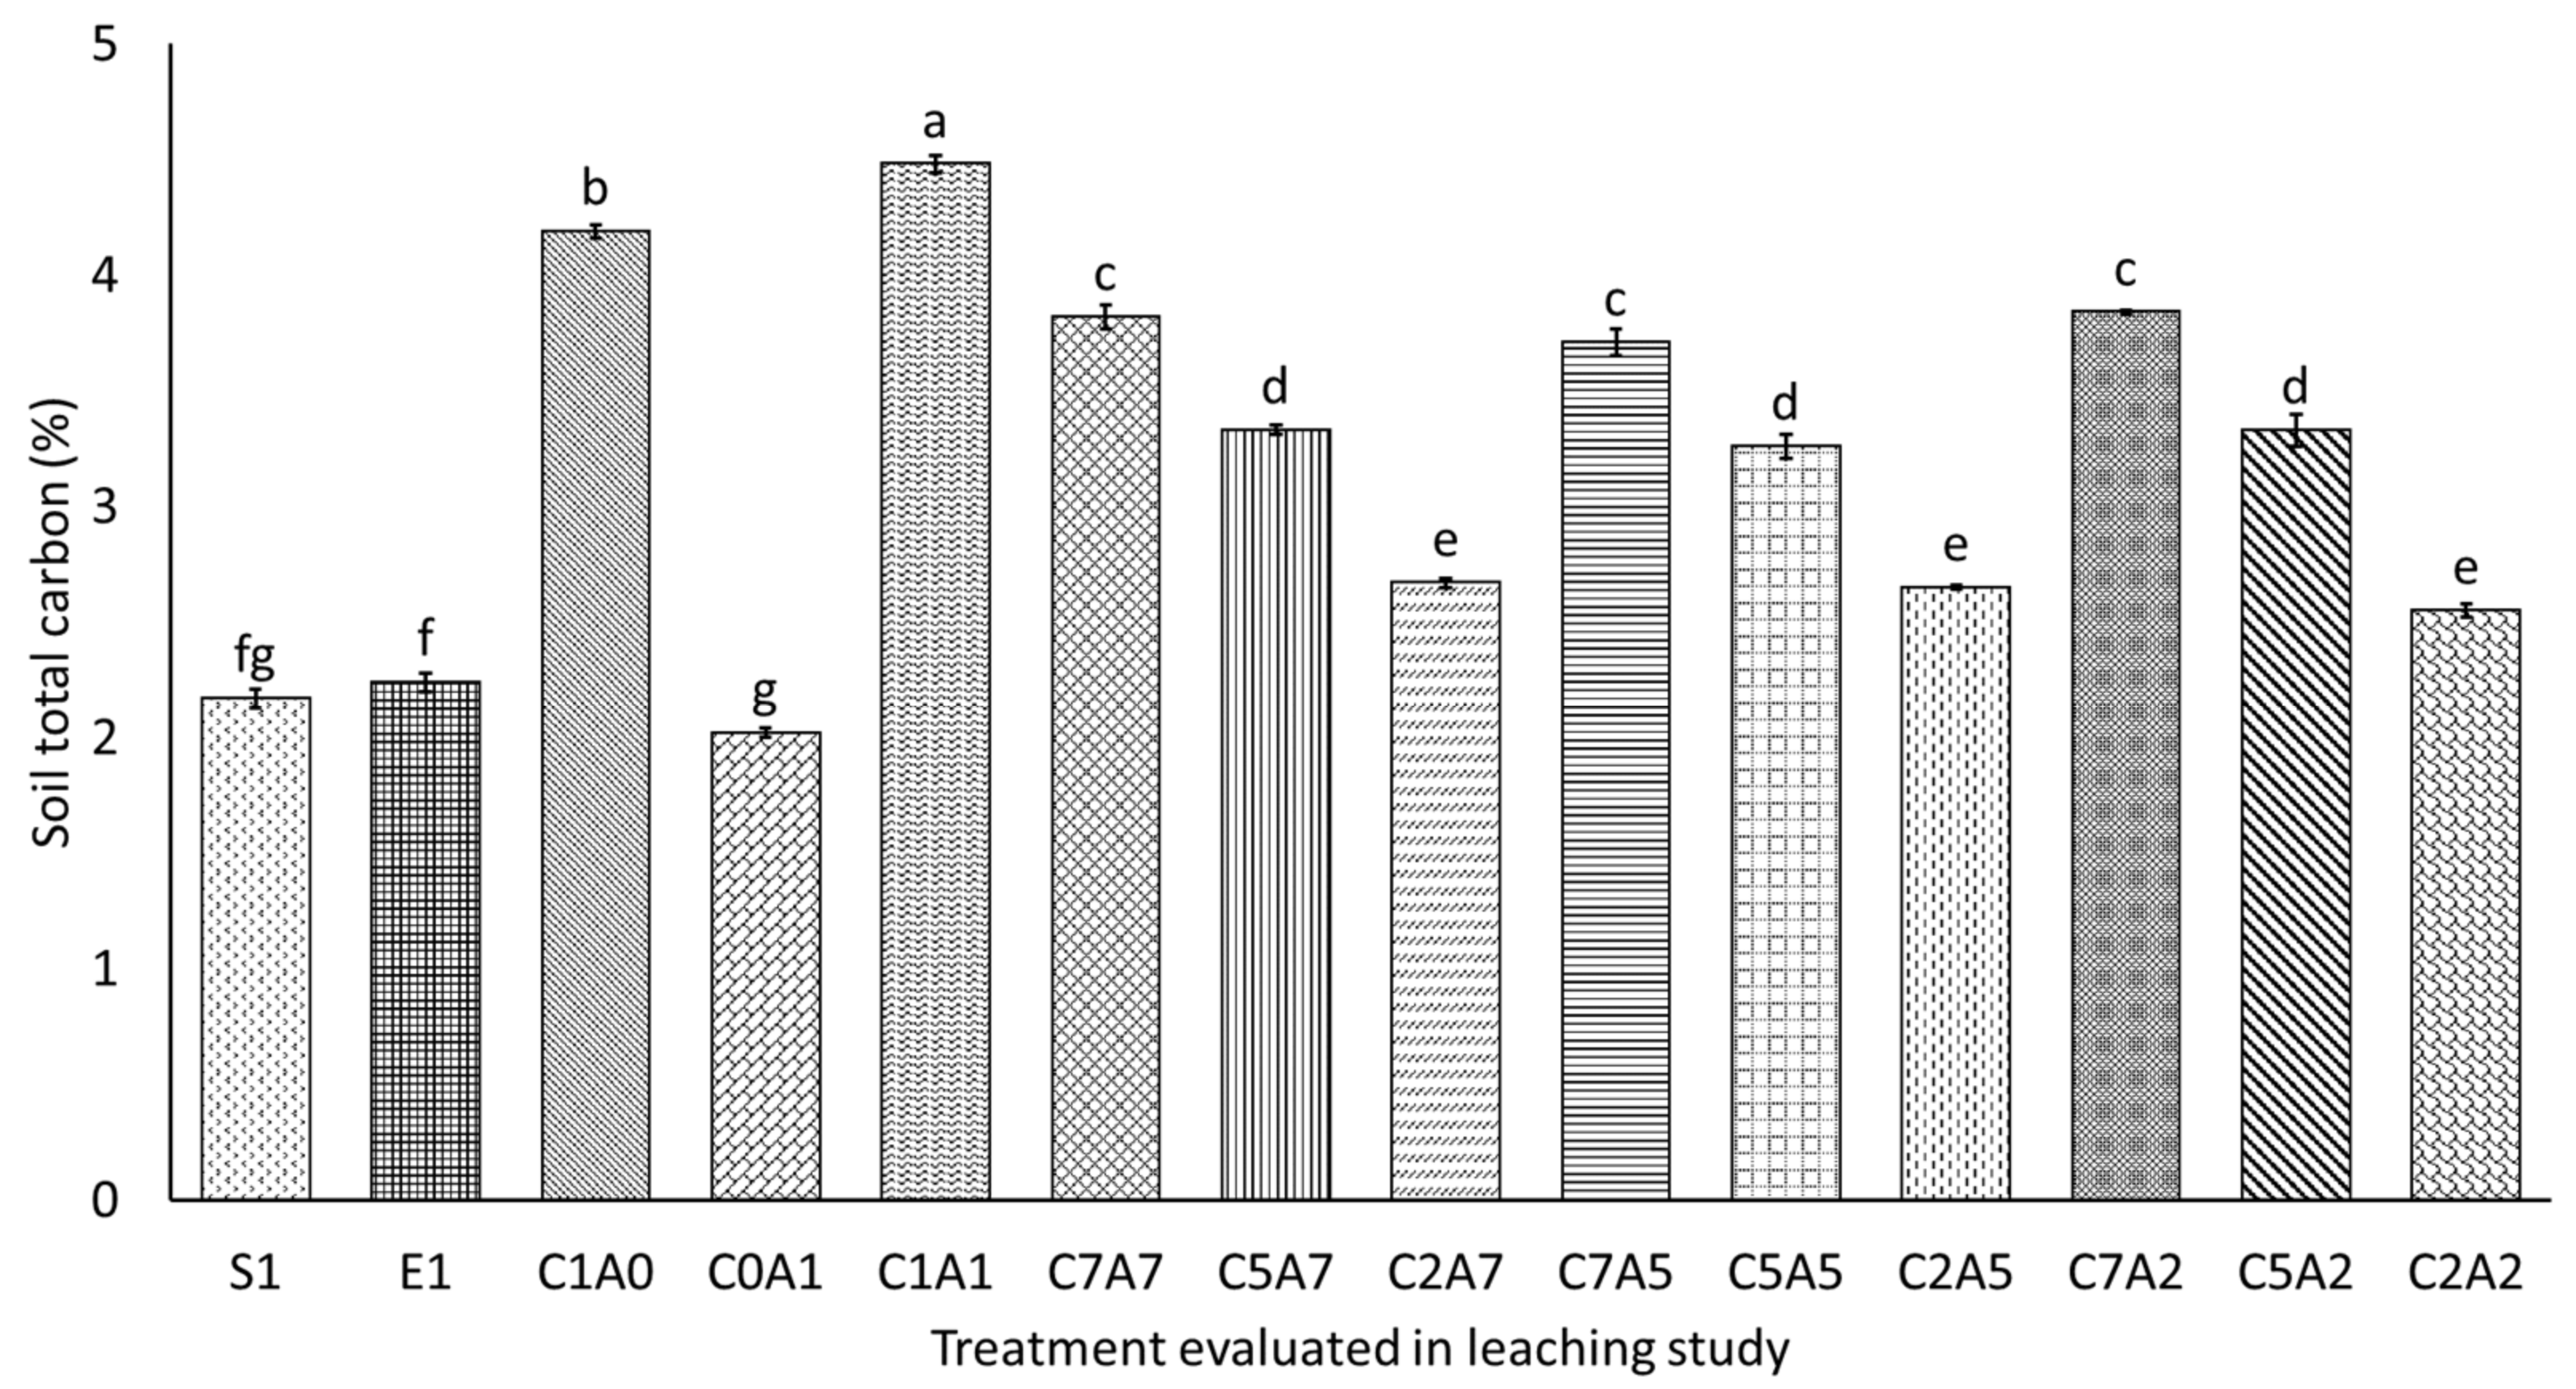
3.4. Selected Soil Chemical Properties after Thirty Days of Leaching

Figure 6 demonstrates that soil pH in KCl at 30 days of leaching for the treatments with charcoal alone, sago bark ash alone, and combination of charcoal and sago bark ash was higher than soil alone (S1) and soil with ERP alone (E1). The low soil pH of S1 is consistent with the high soil exchangeable acidity (Figure 7), exchangeable Al3+ (Figure 8), and exchangeable H+ (Figure 9) of this treatment. The increase in the soil pH following the incorporation of charcoal and sago bark ash is because of the basic nature of these amendments (Table 2). The soil with 100% charcoal and 100% sago bark ash (C1A1) had significantly higher pH compared with other treatments with soil amendments. Irrespective of the amount of charcoal used, soil pH decreased with decreasing amount of the sago bark ash used. The effect of soil with charcoal alone (C1A0) on soil pH was significantly lower compared with soil with sago bark ash alone (C0A1). The high pH buffering capacity of the sago bark ash as described in Section 3.1 partly explains the higher pH of the soil with sago bark ash compared with charcoal.
The significant reduction in soil exchangeable acidity, exchangeable Al3+, and exchangeable H+ by the treatment with soil amendments correlates with the increase in soil pH. Although the amounts of the charcoal and sago bark ash used varied by 25%, 50%, 75%, and 100%, the effects of the treatments with soil amendments on soil exchangeable acidity were almost similar where the combinations of the amendments were able to reduce Al3+ and H+ concentrations. The treatment with conventional practice (E1) demonstrated significantly lower exchangeable acidity and exchangeable Al3+ compared with soil without amendment (S1). This suggests that ERP could increase soil pH through releasing base cations such as K+, Ca2+, Mg2+, and Na+ [65,66]. With the exception of soil alone (S1) and soil with ERP alone (E1), co-application of ERP with charcoal and sago bark ash (C1A0, C0A1, C1A1, C7A7, C5A7, C2A7, C7A5, C5A5, C2A5, C7A2, C7A5, and C2A2) resulted in negligible amounts of soil exchangeable Al3+. The low recovery of exchangeable Al3+ using charcoal and sago bark ash is associated with chelation reaction of the Al3+ at the negatively charged surfaces of the charcoal [67,68] and the neutralizing compounds such as calcite, fairchildite, lime, and magnesium oxide in ash [69,70]. The finding on the effects of treatment on soil exchangeable H+ reveals that the trend of soil exchangeable H+ was inversely proportional to the rate of sago bark ash applied. This confirms the result on soil pH because pH increases with the increasing rate of sago bark ash addition. This finding is comparable to that of Cai et al. [71] who reported that addition of amendments with high base cations to acid soils increases soil base saturation.
Soil EC, as affected by leaching, is summarized in Figure 10. The EC of the soil was lower compared with the EC of leachate because soluble salts leached from soils. The concentration of dissolved salts in leachates is indicated by EC [72]. The low soil EC for S1 is consistent with the low EC of leachate S1. The soil without sago bark ash (E1 and C1A0) had lower EC because application of ERP and charcoal had minimal effects towards soil EC. This observation corroborates the findings of Jones and Quilliam [73] and Lucchini et al. [74] who compared the effects of wood ash and charcoal on soil EC and pH. The results revealed that wood ash had a significant effect on these two properties compared with charcoal. Although C7A7 had the highest soil EC, the effect was not significantly different compared to C1A1, C5A7, C2A7, C5A5, and C2A5. Regardless of the amount of charcoal used (75%, 50%, or 25% of the recommended rate), the soil EC decreased when sago bark ash was applied at the rate of 25%. In this present study, the results suggest that soil EC were within the standard threshold because soils are considered saline when EC values are greater than 2.0 dS m−1 [75].
Among the treatments, the soil with charcoal (C1A0, C1A1, C7A7, C5A7, C2A7, C7A5, C5A5, C2A5, C7A2, C5A2, and C2A2) improved total carbon (TC) (Figure 11). Soil TC was significantly lower in the soil alone (S1), soil with ERP alone (E1), and soil with sago bark ash alone (C0A1). The absence of C source in these three treatments explains the low soil TC. Sago bark ash does not contribute a significant amount of C because combustion of sago bark to produce ash volatilizes C [56]. The soil amended with 100% charcoal and 100% sago bark ash (C1A1) had the highest total C followed by the soil with 100% charcoal alone (C1A0). The soil TC decreased with decreasing amount of charcoal (100% to 75%, 50%, and 25% of the recommended rate). The increase in TC of the soil with increasing rate of charcoal could be attributed to the carbon-rich content in the charcoal. According to Assis et al. [76], the final product of charcoal usually consists of approximately more than 75% C, depending on the final carbonization temperature.

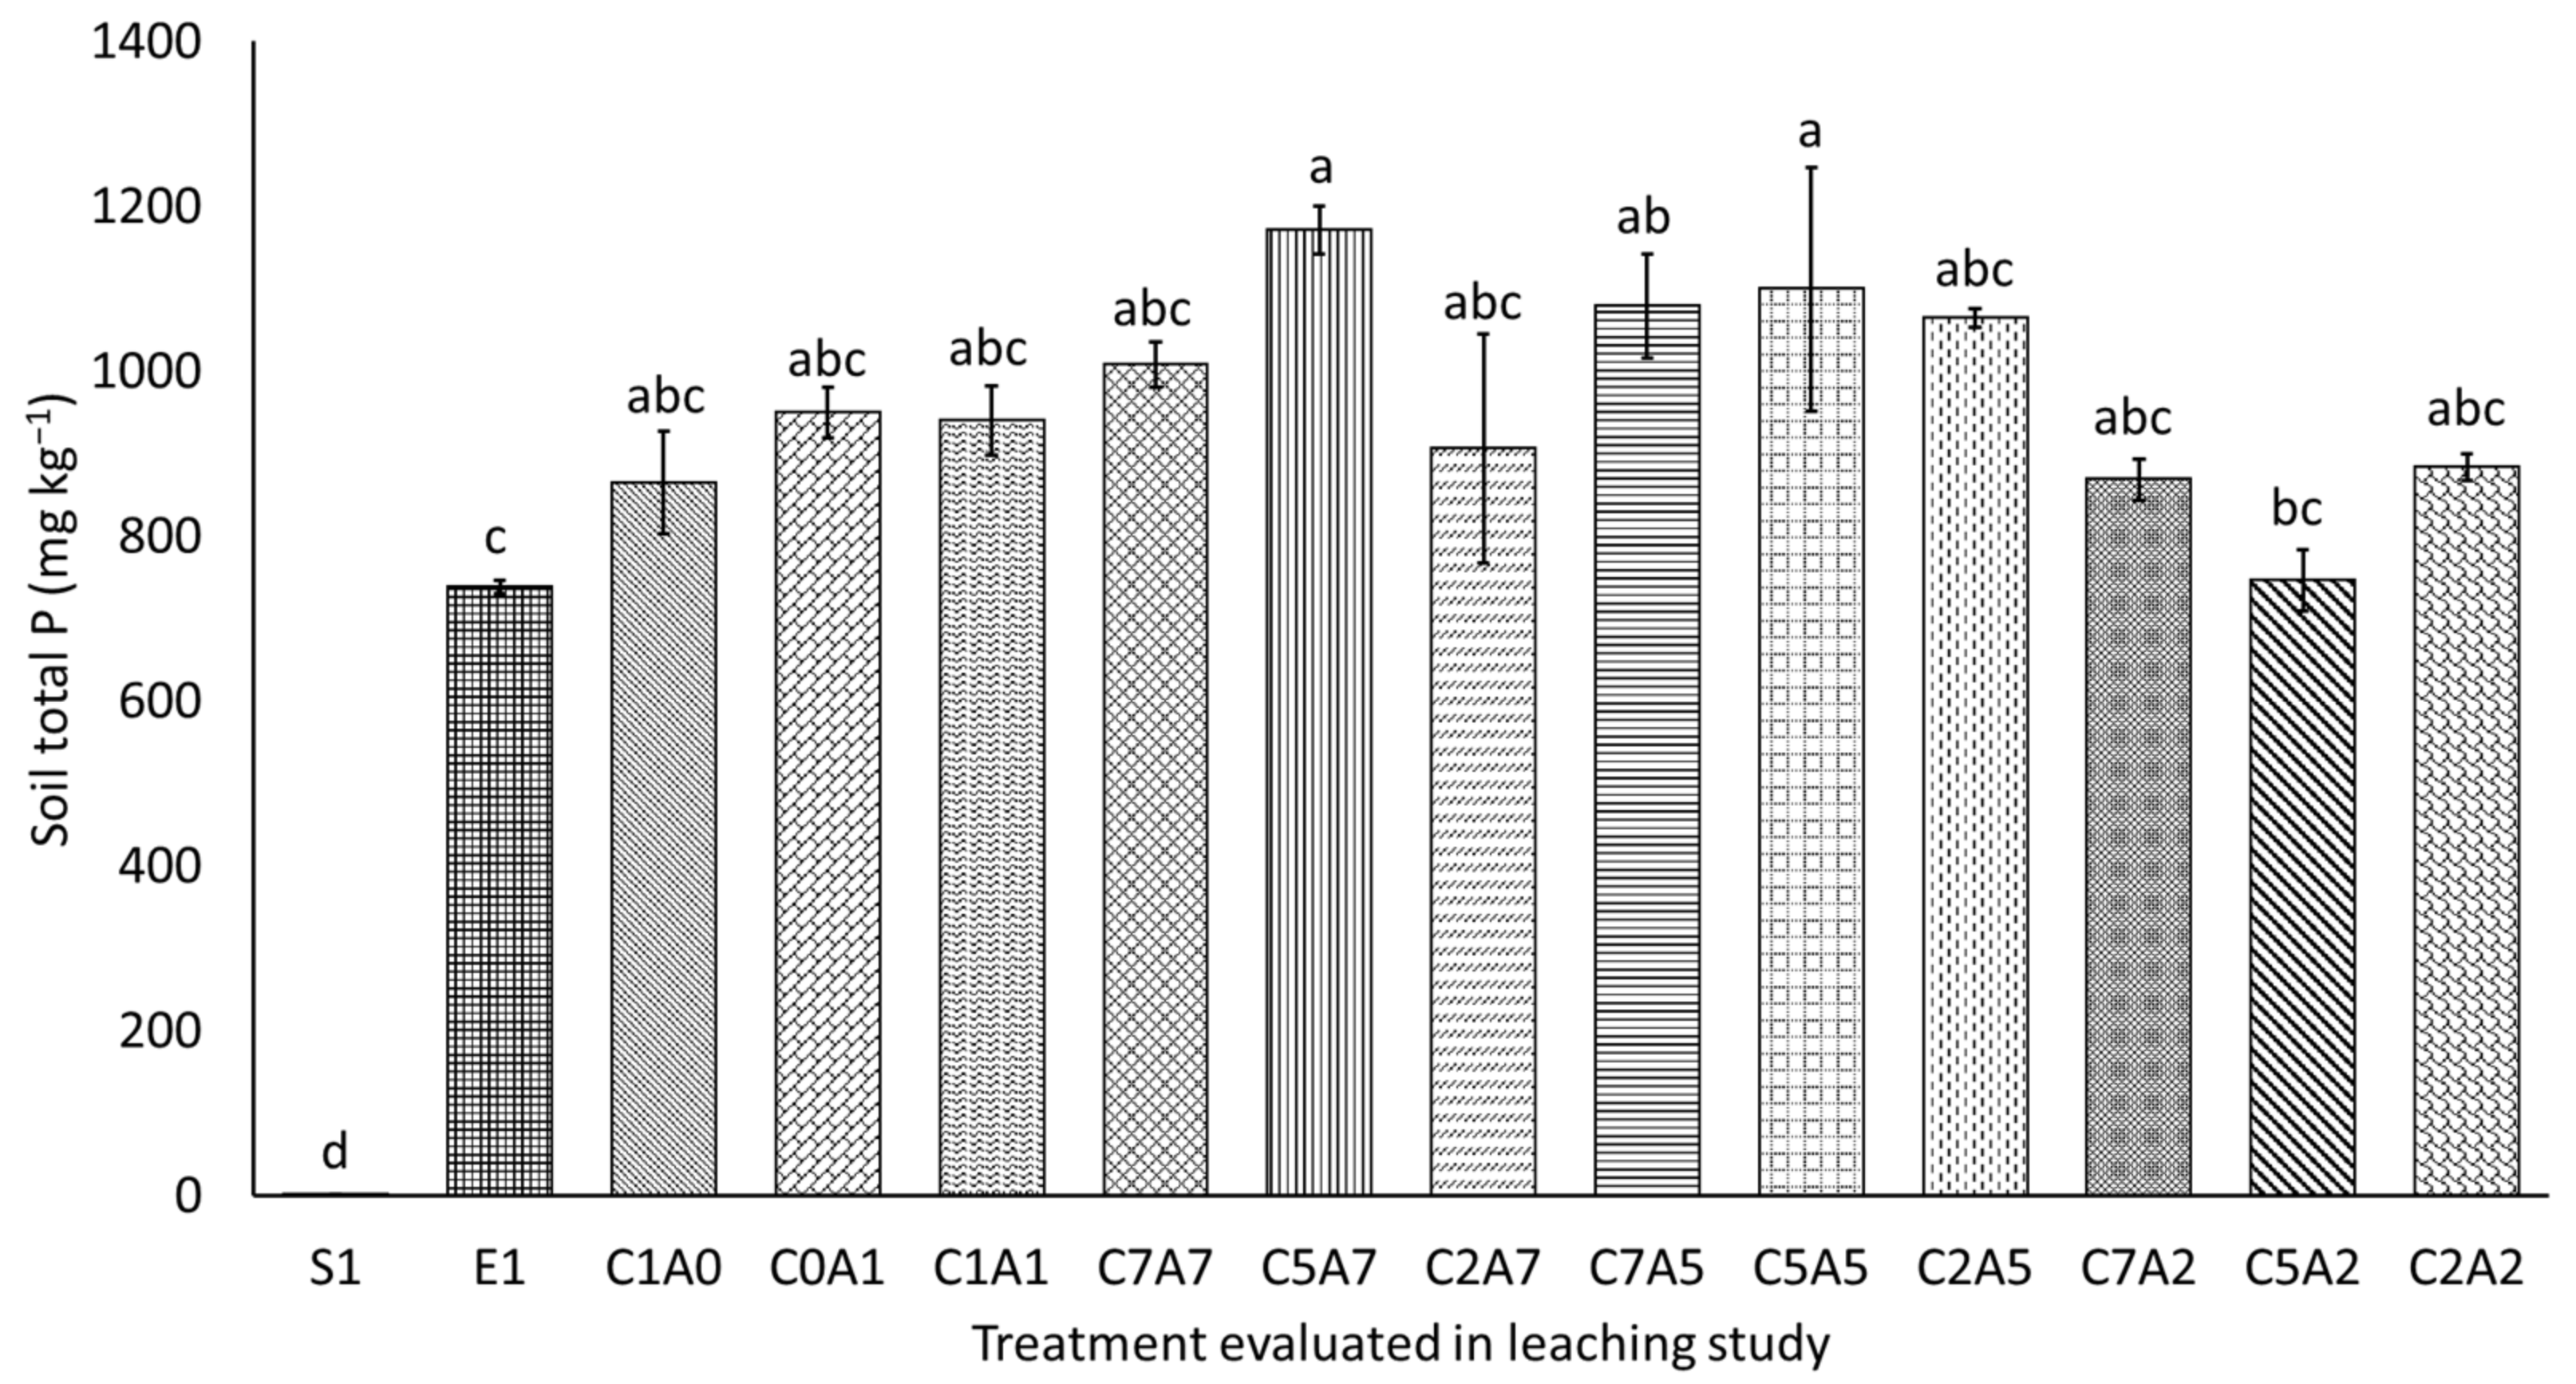
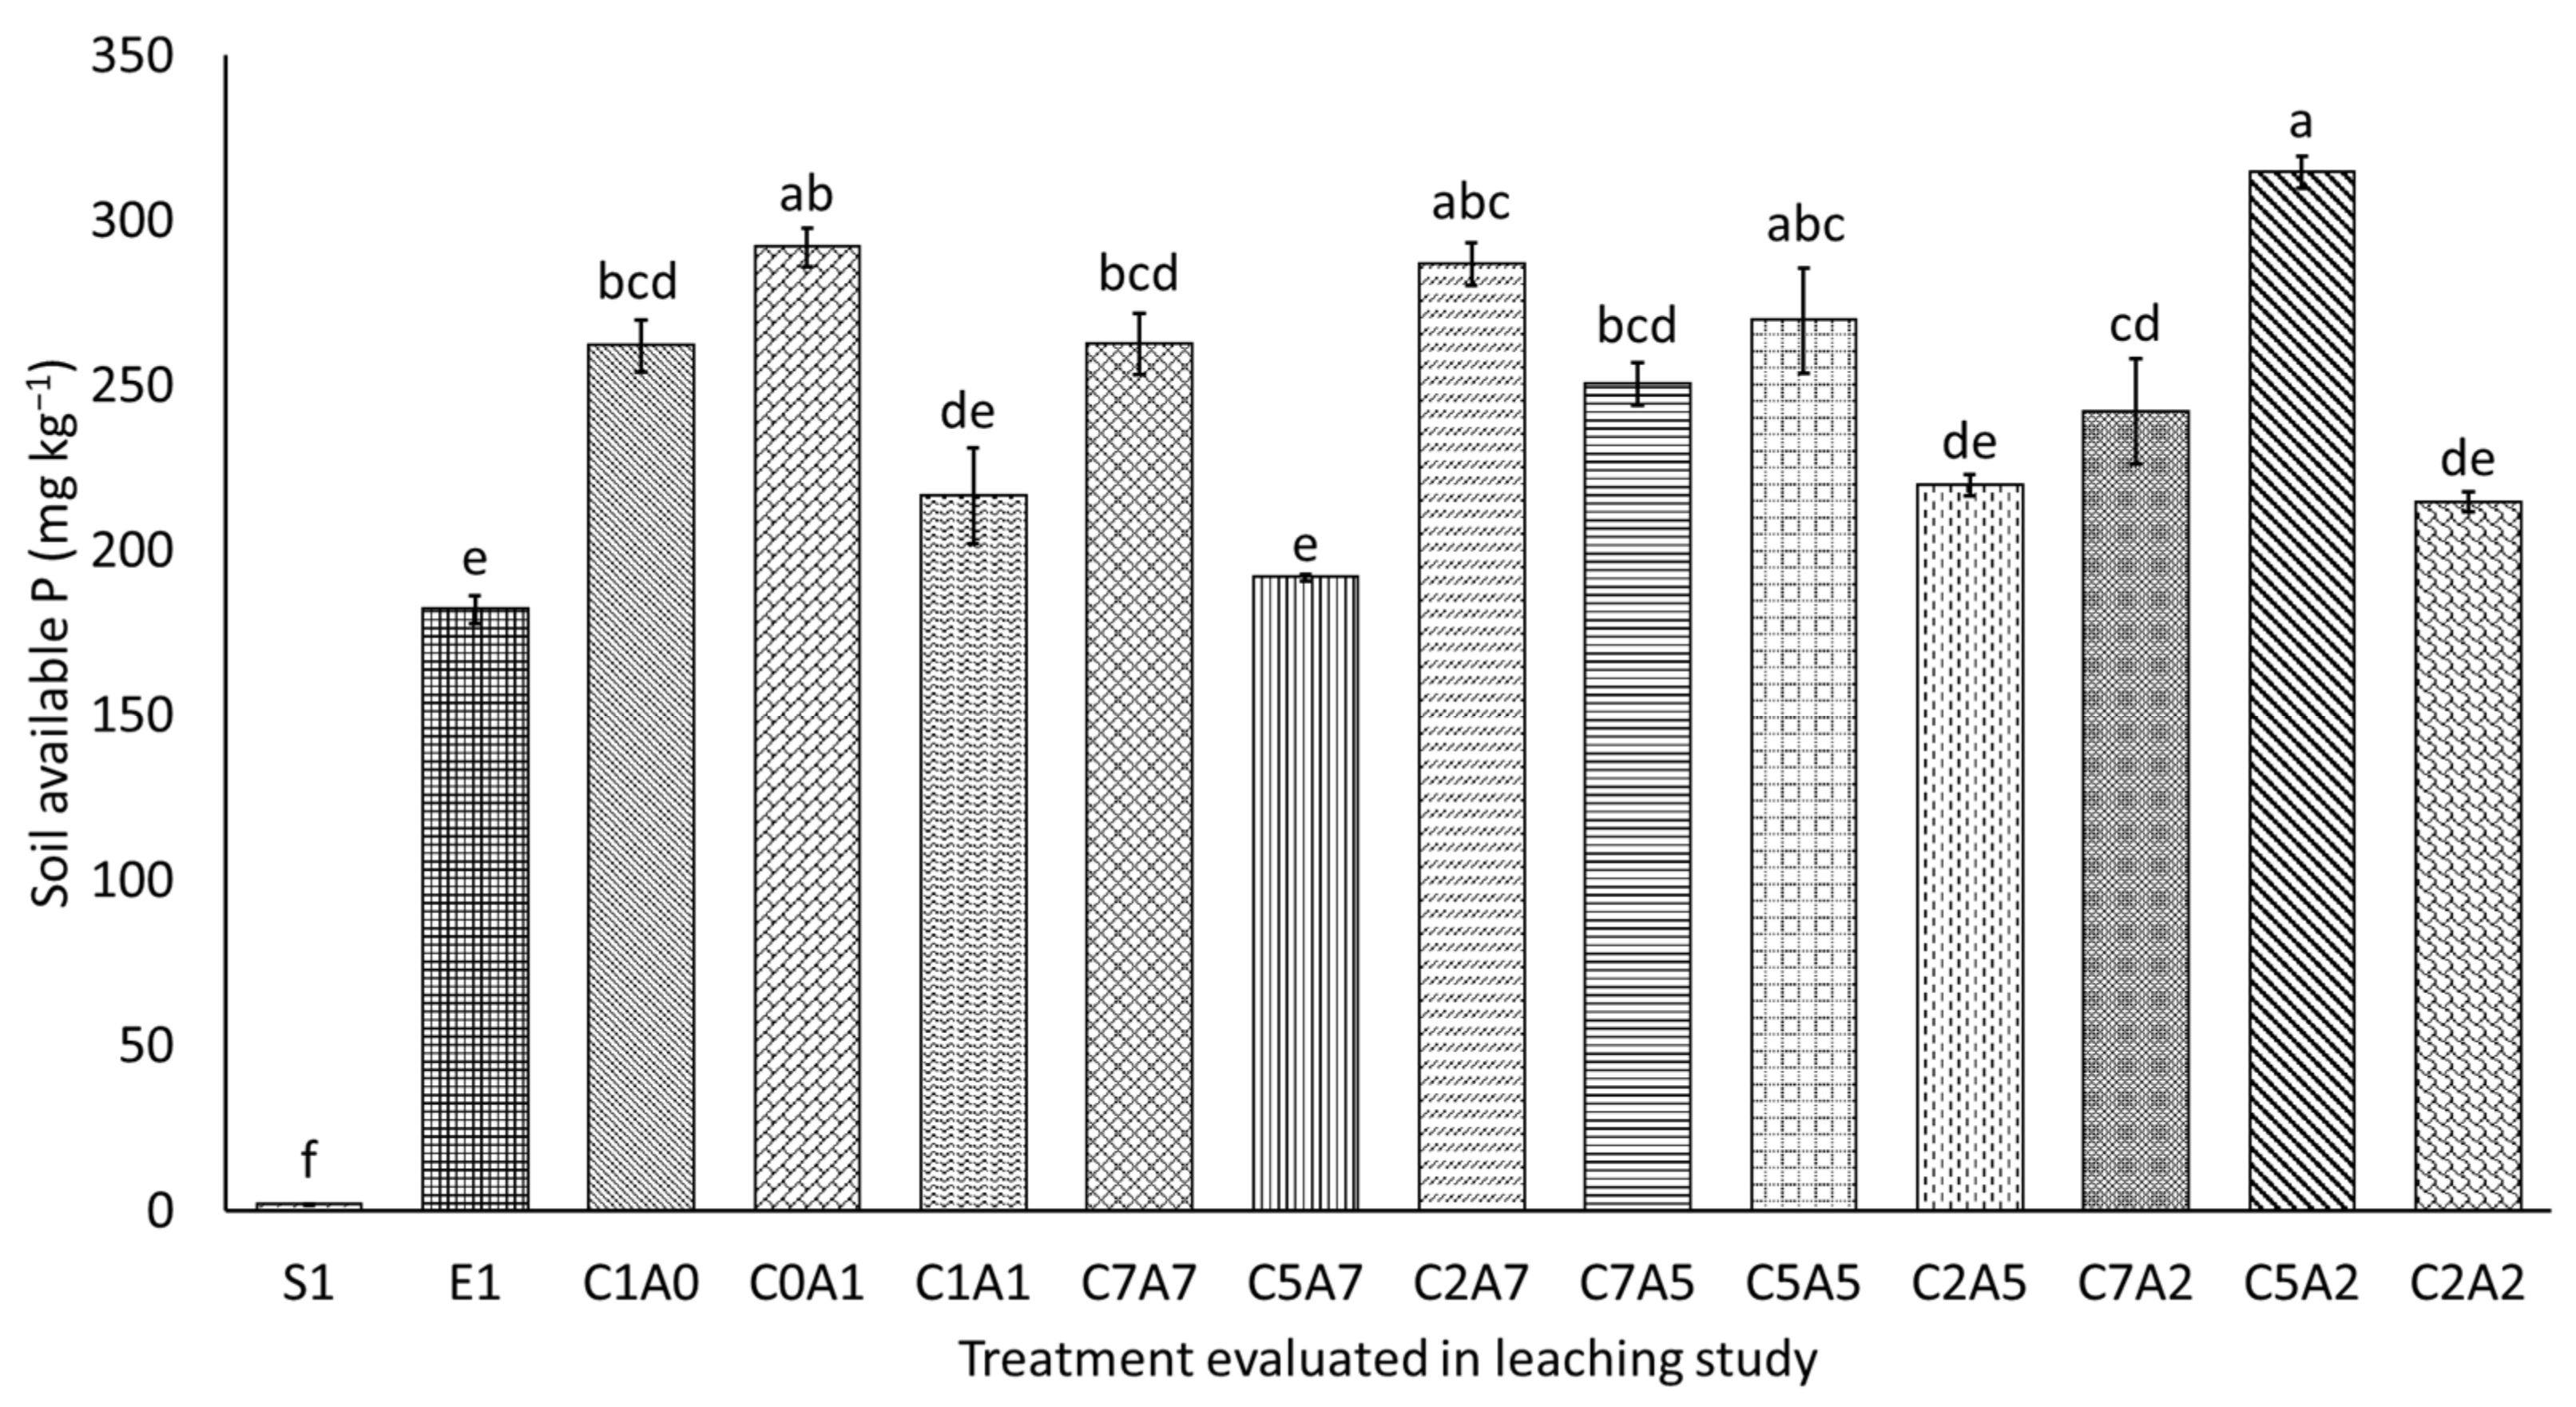
3.5. Soil Total Phosphorus and Available Phosphorus after Thirty Days of Leaching

Soil alone (S1) had significantly lower soil total P and available P compared with the treatments with ERP, charcoal, and sago bark ash (Figure 12 and Figure 13). Although C0A1 had the highest amount of P leached (Figure 5), the concentrations of soil total P and available P in this treatment were higher compared with conventional practice (E1) which previously demonstrated lower amount of P leached. This could be attributed to the high concentration of soluble P accumulates in C0A1 because of the inherent contents of P in the sago bark ash. Soil total P of C5A7 and C5A5 after 30 days of leaching was similar but significantly higher than that of S1, E1, and C5A2. Although there is no application of charcoal and sago bark ash in E1, the effect of E1 on soil available P was similar to C1A1, C5A7, C2A5, and C2A2. The overall trend of the soil-available P differs from the soil total P because of the fixation of P. It is believed that in this leaching study, soil P is mostly fixed by Ca ions instead of Al and Fe ions because the preceding finding (Figure 2) demonstrates that certain treatments with charcoal and sago bark ash have leachate pH values greater than seven. Phosphorus is most accessible between pH range of 6.5 to 7, and beyond pH 7, P ions precipitate with Ca ions, forming calcium phosphate [77,78]. A study by Xu et al. [79] demonstrated that charcoal application decreased P availability in saline-sodic soil because of the sorption or precipitation of phosphate on the charcoal’s surfaces. The inconsistency in the conversion of total P to available P of the soil with different rates of charcoal and sago bark ash relate to incomplete dissolution and low solubility of ERP compared with acidulated rock phosphate. The slow dissolution of ERP is because of the absence of plants roots to regulate the exudation of organic acids which are known to increase the dissolution rate of ERP [80].

4. Conclusions

Information on the soil pH buffering capacity is important in the management of soil acidity and in soil monitoring. In addition to enhancing pH buffering capacity, co-application of charcoal and sago bark ash alleviate soil acidification, which could greatly increase plant P uptake. The liming effect of charcoal can be explained by the proton consumption capacity by the functional groups such as carboxylic, phenolic, and alcoholic associated with organic material, whereas for sago bark ash, its alkalinity and base cations content can be used to describe its potential liming ability. The results of the leaching study revealed that the addition of charcoal to soils demonstrated positive effects on reducing P loss. Charcoal can decrease P leaching from soils by adsorbing P through a pore-filling mechanism and improving the soil water-holding capacity via capillary action. Besides, the findings suggest that sago bark ash has the potential to release P into the water continuously and gradually compared with charcoal. Thus, the thresholds of sago bark ash application rates should be carefully studied to simultaneously ensure a sufficient supply of nutrients and avoid leaching risk. Although the laboratory leaching study was a good starting point for assessing the ability of charcoal and sago bark ash to minimize P leaching, the most reliable data could be obtained from a pot experiment in the presence of plants. It is possible that, in a long-term application of charcoal and sago bark ash, soil properties could be rejuvenated to sustain crop productivity because these amendments can positively change the physical and chemical properties of soils.

Author Contributions

Conceptualization, P.D.J. and O.H.A.; methodology, P.D.J., L.O. and N.A.H.; validation, L.O. and N.A.H.; formal analysis, P.D.J.; investigation, P.D.J.; resources, O.H.A.; data curation, P.D.J.; writing—original draft preparation, P.D.J.; writing—review and editing, O.H.A., L.O. and N.A.H.; visualization, P.D.J.; supervision, O.H.A., L.O. and N.A.H.; project administration, O.H.A.; funding acquisition, O.H.A. All authors have read and agreed to the published version of the manuscript.

Funding

This research was funded by Ministry of Higher Education, Malaysia with grant number [ERGS/1/11/STWN/UPM/02/65].

Institutional Review Board Statement

Not applicable.

Informed Consent Statement

Not applicable.

Data Availability Statement

The data presented in this study are available within the article.

Acknowledgments

The authors would like to acknowledge Ministry of Higher Education, Malaysia for financial assistance and Universiti Putra Malaysia for providing research facilities.

Conflicts of Interest

The authors declare no conflict of interest.

References

  1. Atkinson, C.J.; Fitzgerald, J.D.; Hipps, N.A. Potential mechanisms for achieving agricultural benefits from biochar application to temperate soils: A review. Plant Soil 2010, 337, 1–18. [Google Scholar] [CrossRef]
  2. Sharma, S.B.; Sayyed, R.Z.; Trivedi, M.H.; Gobi, T.A. Phosphate solubilizing microbes: Sustainable approach for managing phosphorus deficiency in agricultural soils. SpringerPlus 2012, 2, 1–14. [Google Scholar] [CrossRef] [PubMed] [Green Version]
  3. Maguire, R.O.; Foy, R.H.; Bailey, J.S.; Sims, J.T. Estimation of the phosphorus sorption capacity of acidic soils in Ireland. Eur. J. Soil Sci. 2001, 52, 479–487. [Google Scholar] [CrossRef]
  4. Fink, J.R.; Inda, A.V.; Bavaresco, J.; Barrón, V.; Torrent, J.; Bayer, C. Adsorption and desorption of phosphorus in subtropical soils as affected by management system and mineralogy. Soil Tillage Res. 2016, 155, 62–68. [Google Scholar] [CrossRef]
  5. Bulmer, D.; Kar, G.; Hamilton, J.; Siciliano, S.; Peak, D. Extent and mechanism of interaction between phosphate and citrate in a calcareous soil. Soil Sci. Soc. Am. J. 2018, 82, 315–322. [Google Scholar] [CrossRef] [Green Version]
  6. Xu, N.; Chen, M.; Zhou, K.; Wang, Y.; Yin, H.; Chen, Z. Retention of phosphorus on calcite and dolomite: Speciation and modeling. RSC Adv. 2014, 4, 35205–35214. [Google Scholar] [CrossRef]
  7. Pant, H.K.; Reddy, K.R.; Dierberg, F.E. Bioavailability of organic phosphorus in a submerged aquatic vegetation–dominated treatment wetland. J. Environ. Qual. 2002, 31, 1748–1756. [Google Scholar] [CrossRef]
  8. Penn, C.J.; Camberato, J.J. A critical review on soil chemical processes that control how soil pH affects phosphorus availability to plants. Agriculture 2019, 9, 120. [Google Scholar] [CrossRef] [Green Version]
  9. Bolan, N.S.; Adriano, D.C.; Curtin, D. Soil acidification and liming interactions with nutrient and heavy metal transformation and bioavailability. Adv. Agron. 2003, 78, 215–272. [Google Scholar]
  10. Graham, P.H.; Vance, C.P. Legumes: Importance and constraints to greater use. Plant. Physiol. 2003, 131, 872–877. [Google Scholar] [CrossRef] [Green Version]
  11. Kunhikrishnan, A.; Thangarajan, R.; Bolan, N.S.; Xu, Y.; Mandal, S.; Gleeson, D.B.; Seshadri, B.; Zaman, M.; Barton, L.; Tang, C.; et al. Functional relationships of soil acidification, liming, and greenhouse gas flux. Adv. Agron. 2016, 139, 1–71. [Google Scholar]
  12. Ch’ng, H.Y.; Ahmed, O.H.; Majid, N.M.A. Minimizing phosphorus sorption and leaching in a tropical acid soil using Egypt rock phosphate with organic amendments. Philipp. Agric. Sci. 2016, 99, 176–185. [Google Scholar]
  13. Latifah, O.; Ahmed, O.H.; Majid, N.M.A. Soil pH buffering capacity and nitrogen availability following compost application in a tropical acid soil. Compost. Sci. Util. 2018, 26, 1–15. [Google Scholar] [CrossRef]
  14. Garcıa-Gil, J.C.; Ceppi, S.B.; Velasco, M.I.; Polo, A.; Senesi, N. Long-term effects of amendment with municipal solid waste compost on the elemental and acidic functional group composition and pH-buffer capacity of soil humic acids. Geoderma 2004, 121, 135–142. [Google Scholar] [CrossRef]
  15. Curtin, D.; Trolove, S. Predicting pH buffering capacity of New Zealand soils from organic matter content and mineral characteristics. Soil Res. 2013, 51, 494–502. [Google Scholar] [CrossRef]
  16. Latifah, O.; Ahmed, O.H.; Abdul Majid, N.M. Enhancing nitrogen availability, ammonium adsorption-desorption, and soil pH buffering capacity using composted paddy husk. Eurasian Soil Sci. 2017, 50, 1483–1493. [Google Scholar] [CrossRef]
  17. Sharpley, A.; Wang, X. Managing agricultural phosphorus for water quality: Lessons from the USA and China. J. Environ. Sci. 2014, 26, 1770–1782. [Google Scholar] [CrossRef]
  18. Silveira, M.L.; Vendramini, J.; Sollenberger, L.E. Phosphorus management and water quality problems in grazingland ecosystems. Int. J. Agron. 2010, 2010, 517603. [Google Scholar] [CrossRef] [Green Version]
  19. Monaghan, R.M.; Parfitt, R.L.; Mackay, A.D.; Ross, D.J.; Budding, P.J. Effects of soil fertility on leaching losses of N, P and C in hill country. N. Z. J. Agric. Res. 2009, 52, 495–497. [Google Scholar] [CrossRef]
  20. Hoseini, Y.; Taleshmikaiel, R.D. Comparison of phosphorus adsorption isotherms in soil and its relation to soil properties. Int. J. Agric. 2013, 3, 163–171. [Google Scholar]
  21. Aase, J.K.; Bjorneborg, D.L.; Westermann, D.T. Phosphorus runoff from two water sources on a calcareous soil. J. Environ. Qual. 2001, 30, 1315–1323. [Google Scholar] [CrossRef] [Green Version]
  22. Jarvis, N.J. A review of non-equilibrium water flow and solute transport in soil macropores: Principles, controlling factors and consequences for water quality. Eur. J. Soil Sci. 2007, 58, 523–546. [Google Scholar] [CrossRef]
  23. McDowell, R.W.; Gray, C.W.; Cameron, K.C.; Di, H.J.; Pellow, R. The efficacy of good practice to prevent long-term leaching losses of phosphorus from an irrigated dairy farm. Agric. Ecosyst. Environ. 2019, 273, 86–94. [Google Scholar] [CrossRef]
  24. Ulen, B.; Larsbo, M.; Koestel, J.; Hellner, Q.; Blomberg, M.; Geranmayeh, P. Assessing strategies to mitigate phosphorus leaching from drained clay soils. Ambio 2018, 47, 114–123. [Google Scholar] [CrossRef] [Green Version]
  25. Coelho, B.B.; Murray, R.; Lapen, D.; Topp, E.; Bruin, A. Phosphorus and sediment loading to surface waters from liquid swine manure application under different drainage and tillage practices. Agric. Water Manag. 2012, 104, 51–61. [Google Scholar] [CrossRef]
  26. Sharpley, A.; Smith, S.; Stewart, B.; Mathers, A. Forms of phosphorus in soil receiving cattle feedlot waste. J. Environ. Qual. 1984, 13, 211–215. [Google Scholar] [CrossRef] [Green Version]
  27. Ch’ng, H.Y.; Ahmed, O.H.; Majid, N.M.A. Improving phosphorus availability, nutrient uptake and dry matter production of Zea mays L. on a tropical acid soil using poultry manure biochar and pineapple leaves compost. Exp. Agric. 2016, 52, 447–465. [Google Scholar] [CrossRef]
  28. Asap, A.; Haruna, A.O.; Ab Majid, N.M.; Ali, M. Amending triple superphosphate with chicken litter biochar improves phosphorus availability. Eurasian J. Soil Sci. 2018, 7, 121–132. [Google Scholar] [CrossRef]
  29. Bot, A.; Benites, J. The Importance of Soil Organic Matter: Key to Drought-Resistant Soil and Sustained Food Production; FAO Soils Bulletin 80; FAO: Rome, Italy, 2005. [Google Scholar]
  30. Nadi, M.; Sedaghati, E.; Fuleky, G. Evaluation of humus quality of forest soils with two extraction methods. Int. J. For. Soil Eros. 2012, 2, 124–127. [Google Scholar]
  31. Dixon, R.K.; Wisniewski, J. Global forest systems: An uncertain response to atmospheric pollutants and global climate change. Water Air Soil Pollut. 1995, 85, 101–110. [Google Scholar] [CrossRef]
  32. Bouyoucos, G.J. Hydrometer method improved for making particle size analysis of soils. Agron. J. 1962, 54, 464–465. [Google Scholar] [CrossRef]
  33. Peech, H.M. Hydrogen-ion Activity. In Methods of Soil Analysis Chemical and Microbiological Properties; Black, C.A., Evans, D.D., White, J.L., Ensminger, L.E., Clark, F.E., Eds.; American Society of Agronomy: Madison, WI, USA, 1965; pp. 914–926. [Google Scholar]
  34. Chefetz, B.; Hatcher, P.H.; Hadar, Y.; Chen, Y. Chemical and biological characterization of organic matter during composting of municipal solid waste. J. Environ. Qual. 1996, 25, 776–785. [Google Scholar] [CrossRef]
  35. Bremner, J.M. Total Nitrogen. In Methods of Soil Analysis: Part 2; Black, C.A., Evans, D.D., Ensminger, L.E., White, J.L., Clark, F.F., Dinauer, R.C., Eds.; American Society of Agronomy: Madison, WI, USA, 1965; pp. 1149–1178. [Google Scholar]
  36. Cottenie, A. Soil Testing and Plant Testing as a Basis of Fertilizer Recommendation; FAO Soils Bulletin 38/2; FAO: Rome, Italy, 1980; pp. 1–119. [Google Scholar]
  37. Rowell, D.L. Soil Science: Methods and Application; Longman Publishers Ltd.: London, UK, 1994; p. 169. [Google Scholar]
  38. Bernas, B. New method for decomposition and comprehensive analysis of silicates by atomic absorption spectrometry. Anal. Chem. 1968, 40, 1682–1686. [Google Scholar] [CrossRef]
  39. Mehlich, A. Determination of P, Ca, Mg, K, Na and NH4. Short Test Methods Used in Soil Testing Division; Department of Agriculture: Raleigh, NC, USA, 1953.
  40. Murphy, J.; Riley, J.P. A modified single solution method for the determination of phosphate in natural waters. Anal. Chim. Acta 1962, 27, 31–36. [Google Scholar] [CrossRef]
  41. Paramananthan, S. Soil of Malaysia: Their Characteristics and Identification; Academy of Sciences Malaysia: Kuala Lumpur, Malaysia, 2000; Volume 1, pp. 11–125. [Google Scholar]
  42. Free, H.F.; McGill, C.R.; Rowarth, J.S.; Hedley, M.J. The effect of biochars on maize (Zea mays) germination. N. Z. J. Agric. Res. 2010, 53, 1–4. [Google Scholar] [CrossRef]
  43. Ndor, E.; Dauda, S.N.; Azagaku, E.D. Response of maize varieties (Zea mays) to biochar amended soil in Lafia, Nigeria. J. Exp. Agric. Int. 2015, 5, 525–531. [Google Scholar] [CrossRef]
  44. Mandre, M.; Pärn, H.; Ots, K. Short-term effects of wood ash on the soil and the lignin concentration and growth of Pinus sylvestris L. For. Ecol. Manag. 2006, 223, 349–357. [Google Scholar] [CrossRef]
  45. Ozolincius, R.; Buozyte, R.; Varnagiryte, K.I. Wood ash and nitrogen influence on ground vegetation cover and chemical composition. Biomass Bioenergy 2007, 31, 710–716. [Google Scholar] [CrossRef]
  46. Perucci, P.; Monaci, E.; Onofri, A.; Vischetti, C.; Casucci, C. Changes in physico-chemical and biochemical parameters of soil following addition of wood ash: A field experiment. Eur. J. Agron. 2008, 28, 155–161. [Google Scholar] [CrossRef]
  47. Costello, R.C.; Sullivan, D.M. Determining the pH buffering capacity of compost via titration with dilute sulfuric acid. Waste Biomass Valorization 2014, 5, 505–513. [Google Scholar] [CrossRef]
  48. Malaysian Agricultural Research and Development Institute (MARDI). Jagung Manis Baru, Masmadu [New Sweet Corn, Masmadu]; Malaysian Agricultural Research and Development: Serdang, Malaysia, 1993; pp. 3–5.
  49. Nelson, P.N.; Su, N. Soil pH buffering capacity: A descriptive function and its application to some acidic tropical soils. Soil Res. 2010, 48, 201–207. [Google Scholar] [CrossRef]
  50. Wei, H.; Liu, Y.; Xiang, H.; Zhang, J.; Li, S.; Yang, J. Soil pH responses to simulated acid rain leaching in three agricultural soils. Sustainability 2020, 12, 280. [Google Scholar] [CrossRef] [Green Version]
  51. Xu, R.K.; Zhao, A.Z.; Yuan, J.H.; Jiang, J. pH buffering capacity of acid soils from tropical and subtropical regions of China as influenced by incorporation of crop straw biochars. J. Soils Sediments 2012, 12, 494–502. [Google Scholar] [CrossRef]
  52. Jusop, S.; Ishak, C.F. Weathered Tropical Soils the Ultisols and Oxisols; Universiti Putra Malaysia Press: Serdang, Malaysia, 2010. [Google Scholar]
  53. Shi, R.Y.; Li, J.Y.; Ni, N.I.; Xu, R.K. Understanding the biochar’s role in ameliorating soil acidity. J. Integr. Agric. 2019, 18, 1508–1517. [Google Scholar] [CrossRef]
  54. Wiklund, J. Effects of Wood Ash on Soil Fertility and Plant Performance in Southwestern Kenya. Master’s Thesis, Swedish University of Agricultural Sciences, Uppsala, Sweden, 2017. [Google Scholar]
  55. Bang-Andreasen, T.; Nielsen, J.T.; Voriskova, J.; Heise, J.; Rønn, R.; Kjøller, R.; Hansen, H.C.; Jacobsen, C.S. Wood ash induced pH changes strongly affect soil bacterial numbers and community composition. Front. Microbiol. 2017, 8, 1400. [Google Scholar] [CrossRef]
  56. Demeyer, A.; Voundi Nkana, J.; Verloo, M. Characteristics of wood ash influence on soil properties and nutrient uptake: An overview. Bioresour. Technol. 2001, 77, 287–295. [Google Scholar] [CrossRef]
  57. Arvidsson, H.; Lundkvist, H. Effects of crushed wood ash on soil chemistry in young Norway spruce stands. For. Ecol. Manag. 2003, 176, 121–132. [Google Scholar] [CrossRef]
  58. Lim, S.S.; Choi, W.J.; Lee, K.S.; Ro, H.M. Reduction in CO2 emission from normal and saline soils amended with coal fly ash. J. Soils Sediments 2012, 12, 1299–1308. [Google Scholar] [CrossRef]
  59. Basso, A.S.; Miguez, F.E.; Laird, D.A.; Horton, R.; Westgate, M. Assessing potential of biochar for increasing water-holding capacity of sandy soils. GCB Bioenergy 2013, 5, 132–143. [Google Scholar] [CrossRef] [Green Version]
  60. Batista, E.M.; Shultz, J.; Matos, T.T.; Fornari, M.R.; Ferreira, T.M.; Szpoganicz, B.; de Freitas, R.A.; Mangrich, A.S. Effect of surface and porosity of biochar on water holding capacity aiming indirectly at preservation of the Amazon biome. Sci. Rep. 2018, 8, 1–9. [Google Scholar] [CrossRef]
  61. Laird, D.; Fleming, P.; Wang, B.; Horton, R.; Karlen, D. Biochar impact on nutrient leaching from a Midwestern agricultural soil. Geoderma 2010, 158, 436–442. [Google Scholar] [CrossRef] [Green Version]
  62. Eduah, J.O.; Nartey, E.K.; Abekoe, M.K.; Breuning-Madsen, H.; Andersen, M.N. Phosphorus retention and availability in three contrasting soils amended with rice husk and corn cob biochar at varying pyrolysis temperatures. Geoderma 2019, 341, 10–17. [Google Scholar] [CrossRef]
  63. Matin, N.H.; Jalali, M.; Antoniadis, V.; Shaheen, S.M.; Wang, J.; Zhang, T.; Wang, H.; Rinklebe, J. Almond and walnut shell-derived biochars affect sorption-desorption, fractionation, and release of phosphorus in two different soils. Chemosphere 2020, 241, 124888. [Google Scholar] [CrossRef]
  64. Monaghan, R.M.; De Klein, C.A.; Muirhead, R.W. Prioritisation of farm scale remediation efforts for reducing losses of nutrients and faecal indicator organisms to waterways: A case study of New Zealand dairy farming. J. Environ. Manag. 2008, 87, 609–622. [Google Scholar] [CrossRef]
  65. Hasbullah, N.A. Use of Clinoptilolite Zeolite to Improve Efficiency of Phosphorus Use in Acid Soils. Ph.D. Thesis, Universiti Putra Malaysia, Serdang, Malaysia, 2016. [Google Scholar]
  66. Palanivell, P. Organic and Mineral Amendments on Rice (Oryza sativa L.) Yield and Nutrients Recovery Efficiency. Ph.D. Thesis, Universiti Putra Malaysia, Serdang, Malaysia, 2016. [Google Scholar]
  67. Xu, G.; Sun, J.; Shao, H.; Chang, S.X. Biochar had effects on phosphorus sorption and desorption in three soils with differing acidity. Ecol. Eng. 2014, 62, 54–60. [Google Scholar] [CrossRef]
  68. Masulili, A.; Utomo, W.H.; Syechfani, M.S. Rice husk biochar for rice based cropping system in acid soil 1. The characteristics of rice husk biochar and its influence on the properties of acid sulfate soils and rice growth in West Kalimantan, Indonesia. J. Agric. Sci. 2010, 2, 39–47. [Google Scholar] [CrossRef] [Green Version]
  69. Etiegni, L.; Campbell, A.G. Physical and chemical characteristics of wood ash. Bioresour. Technol. 1991, 37, 173–178. [Google Scholar] [CrossRef]
  70. Ohno, T. Neutralization of soil acidity and release of phosphorus and potassium by wood ash. J. Environ. Qual. 1992, 21, 433–438. [Google Scholar] [CrossRef]
  71. Cai, Z.; Wang, B.; Xu, M.; Zhang, H.; He, X.; Zhang, L.; Gao, S. Intensified soil acidification from chemical N fertilization and prevention by manure in an 18-year field experiment in the red soil of southern China. J. Soils Sediments 2015, 15, 260–270. [Google Scholar] [CrossRef]
  72. Gondek, M.; Weindorf, D.C.; Thiel, C.; Kleinheinz, G. Soluble salts in compost and their effects on soil and plants: A review. Compost. Sci. Util. 2020, 28, 59–75. [Google Scholar] [CrossRef]
  73. Jones, D.L.; Quilliam, R.S. Metal contaminated biochar and wood ash negatively affect plant growth and soil quality after land application. J. Hazard. Mater. 2014, 276, 362–370. [Google Scholar] [CrossRef] [PubMed]
  74. Lucchini, P.; Quilliam, R.S.; DeLuca, T.H.; Vamerali, T.; Jones, D.L. Increased bioavailability of metals in two contrasting agricultural soils treated with waste wood-derived biochar and ash. Environ. Sci. Pollut. Res. 2014, 21, 3230–3240. [Google Scholar] [CrossRef]
  75. Bauder, J.W.; Brock, T.A. Irrigation water quality, soil amendment, and crop effects on sodium leaching. Arid Land Res. Manag. 2001, 15, 101–113. [Google Scholar] [CrossRef]
  76. Assis, M.R.; Brancheriau, L.; Napoli, A.; Trugilho, P.F. Factors affecting the mechanics of carbonized wood: Literature review. Wood Sci. Technol. 2016, 50, 519–536. [Google Scholar] [CrossRef]
  77. Troeh, F.R.; Thompson, L.M. Soils and Soil Fertility; Blackwell: New York, NY, USA, 2005. [Google Scholar]
  78. Asmare, M.; Heluf, G.; Markku, Y.; Birru, Y. Phosphorus Status, Inorganic Phosphorus Forms, and Other Physicochemical Properties of Acid Soils of Farta District, Northwestern Highlands of Ethiopia. Appl. Environ. Soil Sci. 2015, 2015, 748390. [Google Scholar] [CrossRef] [Green Version]
  79. Xu, G.; Zhang, Y.; Sun, J.; Shao, H. Negative interactive effects between biochar and phosphorus fertilization on phosphorus availability and plant yield in saline sodic soil. Sci. Total Environ. 2016, 568, 910–915. [Google Scholar] [CrossRef]
  80. Oburger, E.; Kirk, G.J.; Wenzel, W.W.; Puschenreiter, M.; Jones, D.L. Interactive effects of organic acids in the rhizosphere. Soil Biol. Biochem. 2009, 41, 449–457. [Google Scholar] [CrossRef]
Figure 1. Linear regression between dilute sulphuric acid added (mol H+ kg−1 sample) and pH of suspension, where asterisk (*) represent significant difference at p ≤ 0.05.
Agronomy 11 02223 g001
Figure 2. Treatments on pH of leachate over thirty days of leaching, where S1: soil only; E1: soil with ERP only; C1: 100% charcoal; C0: 0% charcoal; C7: 75% charcoal; C5: 50% charcoal; C2: 25% charcoal; A1: 100% sago bark ash; A0: 0% sago bark ash; A7: 75% sago bark ash; A5: 50% sago bark ash; A2: 25% sago bark ash.
Agronomy 11 02223 g002
Figure 3. Treatments on electrical conductivity of leachate over thirty days of leaching, where S1: soil only; E1: soil with ERP only; C1: 100% charcoal; C0: 0% charcoal; C7: 75% charcoal; C5: 50% charcoal; C2: 25% charcoal; A1: 100% sago bark ash; A0: 0% sago bark ash; A7: 75% sago bark ash; A5: 50% sago bark ash; A2: 25% sago bark ash.
Agronomy 11 02223 g003
Figure 4. Treatments on phosphorus availability in leachate over thirty days of leaching, where S1: soil only; E1: soil with ERP only; C1: 100% charcoal; C0: 0% charcoal; C7: 75% charcoal; C5: 50% charcoal; C2: 25% charcoal; A1: 100% sago bark ash; A0: 0% sago bark ash; A7: 75% sago bark ash; A5: 50% sago bark ash; A2: 25% sago bark ash.
Agronomy 11 02223 g004
Figure 5. Treatments on cumulative concentration of phosphorus in leachate over thirty days of leaching, where S1: soil only; E1: soil with ERP only; C1: 100% charcoal; C0: 0% charcoal; C7: 75% charcoal; C5: 50% charcoal; C2: 25% charcoal; A1: 100% sago bark ash; A0: 0% sago bark ash; A7: 75% sago bark ash; A5: 50% sago bark ash; A2: 25% sago bark ash.
Agronomy 11 02223 g005
Figure 6. Treatments on soil pH in potassium chloride after thirty days of leaching, where S1: soil only; E1: soil with ERP only; C1: 100% charcoal; C0: 0% charcoal; C7: 75% charcoal; C5: 50% charcoal; C2: 25% charcoal; A1: 100% sago bark ash; A0: 0% sago bark ash; A7: 75% sago bark ash; A5: 50% sago bark ash; A2: 25% sago bark ash. Means with different letter(s) indicate significant differences between treatments according to Tukey’s HSD test at p ≤ 0.05, that is, a > b > c. Bars represent the mean values ± SE.
Agronomy 11 02223 g006
Figure 7. Treatments on soil exchangeable acidity after thirty days of leaching, where S1: soil only; E1: soil with ERP only; C1: 100% charcoal; C0: 0% charcoal; C7: 75% charcoal; C5: 50% charcoal; C2: 25% charcoal; A1: 100% sago bark ash; A0: 0% sago bark ash; A7: 75% sago bark ash; A5: 50% sago bark ash; A2: 25% sago bark ash. Means with different letter(s) indicate significant differences between treatments according to Tukey’s HSD test at p ≤ 0.05, that is, a > b > c. Bars represent the mean values ± SE.
Agronomy 11 02223 g007
Figure 8. Treatments on soil exchangeable aluminium after thirty days of leaching, where S1: soil only; E1: soil with ERP only; C1: 100% charcoal; C0: 0% charcoal; C7: 75% charcoal; C5: 50% charcoal; C2: 25% charcoal; A1: 100% sago bark ash; A0: 0% sago bark ash; A7: 75% sago bark ash; A5: 50% sago bark ash; A2: 25% sago bark ash. Means with different letter(s) indicate significant differences between treatments according to Tukey’s HSD test at p ≤ 0.05, that is, a > b. Bars represent the mean values ± SE. nd: not detected.
Agronomy 11 02223 g008
Figure 9. Treatments on soil exchangeable hydrogen after thirty days of leaching, where S1: soil only; E1: soil with ERP only; C1: 100% charcoal; C0: 0% charcoal; C7: 75% charcoal; C5: 50% charcoal; C2: 25% charcoal; A1: 100% sago bark ash; A0: 0% sago bark ash; A7: 75% sago bark ash; A5: 50% sago bark ash; A2: 25% sago bark ash. Means with different letter(s) indicate significant differences between treatments according to Tukey’s HSD test at p ≤ 0.05, that is, a > b > c. Bars represent the mean values ± SE.
Agronomy 11 02223 g009
Figure 10. Treatments on soil electrical conductivity after thirty days of leaching, where S1: soil only; E1: soil with ERP only; C1: 100% charcoal; C0: 0% charcoal; C7: 75% charcoal; C5: 50% charcoal; C2: 25% charcoal; A1: 100% sago bark ash; A0: 0% sago bark ash; A7: 75% sago bark ash; A5: 50% sago bark ash; A2: 25% sago bark ash. Means with different letter(s) indicate significant differences between treatments according to Tukey’s HSD test at p ≤ 0.05, that is, a > b > c. Bars represent the mean values ± SE.
Agronomy 11 02223 g010
Figure 11. Treatments on soil total carbon after thirty days of leaching, where S1: soil only; E1: soil with ERP only; C1: 100% charcoal; C0: 0% charcoal; C7: 75% charcoal; C5: 50% charcoal; C2: 25% charcoal; A1: 100% sago bark ash; A0: 0% sago bark ash; A7: 75% sago bark ash; A5: 50% sago bark ash; A2: 25% sago bark ash. Means with different letter(s) indicate significant differences between treatments according to Tukey’s HSD test at p ≤ 0.05, that is, a > b > c. Bars represent the mean values ± SE.
Agronomy 11 02223 g011
Figure 12. Treatments on soil total phosphorus after thirty days of leaching, where S1: soil only; E1: soil with ERP only; C1: 100% charcoal; C0: 0% charcoal; C7: 75% charcoal; C5: 50% charcoal; C2: 25% charcoal; A1: 100% sago bark ash; A0: 0% sago bark ash; A7: 75% sago bark ash; A5: 50% sago bark ash; A2: 25% sago bark ash. Means with different letter(s) indicate significant differences between treatments according to Tukey’s HSD test at p ≤ 0.05, that is, a > b > c. Bars represent the mean values ± SE.
Agronomy 11 02223 g012
Figure 13. Treatments on soil-available phosphorus after thirty days of leaching, where S1: soil only; E1: soil with ERP only; C1: 100% charcoal; C0: 0% charcoal; C7: 75% charcoal; C5: 50% charcoal; C2: 25% charcoal; A1: 100% sago bark ash; A0: 0% sago bark ash; A7: 75% sago bark ash; A5: 50% sago bark ash; A2: 25% sago bark ash. Means with different letter(s) indicate significant differences between treatments according to Tukey’s HSD test at p ≤ 0.05, that is, a > b > c. Bars represent the mean values ± SE.
Agronomy 11 02223 g013
Table 1. Selected physico-chemical properties of the Bekenu Series (Typic Paleudults).
PropertyValue ObtainedStandard Range
pH (H2O)4.61 ± 0.054.6–4.9
pH (KCl)3.95 ± 0.013.8–4.0
EC (µS cm−1)35.10 ± 0.15NA
Bulk density (g cm−1)1.25 ± 0.04NA
Total carbon (%)2.16 ± 0.050.57–2.51
Total N (%)0.08 ± 0.010.04–0.17
Total P (mg kg−1)23.65 ± 1.09NA
Available P (mg kg−1)1.13 ± 0.02NA
CEC (cmol kg−1)4.67 ± 0.293.86–8.46
Exchangeable acidity (cmol kg−1)1.15 ± 0.03NA
Exchangeable Al3+ (cmol kg−1)1.02 ± 0.03NA
Exchangeable H+ (cmol kg−1)0.13 ± 0.02NA
Exchangeable K+ (cmol kg−1)0.060 ± 0.0020.05–0.19
Exchangeable Ca2+ (cmol kg−1)0.020 ± 0.0010.01
Exchangeable Mg2+ (cmol kg−1)0.22 ± 0.0030.07–0.21
Exchangeable Na+ (cmol kg−1)0.030 ± 0.0010.01
Exchangeable Mn2+ (cmol kg−1)0.010 ± 0.001NA
Exchangeable Fe2+ (cmol kg−1)1.09 ± 0.02NA
Soil textureSand (%): 71.9Sand (%): 72–76
Silt (%): 13.5Silt (%): 8–9
Clay (%): 14.6Clay (%): 16–19
Sandy loamSandy clay loam
Note: The values given are on dry-weight basis; value obtained: mean ± standard error; standard range reported by Paramanathan [41]; NA: not available; CEC: cation exchange capacity.
Table 2. Selected chemical properties of charcoal and sago bark ash.
PropertyCharcoalSago Bark Ash
pH (H2O)7.74 ± 0.029.99 ± 0.03
pH (KCl)7.31 ± 0.059.66 ± 0.02
EC (dS m−1)0.270 ± 0.0065.75 ± 0.02
Available P (mg kg−1)31.25 ± 1.1555.83 ± 1.32
Exchangeable K+ (cmol kg−1)3.67 ± 0.0623.33 ± 0.25
Exchangeable Ca2+ (cmol kg−1)11.71 ± 0.3216.77 ± 0.48
Exchangeable Mg2+ (cmol kg−1)3.37 ± 0.033.57 ± 0.03
Exchangeable Na+ (cmol kg−1)0.43 ± 0.011.51 ± 0.03
Exchangeable Fe2+ (cmol kg−1)0.150 ± 0.0030.030 ± 0.001
Note: The values given are mean ± standard error.
Table 3. Treatments evaluated in leaching study.
TreatmentSoil (kg)ERP (g)Charcoal (g)Sago Bark Ash (g)Charcoal:Ash Ratio
S11Soil only
E117.7ERP only
C1A017.751.4Charcoal only
C0A117.725.7Ash only
C1A117.751.425.7100:100
C7A717.738.619.375:75
C5A717.725.719.350:75
C2A717.712.919.325:75
C7A517.738.612.975:50
C5A517.725.712.950:50
C2A517.712.912.925:50
C7A217.738.66.475:25
C5A217.725.76.450:25
C2A217.712.96.425:25
Table 4. Summary of pH buffering capacity as affected by soil alone, amendments alone, and soil with the amendments.
Treatment CodeInitial pHpH Buffering Capacity
(mol H+ kg−1 Sample)
Regression Coefficient, R2
T15.31 ± 0.050.250.92 *
T27.76 ± 0.060.290.90 *
T39.78 ± 0.000.340.92 *
T46.51 ± 0.030.260.97 *
T56.41 ± 0.020.280.93 *
T66.65 ± 0.030.290.92 *
Note: Asterisk (*) represent significant difference at p ≤ 0.05; the values given are mean ± standard error. T1: soil only; T2: charcoal only; T3: sago bark ash only; T4: soil + charcoal; T5: soil + sago bark ash; T6: soil + charcoal + sago bark ash.
Publisher’s Note: MDPI stays neutral with regard to jurisdictional claims in published maps and institutional affiliations.

