Article

Organic Matter Composition of Digestates Has a Stronger Influence on N2O Emissions than the Supply of Ammoniacal Nitrogen

1
Department of Fertilization and Soil Matter Dynamics, Institute of Crop Science, University of Hohenheim, Fruwirthstr. 20, D-70593 Stuttgart, Germany
2
Institute for Applied Agricultural Research, Agronomy and Quality Management, Nürtingen-Geislingen University, Neckarsteige 6-10, D-72622 Nürtingen, Germany
3
Institute of Applied Crop Science, Center for Agricultural Technology Augustenberg (LTZ), Kutschenweg 20, D-76287 Rheinstetten-Forchheim, Germany
*
Author to whom correspondence should be addressed.
Agronomy 2021, 11(11), 2215; https://doi.org/10.3390/agronomy11112215
Submission received: 7 September 2021 / Revised: 12 October 2021 / Accepted: 26 October 2021 / Published: 31 October 2021
(This article belongs to the Section Soil and Plant Nutrition)

Abstract

:
Manures can be treated by solid–liquid separation and more sophisticated, subsequent approaches. These processes generate fertilizers, which may differ in composition and N2O release potential. The aim of the study was to investigate the influence of processing-related changes in digestate composition on soil-derived N2O emissions after application to soil. For that purpose, N2O emissions within the first 7 weeks after fertilization with two raw and eight processed digestates (derived from solid–liquid separation, drying and pelletizing of separated solid, and vacuum evaporation of separated liquid) were measured in the field in 2015 and 2016. Additionally, an incubation experiment was run for 51 days to further investigate the effect of subsequent solid and liquid processing on soil-derived N2O release. The results showed that, only in 2016, the separation of digestate into solid and liquid fractions led to a decrease in N2O emissions in the following order: raw digestate > separated liquid > separated solid. N removal during subsequent processing of separated solid and liquid did not significantly influence the N2O emissions after fertilization. In contrast, the concentrated application of the final products led to contradictory results. Within the solid processing chain, utilization of pellets considerably increased the N2O emissions by factors of 2.7 (field, 2015), 3.5 (field, 2016), and 7.3 (incubation) compared to separated solid. Fertilization with N-rich ammonium sulfate solution led to the lowest emissions within the liquid processing chain. It can be concluded that the input of less recalcitrant organic C into the soil plays a greater role in N2O release after fertilization than the input of ammoniacal N. Digestate processing did not generally reduce emissions but apparently has the potential to mitigate N2O emissions substantially if managed properly.

1. Introduction

Regional nutrient surpluses caused by a concentration of livestock farming represent a relevant issue worldwide. In Germany, for example, the northwest is the most affected region due to its high livestock density of about 3.5–4.1 livestock units per ha [1,2]. Biogas plants, often based on the digestion of animal manure and dedicated energy crops such as silage maize, further increase the amount of organic manures in such regions [3,4]. Moreover, the timeframe and total amount of organic fertilizer application are limited by legal regulations, such as the German fertilizer ordinance [5,6]. In addition to nitrate leaching, acidification, and eutrophication, the management of organic fertilizers is directly linked to significant gaseous N losses in the form of N2O [7,8,9,10]. Therefore, strategies are needed to either reduce livestock density or to export nutrients out of the affected regions. Due to their high water content, the transportation of liquid manures over large distances is not feasible.
An approach to facilitate the export of excess nutrients is to reduce the water content by digestate processing. This results in a marketable organic fertilizer which is worth being transported. A common processing technique is solid–liquid separation. This generates a dry-matter-rich solid fraction with a high proportion of the initial phosphorus and a liquid fraction with a high share of nitrogen and potassium [11,12]. In addition to water reduction and improved transportability, processing of digestates might have the potential to reduce climate-relevant N2O emissions via partial separation of N and organic matter [13,14,15]. When considering solid and liquid after separation, varying experimental results were reported. Whether the solid or liquid leads to higher emissions after soil application is highly dependent on the digestate feedstock and pretreatment procedure [13,16,17,18,19,20].
Previous studies (e.g., [13,16,17,18,19,20,21,22,23,24]) mainly focused on the effect of feedstocks in combination with management practices. However, no evaluation of the single steps within an entire processing chain could be found. Therefore, the main objective of the present work was to identify which processing techniques and respective products have the potential to reduce N2O emissions after soil application in comparison to the untreated digestates. Furthermore, the following aspects were addressed: (i) How does the treatment influence the composition of intermediate and final products? (ii) What is the impact of composition and treatment of digestates on N2O emissions after application to soil?
For that purpose, solid (raw digestate–separation–drying–pelletizing) and liquid processing chains (raw digestate–separation–vacuum evaporation with partial ammonia stripping) from two fully operating biogas plants were selected, and the composition and emissions after soil application of the respective intermediates and final products were measured. It was generally expected that process-related N removal and the resulting decrease in N content of digestates (solids and liquids) would contribute to lower N2O production from fertilized soils.

2. Materials and Methods

2.1. Digestate Collection and Composition

The digestates were collected at two biogas plants, which processed liquid and solid fractions after separation, respectively. The feedstocks of the first biogas plant were cattle manure and pig slurry, dedicated energy crops such as silage maize and sunflower (400 g·kg−1 total fresh matter, FM), pomace and grape marc (200 g·kg−1 FM), and poultry manure (50 g·kg−1 FM). In the second plant, pig slurry and cattle manure were digested with silage maize (approximately 220 g·kg−1 FM), grass silage (70 g·kg−1 FM), and cereal silage and grist (180 g·kg−1 FM).
In both biogas plants, raw digestate (RD1 and RD2, respectively) was separated into a solid (SS1 and SS2) and a liquid (SL1 and SL2) fraction using a screw press separator (pore size 0.5 mm). After the separation, plant 1 subsequently treated the solid. Biogas plant 2 further processed the solid and liquid, but only the liquid products were considered in this study.
In plant 1, the separated solid (SS1) was dewatered to about 80% dry matter (DM) content (dry solid, DS1) in a solar greenhouse drier and subsequently pelletized (without addition of binding agents). The final pellets (P1) had a diameter of 6 mm and an average length of 14 mm.
In plant 2, water was removed from the separated liquid (SL2) in a two-step vacuum evaporator. The evaporation took place at 65 °C and 250 hPa. The low pressure induced an evaporation of water, ammonia (NH3), and other gases. Next, NH3 was removed from the exhaust steam in a sulfuric-acid-containing washing column to produce ammonium sulfate (ammonium sulfate solution, ASS2). In a second vacuum vessel, the remaining liquid digestate was further dewatered, and a concentrate (CC2) was produced.
The chemical and physical characteristics of raw and treated digestates were analyzed according to VDLUFA [25] and van Soest and Wine [26], and the characteristics are shown in Table 1 and Table 2. In addition, the calculated fractions of soluble materials, hemicellulose, and cellulose can be found in Table S1.
Dry matter content was measured by drying at 105 °C until constant weight. The pH of solid digestates was measured in 10−2 M CaCl2 solution, while, in the case of the liquids, the original substance was used. The total C content was determined by elemental analysis (vario MAX CN, Elementar Analysensysteme, Hanau, Germany). Total nitrogen (Nt) and NH4+–N contents were measured using the Kjeldahl method and by steam distillation with titration, respectively.

2.2. Experimental Site

A field trial was carried out in spring 2015 and 2016 at the experimental station “Heidfeldhof” (48°42′40″ N, 9°11′45″ E; 389 m a.s.l.). The mean annual air temperature was 10.2 °C and the total annual precipitation was 628 mm for the period 2007–2016. During the measuring period, the air temperature averaged 15.0 °C (2015) and 11.4 °C (2016). Total precipitation was 110 mm in year 1 (27 April–12 June 2015) and 122 mm in year 2 (11 April–30 May 2016).
The experimental fields were located close to each other (approximately 50 m distance), with almost similar soil characteristics (Table 3). Soil type was a Haplic Luvisol from periglacial loess.

2.3. Field Experiment

The field trial was set up on fallow land (between crop rotations) in order to avoid changes in N turnover resulting from plant growth and N uptake. It represented a randomized complete block design with four replicates. We tested two raw and eight processed digestates and an unfertilized control. A total of 44 microplots with a size of 2.25 m2 each were established and used for the statistical analyses. The fertilizers were applied once at the beginning of the experiment at a rate of 170 kg Nt·ha−1 (the maximum amount of applied N in the form of organic fertilizer as regulated by the German fertilizer ordinance in 2015 [27]; total amounts are presented in Table S2). N2O emissions after digestate application were measured using the closed chamber method [28]. Each fertilizer was incorporated in a small furrow within the base ring (0.3 m inner diameter) of the chamber. After closing the chamber, four gas samples were taken from the chamber’s atmosphere periodically (15 min intervals) and transferred into 20 mL pre-evacuated glass vials with a syringe.
During the gas measurements, the air temperature inside the chamber was determined. Samples were collected three times a week within the first 2 months after fertilization between 9:00 a.m. and 12:00 p.m., since this time period covers the mean daily soil temperature. Thus, biases during extrapolation of flux rates to daily fluxes due to diurnal soil temperature variations were minimized [29].
After each gas sampling, soil moisture (TDR sensor, FP/mts, Easy Test, Institute of Agrophysics, Polish Academy of Science, Poland), soil temperature (10 cm depth), and air temperature were determined. To verify the volumetric measurement of soil moisture, the gravimetric soil water content was additionally analyzed by collecting 10 random soil samples of the top soil and drying them at 105 °C until constant weight. At the beginning of the experiments (27 April 2015 and 11 April 2016, respectively), stainless-steel cylinders (100 mL) were used to measure the bulk density of the Ah horizon. As a function of the bulk density, the current water-filled pore space (WFPS) was calculated as described by Ruser et al. [30]. The mineral nitrogen (Nmin) content of the topsoil was determined colorimetrically after extraction of a soil aliquot with 0.5 M K2SO4 solution (Continuous Flow Analyzer, AA3 HR; SEAL Analytical, Inc., Norderstedt, Germany). The main physical and chemical characteristics of the soil, such as soil texture and Corg and N content, are shown in Table 3.

2.4. Incubation Experiment

For the incubation experiment, the following digestates were compared: solid after separation (SS1), dried (DS1) and pelleted digestates (P1), raw digestate (RD2), liquid after separation (SL2), concentrate (CC2), and untreated control (control). The setup was a completely randomized design with four replicates. For comparison with the field investigation, soil was taken from an area next to the 2016 field trial. It was obtained from the Ap horizon, sieved ≤4 mm, and air-dried prior to the experiment. Physical and chemical soil characteristics are shown in Table 3.
A mixture of digestate and soil was incubated in 2.5 L glass jars in a climate chamber at 20 °C for 51 days (in the dark). Each jar contained 700 g air-dried soil, mixed with the respective amount of organic fertilizer equivalent to a total of 170 kg Nt·ha−1 (45.8 mg Nt per glass jar). At the beginning of the incubation, distilled water was added to adjust the soil water content to 60% water-holding capacity (equal to ~50% WFPS, [30]). This ensured the development of aerobic conditions in the soil and was in the range of the field trials, as well as that reported in previous literature [31]. It was chosen in order to simplify the comparison between the results obtained in both experiments. A 20 mL beaker glass was filled with distilled water and set into each glass jar to avoid potential water losses as a result of soil evaporation during the experiment. The glass jars were equipped with a PVC lid and closed airtight. A bulkhead tube fitting was fixed in the middle of the lids and closed with a septum according to the closed chamber method previously outlined. To ensure aerobic conditions during incubation, the jars were opened daily for aeration. Throughout the first 2 weeks, gas samples were taken once a day, whereas, during the rest of the experimental period, the sampling interval was reduced to once a week. For measuring the N2O flux rates, four samples were collected from the jar’s headspace at 15 min intervals. Before taking the first gas sample, the glass jars were opened for aeration. To avoid low pressures during sampling, 150 mL of N2 was injected into each jar. The collected samples were kept in gas vials until the analysis was performed.

2.5. Trace Gas Analysis and Flux Rate Calculation

The analysis of the gas samples was performed using a gas chromatograph (GC 450, Bruker Daltonik, Bremen, Germany) coupled with an autosampler (GX-281, Gilson, Limburg, Germany). Further details on the GC measurements can be found in Petrova et al. [32].
The calculation of flux rates took into account N2O concentration of the four gas samples (ppb), air temperature (°C), covered soil area (m2), and volume (L) of the chamber headspace. While, for the field experiment, the volume of the headspace was equivalent to the internal volume of the closed chamber, for the incubation jars, it was calculated differently. The sum of actual headspace (above soil surface), 150 mL N2 injection, and air-filled pore space in the soil formed the total air volume. The N2O fluxes were calculated using the R-Package “gasfluxes” [33,34].

2.6. Statistical Analysis

The datasets were statistically analyzed using the software SAS (v 9.4). Residuals were tested for normality and homogeneity of variance. If required, data were logarithmically transformed prior to analysis to fulfil the pre-requirements. For estimating the effect of digestate treatment on cumulative N2O emissions, a one-way ANOVA was performed for each experimental year and for both experiments separately. This model used data of 44 experimental units. Here, the digestate treatment acted as a main independent variable. Additionally, the significant differences among the treatments were calculated using a Tukey HSD test (p ≤ 0.05). Differences were presented using a letter display [35]. If transformed data were analyzed, means were back-transformed for presentation purpose only. In this case, standard errors were back-transformed using the data methods. Furthermore, two linear regression models were run to quantify the effect of C:N or NH4+–N:Nt of digestates on the cumulative N2O emissions. Biogas plant was used as a dummy variable. To test the effect of environmental variables (air and soil temperature, rainfall, and WFPS) on the N2O fluxes, a stepwise multiple regression (forward procedure, F to enter: 4.000, F to remove: 3.900) was conducted for each combination of year and digestate.

3. Results

3.1. Field Experiment

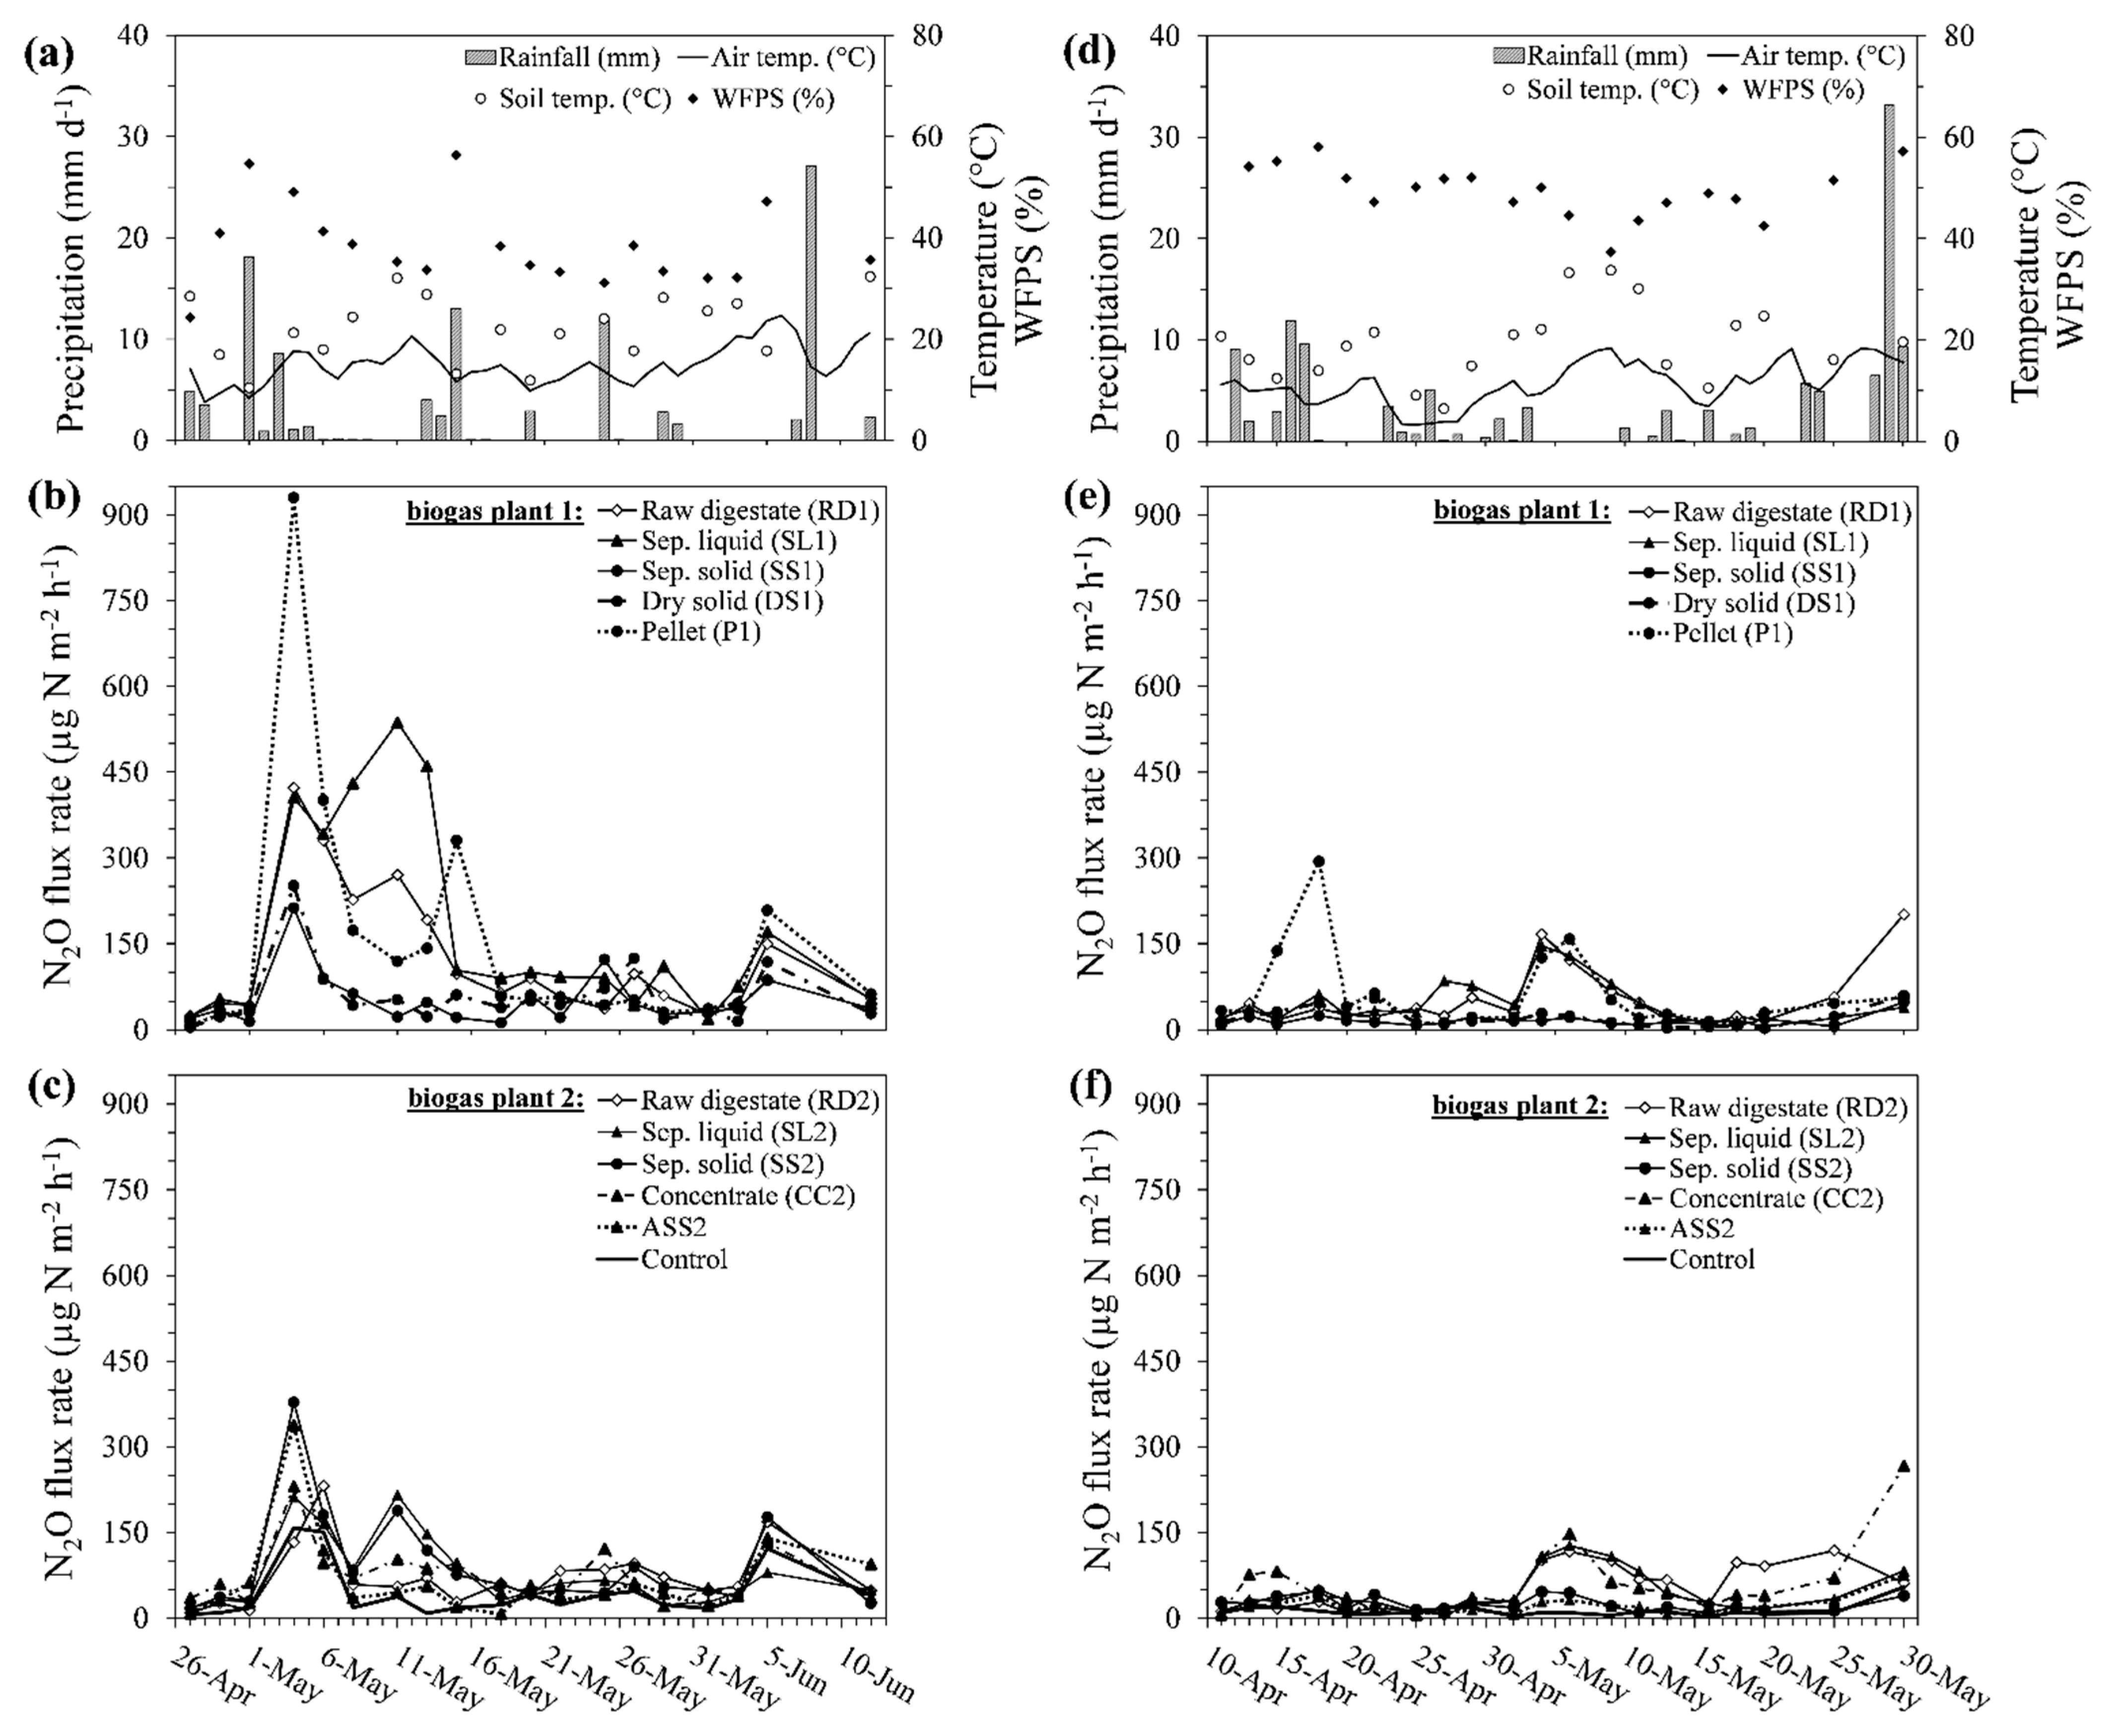
3.1.1. Weather Conditions in 2015

Within the first measuring period, the main rainfall events were in weeks 1, 3, 5, and 7 with total amounts of precipitation ranging between 16 and 36 mm per week (Figure 1a). Air temperature (2 m height) varied between 8 and 25 °C, whereas soil temperature (10 cm depth) ranged between 10 and 32 °C (Figure 1a). The highest soil moisture contents were associated with rainfall events and accounted for 55% and 56% WFPS in the first and third weeks of the measurements (Figure 1a).

3.1.2. Daily N2O Fluxes in 2015

In 2015, the N2O flux rates ranged between 4 (DS1, 27th April) and 930 µg N2O–N·m−2·h−1 (P1, 4th May) (Figure 1b,c). The highest flux was determined 1 week after fertilizer application within the first period of steady rainfall (36 mm in total, 27 April–3 May 2015) (Figure 1b). An increase in flux rates was also observed in the other treatments, including the control.
At the beginning of week 3, air temperature rose by 5 °C. The separated liquid of both biogas plants showed increasing flux rates, which averaged 537 (SL1) and 216 µg N2O–N·m−2·h−1 (SL2). A similar pattern was also found in plots treated with RD1 and SS2. At the end of week 3, the next rain event occurred, followed by a second N2O peak in P1. Furthermore, air and soil temperature dropped and WFPS increased to 56%. Despite additional rainfall events during the following 2 weeks, N2O fluxes remained low. During the sixth experimental week, flux rates increased again in all treatments before dropping to the baseline level in week 7.
The stepwise multiple regression indicated a significant effect of the environmental conditions on the mean N2O fluxes (air temperature: r2 = 0.36, p < 0.05 (independent variable entered in step 1) and WFPS: r2 = 0.66, p < 0.05 (independent variable entered in step 2)). It can be noted that 27–65% of the N2O variability was predicted by differences in air temperature among the sampling dates (Table 4). With the exception of RD1, SL1, P1, and SL2, N2O fluxes were also affected by soil temperature. In these three treatments, an additional effect of the WFPS on N2O release was found.

3.1.3. Weather Conditions in 2016

Compared to year 1, the second observation period was characterized by a higher precipitation (122 mm) and lower mean air temperature, which ranged between 3 and 18 °C (Figure 1d). The soil temperature fluctuated between 7 and 33 °C (Figure 1d). The water-filled pore space reached two main peaks in the beginning of the experiment (58% WFPS, 18 April) and on the last measurement day (57% WFPS, 30 May).

3.1.4. Daily N2O Fluxes in 2016

In 2016, all treatments showed lower N2O fluxes than in 2015 (Figure 1e,f). One week after fertilization, the highest flux rate (294 µg N2O–N·m−2·h−1) was measured in P1 (Figure 1e). It was observed in combination with the highest WFPS peak, which occurred after total rainfall of 36 mm and a temperature drop to 7 °C within the first experimental week.
During week 4 (2–8 May), a second significant increase in flux rates was observed in the treatments RD1, SL1, P1 and RD2, SL2, CC2 (Figure 1e,f). In addition, a continuous temperature rise and a decrease in WFPS were measured (Figure 1d). After the next heavy rain (at the end of week 7), N2O fluxes in all treatments increased once again with exception of RD2.
In contrast to the results in year 1, the stepwise multiple regression indicated that weather conditions had a lower effect on the mean N2O fluxes during 2016 (temperature: r2 = 0.19, p < 0.05 (independent variable entered in step 1 of stepwise regression) and WFPS: r2 = 0.46, p < 0.05 (independent variable entered in step 2)). The N2O fluxes measured in untreated control, SS1, DS1, and ASS2 were partly predicted by daily rainfall (Table 5). In plots treated with SL2, air temperature showed an effect on N2O production in the soil. Furthermore, a significant relationship between soil temperature and N2O flux rates, as well as between WFPS and N2O flux rates, was observed in the treatments RD1 and CC2. In the treatments SL1, P1, and SS2, weather conditions did not contribute to the variability of the flux rates.

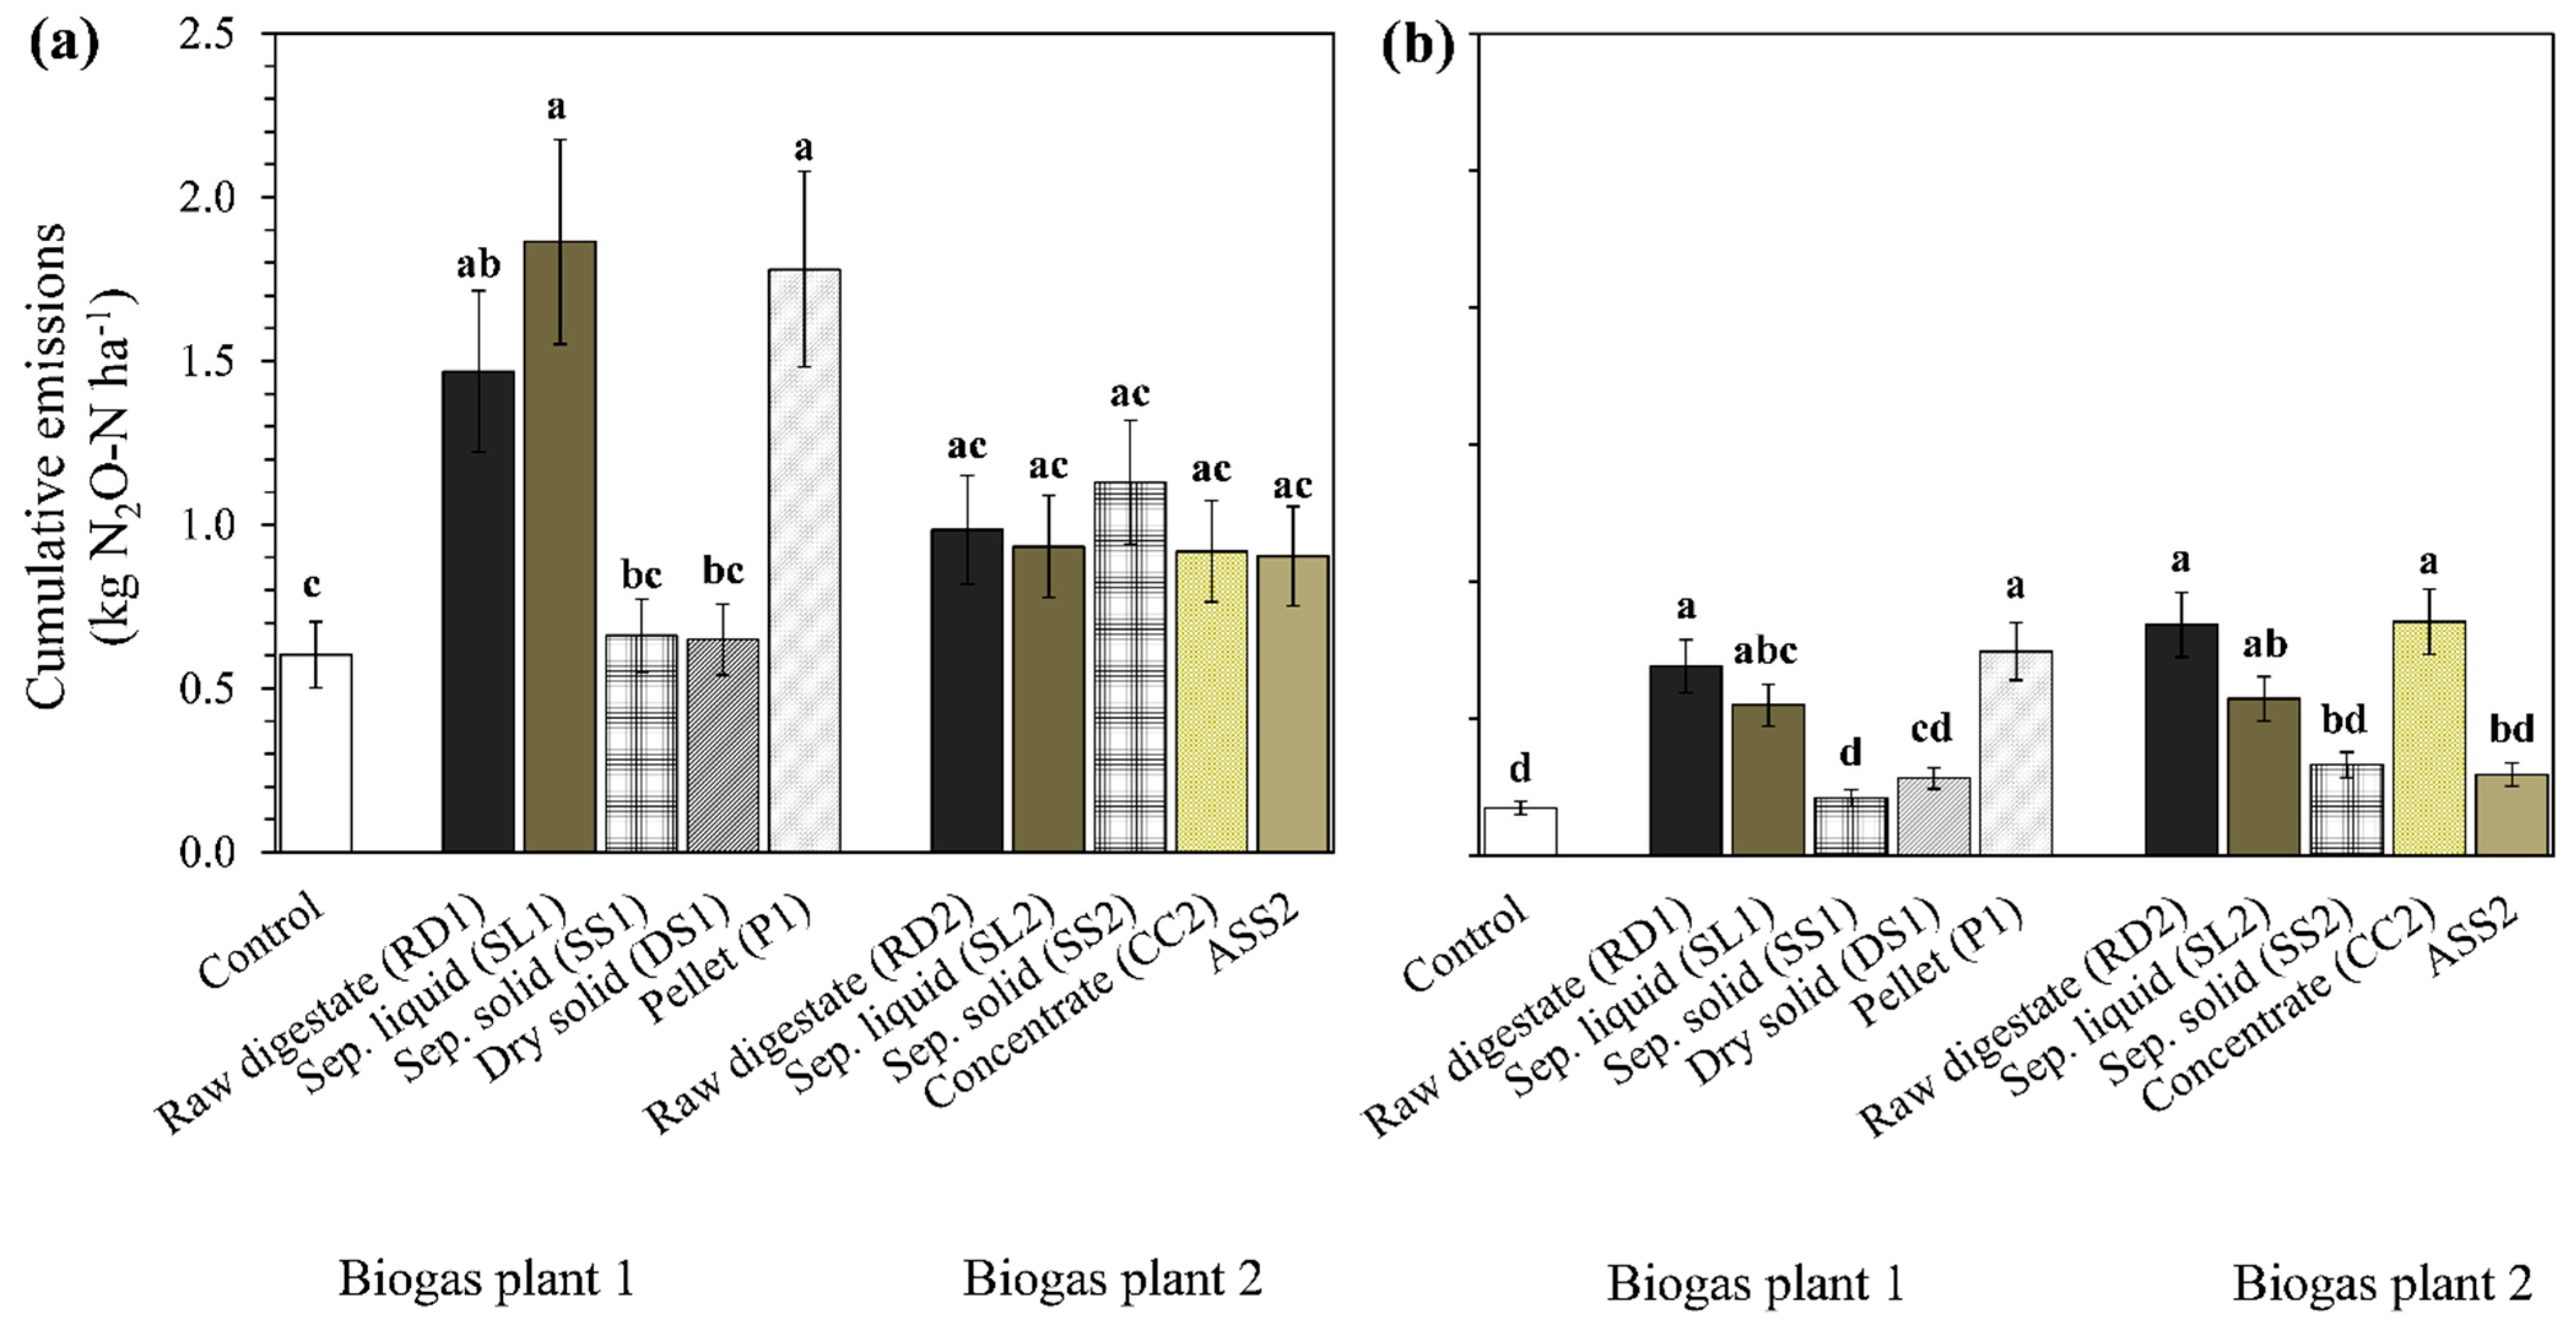
3.1.5. Cumulative N2O Emissions

The average cumulative N2O emissions in year 1 were significantly (p < 0.05) higher than in year 2 (Figure 2a,b). This effect was also observed in the untreated control, which emitted almost 70% less in 2016 compared to 2015.
Concerning biogas plant 1 (solid processing chain) in both experimental years, the treatments raw digestate (RD1), separated liquid (SL1), and pellet (P1) showed higher cumulative emissions than the solids SS1 and DS1. In 2015, the separation of raw digestate (RD1) led to a slight increase in N2O emissions after application of the subsequent liquid fraction (SL1). This was not the case in the second experimental year. After utilization of the separated liquid, 0.2–0.7% of applied Nt was released as N2O. In terms of the further processing of separated solid, increasing cumulative emissions were determined especially after pellet (P1) application. On average, they were equivalent to 0.05 (dry solid, DS1) and 0.5% of applied Nt (P1), respectively.
Within biogas plant 2 (liquid processing chain), the differences in digestate composition did not significantly influence the cumulative N2O emissions in 2015 (Figure 2a). In 2016, SL2 and SS2 resulted in lower emissions (0.2–0.09% of applied Nt) when compared to RD2 (Figure 2b). Regarding the subsequent processing of SL2, the cumulative emissions increased after applying the N-depleted concentrate (0.4% of applied Nt) and decreased after ASS2 utilization (0.07% of applied Nt).
Within biogas plant 1, N2O emissions were negatively correlated to the C:N ratio of the digestates (2015: r2 = 0.71, p < 0.05; 2016: r2 = 0.64, n.s.), while, in plant 2, this effect could not be verified (data not shown). Concerning the influence of the fertilizer NH4+–N:Nt ratio on the N2O emissions, no correlation was found during both observation periods.

3.2. Incubation Experiment

3.2.1. Daily N2O Fluxes

During the first week of incubation, the N2O release increased in all fertilizer treatments (Figure 3). The highest N2O flux rate (679 µg N2O–N·m−2·h−1) was determined 3 days after fertilization in the pellet treatment of biogas plant 1 (P1, Figure 3a). Concerning the liquids of plant 2, SL2 and CC2 showed the first significant N2O peaks on day 4 followed by a second small increase in SL2 on day 8 (Figure 3b). During the next 6 weeks, the flux rates remained on a low level in all treatments of both biogas plants. Additional N2O peaks were measured in SS1 (75 µg N2O–N·m−2·h−1, day 16), DS1 (89 µg N2O–N·m−2·h−1, day 25) and SL2 (58 µg N2O–N·m−2·h−1, day 44).

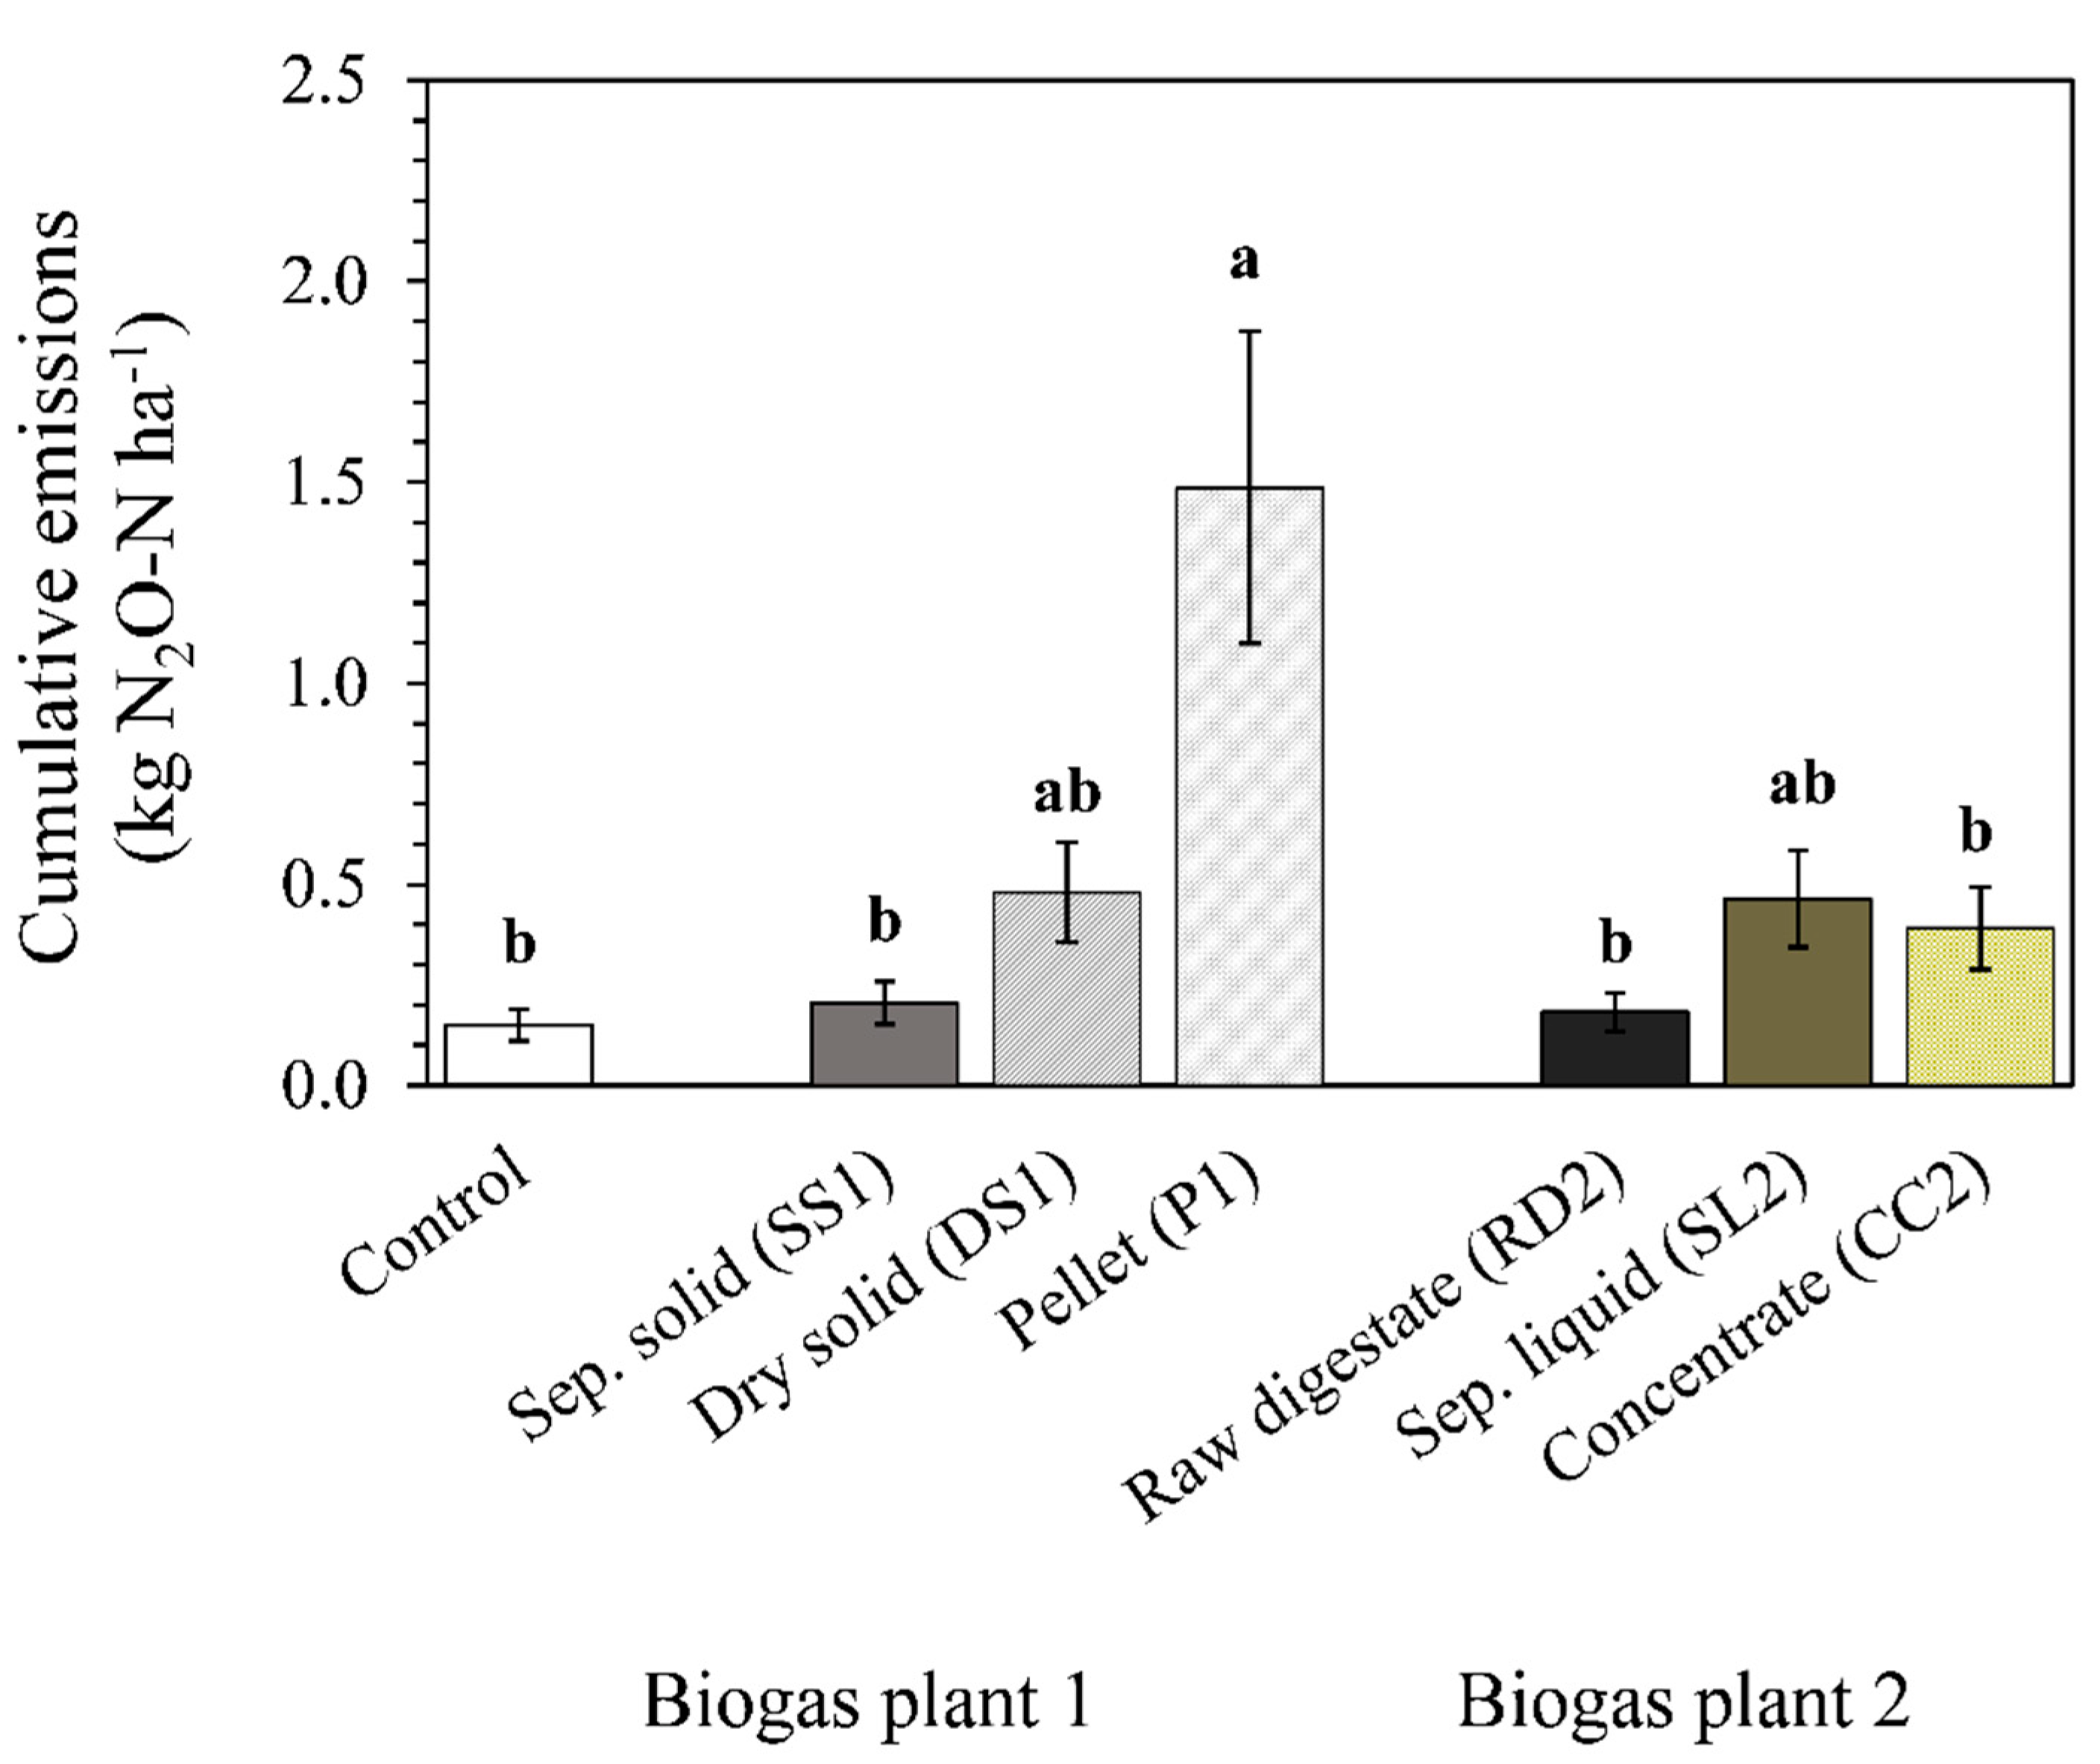
3.2.2. Cumulative N2O Emissions

The subsequent processing of solid significantly affected N2O emissions. The highest cumulative N2O emission during the whole incubation period (1.5 kg N2O–N·ha−1 on average) was determined in the pellet treatment (P1) and corresponded to 0.8% of applied Nt (Figure 4). Lower cumulative emissions (0.03 and 0.2% of applied Nt) were observed when separated and dry solid (SS1 and DS1) were utilized. Concerning the liquid processing (biogas plant 2), treatments showed no significant effect on the N2O release. The application of raw digestate (RD2) caused the lowest cumulative emissions within the plant (0.18 kg N2O–N·ha−1 or 0.02% of applied Nt), which did not differ significantly from those of the untreated control (0.15 kg N2O–N·ha−1). The post-treatments SL2 and CC2 showed slightly higher cumulative emissions than RD2 and released 0.2% (SL2) and 0.14% of applied Nt (CC2), respectively.
A strong negative correlation (r2 = 0.96, p < 0.05) between the cumulative emissions and the C:N ratio of the digestates was found within biogas plant 1. For plant 2, the C:N ratio did not show any effect on the N2O release. Furthermore, the N2O emissions were not affected by the NH4+–N:Nt ratio of digestates (data not shown).

4. Discussion

4.1. General Factors Influencing the N2O Release

In the current study, the field application of raw or treated digestate caused a temporary increase in soil N2O emissions. Although different feedstocks and processing approaches were used in both biogas plants, the resulting emissions of corresponding products did not differ significantly in most cases. It is assumed that, in our work, the environmental conditions, especially soil moisture and temperature, were of major importance and mostly overlaid digestate composition-related effects. During the first experimental year, warmer conditions with relatively high precipitation favored N2O production and release. Increasing fluxes after fertilizer application and in connection with soil wetting (i.e., rainfall) (Figure 1) have already been reported in literature [22,36,37,38,39]. In accordance with Hayakawa et al. [22] and Häfner et al. [40], the highest N2O peaks were observed within the first rainfall event (week 1). Hayakawa et al. [22] assumed denitrifying activity as the main driver, since they measured a simultaneous increase in CO2 release. The simultaneous CO2 release was also noted by Häfner et al. [40], who stated that at least part of the emitted CO2 originates from digestate carbonate C, indicating that such a CO2 release cannot only be assigned to the decomposition of organic matter. In the present study, the N2O release directly after fertilization might have been a result of nitrification followed by denitrification, which was triggered by the high initial NH4+ content of digestate. On the other hand, the supply of easily degradable organic C and ammoniacal N with the digestates might have further promoted denitrification by (i) providing electrons as reduction equivalents [41], and (ii) stimulating O2 consumption and consequently leading to more anoxic conditions [21,42,43,44].
The subsequent peaks in N2O fluxes determined during the following weeks can be partly associated with further rainfall events, which was also described in previous studies [40,45,46,47]. During rather dry periods organic decomposition was reduced [48]. Subsequent rainfall induced soil moisture content which favored mineralization of residual organic molecules derived from digestates [48,49]. It provided labile N and C for denitrifying bacteria. Thus, denitrification was promoted and is assumed to be the main source for the N2O production. Measurements of WFPS during the relevant N2O peaks (WFPS of 55–58%, Figure 1a,d) also indicate that nitrification and denitrification occurred simultaneously [50]. It can be concluded that weather conditions affected the emissions mainly immediately after digestate application and their influence decreased with time.

4.2. N2O Emissions Affected by Changes in Digestate Composition Due to Processing

4.2.1. Solid–Liquid Separation

Generally, the application of the same amount of Nt as separated solid or liquid led to similar or lower emissions than the utilization of raw digestate. This can be explained by the partial separation of two important factors: organic C (solid) which supplies electrons during nitrate reduction and ammoniacal N (liquid) which serves as substrate for combined nitrification–denitrification [13]. If the actual N partition due to the solid–liquid separation into single fractions (12% separated solid, 88% separated liquid) [51] is taken into account, the cumulative N2O emissions from both fractions added up to 70–95% of the value of raw digestates in most cases. These results are slightly higher than those of Askri et al. [13] who reported cumulative N2O emissions from both separated products of up to 50% of raw digestate. Hence, it can be concluded that solid–liquid separation potentially reduces the overall N2O emissions after field application due to a partial separation of mineral N and organic C. Therefore, in untreated digestates, the interaction of these two compounds seems to boost the emissions.
Concerning the comparison between the separated products (liquid and solid) within each plant, the lower cumulative emissions after application of the solid fraction were in line with the previous literature [16,17]. The solid was characterized by a higher total C content, higher amounts of recalcitrant fractions, and a lower content of mineral N than raw digestate (Table 1 and Table 2). The mentioned characteristics mainly result from processing and subsequent gaseous N losses during storage of the solid fraction [10,52]. During anaerobic digestion, a shift in particle size distribution toward larger and more recalcitrant particles takes place [53]. The solid–liquid separation of digestate removes further solids (>0.5 mm) and allocates most of the NH4+ to the liquid fraction (Table 1). The following storage of the separated solid further increases the proportion of large to small particles due to preferred biological decomposition of the smaller ones [54] and reduces the NH4+ content due to N immobilization and gaseous N losses (NH3 volatilization, denitrification) [52]. As a result, the solid contains less soluble compounds, especially mineral N (Table 1 and Table S1). Additionally, the larger particles are more resistant to degradation and, consequently, the O2 consumption is probably reduced [12,55] due to the lower C mineralization. Both lower substrate availability (N as NH4+) and higher aeration likely reduced the N2O release from denitrification after field application. Within 7 weeks, the cumulative N2O emissions in the solid treatment were 30–100% of the raw digestate (Figure 2a,b). This indicates the potential of separated solid to reduce the emissions after application compared to the precursor, as also reported in previous studies [15,56]. However, a concluding statement about the overall greenhouse gas reduction potential should also consider N losses, which might occur during processing and storage [10], as well as methane and carbon dioxide emissions.

4.2.2. Subsequent Processing of Separated Liquid

In contrast to our initial assumption, the N removal during subsequent processing of separated liquid did not clearly affect the N2O emissions after application of the respective products.
When comparing separated liquid with its partially dewatered concentrate post treatment, no significant effect was found (Figure 2 and Figure 4), although separated liquid had at least a threefold higher NH4+ content (based on total FM) and a lower C:N ratio. Since the proportion of recalcitrant fractions, such as lignin, was lower in concentrate (Table 2), it can be assumed that the presence of degradable C influenced bacterial growth and activity and, thus, triggered the N2O emissions. The addition of labile C can also induce N2O emissions derived from soil mineral N [47,57,58], which might have enhanced this effect in the case of concentrate (Figure 2b). Furthermore, a part of initial labile N applied with separated liquid was probably immobilized by soil microflora immediately after fertilization [59], which mitigated the total amount of N2O emitted from this treatment. These results generally suggest that the supply of ammoniacal N via liquid digestates is less relevant for the emissions after field application. This effect was also shown in the case of ammonium sulfate treatment (ASS2).
The lower emissions observed in ASS2 (year 2, field experiment) might have been a result of the negligible C supply compared to the concentrate. Moreover, a short-term NH3 volatilization probably occurred directly after soil application of ASS2 [60,61,62,63,64], which reduced the amount of NH4+ added to soil and available for N2O production. A reduced availability of introduced mineral N and consequently low N2O release can also be attributed to partial N immobilization during the initial experimental phase, as reported by Fangueiro et al. [65]. Although NH3 volatilization and N immobilization were not measured in the present work, it is assumed that the absence of C in ASS2 was the main reason for the low N2O emissions observed in the second year. During year 1, weather conditions (higher temperature and relatively high precipitation) probably overlaid this effect.

4.2.3. Further Processing of Separated Solid

Concerning the solid processing chain, the significant reductions in N2O emissions after application of the intermediate products (separated solid and dried solid, both low in ammoniacal N) compared to raw digestate underlined, once again, the importance of simultaneous substrate availability (N as NH4+) in the presence of degradable organic C. Even though considerable amounts of solids (and organic matter) were applied to the soil in the separated solid and dried solid treatments (Table S2), N2O emissions were still limited by the availability of NH4+ and did not differ significantly from the control. Between these two solids, emissions were also not significantly different. This result was not in line with the finding of Askri et al. [13] who reported a fourfold increase in N2O emissions after fertilization with dried solid. However, since they assumed that the mineralization of N already present in the soil was of higher importance for the N2O production than the introduction of additional mineral N via fertilizer, the discrepancies between both studies could be explained by soil-related effects, such as soil type, characteristics, and nutrient level. Another reason for their findings could be an elevated substrate biodegradability, which would favor microbial growth and activity.
In general, by removing water from the separated solid, a dried fertilizer with similar total C content, lower NH4+ concentration, and higher soluble material load is produced (Table 1 and Table S1). In the present study, these changes led to a slightly higher but not significant N2O release after application compared to the separated solid (Figure 2 and Figure 4). The lower share of recalcitrant fractions in the dried solid (Table 1 and Table 2) provides some indications for consecutive changes in the composition of the organic matter during the drying process [66,67,68,69,70]. Consequently, it can be concluded that, in the case of dried solid, the addition of easily degradable C in combination with soil-derived NO3 triggered the N2O production and release. This notion is consistent with previous findings, based on experiments with 15N-labeled manures [40,47,57,58]. It highlights the complexity of the presented issue and the importance of additional determination of the responsible N source. Additionally, the interaction among soil parameters, added organic matter fractions, and weather conditions should be taken into consideration.
The high N2O emissions observed after pellet application (Figure 2 and Figure 4) are in accordance with the results of Hayakawa et al. [22], who compared poultry manure with its pelleted post-treatment. In general, the strong increase in temperature during pelletizing affects the properties of organic compounds and creates constant inner microsites [32,71,72,73,74]. According to Petrova et al. [32], the water addition to the pellet activated the decomposition of its organic matter by indigenous microflora. Consequently, an enhanced microbial O2 consumption favored the development of anaerobic microsites inside the pellet and, thus, stimulated denitrification. In addition, the increase in soil NO3 content after pellet application measured by Hayakawa et al. [22] indicated a probable nitrification at the soil–pellet interface. Since the temporal changes in soil NO3 content were not observed in the present study, denitrification inside the pellets was probably the main emission driver. It seems that concentrated application of organic manures, either in the form of pellets or via fertilizer injection [42,75,76], results in a strong increase in N2O emissions from the soil. It was shown that both the composition of organic manure and the interaction between applied manures and soil strongly affect N2O emissions.

5. Conclusions

The present study showed that, aside from environmental conditions, it is not possible to draw general conclusions regarding how digestate composition influences the processes driving the N2O emissions after fertilization. For example, the N removal during further processing of separated solid and liquid does not affect the emissions after application of the respective products. More relevant for N2O production and release are the strong interactions between digestate composition, O2 consumption triggered by decomposition of applied C, nitrification of fertilizer mineral N, and denitrification induced by added C and soil mineral N.
When considering the different processing techniques, it can be concluded that separation of raw digestate has the potential to reduce N2O emissions after soil application. This reduction potential is also true for the dried separated solid. Additionally, separated solid and dried solid can outperform a mineral fertilizer, such as ammonium sulfate, with respect to soil-derived N2O emissions. However, pelletizing of the dried product stimulates water-induced denitrifying activity inside the pellet body and results in a dilemma. Much higher N2O emissions after soil application counteract positive aspects such as excellent storability and transportability properties. Regarding the utilization of different liquid fractions (concentrate and ammonium sulfate), further field and laboratory experiments are recommended to better understand the interactions between the processes driving N2O release after fertilization. Last but not least, future assessments of digestate post-treatments should consider covering the whole digestate value chain, including N2O and other emissions during processing, storage, and field application.

Supplementary Materials

The following are available online at https://www.mdpi.com/article/10.3390/agronomy11112215/s1: Table S1. Organic carbon composition of tested digestates. Contents of soluble materials, hemicellulose, and cellulose were calculated from detergent fiber analysis; Table S2. Amount of fresh matter (FM), organic carbon (Corg), and ammonium nitrogen (NH4–N) equivalent to 170 kg Nt·ha−1 applied as digestates.

Author Contributions

Conceptualization, I.P.P. and K.M.; methodology, I.P.P. and K.M.; formal analysis, I.P.P.; investigation, I.P.P.; resources, K.M.; data curation, I.P.P.; writing—original draft preparation, I.P.P.; writing—review and editing, C.P. and K.M.; visualization, I.P.P.; supervision, C.P. and K.M.; project administration, C.P. and K.M.; funding acquisition, C.P. and K.M. All authors read and agreed to the published version of the manuscript.

Funding

This research was funded by Fachagentur Nachwachsende Rohstoffe e.V., grant number 22402312. The article processing charge was funded by the Baden-Württemberg Ministry of Science, Research, and Culture and the Hochschule für Wirtschaft und Umwelt Nürtingen-Geislingen in the funding program Open Access Publishing.

Acknowledgments

The authors would like to thank the student assistants for the field work, as well as Charlotte Haake, Heidi Zimmermann, and Hinrich Bremer, for continuous technical assistance. Furthermore, a special thanks goes to our colleague, Jens Hartung (Department of Biostatistics, 340c), for the extensive and kind support during the statistical analyses.

Conflicts of Interest

The authors declare no conflict of interest. The funders had no role in the design of the study; in the collection, analyses, or interpretation of data; in the writing of the manuscript, or in the decision to publish the results.

References

  1. Bäurle, H.; Tamásy, C. Regionale Konzentrationen der Nutztierhaltung in Deutschland. Mitteilungen/Institut für Strukturforschung und Planung in Agrarischen Intensivgebieten-Universität Vechta 2012, 79, 1–89. [Google Scholar]
  2. Tamásy, C. Intensivierung der Landwirtschaft im Oldenburger Münsterland. Standort 2014, 38, 203–207. [Google Scholar] [CrossRef]
  3. Häußermann, U.; Bach, M.; Klement, L.; Breuer, L. Stickstoff-Flächenbilanzen für Deutschland mit Regionalgliederung Bundesländer und Kreise—Jahre 1995 bis 2017: Methodik, Ergebnisse und Minderungsmaßnahmen No. 131; Umweltbundesamt: Dessau-Roßlau, Germany, 2019. [Google Scholar]
  4. Häußermann, U.; Klement, L.; Breuer, L.; Ullrich, A.; Wechsung, G.; Bach, M. Nitrogen soil surface budgets for districts in Germany 1995 to 2017. Environ. Sci. Eur. 2020, 32, 109. [Google Scholar] [CrossRef]
  5. Council of the European Union. Council Directive of 12 December 1991 concerning the protection of waters against pollution caused by nitrates from agricultural sources (91/676/EEC). Off. J. Eur. Commun. 1991, 1–8. [Google Scholar]
  6. DüV. Verordnung über die Anwendung von Düngemitteln, Bodenhilfsstoffen, Kultursubstraten und Pflanzenhilfsmitteln nach den Grundsätzen der guten fachlichen Praxis beim Düngen. Bundesgesetzblatt 2017, 1, 1305. [Google Scholar]
  7. Amon, B.; Kryvoruchko, V.; Amon, T.; Zechmeister-Boltenstern, S. Methane, nitrous oxide and ammonia emissions during storage and after application of dairy cattle slurry and influence of slurry treatment. Agric. Ecosyst. Environ. 2006, 112, 153–162. [Google Scholar] [CrossRef]
  8. Chantigny, M.H.; MacDonald, J.D.; Beaupré, C.; Rochette, P.; Angers, D.A.; Massé, D.; Parent, L.-É. Ammonia volatilization following surface application of raw and treated liquid swine manure. Nutr. Cycl. Agroecosyst. 2009, 85, 275–286. [Google Scholar] [CrossRef]
  9. Chantigny, M.H.; Rochette, P.; Angers, D.A.; Bittman, S.; Buckley, K.; Massé, D.; Bélanger, G.; Eriksen-Hamel, N.; Gasser, M.-O. Soil nitrous oxide emissions following band-incorporation of fertiliser nitrogen and swine manure. J. Environ. Qual. 2010, 39, 1545–1553. [Google Scholar] [CrossRef]
  10. Hansen, M.N.; Henriksen, K.; Sommer, S.G. Observations of production and emission of greenhouse gases and ammonia during storage of solids separated from pig slurry: Effects of covering. Atmos. Environ. 2006, 40, 4172–4181. [Google Scholar] [CrossRef] [Green Version]
  11. Møller, H.; Lund, I.; Sommer, S.G. Solid–liquid separation of livestock slurry: Efficiency and cost. Bioresour. Technol. 2000, 74, 223–229. [Google Scholar] [CrossRef]
  12. Möller, K.; Müller, T. Effects of anaerobic digestion on digestate nutrient availability and crop growth: A review. Eng. Life Sci. 2012, 12, 242–257. [Google Scholar] [CrossRef]
  13. Askri, A.; Laville, P.; Trémier, A.; Houot, S. Influence of origin and post-treatment on greenhouse gas emissions after anaerobic digestate application to soil. Waste Biomass Valor. 2016, 7, 293–306. [Google Scholar] [CrossRef]
  14. Singla, A.; Inubushi, K. Effect of biogas digested liquid on CH4 and N2O flux in paddy ecosystem. J. Integr. Agric. 2014, 13, 635–640. [Google Scholar] [CrossRef]
  15. Thomas, B.W.; Hao, X. Nitrous oxide emitted from soil receiving anaerobically digested solid cattle manure. J. Environ. Qual. 2017, 46, 741–750. [Google Scholar] [CrossRef] [Green Version]
  16. Dietrich, M.; Fongen, M.; Foereid, B. Greenhouse gas emissions from digestate in soil. Int. J. Recycl. Org. Waste Agricult. 2020, 9, 1–19. [Google Scholar] [CrossRef]
  17. Gómez-Muñoz, B.; Case, S.D.C.; Jensen, L.S. Pig slurry acidification and separation techniques affect soil N and C turnover and N2O emissions from solid, liquid and biochar fractions. J. Environ. Manag. 2016, 168, 236–244. [Google Scholar] [CrossRef] [PubMed]
  18. Holly, M.A.; Larson, R.A.; Powell, J.M. Gas reduction benefits from storage to application of anaerobic digestion and solid-liquid separation of dairy manure. In Proceedings of the 2015 ASABE Annual International Meeting, New Orleans, LA, USA, 26–29 July 2015; American Society of Agricultural and Biological Engineers: St. Joseph, MI, USA, 2015. [Google Scholar]
  19. Singla, A.; Iwasa, H.; Inubushi, K. Effect of biogas digested slurry based-biochar and digested liquid on N2O, CO2 flux and crop yield for three continuous cropping cycles of komatsuna (Brassica rapa var. perviridis). Biol. Fertil. Soils 2014, 50, 1201–1209. [Google Scholar] [CrossRef]
  20. Verdi, L.; Mancini, M.; Ljubojevic, M.; Orlandini, S.; Dalla Marta, A. Greenhouse gas and ammonia emissions from soil: The effect of organic matter and fertilisation method. Ital. J. Agron. 2018, 13, 260–266. [Google Scholar] [CrossRef] [Green Version]
  21. Akiyama, H.; McTaggart, I.P.; Ball, B.C.; Scott, A. N2O, NO, and NH3 emissions from soil after the application of organic fertilisers, urea and water. Water Air Soil Pollut. 2004, 156, 113–129. [Google Scholar] [CrossRef]
  22. Hayakawa, A.; Akiyama, H.; Sudo, S.; Yagi, K. N2O and NO emissions from an Andisol field as influenced by pelleted poultry manure. Soil Biol. Biochem. 2009, 41, 521–529. [Google Scholar] [CrossRef]
  23. Pampuro, N.; Busato, P.; Cavallo, E. Gaseous emissions after soil application of pellet made from composted pig slurry solid fraction: Effect of application method and pellet diameter. Agriculture 2018, 8, 119. [Google Scholar] [CrossRef] [Green Version]
  24. Velthof, G.L.; Rietra, R.P.J.J. Nitrogen use efficiency and gaseous nitrogen losses from the concentrated liquid fraction of pig slurries. Int. J. Agron. 2019, 2019, 9283106. [Google Scholar] [CrossRef]
  25. Die chemische Untersuchung von Futtermitteln: The Chemical Analysis of Feedstuffs. VDLUFA; Bassler, R. (Eds.) 3.Aufl.; VDLUFA-Verl.: Darmstadt, Germany, 1976; ISBN 978-3-941273-14-6. [Google Scholar]
  26. van Soest, P.J.; Wine, R.H. Determination of lignin and cellulose in acid-detergent fiber with permanganate. J. Assoc. Off. Anal. Chem. 1968, 51, 780–785. [Google Scholar] [CrossRef]
  27. DüV. Verordnung über die Anwendung von Düngemitteln, Bodenhilfsstoffen, Kultursubstraten und Pflanzenhilfsmitteln nach den Grundsätzen der guten fachlichen Praxis beim Düngen. Bundesgesetzblatt 2006, 1, 20–29. [Google Scholar]
  28. Hutchinson, G.L.; Mosier, A.R. Improved soil cover method for field measurement of nitrous oxide fluxes. Soil Sci. Soc. Am. J. 1981, 45, 311–316. [Google Scholar] [CrossRef]
  29. Laville, P.; Lehuger, S.; Loubet, B.; Chaumartin, F.; Cellier, P. Effect of management, climate and soil conditions on N2O and NO emissions from an arable crop rotation using high temporal resolution measurements. Agric. For. Meteorol. 2011, 151, 228–240. [Google Scholar] [CrossRef]
  30. Ruser, R.; Flessa, H.; Schilling, R.; Steindl, H.; Beese, F. Soil compaction and fertilisation effects on nitrous oxide and methane fluxes in potato fields. Soil Sci. Soc. Am. J. 1998, 62, 1587–1595. [Google Scholar] [CrossRef]
  31. Guzman-Bustamante, I.; Winkler, T.; Schulz, R.; Müller, T.; Mannheim, T.; Laso Bayas, J.C.; Ruser, R. N2O emissions from a loamy soil cropped with winter wheat as affected by N-fertilizer amount and nitrification inhibitor. Nutr. Cycl. Agroecosyst. 2019, 114, 173–191. [Google Scholar] [CrossRef]
  32. Petrova, I.P.; Ruser, R.; Guzman-Bustamante, I. Pellets from biogas digestates: A substantial source of N2O emissions. Waste Biomass Valor. 2021, 12, 2433–2444. [Google Scholar] [CrossRef]
  33. Fuß, R.; Greenhouse Gas Flux Calculation from Chamber Measurements. R-Package version 0.2-1. Available online: https://cran.r-project.org/web/packages/gasfluxes/gasfluxes.pdf (accessed on 24 April 2018).
  34. Leiber-Sauheitl, K.; Fuß, R.; Voigt, C.; Freibauer, A. High CO2 fluxes from grassland on histic Gleysol along soil carbon and drainage gradients. Biogeosciences 2014, 11, 749–761. [Google Scholar] [CrossRef] [Green Version]
  35. Piepho, H.-P. A SAS macro for generating letter displays of pairwise mean comparisons. Commun. Biometry Crop. Sci. 2012, 7, 4–13. [Google Scholar]
  36. Bertora, C.; Alluvione, F.; Zavattaro, L.; Van Groenigen, J.W.; Velthof, G.; Grignani, C. Pig slurry treatment modifies slurry composition, N2O, and CO2 emissions after soil incorporation. Soil Biol. Biochem. 2008, 40, 1999–2006. [Google Scholar] [CrossRef]
  37. Jones, S.K.; Rees, R.M.; Skiba, U.M.; Ball, B.C. Influence of organic and mineral N fertiliser on N2O fluxes from a temperate grassland. Agric. Ecosyst. Environ. 2007, 121, 74–83. [Google Scholar] [CrossRef]
  38. Kusa, K.; Hu, R.; Sawamoto, T.; Hatano, R. Three years of nitrous oxide and nitric oxide emissions from silandic andosols cultivated with maize in Hokkaido, Japan. Soil Sci. Plant. Nutr. 2006, 52, 103–113. [Google Scholar] [CrossRef]
  39. Köster, J.R.; Cárdenas, L.; Senbayram, M.; Bol, R.; Well, R.; Butler, M.; Mühling, K.H.; Dittert, K. Rapid shift from denitrification to nitrification in soil after biogas residue application as indicated by nitrous oxide isotopomers. Soil Biol. Biochem. 2011, 43, 1671–1677. [Google Scholar] [CrossRef]
  40. Häfner, F.; Ruser, R.; Claß-Mahler, I.; Möller, K. Field application of organic fertilisers triggers N2O emissions from the soil N pool as indicated by 15N-labeled digestates. Front. Sustain. Food Syst. 2021, 4. [Google Scholar] [CrossRef]
  41. Granli, T.; Bøckman, O. Nitrous oxide from agriculture. Nor. J. Agric. Sci. 1994, 12, 7–128. [Google Scholar]
  42. Flessa, H.; Beese, F. Laboratory estimates of trace gas emissions following surface application and injection of cattle slurry. J. Environ. Qual. 2000, 29, 262–268. [Google Scholar] [CrossRef]
  43. Petersen, S.O.; Sommer, S.G. Ammonia and nitrous oxide interactions: Roles of manure organic matter management. Anim. Feed Sci. Tech. 2011, 166–167, 503–513. [Google Scholar] [CrossRef]
  44. Smith, K.A. The potential for feedback effects induced by global warming on emissions of nitrous oxide by soils. Glob. Chang. Biol. 1997, 3, 327–338. [Google Scholar] [CrossRef]
  45. Pfab, H.; Palmer, I.; Buegger, F.; Fiedler, S.; Müller, T.; Ruser, R. N2O fluxes from a Haplic Luvisol under intensive production of lettuce and cauliflower as affected by different N-fertilisation strategies. J. Plant. Nutr. Soil Sci. 2011, 174, 545–553. [Google Scholar] [CrossRef]
  46. Ruser, R.; Fuß, R.; Andres, M.; Hegewald, H.; Kesenheimer, K.; Köbke, S.; Räbiger, T.; Quinones, T.S.; Augustin, J.; Christen, O.; et al. Nitrous oxide emissions from winter oilseed rape cultivation. Agric. Ecosyst. Environ. 2017, 249, 57–69. [Google Scholar] [CrossRef]
  47. Senbayram, M.; Chen, R.; Wienforth, B.; Herrmann, A.; Kage, H.; Mühling, K.H.; Dittert, K. Emission of N2O from biogas crop production systems in Northern Germany. Bioenergy Res. 2014, 7, 1223–1236. [Google Scholar] [CrossRef]
  48. Ruser, R.; Flessa, H.; Russow, R.; Schmidt, G.; Buegger, F.; Munch, J.C. Emission of N2O, N2 and CO2 from soil fertilized with nitrate: Effect of compaction, soil moisture and rewetting. Soil Biol. Biochem. 2006, 38, 263–274. [Google Scholar] [CrossRef]
  49. Meijide, A.; García-Torres, L.; Arce, A.; Vallejo, A. Nitrogen oxide emissions affected by organic fertilisation in a non-irrigated Mediterranean barley field. Agric. Ecosyst. Environ. 2009, 132, 106–115. [Google Scholar] [CrossRef]
  50. Davidson, E.A. Fluxes of nitrous oxide and nitric oxide from terrestrial ecosystems: In Microbial Production and Consumption of Greenhouse Gases: Methane, Nitrogen Oxides and Halomethanes; American Society for Microbiology: Washington, DC, USA, 1991; pp. 219–235. [Google Scholar]
  51. Fechter, M. Technischer Vergleich von Aufbereitungsverfahren für Gärreste in der Biogastechnik. Doctoral dissertation, Technische Universität Berlin, Berlin, Germany, 2019. [Google Scholar]
  52. Petersen, J.; Sørensen, P. Loss of nitrogen and carbon during storage of the fibrous fraction of separated pig slurry and influence on nitrogen availability. J. Agric. Sci. 2008, 146, 403–413. [Google Scholar] [CrossRef]
  53. Marcato, C.E.; Pinelli, E.; Pouech, P.; Winterton, P.; Guiresse, M. Particle size and metal distributions in anaerobically digested pig slurry. Bioresour. Technol. 2008, 99, 2340–2348. [Google Scholar] [CrossRef] [Green Version]
  54. Møller, H.B.; Sommer, S.G.; Ahring, B.K. Separation efficiency and particle size distribution in relation to manure type and storage conditions. Bioresour. Technol. 2002, 85, 189–196. [Google Scholar] [CrossRef]
  55. Alburquerque, J.A.; de la Fuente, Carlos; Bernal, M. P. Chemical properties of anaerobic digestates affecting C and N dynamics in amended soils. Agric. Ecosyst. Environ. 2012, 160, 15–22. [Google Scholar] [CrossRef]
  56. Collins, H.P.; Alva, A.K.; Streubel, J.D.; Fransen, S.F.; Frear, C.; Chen, S.; Kruger, C.; Granatstein, D. Greenhouse gas emissions from an irrigated silt loam soil amended with anaerobically digested dairy manure. Soil Sci. Soc. Am. J. 2011, 75, 2206–2216. [Google Scholar] [CrossRef]
  57. Ingold, M.; Khanal, G.; Dyckmans, J.; Wachendorf, C.; Buerkert, A. NH3 volatilization, N2O emission and microbial biomass turnover from 15N-labeled manure under laboratory conditions. Commun. Soil Sci. Plant. Anal. 2018, 49, 537–551. [Google Scholar] [CrossRef]
  58. Roman-Perez, C.C.; Hernandez-Ramirez, G. Sources and priming of nitrous oxide production across a range of moisture contents in a soil with high organic matter. J. Environ. Qual. 2021, 50, 94–109. [Google Scholar] [CrossRef]
  59. Manfredini, A.; Negri, M.; Cavalli, D.; Bechini, L.; Marino, P. Carbon and nitrogen mineralization of raw and separated, digested animal manures. In Treatment and Use of organic Residues in Agriculture: Challenges and Opportunities towards Sustainable Management, 14th RAMIRAN International Conference, Lisbon, Portugal, 13–15 September; Marques dos Santos Cordovil, Cláudia S.C., Ferreira, L., Eds.; ISA Press: Lisbon, Portugal, 2010; ISBN 978-972-8669-47-8. [Google Scholar]
  60. Ellington, A. Ammonia volatilization losses from fertilisers applied to acid soil in the field. Fertil. Res. 1986, 8, 283–296. [Google Scholar] [CrossRef]
  61. He, Z.L.; Alva, A.K.; Calvert, D.V.; Banks, D.J. Ammonia volatilization from different fertiliser sources and effects of temperature and soil pH. Soil Sci. 1999, 164, 750–758. [Google Scholar] [CrossRef]
  62. Powlson, D.S.; Dawson, C.J. Use of ammonium sulphate as a sulphur fertiliser: Implications for ammonia volatilization. Soil Use Manag. 2021. [Google Scholar] [CrossRef]
  63. Sommer, S.G.; Jensen, C. Ammonia volatilization from urea and ammoniacal fertilisers surface applied to winter wheat and grassland. Fertil. Res. 1994, 37, 85–92. [Google Scholar] [CrossRef]
  64. Turner, D.A.; Edis, R.E.; Chen, D.; Freney, J.R.; Denmead, O.T. Ammonia volatilization from nitrogen fertilisers applied to cereals in two cropping areas of southern Australia. Nutr. Cycl. Agroecosyst. 2012, 93, 113–126. [Google Scholar] [CrossRef]
  65. Fangueiro, D.; Coutinho, J.; Cabral, F.; Fidalgo, P.; Bol, R.; Trindade, H. Nitric oxide and greenhouse gases emissions following the application of different cattle slurry particle size fractions to soil. Atmos. Environ. 2012, 47, 373–380. [Google Scholar] [CrossRef]
  66. Hadas, A.; Bar-Yosef, B.; Davidov, S.; Sofer, M. Effect of pelleting, temperature, and soil type on mineral nitrogen release from poultry and dairy manures. Soil Sci. Soc. Am. J. 1983, 47, 1129–1133. [Google Scholar] [CrossRef]
  67. Aguirre-Villegas, H.A.; Larson, R.A.; Sharara, M.A. Anaerobic digestion, solid-liquid separation, and drying of dairy manure: Measuring constituents and modeling emission. Sci. Total Environ. 2019, 696, 134059. [Google Scholar] [CrossRef]
  68. Maurer, C.; Müller, J. Ammonia (NH3) emissions during drying of untreated and dewatered biogas digestate in a hybrid waste-heat/solar dryer. Eng. Life Sci. 2012, 12, 321–326. [Google Scholar] [CrossRef]
  69. Ingold, M.; Dietz, H.; Schlecht, E.; Buerkert, A. Gaseous N and C losses during sun-drying of goat manure—Effects of drying conditions and feed additives. In Proceedings of the Conference on International Research on Food Security, Natural Resource Management and Rural Development, Virtual Conference, 9–11 September 2020. [Google Scholar]
  70. Prenafeta-Boldú, F.X.; Fernández, B.; Viñas, M.; Noguerol, J.; Soler, J.; Illa, J. Combined acidification and solar drying of pig slurries for nutrient recovery and controlled atmospheric emissions. Agronomy 2021, 11, 222. [Google Scholar] [CrossRef]
  71. Hartley, I.D.; Wood, L.J. Hygroscopic properties of densified softwood pellets. Biomass Bioenergy 2008, 32, 90–93. [Google Scholar] [CrossRef]
  72. Nurk, L.; Bühle, L.; Wachendorf, M. Degradation of fibre and non-fibre fractions during anaerobic digestion in silages of maize, sunflower and Sorghum-Sudangrass of different maturities. Bioenergy Res. 2016, 9, 720–730. [Google Scholar] [CrossRef]
  73. Suppadit, T.; Pongpiachan, S.; Panomsri, S. Effects of moisture content in quail litter on the physical characteristics after pelleting using a Siriwan Model machine. Anim. Sci. J. 2012, 83, 350–357. [Google Scholar] [CrossRef]
  74. Oberberger, I.; Thek, G. The Pellet Handbook: The Production and Thermal Utilisation of Biomass Pellets; Earthscan: London, UK, 2010; ISBN 978-84407-631-4. [Google Scholar]
  75. Dosch, P.; Gutser, R. Reducing N losses (NH3, N2O, N2) and immobilization from slurry through optimized application techniques. Fertil. Res. 1995, 43, 165–171. [Google Scholar] [CrossRef]
  76. Velthof, G.L.; Kuikman, P.J.; Oenema, O. Nitrous oxide emission from animal manures applied to soil under controlled conditions. Biol. Fertil. Soils 2003, 37, 221–230. [Google Scholar] [CrossRef]
Figure 1. Air temperature (2 m height), soil temperature (10 cm depth), daily precipitation, and mean water-filled pore space during the field trial (a: year 2015, d: year 2016); mean N2O flux rates (n = 4) as affected by digestate from biogas plant 1 (b: year 2015, e: year 2016) and plant 2 (c: 2015, f: year 2016); sep.: separated, concentrate: concentrate after vacuum evaporation, ASS2: ammonium sulfate solution of biogas plant 2.
Agronomy 11 02215 g001
Figure 2. Mean cumulative N2O emission in the field trial (n = 4 ± standard error) as affected by digestate and biogas plant in the two experimental years (a: 2015; b: 2016); concentrate: concentrate after vacuum evaporation, ASS: ammonium sulfate solution; at least one identical letter indicates nonsignificant differences among treatments, according to a Tukey HSD test (p ≤ 0.05).
Agronomy 11 02215 g002
Figure 3. Mean N2O flux rates (n = 4) as affected by digestate and biogas plant (a: biogas plant 1; b: biogas plant 2) measured during the incubation; sep.: separated, concentrate: concentrate after vacuum evaporation.
Agronomy 11 02215 g003
Figure 4. Mean cumulative N2O emissions (n = 4 ± standard error) as affected by digestate and biogas plant measured during the incubation; sep.: separated, concentrate: concentrate after vacuum evaporation; at least one identical letter indicates nonsignificant differences between the treatments, according to a Tukey HSD test (p ≤ 0.05).
Agronomy 11 02215 g004
Table 1. Chemical characteristics of the applied raw and processed digestates.
Biogas PlantProductYearDM 4Ct 6Corg 7Nt 8NH4–N 9NH4–N:NtC:NpH
(g·kg−1 FM 5)(g·kg−1 DM)
1Raw digestate (RD1)20157934834564.130.20.475.48.1
Sep. liquid (SL1) 1 5635835486.543.10.504.18.0
Sep. solid (SS1) 1 31143142925.26.40.2517.18.2
Dry solid (DS1) 90241641325.61.70.0716.28.2
Pellet (P1) 88940239835.14.30.1211.57.7
Raw digestate (RD1)201610843543247.618.20.389.17.3
Sep. liquid (SL1) 1 6539839478.436.00.465.17.8
Sep. solid (SS1) 1 29945645418.63.90.2124.68.6
Dry solid (DS1) 54646145921.41.00.0521.57.8
Pellet (P1) 85144744534.92.40.0712.87.9
2Raw digestate (RD2)20155438137696.162.20.654.07.8
Sep. liquid (SL2) 1 50368362103.468.60.663.67.8
Sep. solid (SS2) 1 22539839628.115.00.5314.18.3
Concentrate (CC2) 2 8537537348.819.70.407.79.0
ASS2 3 322<2<2185.8181.90.980.011.3
Raw digestate (RD2)20167740640368.641.80.615.97.7
Sep. liquid (SL2) 1 47393388106.460.80.573.77.9
Sep. solid (SS2) 1 17443443232.114.40.4513.58.9
Concentrate (CC2) 2 13639939538.76.50.1710.38.9
ASS2 3 27811202.9193.70.950.0072.4
1 Sep. liquid/solid: separated liquid/solid; 2 CC2: concentrate after vacuum evaporation; 3 ASS2: ammonium sulfate solution after vacuum evaporation; 4 DM: dry matter; 5 FM: fresh matter; 6 Ct: total carbon; 7 Corg: organic carbon; 8 Nt: total nitrogen; 9 NH4–N: ammonium N.
Table 2. Detergent fiber analysis of raw and treated digestates used in this study, according to van Soest and Wine [26].
Biogas PlantProductaNDF 4 (g·kg−1 DM)ADF 5 (g·kg−1 DM)ADL 6 (g·kg−1 DM)
201520162015201620152016
1Raw digestate (RD1)411477377438170223
Sep. liquid (SL1) 1205379204382109244
Sep. solid (SS1) 1683785518649216426
Dry solid (DS1)533653493607227393
Pellet (P1)517583463520225316
2Raw digestate (RD2)96455228411134187
Sep. liquid (SL2) 121189254298174193
Sep. solid (SS2) 1727693563524207179
Concentrate (CC2) 289169260259112141
ASS2 3<10 7,8<10 7,8<5 7,8<5 7,8<5 7,8<5 7,8
1 Sep. liquid/solid: separated liquid/solid; 2 CC2: concentrate after vacuum evaporation; 3 ASS2: ammonium sulfate solution after vacuum evaporation; 4 aNDF: neutral detergent fiber; 5 ADF: acid detergent fiber; 6 ADL: acid detergent lignin; 7 measured values fall below the detection limits; 8 the value is presented as g·kg−1 FM.
Table 3. Main soil characteristics in the Ap-horizon (0–0.3 m depth) of the experimental fields in 2015 and 2016 before fertilization.
YearSandSiltClayBulk DensitypHCorgNtNmin 1
(%)(%)(%)(Mg·m³)(CaCl2)(%)(%)(kg·ha−1)
2015268301.296.51.80.1619.9
2016969221.247.01.10.147.3
1 Initial Nmin (NH4+ and NO3) at the beginning of each experiment.
Table 4. N2O release as affected by air temperature (x1), water-filled pore space (x2), soil temperature (x3), and rainfall (x4) during the first experimental year (2015). Coefficient of determination and function of stepwise multiple regression (Forward procedure, F to enter: 4.000, F to remove: 3.900).
N2O Release 1Model R2Air TempRainfallSoil TempWFPS 2Final Equation of Stepwise
Forward Regression
(g N2O-N ha−1 d−1)(°C)(mm)(°C)(%)
Partial R2p-Value Partial R2p-ValuePartial R2p-Value
RD10.550.290.002n.s. n.s.0.260.008y = −250.1 + 10.6x1 + 4.4x2
SL10.270.270.020n.s. n.s. n.s.y = −78.7 + 12.4x1
SS10.610.33<0.001n.s.0.280.004 n.s.y = −11.7 + 8.6x1 + 3.7x3
DS10.680.31<0.001n.s.0.15<0.0010.22n.s.y = 8.3 + 11.2x1 − 6.1x3
P10.650.280.003n.s. n.s.0.37<0.001y = −553.9 + 16x1 + 10.7x2
RD20.670.34<0.001n.s.0.330.001 n.s.y = −26.2 + 15.5x1 − 6.9x3
SL20.600.36<0.001n.s. n.s.0.240.007y = −126.3 + 6.1x1 + 2.2x2
SS20.650.32<0.001n.s.0.330.001 n.s.y = −23.9 + 17.3x1 − 7.8x3
CC20.680.32<0.001n.s.0.36<0.001 n.s.y = −5.5 + 12.1x1 − 5.6x3
ASS20.640.37<0.001n.s.0.270.003 n.s.y = −43.2 + 15.7x1 − 6.5x3
Control0.750.35<0.001n.s.0.40<0.001 n.s.y = −24.4 + 12.5x1 − 5.9x3
1 RD1/2: raw digestate; SL1/2: liquid fraction; SS1/2: solid fraction; DS1: dry solid; P1: pellet; CC2: concentrate; ASS2: ammonium sulfate solution; number behind treatment abbreviations: number of respective biogas plant; 2 WFPS: water-filled pore space.
Table 5. N2O release as affected by air temperature (x1), rainfall (x2), water-filled pore space (x3), and soil temperature (x4) during the second experimental year (2016). Coefficient of determination and function of stepwise multiple regression (Forward procedure, F to enter: 4.000, F to remove: 3.900).
N2O Release 1Model R2Air TempRainfallSoil TempWFPS 2Final Equation of Stepwise
Forward Regression
(g N2O-N ha−1 d−1)(°C)(mm)(°C)(%)
Partial R2p-ValuePartial R2p-ValuePartial R2p-ValuePartial R2p-Value
RD10.54 n.s.0.40<0.0010.140.037 n.s.y = −22.1+ 14x2 + 2.2x4
SL1 n.s. n.s. n.s. n.s.y = Intercept
SS10.50 n.s.0.50<0.001 n.s. n.s.y = 7.4 + 3.1x2
DS10.31 n.s.0.310.010 n.s. n.s.y = 10.6 + 3.5x2
P1 n.s. n.s. n.s. n.s.y = Intercept
RD20.490.200.0180.290.016 n.s. n.s.y = −35.8+ 6.2x1 + 11.1x2
SL20.360.360.005 n.s. n.s. n.s.y = −11.6 + 3.7x1
SS2 n.s. n.s n.s. n.s.y = Intercept
CC20.77 n.s.0.57<0.0010.130.0020.060.051y = −215.8 + 18.6x2 + 3.2x3 + 4.3x4
ASS20.45 n.s.0.450.001 n.s. n.s.y = 10.2 + 4.8x2
Control0.70 n.s.0.70<0.001 n.s. n.s.y = 4.9 + 4x2
1 RD1/2: raw digestate; SL1/2: liquid fraction; SS1/2: solid fraction; DS1: dry solid; P1: pellet; CC2: concentrate; ASS2: ammonium sulfate solution; number behind treatment abbreviations: number of respective biogas plant; 2 WFPS: water-filled pore space.
Publisher’s Note: MDPI stays neutral with regard to jurisdictional claims in published maps and institutional affiliations.

