Article

Identification, Expression, and Functional Characterization of ScCaM in Response to Various Stresses in Sugarcane

1
College of Tea and Food Science, Wuyi University, Nanping 354300, China
2
Key Laboratory of Sugarcane Biology and Genetic Breeding, Ministry of Agriculture, Fujian Agriculture and Forestry University, Fuzhou 350002, China
3
Key Laboratory of Genetics, Breeding and Multiple Utilization of Crops, Ministry of Education, College of Agriculture, Fujian Agriculture and Forestry University, Fuzhou 350002, China
4
Fujian Provincial Key Laboratory of Eco-Industrial Green Technology, Wuyi University, Nanping 354300, China
*
Author to whom correspondence should be addressed.
These authors have contributed equally to this work.
Agronomy 2021, 11(11), 2153; https://doi.org/10.3390/agronomy11112153
Submission received: 18 September 2021 / Revised: 20 October 2021 / Accepted: 23 October 2021 / Published: 27 October 2021

Abstract

:
Calmodulin (CaM), as an important factor in the calcium signaling pathway, is widely involved in plant growth and development regulation and responses to external stimuli. In this study, the full-length sequence of the ScCaM gene (GenBank: GQ246454) was isolated from the leaves of a Saccharum spp. hybrid. Prokaryotic expression showed that ScCaM could be solubly expressed and purified in Escherichia coli BL21. Subcellular localization confirmed that ScCaM was localized in the plasma membrane and nucleus of cells. A quantitative reverse transcription polymerase chain reaction (qRT-PCR) analysis revealed that ScCaM can be induced by various stresses, including sodium chloride (NaCl), chromium trichloride (CrCl3), salicylic acid (SA), and methyl jasmonate (MeJA). Ectopic expression in Arabidopsis thaliana demonstrated that ScCaM can affect the growth and development of transgenic plants. Moreover, the qRT-PCR analysis indicated that the overexpression of the allogenic ScCaM gene inhibits the expression of AtSTM, leading to the phenomenon of multiple-tillering in transgenic A. thaliana. The present study provided valuable information and facilitates further investigation into the function of ScCaM in the future.

1. Introduction

As the most important Ca2+ receptor, calmodulins (CaMs), which belong to a vital class of Ca2+ binding proteins, are widely present in eukaryotes [1]. Previous studies have shown that CaM, which usually comprises 148 amino acid residues and four EF-hands, was highly conserved in evolution [2]. Commonly, CaM consists of two domains (a globular N-terminal domain and a highly homologous C-terminal domain) with two E–F hands, respectively [3]. It is noteworthy that both domains of CaM adopt different conformations in the absence or presence of Ca2+ [3].
In plants, CaM genes have been identified from different plants, including Arabidopsis thaliana, Oryza sativa, Sorghum bicolor, and so on [4]. For example, there are a total of seven highly similar calmodulins with only a few amino acid differences in A. thaliana [5]. There are five and eight CaM genes in O. sativa and S. bicolor, respectively [4]. Previous studies have shown that, by binding with Ca2+, CaMs can interact with the downstream calmodulin-binding protein (CaMBP) to activate these enzymes to play important roles in the ion transport, gene regulation, cytoskeleton construction, disease resistance, and stress tolerance of plants [6]. For instance, CaM can repress the expression of EDS1 through binding and activating CAMTA3, which results in decreased salicylic acid levels and disease resistance [7]. The binding with Ca2+/calmodulin is important for the function of DWARF1 (DWF1) in plant development [8]. Additionally, overexpression of GmCaM4 can promote tolerance to salt stress and resistance to pathogens in soybean [9]. AtCaM was found to function at the growth of photomorphogenesis [10]. Liu et al. found that TaCaM5 is involved in the regulation of wheat under injury, high salt, low temperature, and drought stress [11].
Sugarcane (Saccharum spp. complex), an important sugar-yielding and energy crop, has important biological and economic value [12]. However, the development of the sugar industry has been restricted by many different environmental stresses [13]. CaMs, as vital Ca2+ sensors, have multiple functions in plants, such as regulating growth and development and enhancing resistance to stresses [14,15]. In this study, one ScCaM gene was isolated from sugarcane, and its sequence was bioinformatically analyzed. Then, a quantitative reverse transcription polymerase chain reaction (qRT-PCR) was used to detect the expression profiles under various stresses, such as sodium chloride (NaCl), chromium trichloride (CrCl3), salicylic acid (SA), and methyl jasmonate (MeJA). Furthermore, the prokaryotic expression vector of ScCaM was constructed and its expression was induced in Escherichia coli. Moreover, the subcellular localization of ScCaM was analyzed. The present study herein may facilitate further investigation into the clear functions of CaM genes in sugarcane.

2. Materials and Methods

2.1. Plant Materials

The Saccharum spp. hybrid (sugarcane cultivar ROC22) was provided by the Key Laboratory of Sugarcane Biology and Genetic Breeding, Ministry of Agriculture (Fuzhou, China).
The sugarcane stems were planted in high-temperature sterilized sand. When the seedlings grew to six leaves, we selected the seedlings with similar growth states and transferred them to a hydroponic culture for two days. Then, we transferred them to 1/10 Hongland nutrient solution for culturing for seven days. For SA and MeJA treatment, 5 mM of SA and 100 µM of MeJA, respectively, were sprayed on the leaves. For NaCl and CrCl3 treatment, 250 mM of NaCl, and 50 µM of CrCl3, respectively, were used to soak the seedlings. Three biological replicates for each group were prepared. The leaves for hormone treatments and the whole seedlings for NaCl treatment were collected at 0 h, 3 h, 12 h, and 24 h, and frozen in liquid nitrogen quickly, then stored at −80 °C until total RNA extraction.

2.2. Gene Isolation and Bioinformatics Analysis

Based on our previous full-length cDNA library of sugarcane leaves, the gene of ScCaM was obtained (Saccharum spp. hybrid (ROC22) [16]. ExPASy (http://web.expasy.org/protparam/, accessed on 25 March 2019), TMHMM v2.0 program (http://www.cbs.dtu.dk/services/TMHMM/, accessed on 25 March 2019), and SignalP (http://www.cbs.dtu.dk/services/SignalP/, accessed on 25 March 2019) were applied to predict the primary protein structures, transmembrane domains, and signal peptides, respectively. SMART (http://smart.embl.de/, accessed on 25 March 2019), SOMPA (https://npsa-prabi.ibcp.fr/cgi-bin/npsa_automat.pl?page=npsa_sopma.html/, accessed on 25 March 2019), and SWISS-MODEL (https://swissmodel.expasy.org/, accessed on 25 March 2019) were used to detect the conserved domains, secondary structure, and three-dimensional structure of ScCaM, respectively. MEGA X was applied to infer the phylogenetic tree using the NJ method.

2.3. Prokaryotic Expression in E. coli BL21 (DE3) Cells

The ORF of ScCaM was amplified by using the ScCaM primers (Table S1). The PCR product and the pGEX-4T vector, both digested with BamHI and EcoRI, were ligated. The recombinant plasmid (pGEX-4T-ScCaM) and empty plasmid (pGEX-4T) were transformed into E. coli BL21 (DE3) competent cells, respectively. In order to study the expression condition of the GST-ScCaM protein, different inducing temperatures (16 °C, 28 °C, and 37 °C), time periods (0 h, 2 h, 8 h, and 20 h), and isopropyl β- D-thiogalactoside (IPTG) concentrations (0.1 mM, 0.5 mM, and 1.0 mM) were used. Finally, the induced protein was analyzed by sodium dodecyl sulfate-polyacrylamide gel electrophoresis (SDS-PAGE).

2.4. Subcellular Localization Analysis

The open reading frame (ORF) of ScCaM without a stop codon was amplified by the primers ScCaM-pBWA(V)HS (Table S1) to insert into the Aarl restriction site of the pBWA(V)HS-osgfp vector. Then, the recombinant vector pBWA(V)HS-ScCaM-osgfp was transformed into the competent cells of Agrobacterium tumefaciens, strain GV3101. The recombinant vector pBWA(V)HS- ScCaM-GLosgfp and the nucleus marker vector (NLS-mCherry), or the cell membrane marker vector (OsMCA1-mCherry), were co-transformed in Nicotiana benthamiana leaves. Agrobacterium-mediated transient expression in N. benthamiana leaves was performed according to Su et al. [17]. The subcellular localization of the fusion protein was visualized by Olympus FV1000 [18].

2.5. qRT-PCR Analysis

The qRT-PCR primers of ScCaM were designed by primer software (version 5.0, San Francisco, USA). The reaction procedure was as follows: 95 °C for 2 min, 40 cycles of 95 °C for 15 s, 60 °C for 20 s, and 72 °C for 2 min. The melting curves were analyzed after 40 cycles. Each qRT-PCR contains three biological replicates and two technical replicates. The relative expression level of qRT-PCR data was calculated by the 2−ΔΔCt method [19]. The primers used in the qRT-PCR analysis are listed in Table S1. Data were expressed as the mean ± standard error (SE), and significance (p < 0.05) was calculated using a one-way ANOVA followed by Duncan’s new multiple range test.

2.6. Phenotype and Expression Pattern Analysis of Arabidopsis thaliana Overexpressing ScCaM Gene under Different Exogenous Stresses

The overexpression vector pBWA(V)HS-35S-ScCAM was constructed by the in-fusion cloning technique and then transformed into Agrobacterium strain GV1301 competent cells. For transformation into A. thaliana (Col-0), wild-type A. thaliana flowers were dropped and infiltrated into Agrobacterium strain GV1301 competent cells containing recombinant plasmid pBWA(V)HS-35S-ScCAM. Using homomycin and RT-PCR amplification of the HYG gene, the T3 generation of A. thaliana transgenic lines was selected.
The A. thaliana transgenic lines in the T3 generation were planted in 1/2 Murashige and Skoog (MS) medium. When A. thaliana had cultured to 7–8 true leaves, the expression of ScCAM in all T3 generation lines was analyzed by qRT-PCR, and the lines with higher expression levels were selected for subsequent experiments. The whole seedlings were collected and frozen in liquid nitrogen quickly, then stored at −80 °C until total RNA extraction.
To further clarify the function of the ScCaM gene, the expression patterns of the ScCaM gene in transgenic A. thaliana under different exogenous stresses were analyzed by qRT-PCR. The T3 seeds with the highest ScCaM gene expression were selected and planted in 1/2 MS medium. When A. thaliana had cultured to 7–8 true leaves, the plants were immersed in 5 mM of SA, 100 µM of MeJA, 100 mM of NaCl, and 50 mM of CrCl3 in 1/2 MS liquid medium for stress treatment. The samples were harvested at 0 h, 1h, 3 h, 6 h, 12 h, and 24 h for each treatment, frozen in liquid nitrogen, and stored at −80 °C until total RNA extraction. All primers used in the qRT-PCR are listed in Table S1.

3. Results

3.1. Identification and Sequence Features of ScCaM

In this study, the full-length cDNA sequence of ScCaM (GenBank Acc No. GQ246454) was isolated. It was 925 bp long, with a 450-bp ORF that encoded a polypeptide of 149 amino acids (Figure 1A). The physical and chemical properties of ScCaM showed that its molecular mass, theoretical pI, instability index (II), and grand average of hydropathicity (GRAVY) were 16.83 kDa, 4.11, −0.602, and 23.23, respectively. These results indicate that ScCaM is an acidic, stable, hydrophilic protein. The prediction results of TMHMM and SingalP 5.0 Sever demonstrated that ScCaM has no transmembrane region and no signal peptide, so it is not a secretory protein. According to SMART, the amino acid sequence of the ScCaM has four typical EF-hand conservative structure domains (12–40, 48–76, 85–113, and 121–149 amino acids in length) (Figure 1B). The results of the protein secondary structures show that ScCaM mainly consists of 92 α-helices (65.71%), 36 random coils (24.16%), 12 β-sheets (8.05%), and 9 extension chains (6.04%). The three-dimensional model of ScCaM demonstrates that the protein has two EF-hands at the C-terminal and N-terminal, respectively (Figure 1C).

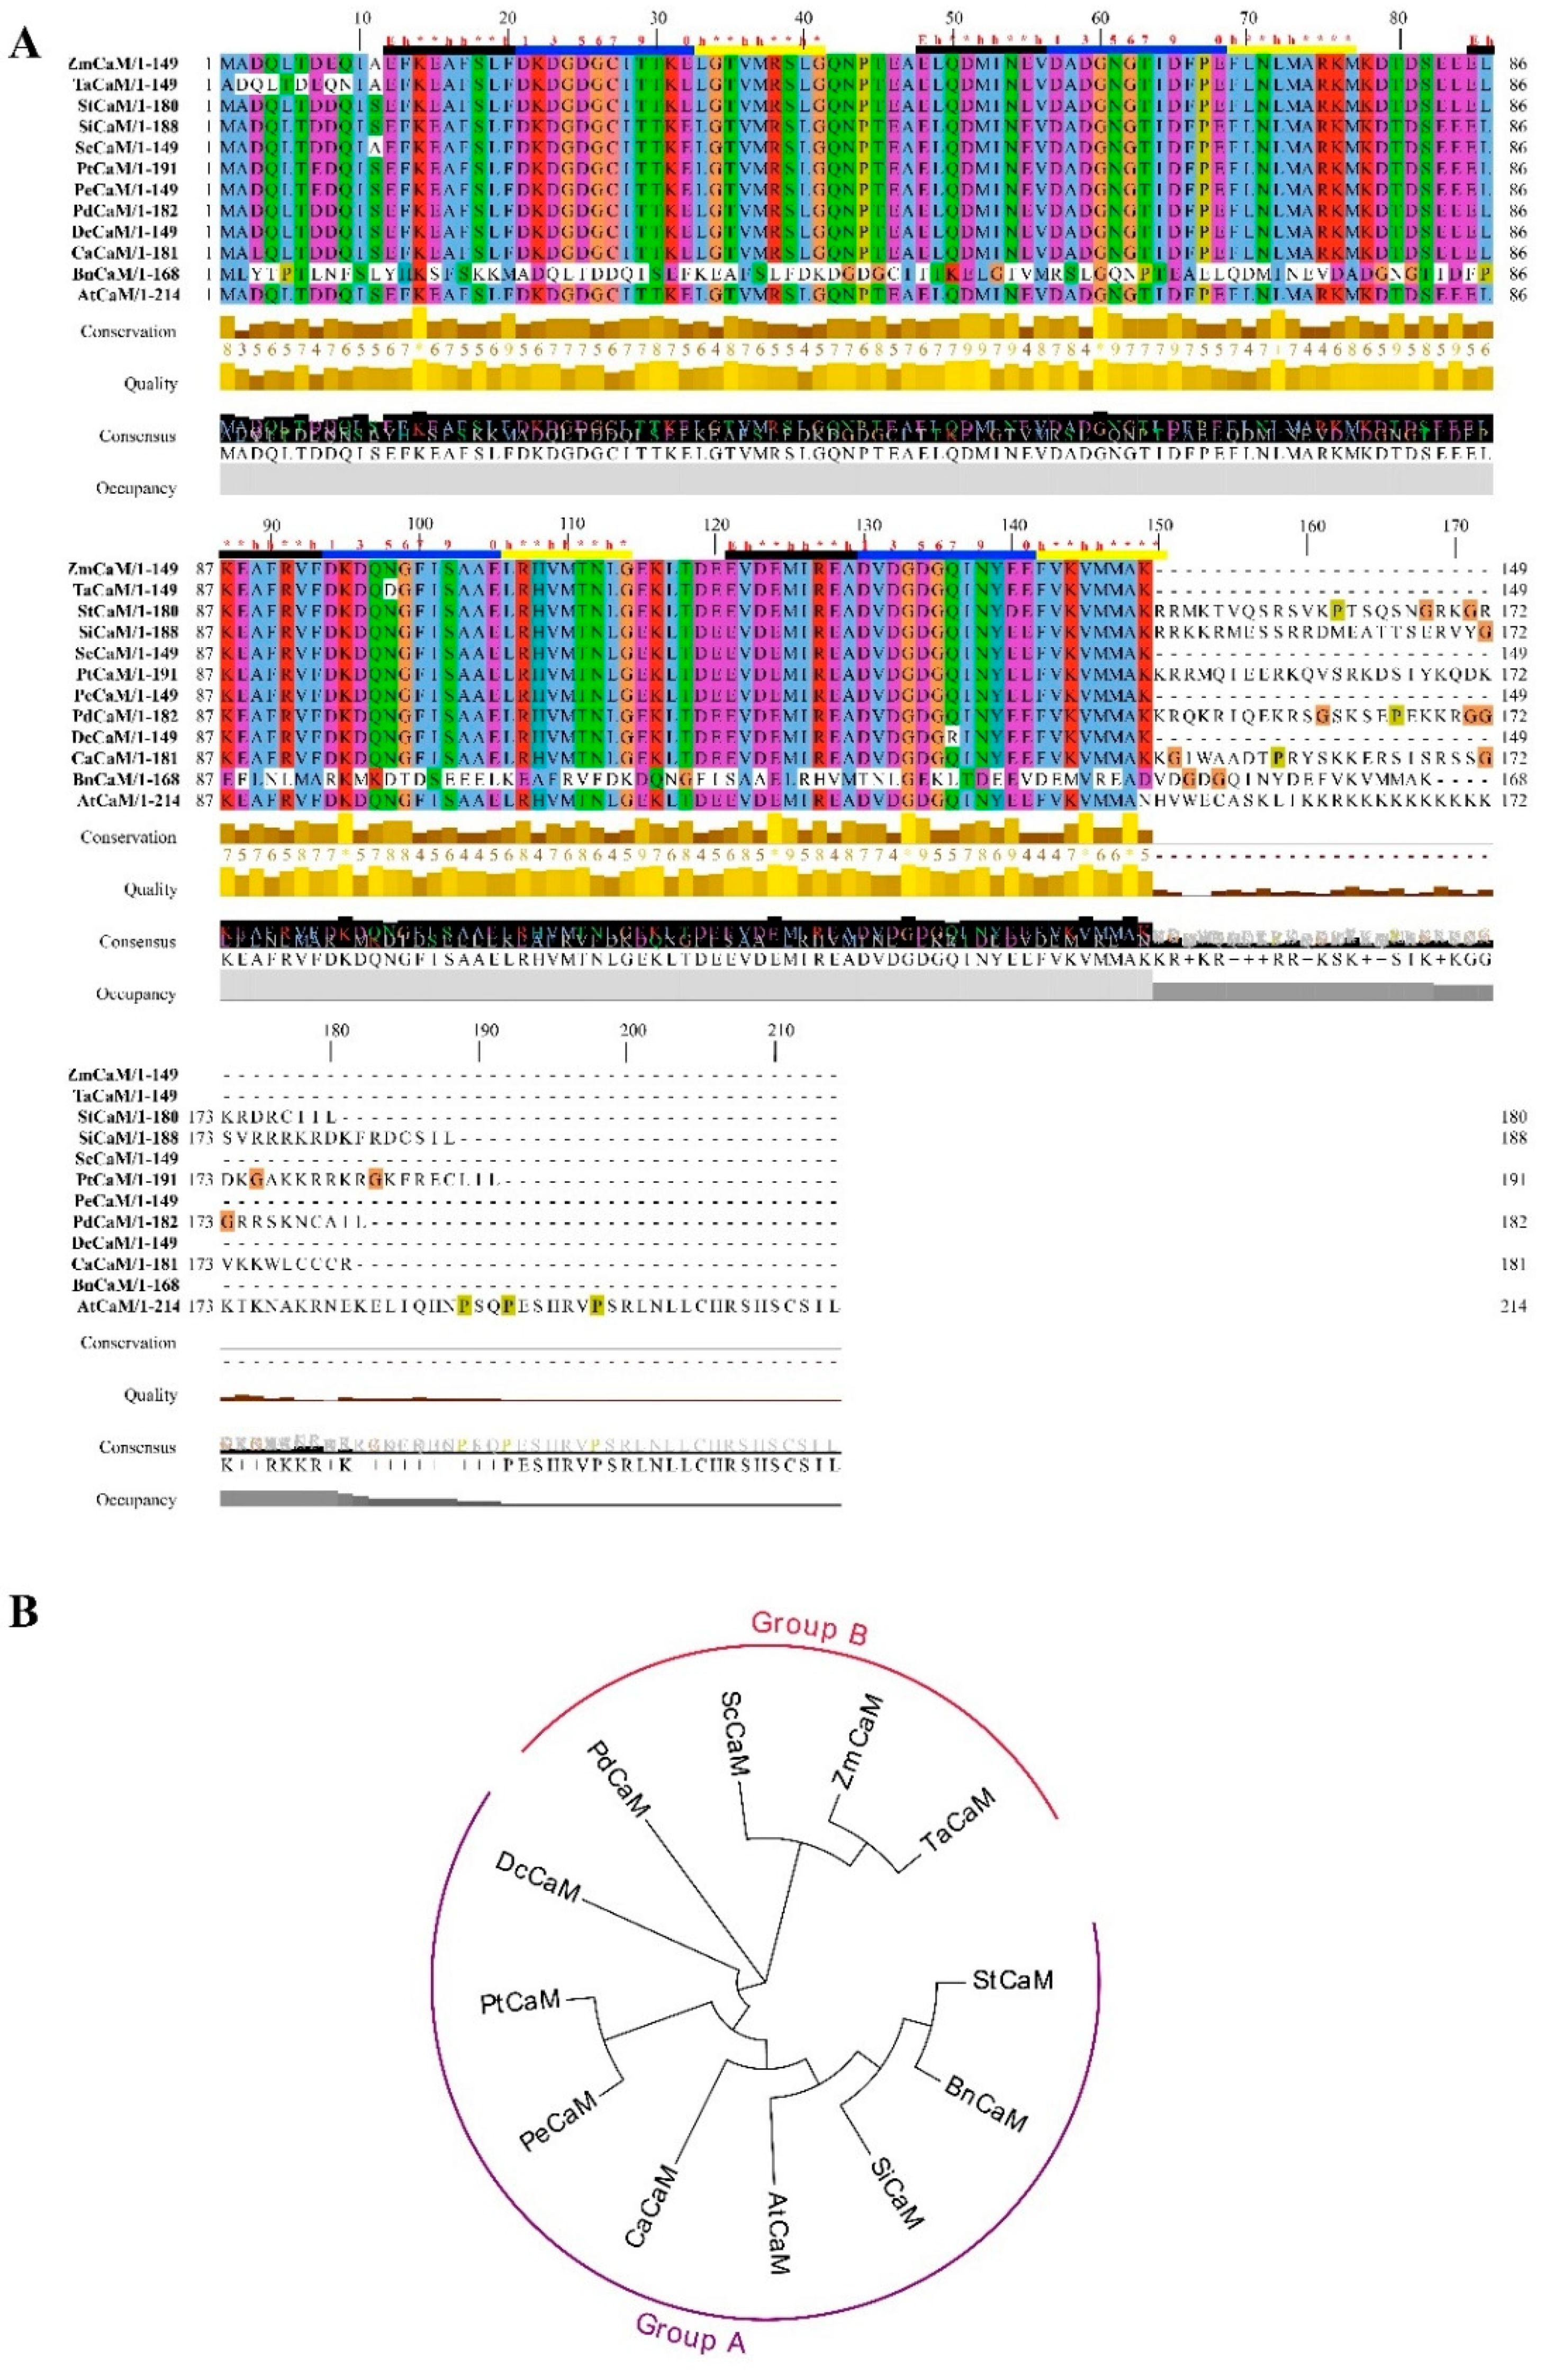
3.2. Sequence and Phylogenetic Analysis of CaM Proteins

According to the results of blastp in NCBI, the ScCaM from sugarcane shares high sequence similarity with CaM homologs from ten other plant species, ranging from 98% to 99% similarity. Multiple sequence alignments of ScCaM with 11 CaM proteins from other species by ClustalX showed that the CaMs were highly conserved (Figure 2A). All CaMs contained four EF-hands, which consist of an E-helix, a loop, and an F-helix. It is worth noting that the E-helix starts with a glutamic acid (E), and hydrophobic amino acids are distributed in sequence according to the rule of “h**h**h”, where “h” represents hydrophobic amino acids and “*” represents any amino acid. This special distribution pattern also applies to the F-helix of the first and third EF-hand, while the F-helix distribution patterns of the second and fourth EF-hands are slightly different from this pattern. About the loop, the first (site 1) and third (site 3) amino acids are both the much-conserved aspartic acid (D). The fifth (site 5) amino acid is usually aspartic acid (D) or asparagine (N), but the seventh (site 7) and ninth (site 9) amino acids are not conserved. The 12th (site 0) is a very conserved glutamic acid (E) with the function of linking two coordination sites. The sixth (site 6) amino acid, glycine (G), functions by maintaining the structure of the ring, while the isoleucine (I) at site 8 plays a part in forming hydrogen bonds to pair with other chiral molecular rings. The phylogenetic analysis indicates that these CaM proteins could be divided into two groups of dicots (Group A) and monocots (Group B) (Figure 2B). Moreover, ScCaM has a close relationship with CaMs from Zea mays and Triticum aestivum.

3.3. Expression of ScCaM in E. coli BL21 (DE3) Strain

In order to explore the prokaryotic expression conditions of the GST-ScCaM fusion protein, the expression temperature, duration, and IPTG concentration were compared and analyzed. As illustrated in Figure 3A, the GST-ScCaM fusion protein was expressed most clearly after 0.5 mM of IPTG induction for 20 h at 16 °C (Figure 3A). According to the GST fusion protein purification method, the cells were lysed, and the proteins in the supernatant were extracted and purified by affinity column chromatography. As EXPASY Protparam predicted, the molecular weight of the ScCaM protein was 16.83 kDa, while that of GST protein was 26 kDa. As Figure 3B demonstrates, the target protein of GST-ScCaM, which weighs about 43 kDa, was successfully induced and purified.

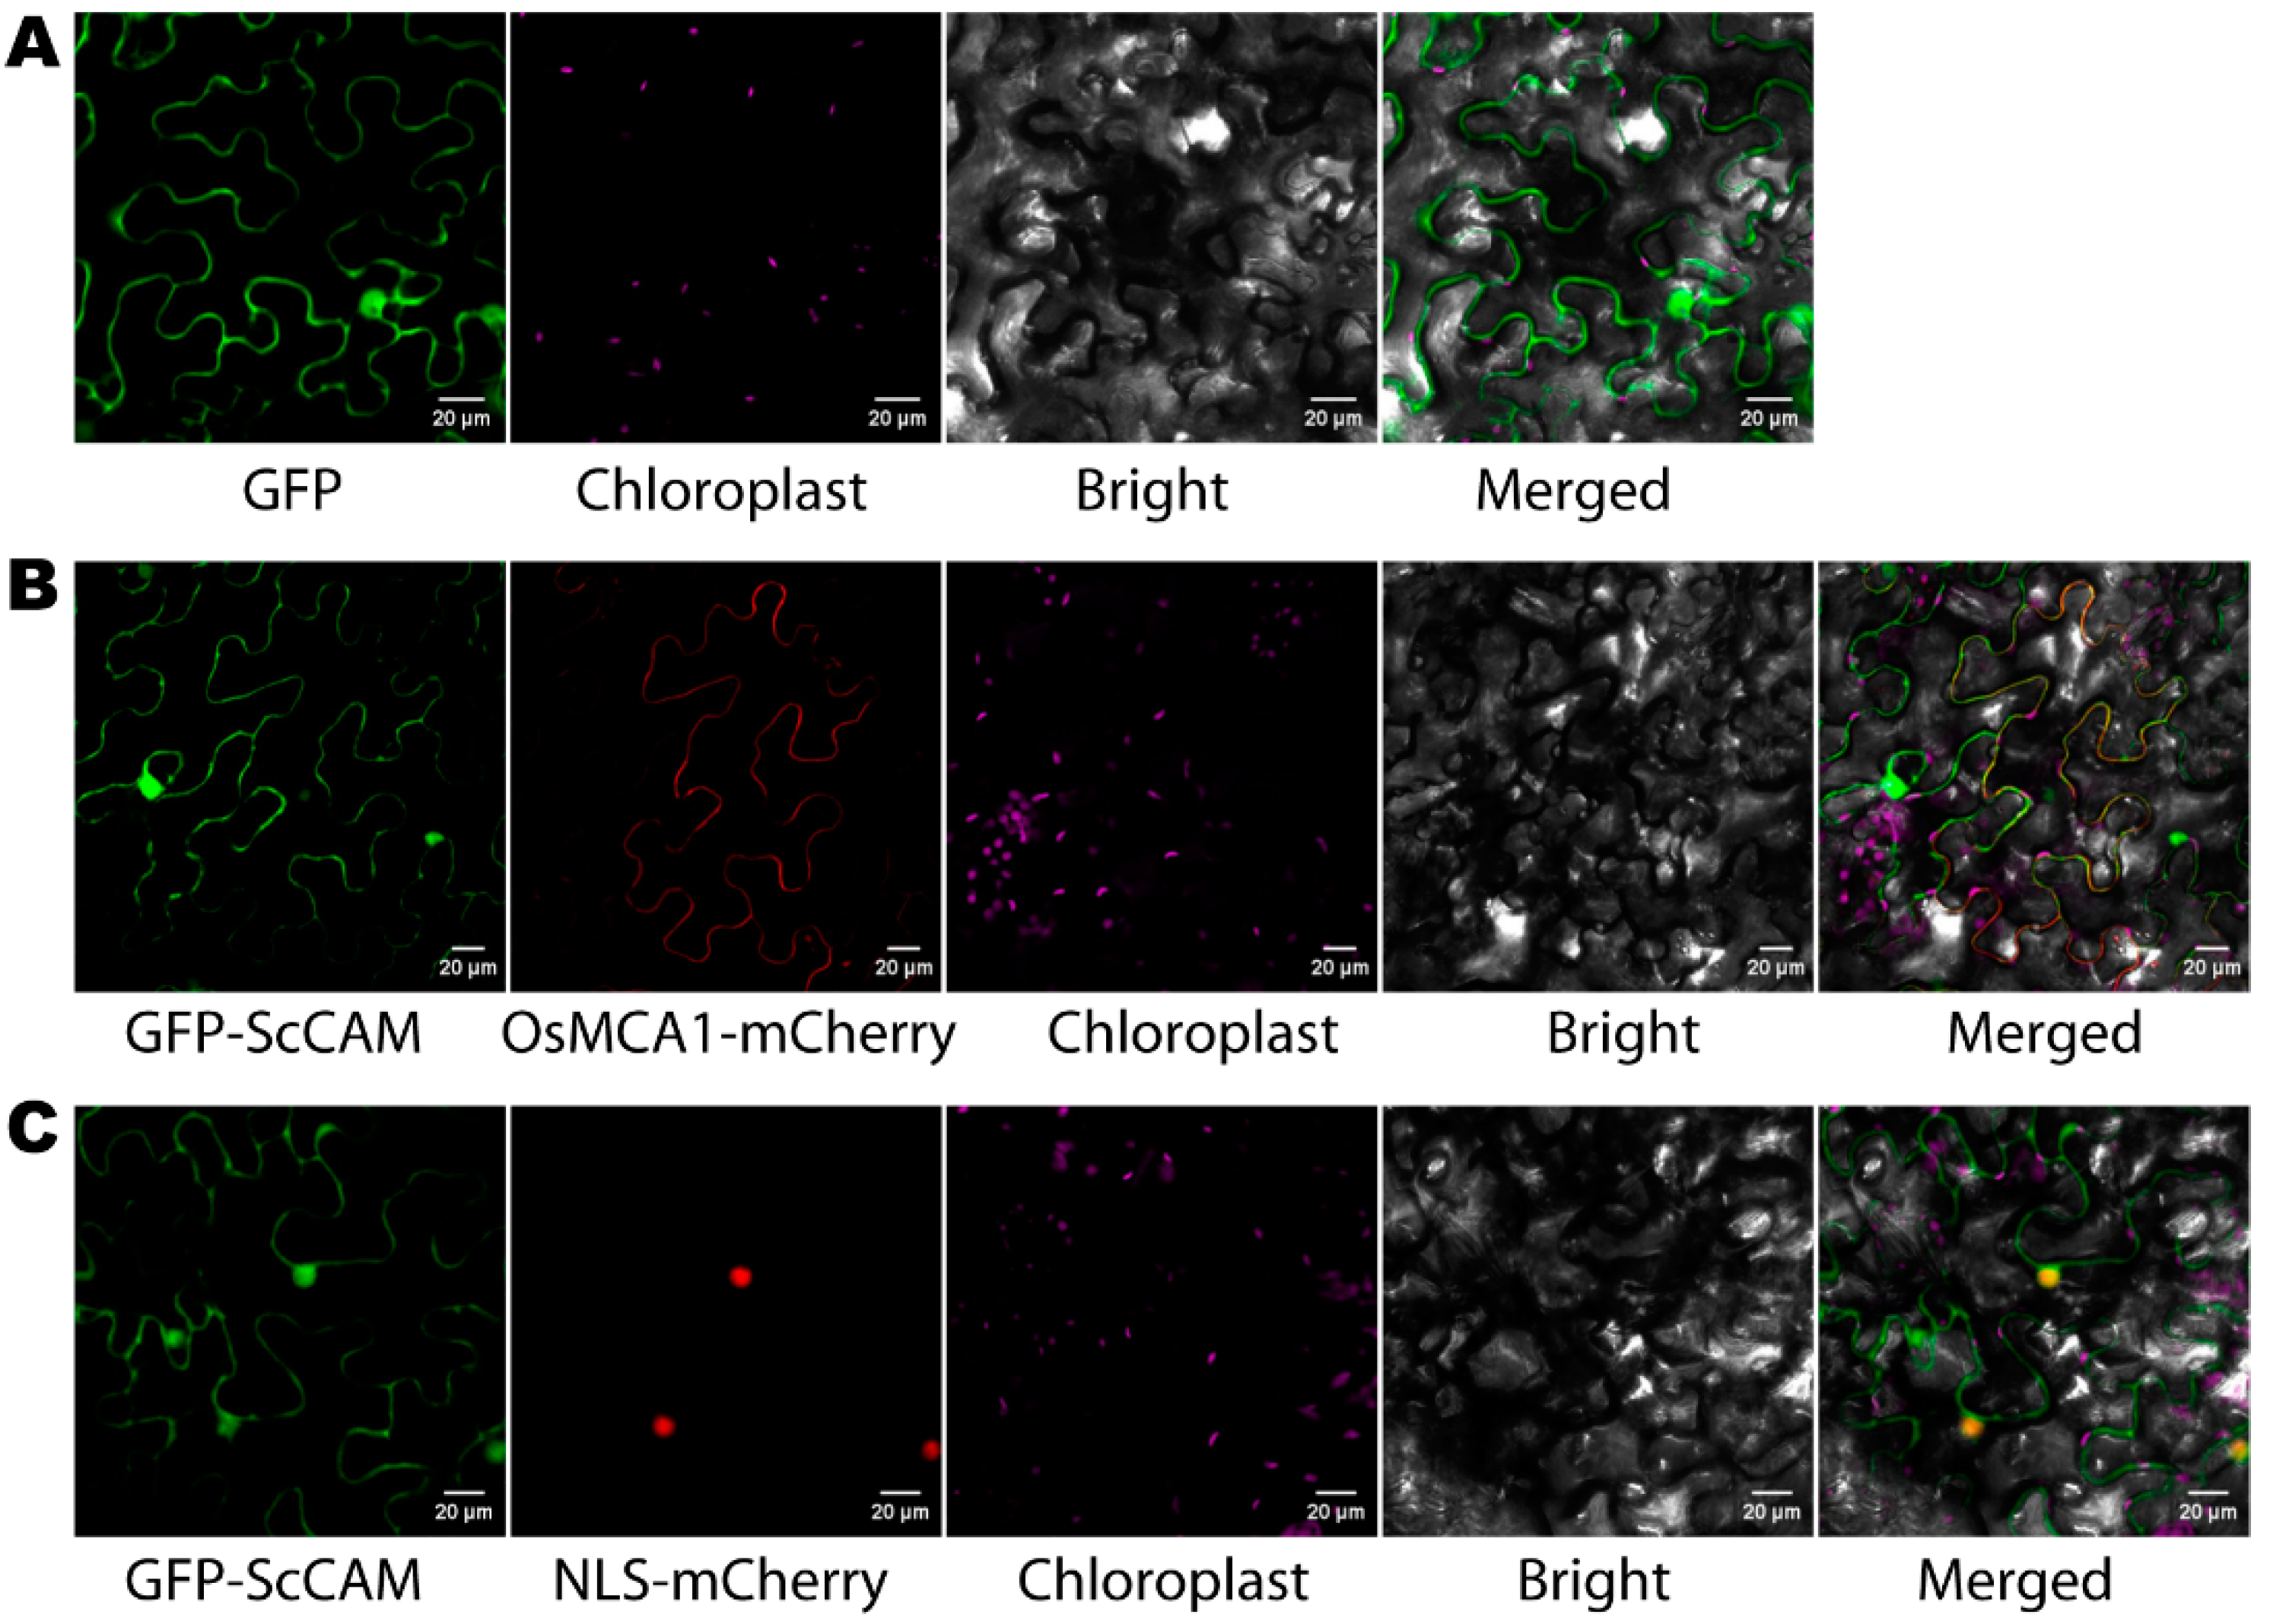
3.4. Subcellular Localization of ScCaM in N. benthamiana Cells

To confirm the subcellular localization of ScCaM, the leaves of tobacco were injected with pBWA(V)HS-ScCaM-GFP and OsMCA1-mcherry, and with pBWA(V)HS-ScCaM- GFP and NLS-mcherry. Previous studies have shown that OsMCA1-mcherry [20] is mainly expressed in the cell membrane, while NLS-mcherry [21] is expressed in the nucleus. Here, our results show that the ScCaM proteins were mainly located in the plasma membrane and nucleus (Figure 4).

3.5. Gene Expression Patterns of ScCaM under Abiotic Stress and Phytohormone Stimulation in Sugarcane

A qRT-PCR was used to analyze the expression levels of ScCaM in sugarcane under different exogenous stresses (Figure 5). In general, compared with the expression level at 0 h, ScCaM was induced at 3 h. Under NaCl stress, the expression level of ScCaM was induced at 3 h and 24 h. In the CrCl3-treated samples, ScCaM had the highest expression at 3 h, with the expression level being 7.1 times that of the control. However, the expression level of ScCaM was inhibited at 12 h and 24 h. As for SA treatment, the expression level of ScCaM was up-regulated at 3 h and 24 h and peaked at 24 h. Under MeJA treatment, the expression level of ScCaM was up-regulated at all treatment time points and peaked at 24 h at about 27 times that of the control.

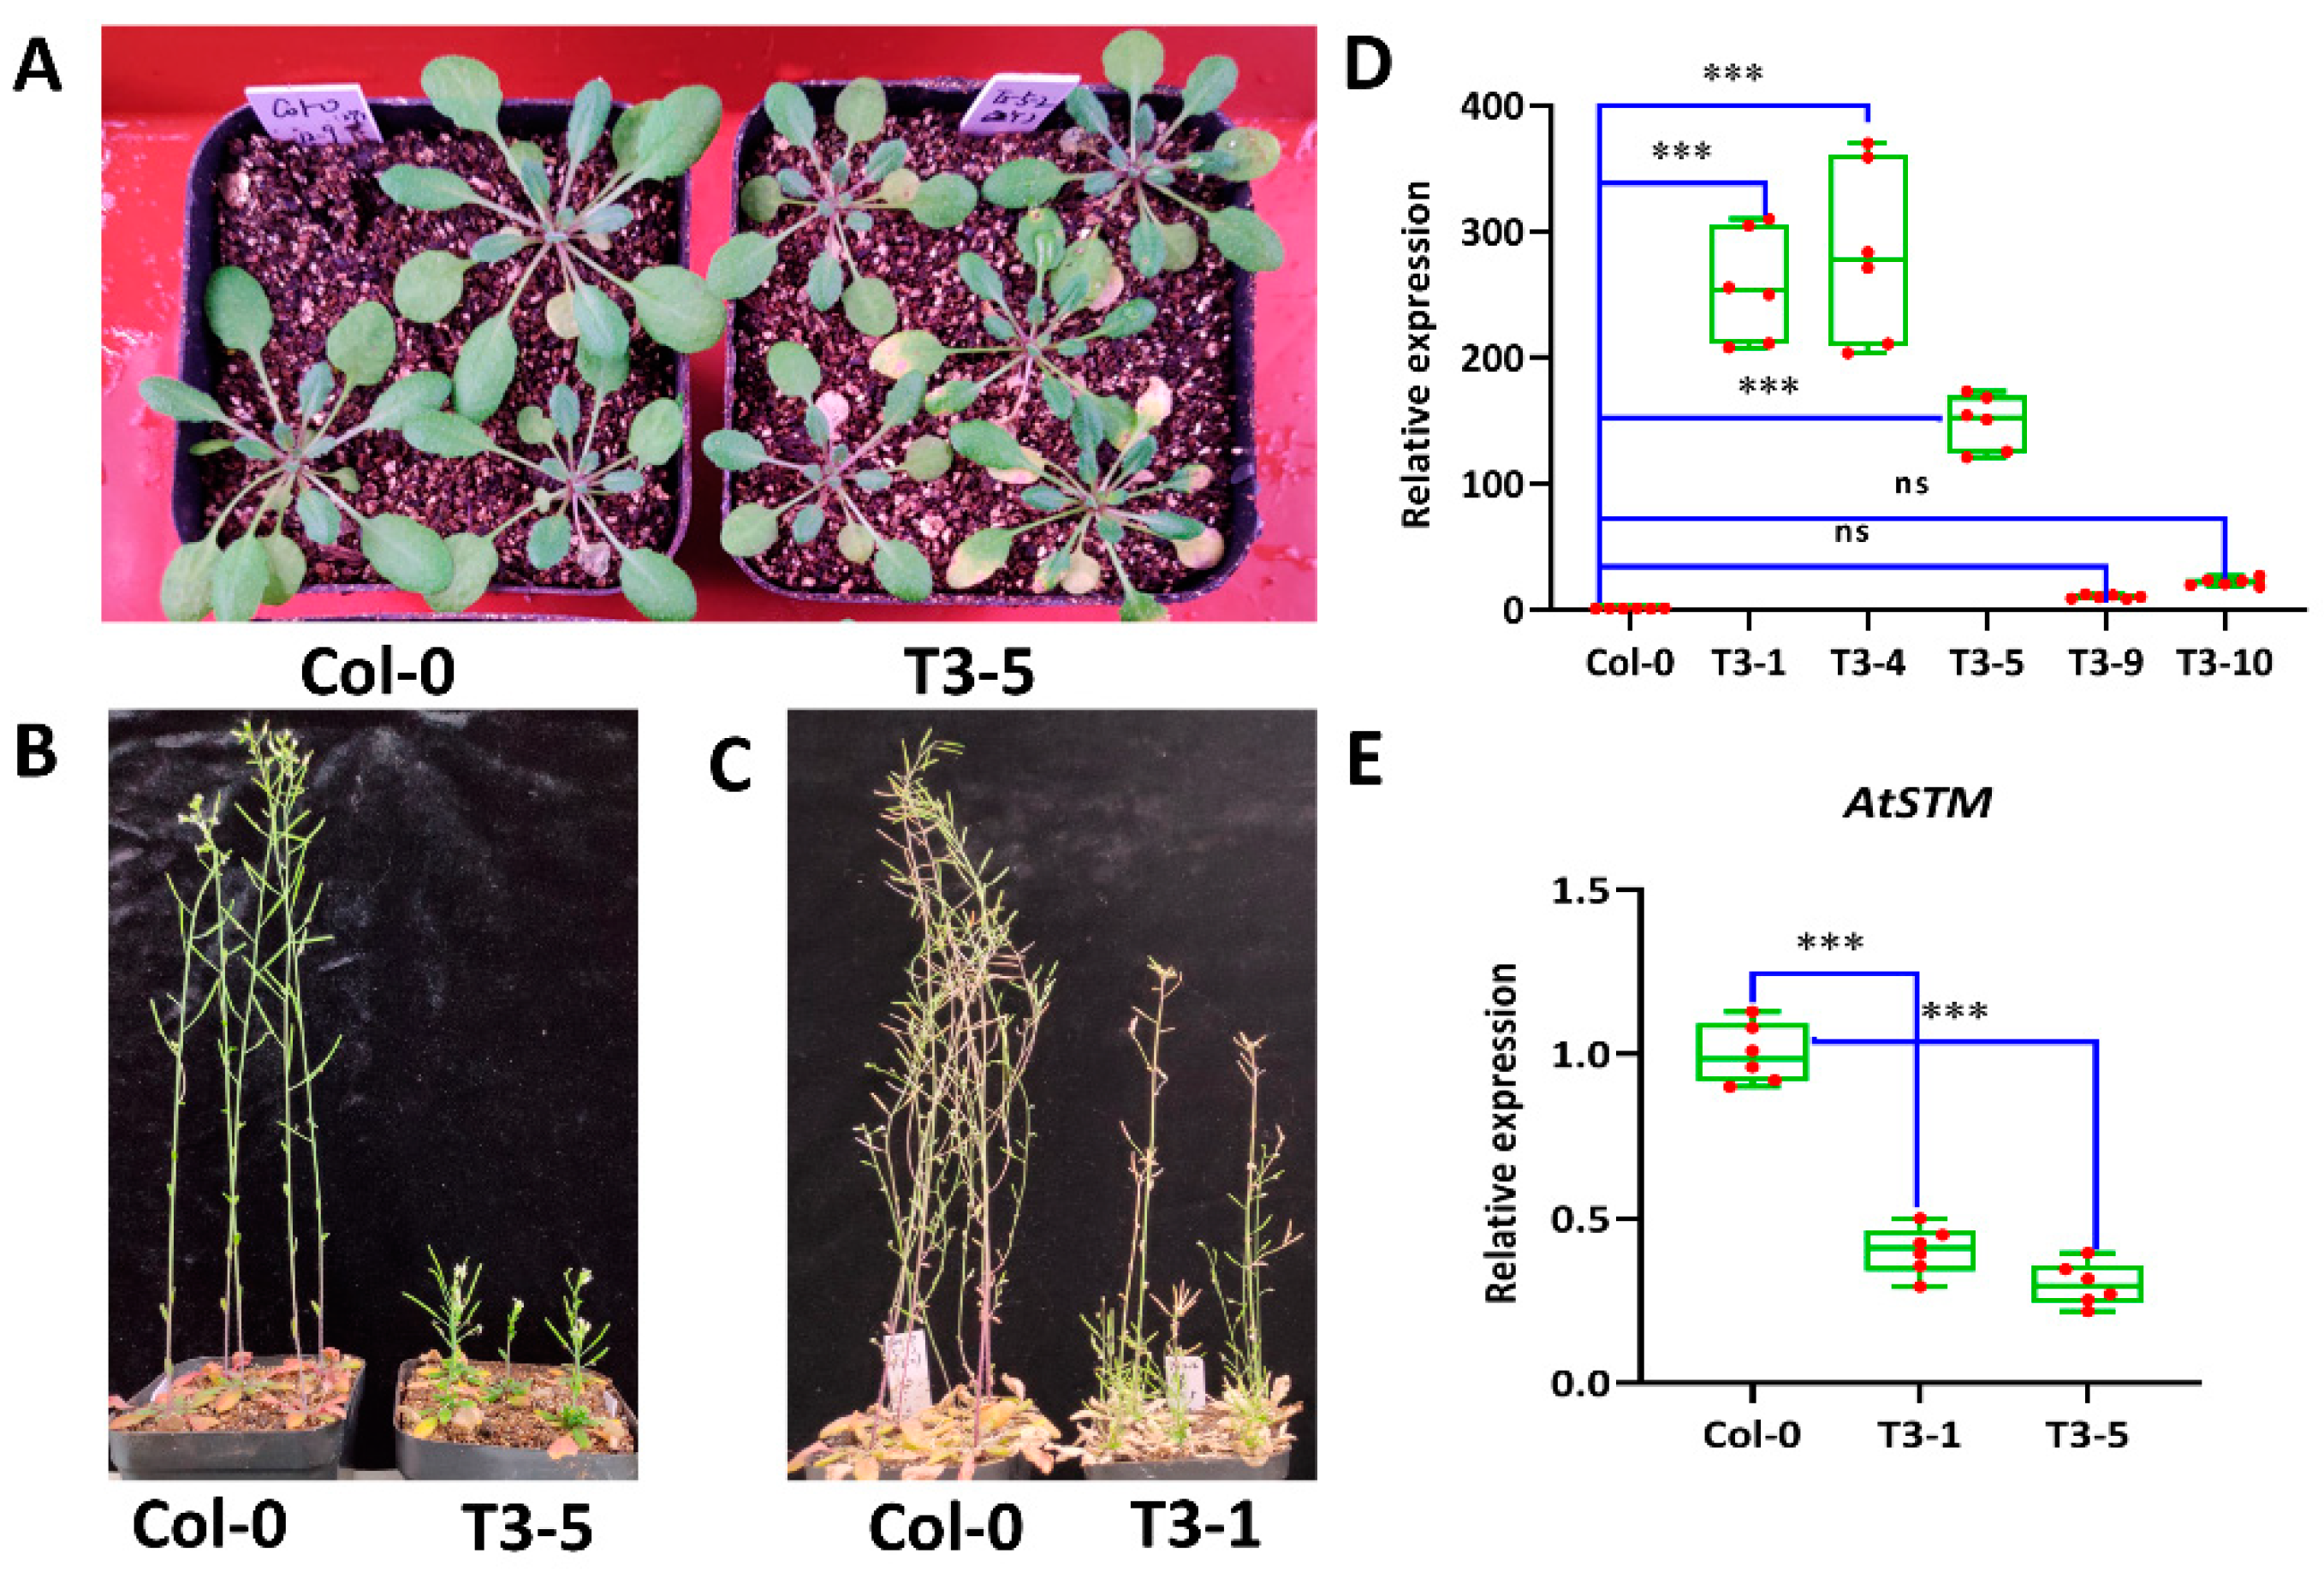
3.6. Overexpression of ScCaM Affect Growth and Development in A. thaliana

Through homomycin and RT-PCR amplification of the HYG gene, five homozygous transgenic A. thaliana lines of the T3 generation were selected. A qRT-PCR showed that the expression levels of ScCaM in the five lines were different (Figure 6D), and accordingly, the T3-1, T3-4, and T3-5 lines, which had higher expression levels, were retained as overexpressed materials for subsequent studies.
The phenotypic characteristics of transgenic and wild-type A. thaliana demonstrated that there was no significant difference between transgenic and wild-type A. thaliana at the early growth stage. After three weeks of growth, the transgenic A. thaliana showed slower growth and more premature senescence of old leaves compared with the wild-type A. thaliana (Figure 6A). In the reproductive growth stage, the stem growth of transgenic A. thaliana was slower than that of wild-type A. thaliana, and the spacing between fruit pods was shorter (Figure 6B). At the maturation stage of the fruit pods, the transgenic A. thaliana showed multiple tillers but fewer fruit pods, indicating a significant decrease in seed number compared with the wild-type A. thaliana (Figure 6C).
Based on these above results, a qRT-PCR was further used to detect the expression of AtMAX1, AtBRC1, AtCLV, AtWUS, and AtSTM, which relate to the growth and development in transgenic and wild-type A. thaliana (Figure 6E). It is worth noting that the expression of AtSTM in transgenic A. thaliana was lower than that of the wild-type A. thaliana, but no significant difference was observed in the expression of other genes (AtMAX1, AtBRC1, AtCLV, and AtWUS) (Figure 6E and Figure S1).

4. Discussion

Calcium (Ca2+), as an important second messenger, plays a vital role in signal transduction [22]. Calmodulin (CaM) is one of the most crucial calcium sensor proteins of signal transduction [23]. In the present study, one CaM gene was identified from a Saccharum spp. hybrid (ROC22). In addition, the ScCaM protein was isolated and its subcellular localization was analyzed. A qRT-PCR was used to verify the gene expression patterns of ScCaM under abiotic stress and phytohormone stimulation in sugarcane. Furthermore, the phenotypic characteristics and gene expression patterns were analyzed in transgenic A. thaliana. In summary, this study may provide important clues and a foundation for the further investigation of the function of the ScCaM gene in sugarcane.
Determining the subcellular localization of proteins in plant cells is important to provide useful clues for studying their functions [24]. In this study, the ScCaM protein was found to be located in the plasma membrane and nucleus, which was consistent with the locations of CaM proteins in Pisum sativum [25] and Cucumis sativus [26]. As ScCaM was located in the plasma membrane, we suppose that ScCAM, as a typical calmodulin, may conduct the calcium receptor signal on the plasma membrane in the medial part of the plasma membrane. If ScCaM is located in the nucleus, we can speculate that ScCaM may interact with transcription factors such as AtCaM7 [10] and GmCaM4 [9] to play an important role as a transcriptional regulator. Previous studies have shown that the calcium-dependent calmodulin-binding transcription factor CAMAT3 needs to bind CaM to activate downstream gene expression in the salicylic acid pathway [27]. Our results indicate that ScCaM may also play a role as a ligand of calmodulin-binding transcription factors that activate downstream pathways of the CAMTA proteins.
Previous studies have reported that CaM genes play important roles under various environmental stimuli [28,29]. In this study, the ScCaM gene was found to not only respond to stresses (NaCl and CrCl3), but also to phytohormone (SA and MeJA) stimulation. It is worth noting that ScCaM was usually induced at 3 h and 24 h under different stimuli. These results imply that ScCaM might not only be involved in the early response of calcium ion signals on the cell surface but also in the transcriptional activation of downstream genes.
In order to further verify the function of the ScCaM gene, ScCaM was heterologously overexpressed in A. thaliana. It is interesting that the homozygous transgenic lines began to show slower leaf growth and more premature senescence phenotypes after growing to three weeks of age under long light conditions. In addition, it was found that the internode of the stem became shorter and more tillered, which led to a decrease in fruit pod number and seed number. The results suggest that the overexpression of ScCaM may affect the lateral bud development and later reproductive development of A. thaliana. It is known that leaf senescence is the terminal stage of leaf development, including the yellowing of leaves caused by the degradation of chlorophyll and the reduction in photosynthesis and protein synthesis [30]. Ritu Kushwaha et al. have found that the overexpression of CAM7 can regulate the growth of A. thaliana [10]. In addition, the Calmodulin 1 (CaM1) gene, which encodes the Ca2+-binding protein calmodulin 1, positively regulates ROS production, leaf senescence, and ABA response in Arabidopsis [30]. Similarly, the overexpression of ScCaM had an impact on the growth and development of A. thaliana. By detecting the expression of several genes related to growth and development, AtSTM was found to be influenced by the overexpression of ScCaM. AtSTM is a specific regulatory factor of the shoot apical meristem and plays an important role in shoot apical meristem formation during embryogenesis [31]. AtSTM has the function of formation and maintenance of stem cell population and floral and carpel formation [31,32,33]. It may be inferred that the overexpression of the allogenic ScCaM gene inhibits the expression of AtSTM, leading to the phenomenon of multiple-tillering in transgenic A. thaliana. Taken together, these results indicate that ScCaM acts as an age-dependent regulator. However, the mechanism of how ScCaM regulates the growth and development of plants still requires further study.

5. Conclusions

In the present study, one CaM gene was isolated from a Saccharum spp. hybrid (ROC22). The protein sequence of ScCaM was analyzed. The phylogenetic tree indicated that ScCaM has a closer relationship with CaMs from Poaceae. A qRT-PCR demonstrated the involvement of ScCaM in response to NaCl, CrCl3, SA, and MeJA stresses. Subcellular localization showed that ScCaM was located in the plasma membrane and nucleus. In addition, the overexpression of ScCaM was found to have an impact on the growth and development of A. thaliana. Taken together, although the mechanism of ScCaM-regulated growth and development still needs further research, the present study provides novel insights into the expression and function of ScCaM in sugarcane and offers useful clues for the further verification of its function in the future.

Supplementary Materials

The following are available online at https://www.mdpi.com/article/10.3390/agronomy11112153/s1: Table S1: Primers used in this study; Table S2: Accession numbers used in sequence and phylogenetic analysis; Table S3: The ANOVA analysis of ScCaM under various stresses; Table S4: The ANOVA analysis of ScCaM and AtSTM; Table S5: The ANOVA analysis of the expression of genes (AtBRC1, AtCLV, AtWUS, and AtMAX); Figure S1: The transcripts of AtBRC, AtCLV, AtWUS, and AtMAX in the Arabidopsis thaliana of transgenic line (T3-5) and the wild type (Col-0). AtACT2 was used for normalization of the transcript levels.

Author Contributions

J.L. (Jinxian Liu), C.Z. and J.L. (Jun Luo) conceived, designed, and initiated the project. J.L. (Jinxian Liu), G.W. and X.F. prepared materials. J.L. (Jinxian Liu), C.Z., G.W. and X.F. performed experiments and contributed to data analysis and validation. J.L. (Jinxian Liu), J.L. (Jun Luo), W.S. and Y.Q. drafted the manuscript. J.L. (Jinxian Liu), J.L. (Jun Luo), W.S. and Y.Q. revised the manuscript. All authors have read and agreed to the published version of the manuscript.

Funding

This research was funded by the National Key R&D Program of China (2019YFD1000500 and 2018YFD1000503), the National Natural Science Foundation of China (31871688, 31671752, 31101196 and 31340060), the Natural Science Foundation of Fujian Province, China (2018J01470 and 2015J06006), Scientific research projects of introducing talents in Wuyi University (YJ202109), and China Agriculture Research System of MOF and MARA (CARS-17). The funders had no role in study design, data collection and analysis, decision to publish, or preparation of the manuscript.

Data Availability Statement

The data supporting the conclusions of this article are within the paper.

Acknowledgments

We are grateful to the reviewers for their helpful comments on the original manuscript. We would like to thank the editors for their efficient work.

Conflicts of Interest

The authors declare no conflict of interest.

References

  1. Defalco, T.A.; Bender, K.W.; Snedden, W.A. Breaking the code: Ca2+ sensors in plant signalling. Biochem. J. 2010, 425, 27–40. [Google Scholar] [CrossRef] [Green Version]
  2. Strynadka, N.C.; James, M.N. Crystal structures of the helix-loop-helix calcium-binding proteins. Annu. Rev. Biochem. 1989, 58, 951–998. [Google Scholar] [CrossRef]
  3. Chin, D.; Means, A.R. Calmodulin: A prototypical calcium sensor. Trends Cell Biol. 2000, 10, 322–328. [Google Scholar] [CrossRef]
  4. Mohanta, T.K.; Kumar, P.; Bae, H. Genomics and evolutionary aspect of calcium signaling event in calmodulin and calmodulin-like proteins in plants. BMC Plant Biol. 2017, 17, 38. [Google Scholar] [CrossRef] [PubMed] [Green Version]
  5. McCormack, E.; Tsai, Y.-C.; Braam, J. Handling calcium signaling: Arabidopsis CaMs and CMLs. Trends Plant Sci. 2005, 10, 383–389. [Google Scholar] [CrossRef]
  6. La Verde, V.; Dominici, P.; Astegno, A. Towards understanding plant calcium signaling through calmodulin-like proteins: A biochemical and structural perspective. Int. J. Mol. Sci. 2018, 19, 1331. [Google Scholar] [CrossRef] [Green Version]
  7. Du, L.; Ali, G.S.; Simons, K.A.; Hou, J.; Yang, T.; Reddy, A.S.N.; Poovaiah, B.W. Ca2+/calmodulin regulates salicylic-acid-mediated plant immunity. Nature 2009, 457, 1154–1158. [Google Scholar] [CrossRef] [PubMed]
  8. Du, L.; Poovaiah, B.W. Ca2+/calmodulin is critical for brassinosteroid biosynthesis and plant growth. Nature 2005, 437, 741–745. [Google Scholar] [CrossRef] [PubMed]
  9. Rao, S.S.; El-Habbak, M.H.; Havens, W.M.; Singh, A.; Zheng, D.; Vaughn, L.; Haudenshield, J.S.; Hartman, G.L.; Korban, S.S.; Ghabrial, S.A. Overexpression of GmCaM4 in soybean enhances resistance to pathogens and tolerance to salt stress. Mol. Plant Pathol. 2014, 15, 145–160. [Google Scholar] [CrossRef]
  10. Kushwaha, R.; Singh, A.; Chattopadhyay, S. Calmodulin 7 plays an important role as transcriptional regulator in Arabidopsis seedling development. Plant Cell 2008, 20, 1747–1759. [Google Scholar] [CrossRef] [Green Version]
  11. Liu, X.Y.; Wang, X.J.; Xue, J.; Xia, N.; Deng, L.; Cai, G.L.; Tang, C.L.; Wei, G.L.; Huang, L.L.; Kang, Z.S. Cloning and expression analysis of a novel calmodulin isoform TaCaM5 from wheat. Acta Agron. Sin. 2010, 36, 953–960. [Google Scholar] [CrossRef]
  12. Su, W.; Zhang, C.; Feng, J.; Feng, A.; You, C.; Ren, Y.; Wang, D.; Sun, T.; Su, Y.; Xu, L.; et al. Genome-wide identification, characterization and expression analysis of the carotenoid cleavage oxygenase (CCO) gene family in Saccharum. Plant Physiol. Biochem. 2021, 162, 196–210. [Google Scholar] [CrossRef] [PubMed]
  13. Azevedo, R.A.; Carvalho, R.F.; Cia, M.C.; Gratão, P.L. Sugarcane under pressure: An overview of biochemical and physiological studies of abiotic stress. Trop. Plant Biol. 2011, 4, 42–51. [Google Scholar] [CrossRef]
  14. Wang, L.; Tsuda, K.; Sato, M.; Cohen, J.D.; Katagiri, F.; Glazebrook, J. Arabidopsis CaM binding protein CBP60g contributes to MAMP-induced SA accumulation and is involved in disease resistance against Pseudomonas syringae. PLoS Pathog. 2009, 5, e1000301. [Google Scholar] [CrossRef] [Green Version]
  15. Parvin, S.; Lee, O.R.; Sathiyaraj, G.; Khorolragchaa, A.; Kim, Y.J.; Devi, B.S.; Yang, D.C. Interrelationship between calmodulin (CaM) and H2O2 in abscisic acid-induced antioxidant defense in the seedlings of Panax ginseng. Mol. Biol. Rep. 2012, 39, 7327–7338. [Google Scholar] [CrossRef]
  16. Que, Y.; Xu, L.; Liu, J.; Guo, J.; Zheng, Y.; Xu, J.; Yuan, Z.; Chen, P.; Chen, R. Construction of full-length cDNA library from sugarcane leaves and the corresponding EST analysis. J. Agric. Biotechnol. 2009, 17, 843–850. [Google Scholar]
  17. Su, W.; Zhang, C.; Wang, D.; Ren, Y.; Sun, T.; Feng, J.; Su, Y.; Xu, L.; Shi, M.; Que, Y. The CaCA superfamily genes in Saccharum: Comparative analysis and their functional implications in response to biotic and abiotic stress. BMC Genom. 2021, 22, 549. [Google Scholar] [CrossRef]
  18. Wu, G.; Liu, S.; Zhao, Y.; Wang, W.; Kong, Z.; Tang, D. ENHANCED DISEASE RESISTANCE4 associates with CLATHRIN HEAVY CHAIN2 and modulates plant immunity by regulating relocation of EDR1 in Arabidopsis. Plant Cell 2015, 27, 857–873. [Google Scholar] [CrossRef] [Green Version]
  19. Livak, K.J.; Schmittgen, T.D. Analysis of relative gene expression data using real-time quantitative PCR and the 2−ΔΔCT method. Methods 2001, 25, 402–408. [Google Scholar] [CrossRef] [PubMed]
  20. Kurusu, T.; Nishikawa, D.; Yamazaki, Y.; Gotoh, M.; Nakano, M.; Hamada, H.; Yamanaka, T.; Iida, K.; Nakagawa, Y.; Saji, H.; et al. Plasma membrane protein OsMCA1 is involved in regulation of hypo-osmotic shock-induced Ca2+ influx and modulates generation of reactive oxygen species in cultured rice cells. BMC Plant Biol. 2012, 12, 11. [Google Scholar] [CrossRef] [PubMed] [Green Version]
  21. Zhao, F.; Zhao, T.; Deng, L.; Lv, D.; Zhang, X.; Pan, X.; Xu, J.; Long, G. Visualizing the Essential Role of Complete Virion Assembly Machinery in Efficient Hepatitis C Virus Cell-to-Cell Transmission by a Viral Infection-Activated Split-Intein-Mediated Reporter System. J. Virol. 2017, 91, e01720-16. [Google Scholar] [CrossRef] [Green Version]
  22. McAinsh, M.R.; Pittman, J.K. Shaping the calcium signature. New Phytol. 2009, 181, 275–294. [Google Scholar] [CrossRef]
  23. Mohanta, T.K.; Yadav, D.; Khan, A.L.; Hashem, A.; Abd Allah, E.F.; Al-Harrasi, A. Molecular players of EF-hand containing calcium signaling event in plants. Int. J. Mol. Sci. 2019, 20, 1476. [Google Scholar] [CrossRef] [PubMed] [Green Version]
  24. Sperschneider, J.; Catanzariti, A.-M.; DeBoer, K.; Petre, B.; Gardiner, D.M.; Singh, K.B.; Dodds, P.N.; Taylor, J.M. LOCALIZER: Subcellular localization prediction of both plant and effector proteins in the plant cell. Sci. Rep. 2017, 7, 44598. [Google Scholar] [CrossRef] [PubMed] [Green Version]
  25. Dauwalder, M.; Roux, S.J.; Hardison, L. Distribution of calmodulin in pea seedlings: Immunocytochemical localization in plumules and root apices. Planta 1986, 168, 461–470. [Google Scholar] [CrossRef] [PubMed]
  26. Yu, B.; Yan, S.; Zhou, H.; Dong, R.; Lei, J.; Chen, C.; Cao, B. Overexpression of CsCaM3 improves high temperature tolerance in cucumber. Front. Plant Sci. 2018, 9, 797. [Google Scholar] [CrossRef]
  27. Nie, H.; Zhao, C.; Wu, G.; Wu, Y.; Chen, Y.; Tang, D. SR1, a calmodulin-binding transcription factor, modulates plant defense and ethylene-induced senescence by directly regulating NDR1 and EIN3. Plant Physiol. 2012, 158, 1847–1859. [Google Scholar] [CrossRef] [Green Version]
  28. Hepler, P.K. Calcium: A central regulator of plant growth and development. Plant Cell 2005, 17, 2142–2155. [Google Scholar] [CrossRef]
  29. Berridge, M.J.; Lipp, P.; Bootman, M.D. Signal transduction. The calcium entry pas de deux. Science 2000, 287, 1604–1605. [Google Scholar] [CrossRef]
  30. Dai, C.; Lee, Y.; Lee, I.C.; Nam, H.G.; Kwak, J.M. Calmodulin 1 Regulates Senescence and ABA Response in Arabidopsis. Front. Plant Sci. 2018, 9, 803. [Google Scholar] [CrossRef] [PubMed] [Green Version]
  31. Long, J.A.; Moan, E.I.; Medford, J.I.; Barton, M.K. A member of the KNOTTED class of homeodomain proteins encoded by the STM gene of Arabidopsis. Nature 1996, 379, 66–69. [Google Scholar] [CrossRef] [PubMed]
  32. Endrizzi, K.; Moussian, B.; Haecker, A.; Levin, J.Z.; Laux, T. The SHOOT MERISTEMLESS gene is required for maintenance of undifferentiated cells in Arabidopsis shoot and floral meristems and acts at a different regulatory level than the meristem genes WUSCHEL and ZWILLE. Plant J. 1996, 10, 967–979. [Google Scholar] [CrossRef] [PubMed]
  33. Barton, M.K.; Poethig, R.S. Formation of the shoot apical meristem in Arabidopsis thaliana: An analysis of development in the wild type and in the shoot meristemless mutant. Development 1993, 119, 823–831. [Google Scholar] [CrossRef]
Figure 1. The analysis of sequence, conserved domains, and protein structure. (A) Complete cDNA and deduced amino acid sequences of the ScCaM gene. (B) The conserved domains of ScCaM. (C) The three-dimensional model of ScCaM.
Agronomy 11 02153 g001
Figure 2. The sequence homology and phylogenetic analysis. (A). Sequence homology analysis of ScCaM and the other 11 CaMs from other plant species. The black, blue, and yellow rectangles represent the E-helix, loop, and F-helix, respectively. “h” represents hydrophobic amino acids and “*” represents any amino acid. (B). Phylogenetic analysis of CaM proteins from 12 plant species. All the corresponding GenBank accessions are listed in Table S2.
Agronomy 11 02153 g002
Figure 3. Prokaryotic expression of the pGEX-4T-ScCaM fusion protein in Escherichia coli BL21 (DE3). (A). Prokaryotic expression of the pGEX-4T-ScCaM fusion protein in Escherichia coli BL21 (DE3) by 0.5 mM of IPTG induced at 16 °C. Note: M, protein marker; 0, control; 1–4, pGEX-4T-ScCaM induction for 0, 2, 8, and 20 h, respectively. (B). Prokaryotic expression of the pGEX-4T-ScCaM fusion protein in Escherichia coli BL21 (DE3) after 0.5 mM of IPTG induced for 20 h at 16 °C. Note: M, protein marker; 1, pGEX-4T-ScCaM induction for 20 h.
Agronomy 11 02153 g003
Figure 4. Subcellular localization analysis of ScCaM in Nicotiana benthamiana leaves. (A). The subcellular localization analysis of pBWA(V)HS-GFP. (B). The subcellular localization analysis of pBWA(V)HS-ScCaM-GFP and OsMCA1-mCherry. (C). The subcellular localization analysis of pBWA(V)HS-ScCaM-GFP and NLS-mCherry.
Agronomy 11 02153 g004
Figure 5. Expression profile of the ScCaM gene under different stresses in sugarcane. GAPDH was used for the normalization of the transcript levels. Asterisks indicate a significant difference, as determined by a one-way ANOVA (treatment: control/salt) between subjects, followed by Duncan’s new multiple range test (ns indicates no significant difference, * p < 0.05, *** p < 0.01). The F-statistics, degrees of freedom, and p-value for each factor or interaction were shown in Table S3.
Agronomy 11 02153 g005
Figure 6. Overexpression of ScCaM in Arabidopsis thaliana. (A). Phenotypes of 3-week-old plants of the transgenic line (T3-5) and the wild type (Col-0). (B). Phenotypes of 6-week-old plants of the transgenic line (T3-5) and the wild type (Col-0). (C). Phenotypes of 9-week-old plants of the transgenic line (T3-5) and the wild type (Col-0). (D). The transcripts of ScCaM in the transgenic Arabidopsis thaliana. (E). The transcripts of AtSTM in the Arabidopsis thaliana of the transgenic line (T3-5) and the wild type (Col-0). AtACT2 was used for the normalization of the transcript levels. Asterisks indicate a significant difference, as determined by a one-way ANOVA (treatment: WT/transgenic), followed by Duncan’s new multiple range test (ns indicates no significant difference, *** p < 0.01). The F-statistics, degrees of freedom, and p-value for each factor or interaction are shown in Tables S4 and S5.
Agronomy 11 02153 g006
Publisher’s Note: MDPI stays neutral with regard to jurisdictional claims in published maps and institutional affiliations.

