Article

Optimizing Tomato Growth and Productivity Using Nitrogen and Irrigation Application Timing

by
Ibukun T. Ayankojo
* and
Kelly T. Morgan
Southwest Florida Research and Education Center, Institute of Food and Agricultural Sciences, University of Florida, Immokalee, FL 34142, USA
*
Author to whom correspondence should be addressed.
Agronomy 2021, 11(10), 1968; https://doi.org/10.3390/agronomy11101968
Submission received: 8 September 2021 / Revised: 24 September 2021 / Accepted: 27 September 2021 / Published: 29 September 2021

Abstract

:
Soil nutrients and water management practices according to the concept of 4R nutrient stewardship (right rate, right timing, right placement, and right source) can have significant benefits on crop productivity and reduce the negative effects of agricultural practices on the environment. Therefore, this present study evaluated the effects of nitrogen (N) application timing under different irrigation regimes on open-field, fresh-market tomato production in Florida. In this study, 2 N application timings applied at 25% pre-plant with 75% fertigation (BM), and 0 pre-plant with 100% fertigation (NB), were evaluated. The two N application methods were evaluates using three irrigation regimes: full irrigation (FI, 100% ETc), deficit irrigation (DI, 66% ETc), and regulated deficit irrigation (RDI, 66% ETc during the first 4 weeks after transplanting and 100% ETc afterward). The results showed that BM treatment significantly improved early-season tomato growth compared to NB treatment. The results also indicated that under RDI and DI irrigation conditions, tomato root length was lowest (average value of 13%) within the first 15 cm compared to 40% within 15–30 cm and 47% at 30–40 cm soil depths. Similar to plant growth, BM treatment significantly increased tomato yield (average valued 56.00 Mg ha−1) compared to the NB (average value 40.23 Mg ha−1). The application of DI throughout the growing season reduced tomato yield; however, there were no differences in yield under the RDI and FI irrigation regimes. Therefore, based on the results from this study, it can be concluded that, under Florida growing conditions, pre-plant N application is essential for tomato growth and productivity. Additionally, irrigation application using the RDI method could be successfully adopted in Florida tomato production for improved water savings without any negative effects on tomato growth and productivity.

1. Introduction

Effective nutrient and irrigation management are major requirements for tomato production on sandy Florida soils and critical for optimum yields and fruit quality [1]. This is because excessive irrigation increases percolation and reduces nutrient retention in sandy soil [2], while inadequate irrigation application can reduce yield and harvest quality [3]. Similar to irrigation, crop nutrient application targeting critical growth stages is essential to improve uptake efficiency and reduce the risk of groundwater pollution [4,5].
In crop production, the appropriate fertilizer management is a function of four major components of nutrient stewardship (4Rs): right source, right rate, right placement, and right timing [6]. Nutrient management practices designed according to the 4R principle can provide nutrients for optimal crop uptake, increase use efficiency, reduce the risk of nutrient loss to the environment, and subsequently minimize adverse environmental impacts [6]. The concept of the 4Rs is well known in crop nutrient management; however, in Florida, there is a fifth R. In addition to the 4R, the concept of 5R in vegetable production involves the right irrigation practice [6]. The fifth R is especially critical under Florida conditions. This is because most Florida soils are sandy (up to 95% sand). Therefore, excessive or inadequate irrigation management (5th R) may offset the benefits of one or more of the 4R concepts; therefore, nutrient leaching, environmental contamination, and/or low crop productivity may occur.
Nutrient management according to the right timing principle considers nutrient application based on the crop growth pattern; therefore, the crop changes in nutrient demand based on growth stage are monitored [4] compared to the fixed-time or one-time nutrient application method. To determinate tomato cultivars, growth and development begins slowly from seed to germination, increases through fruiting, and finally slows down at maturity. The tomato nutrient and water demand follows the same pattern as the growth during the production season. Fruiting vegetables, such as the tomato, require a relatively low nutrient demand until the flowering stage when nutrient uptake accelerates, reaching a peak during fruit setting and early fruit bulking [1].
The appropriate fertilizer application timing and irrigation management are key factors for increasing crop nutrient uptake efficiency and productivity [7,8]. Similarly, tomato plants cannot recover 100% of the total nutrient applied (especially N), hence, inappropriate nutrient management may result in a major loss from the cropping system or significant post-harvest residue in the soil [9,10,11]. Therefore, the combination of N and irrigation timing targeting critical growth stages may increase N uptake, improving plant growth and yield. This study was conducted to evaluate the effects of N and the irrigation application timing on biomass accumulation, root growth, and yield in open-field, fresh-market tomato production.

2. Materials and Methods

2.1. Study Location and Treatment Specifications

The study site was located at the University of Florida, Southwest Florida Research and Education Center (SWFREC) in Immokalee, Florida (26°27′44′′ N and longitude 81°26′36′′ W, elevation of 10.4 m above sea level) and was conducted during spring (SP) and fall (FA) growing seasons of 2018 and 2019. The soil at the study location was classified as Spodosol (soil Order) and Immokalee fine sand (soil series) with up to 97% sand and low soil organic matter content, and thus low water holding capacity [12]. The soil slope was nearly flat (0–2%), with low runoff, poor natural drainage, and a relatively high saturated hydraulic conductivity (Ksat) of 15.82 cm h−1 within the first 15 cm of soil depth [13]. The depth of the seasonal high-water table ranged from 46 cm to 91 cm with low available water storage in the profile (field capacity at 0.09 cm3 cm−3 in the upper 15 cm soil depth). Selected physical and chemical properties (Table 1) of the soil at the experimental site were adapted from a previous study by Kadyampakeni et al., (2014b) on the same soil type adjacent to the experimental site. The average air temperature ranged from 16 °C to 27 °C and cumulative precipitation during the growing season ranged from 103 mm to 257 mm [14].
During the growing seasons of 2018 (SP-18 and FA-18), 6 treatments consisting of 2 N application timing and 3 irrigation regimes were evaluated as described in Table 2. During both seasons, irrigation was applied daily as full irrigation (FI) at 100% crop water requirement (ETc), deficit irrigation (DI) at 66% ETc, and regulated deficit irrigation (RDI) at 66% ETc early in the season (0–4 weeks after transplant), and 100% ETc (from 5 weeks after transplant). For N application timing, treatments were applied at either 25% pre-plant with 75% fertigation (BM) or 0 pre-plant with 100% fertigation (NB). Fertigation started immediately after transplanting for the NB treatment; however, fertigation for the BM treatment started at 5 weeks after transplanting (WAT). All treatments were arranged in a split-plot design with irrigation regime as the main event and N timing as the secondary effect. A detailed description of irrigation nutrient management is presented in the next section.
A repeat of the 2018 experiment was conducted with a refined treatment selection during the 2019 seasons (SP-19 and FA-19). The evaluated treatments during the 2019 study were a slight modification of the 2018 experiment to allow for a better understanding of results obtained during the previous two seasons. In 2019, the study consisted of 4 treatments combining N application timing and irrigation regimes, as in 2018. In this study, the FI and DI were repeated each with NB treatment as applied during 2018 seasons; however, RDI was applied under two N application timings. Under the RDI irrigation conditions, the BM fertigation (starting at 5 WAT) was repeated as described in 2018 and compared with an earlier start of fertigation at 3 WAT (BM3). More detailed information on treatment descriptions during the 2019 season is provided in Table 1.

2.2. Pre-Planting and Planting Operations

For the BM and BM3 treatments, a pre-plant, dry fertilizer 16-4-8 (N-P2O5, and K2O) was broadcast-applied at 80 cm row width (corresponding to bed width) along the planting row. Pre-plant fertilizer was applied at the rates of 56, 14, and 28 kg ha−1 for N, P2O5, and K2O, respectively. Only N was not applied as pre-plant for the NB treatments; the corresponding P2O5, and K2O were manually applied before bed formation. All pre-plant fertilizer was incorporated (by plowing) into the soil along the planting rows before bed formation. Tomato planting beds (21 cm height, 80 cm width) were made immediately after the pre-plant fertilizer was disc-incorporated into the soil. During bed formation, soil fumigant Pic Clor 60 (Agrian, Fresno, CA, USA, a.i chloropicrin and 1,3-Dichloropropene at 59.6% and 39.0%, respectively) was applied at the rate of 223 kg ha−1 and immediately covered with polyethylene mulch. A 1.0 mil white/black (white side up during spring and black side up during fall seasons) polyethylene mulch (Berry plastics, Calhoun, GA, USA) was used during each growing season. Two drip tapes (thinwall drip lines, 5 mm streamline Plus 630 series by Netafim, Fresno, CA, USA) each with an application rate of 0.9 L/h/emitter were installed on the surface of each bed under the plastic mulch. The drip tapes with emitter spacing of 60 cm were used throughout the experiment. Tomato seedlings (variety 1823 by Harris Moran, Modesto, CA, USA) were transplanted at about 5 weeks after germination at 60 cm plant spacing in a single row about 21 days after bed preparation. In each season, seedlings were planted at 9410 per ha. Pests and diseases were controlled by a weekly application of pesticides as recommended for tomato production in Florida [15]

2.3. Irrigation and Fertigation Practices

Crop water requirements were determined using evapotranspiration (ET)-based SmartIrrigation (SI) vegetable irrigation scheduler. SI is a smartphone-enabled application that uses real-time and location-specific ET data for irrigation scheduling of vegetable crops (tomato, squash, cabbage, and watermelon). SI scheduler is an ET-based model designed as a smartphone application using ETo from FAO Penman–Monteith procedure [16] and Kc (Table 3) to determine crop water requirements [17]. At the time of scheduling, the SI automatically connects to the Florida Automated Weather Network and Georgia Automated Environmental Monitoring Network stations for specific scheduling locations in Florida and Georgia, respectively. SI App used meteorological data of the previous 5 d before the scheduling time from the weather station located within 0.5 km of the research site was used to calculate ET, whereas Kc values (Table 3) were determined based on the time between the planting and scheduling dates. More detailed information on SI vegetable approach for irrigation scheduling was described by [17]. Previous studies reported that SI vegetable improved tomato yield and reduced nutrient leaching compared to the historic ET-based irrigation scheduling method [3,18]. Except where otherwise mentioned, irrigation application started after transplanting during each season. After irrigation scheduling, the corresponding volume of irrigation (at the scheduling time) was applied daily (after deducting the volume of water applied during fertigation) to each treatment for seven consecutive days. The volume of irrigation water applied to each treatment was controlled and recorded by a flow meter (M 3.81 cm size by Netafilm, Fresno, CA, USA). Each flow meter was coupled to irrigation manifolds that were connected to the drip lines in the beds. Water pressure from the irrigation manifolds was controlled by pressure regulators (15 PSI by Senninger Irrigation Inc. Orlando, FL, USA) to maintain a uniform and constant pressure along the drip lines. To prevent excessive water application from a one-time irrigation event, the daily total irrigation time was applied at two or three events (depending on the scheduled irrigation volume). At each irrigation event, application was controlled by a hose-end irrigation timer (model IZEHTMR by Rain bird, Azusa, CA, USA). According to the irrigation application guideline by Stanley and Clark, [19], irrigation time was kept under 30 min per event (based on the flow rate of the drip line used) to avoid N leaching in sandy soils.
Total season N, P2O5, and K2O (224, 12, and 224 kg ha−1, respectively) application rates were the same for each treatment and season Table 4. Since 56 kg ha−1-N was applied as pre-plant for the BM and BM2 treatments, additional 168 kg ha−1-N was applied (to reach the total N rate treatment at 224 kg ha−1-N) through fertigation using fertilizer 18-4-18 (N-P2O5-K2O) (Griffin Fertilizer Co., Frostproof, FL, USA). The corresponding cumulative daily N requirements for each treatment were determined and applied twice a week during each season. The total N application for the NB treatments was the same as the BM (224 kg ha−1-N).

2.4. Crop Biomass and Yield Estimation

Both above ground (leaves, stems, and fruits) and below ground (root) biomass samples were collected at every growth stage (Table 3). At every sampling period, biomass samples were collected from one plant (that represented the plot population) per treatment replicate (four replicates per treatment). Root samples were collected starting at the crop growth stage (CGS) 2 by digging the entire root system from the soil. Root samples taken were washed to remove soil particles and other dead tissue before drying. All the collected biomass samples were placed in an oven and dried at 65 °C for about 7 days. After drying, all biomass samples were weighed to determine the dry matter or biomass accumulation. Total biomass accumulation was estimated for each treatment as the sum of leaf, stem, fruit, and root dry weights.
At each growth stage, additional root data were collected using a C1-600 in situ Digital Root Imager (CID BioScience, Camas, WA, USA). For this, a specialized tube (clear acrylic tube) was installed into the soil at 20 cm from the base of the plant at an angle of 55° (to the bed surface) perpendicular to the planting row. At every growth stage, root images were captured (from three replicates per treatment) by the root imager and analyzed for total root length at three different soil depths (0–15, 15–30, and 30–40 cm). Yield sampling was conducted by removing green mature and color break fruits from 10 treatment representative plants per plot (40 plants per treatment at each sampling). Fruit harvest was conducted three times at approximately weekly intervals during each production season. Harvested fruits were graded based on USDA standards as small, medium, large and extra-large mature green and color fruits [20]. Fresh fruit weight was recorded and estimated in Mg ha−1; if the weight of the fruits meant that they were not of marketable standards, these fruits were recorded as culls.

2.5. Soil NO3-N, NH4+-N and Moisture Distribution

Soil samples were collected (at all CGS) at the depths of 0–15 cm, 15–30 cm, and 30–45 cm. Soil samples were taken midway between two plants from three locations within a plot with a soil core sampler (2.8 cm internal diameter). For each soil sample, analyses for NO3-N, and NH4+ -N were conducted. When soil samples were not analyzed immediately, samples were maintained at −4 °C until analysis. Before the analysis for nutrient content, soil samples were extracted using 5 g of wet soil to 40 mL of 2M KCl extracting solution [21]. The filtrate from the extraction was stored in plastic sample bottles and stored at <4 °C until analysis was conducted. Once at room temperature, NO3-N and NH4+-N analysis was conducted using Epoch Microplate Reader (BioTek, Winooski, VT, USA).
Soil moisture sensors (Sentek SDI-12 Drill and Drop Probe, Stepney, South Australia) were installed at the beginning of each season to monitor the soil moisture pattern. These sensors used capacitance method [22,23,24] to determine volumetric water content (VWC) and were used to evaluate treatment effects on soil moisture status at multiple depths (5, 10, 25, 35, 45, and 55 cm) throughout the season. At all growing seasons, two soil moisture sensors were installed per treatment midway between two consecutive plants, with moisture readings taken every 15 min.

2.6. Statistical Analysis

The general linear model (PROC GLM) procedure of SAS Version 9.3 (SAS Institute Inc., Cary, NC, USA) was used to determine treatment effects on tomato yield using analysis of variance (ANOVA). However, for the repeated measurements such as biomass accumulation, root length, and volume, the SAS PROC GLIMMIX procedure with residual maximum likelihood approach was used. Duncan’s multiple range test was used (p = 0.05) as mean separation when F-test indicated significant differences among treatments.

3. Results and Discussion

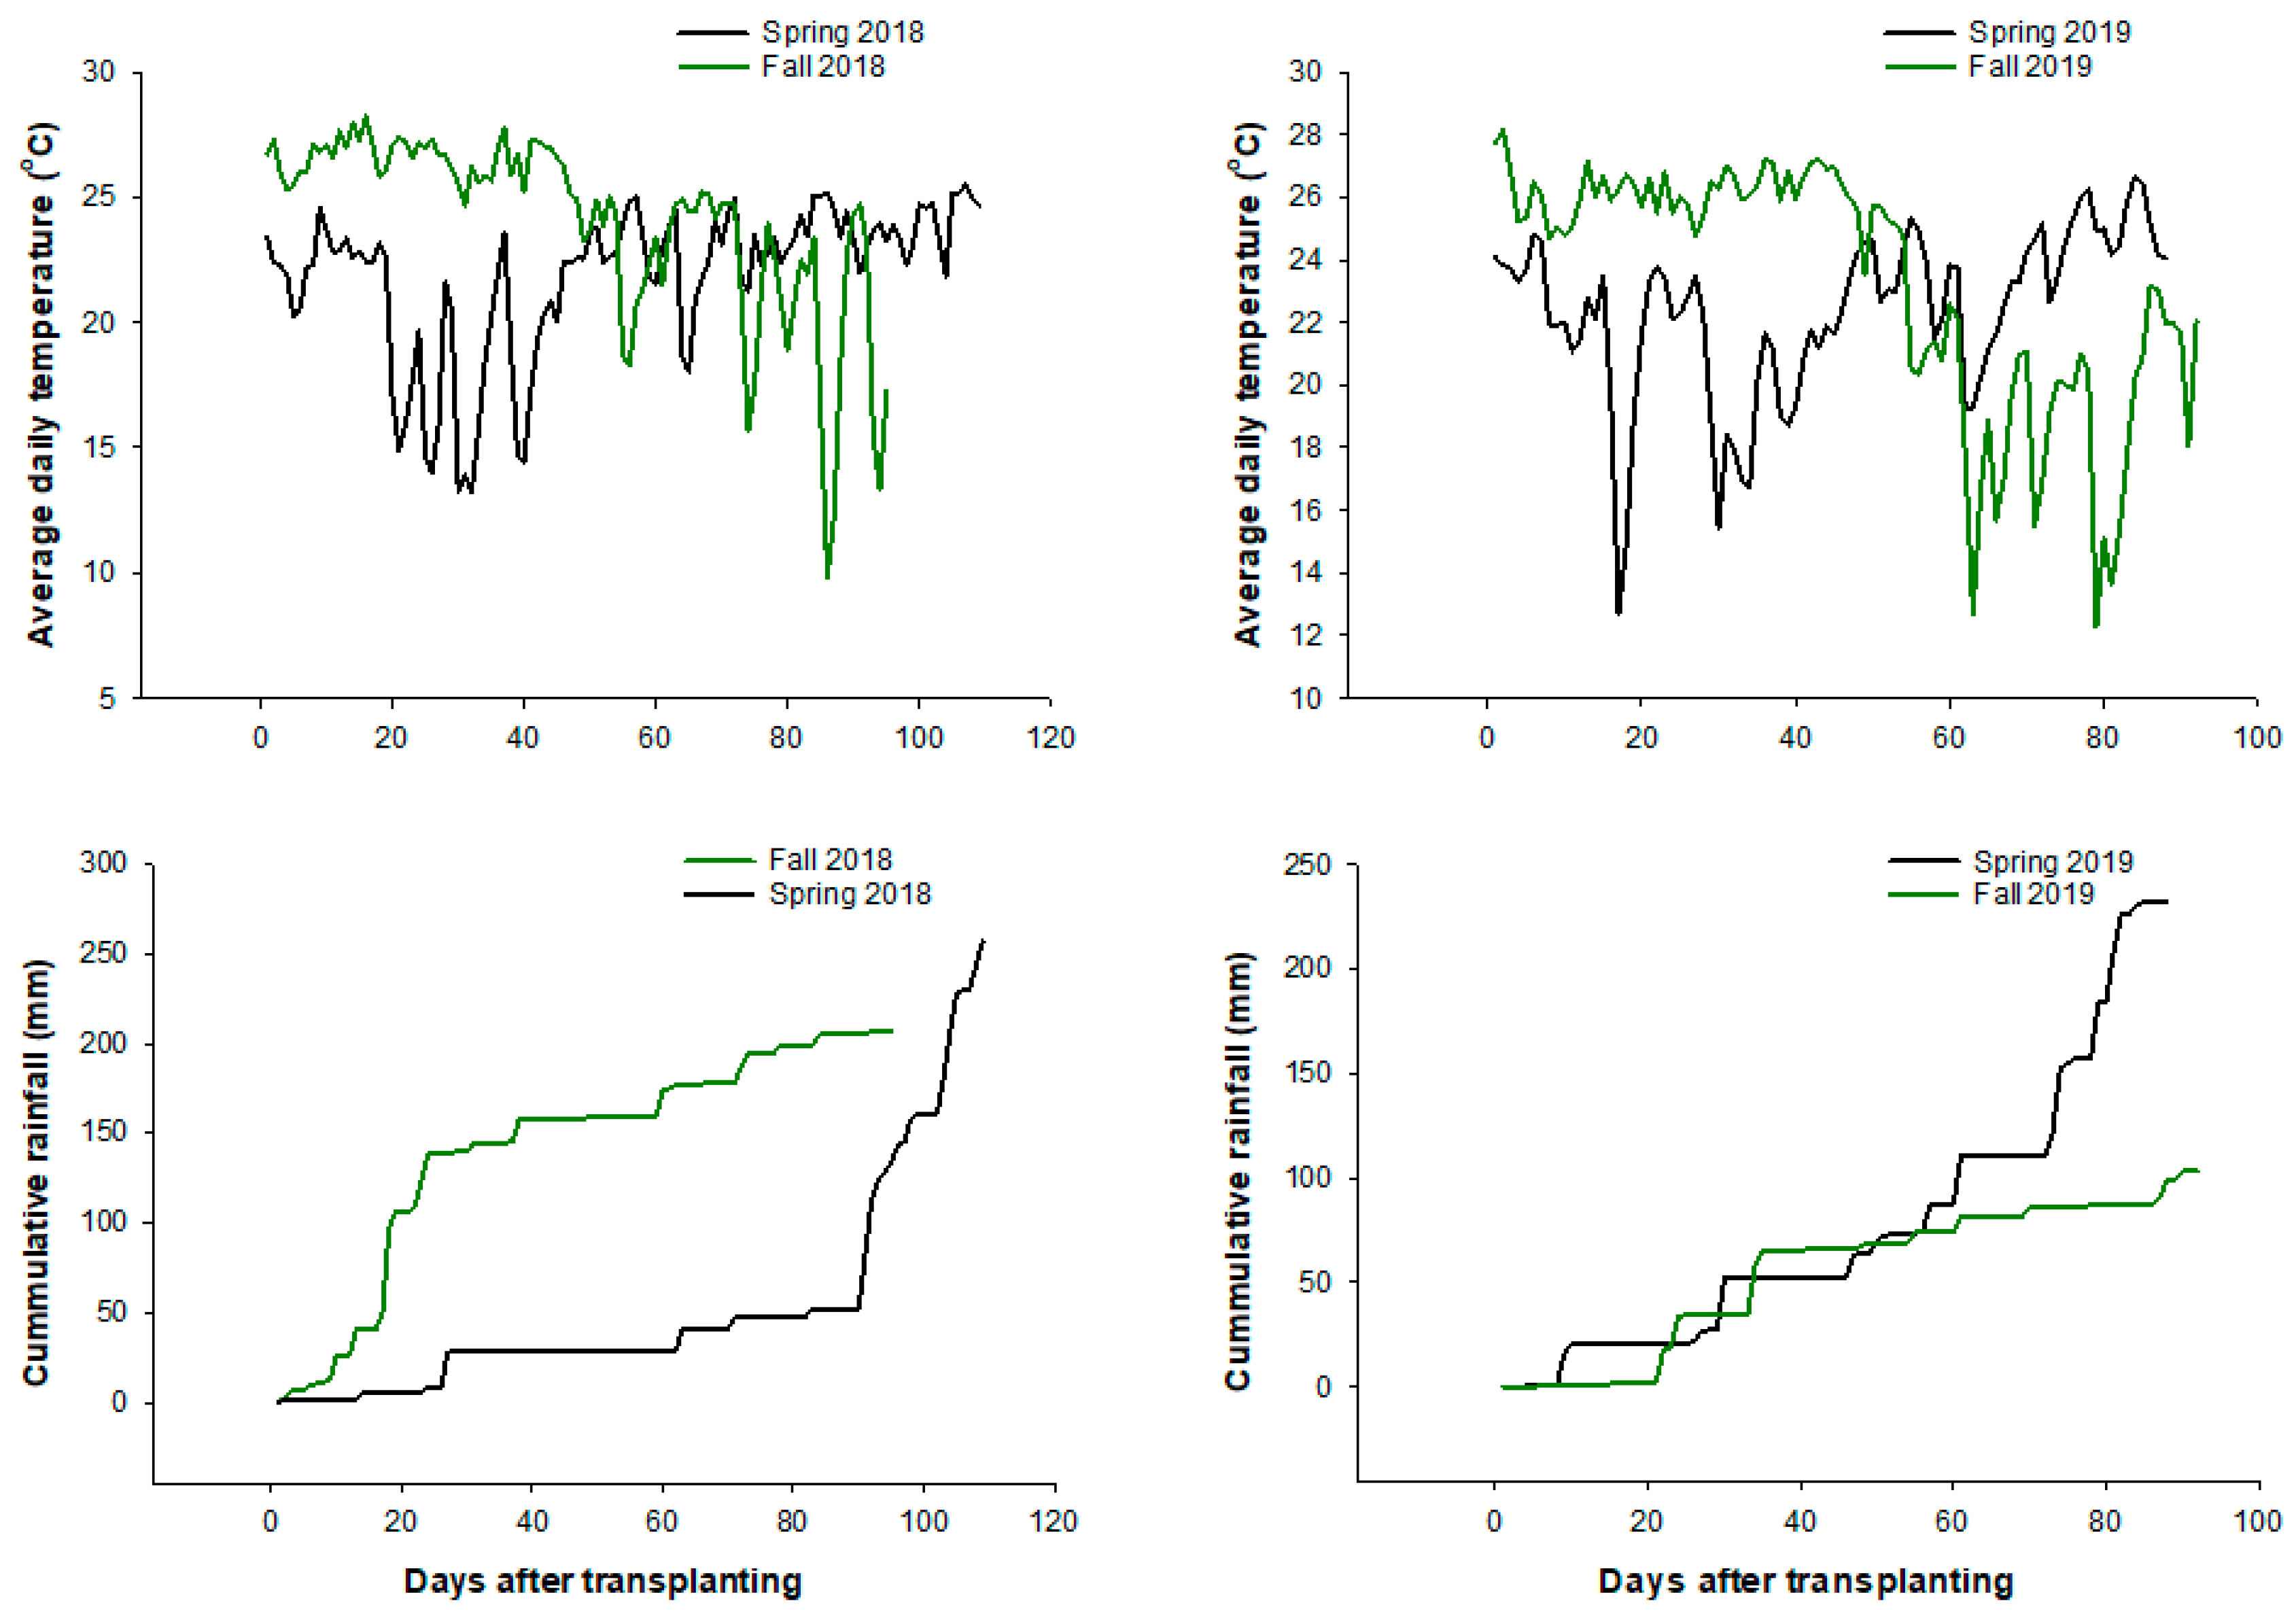
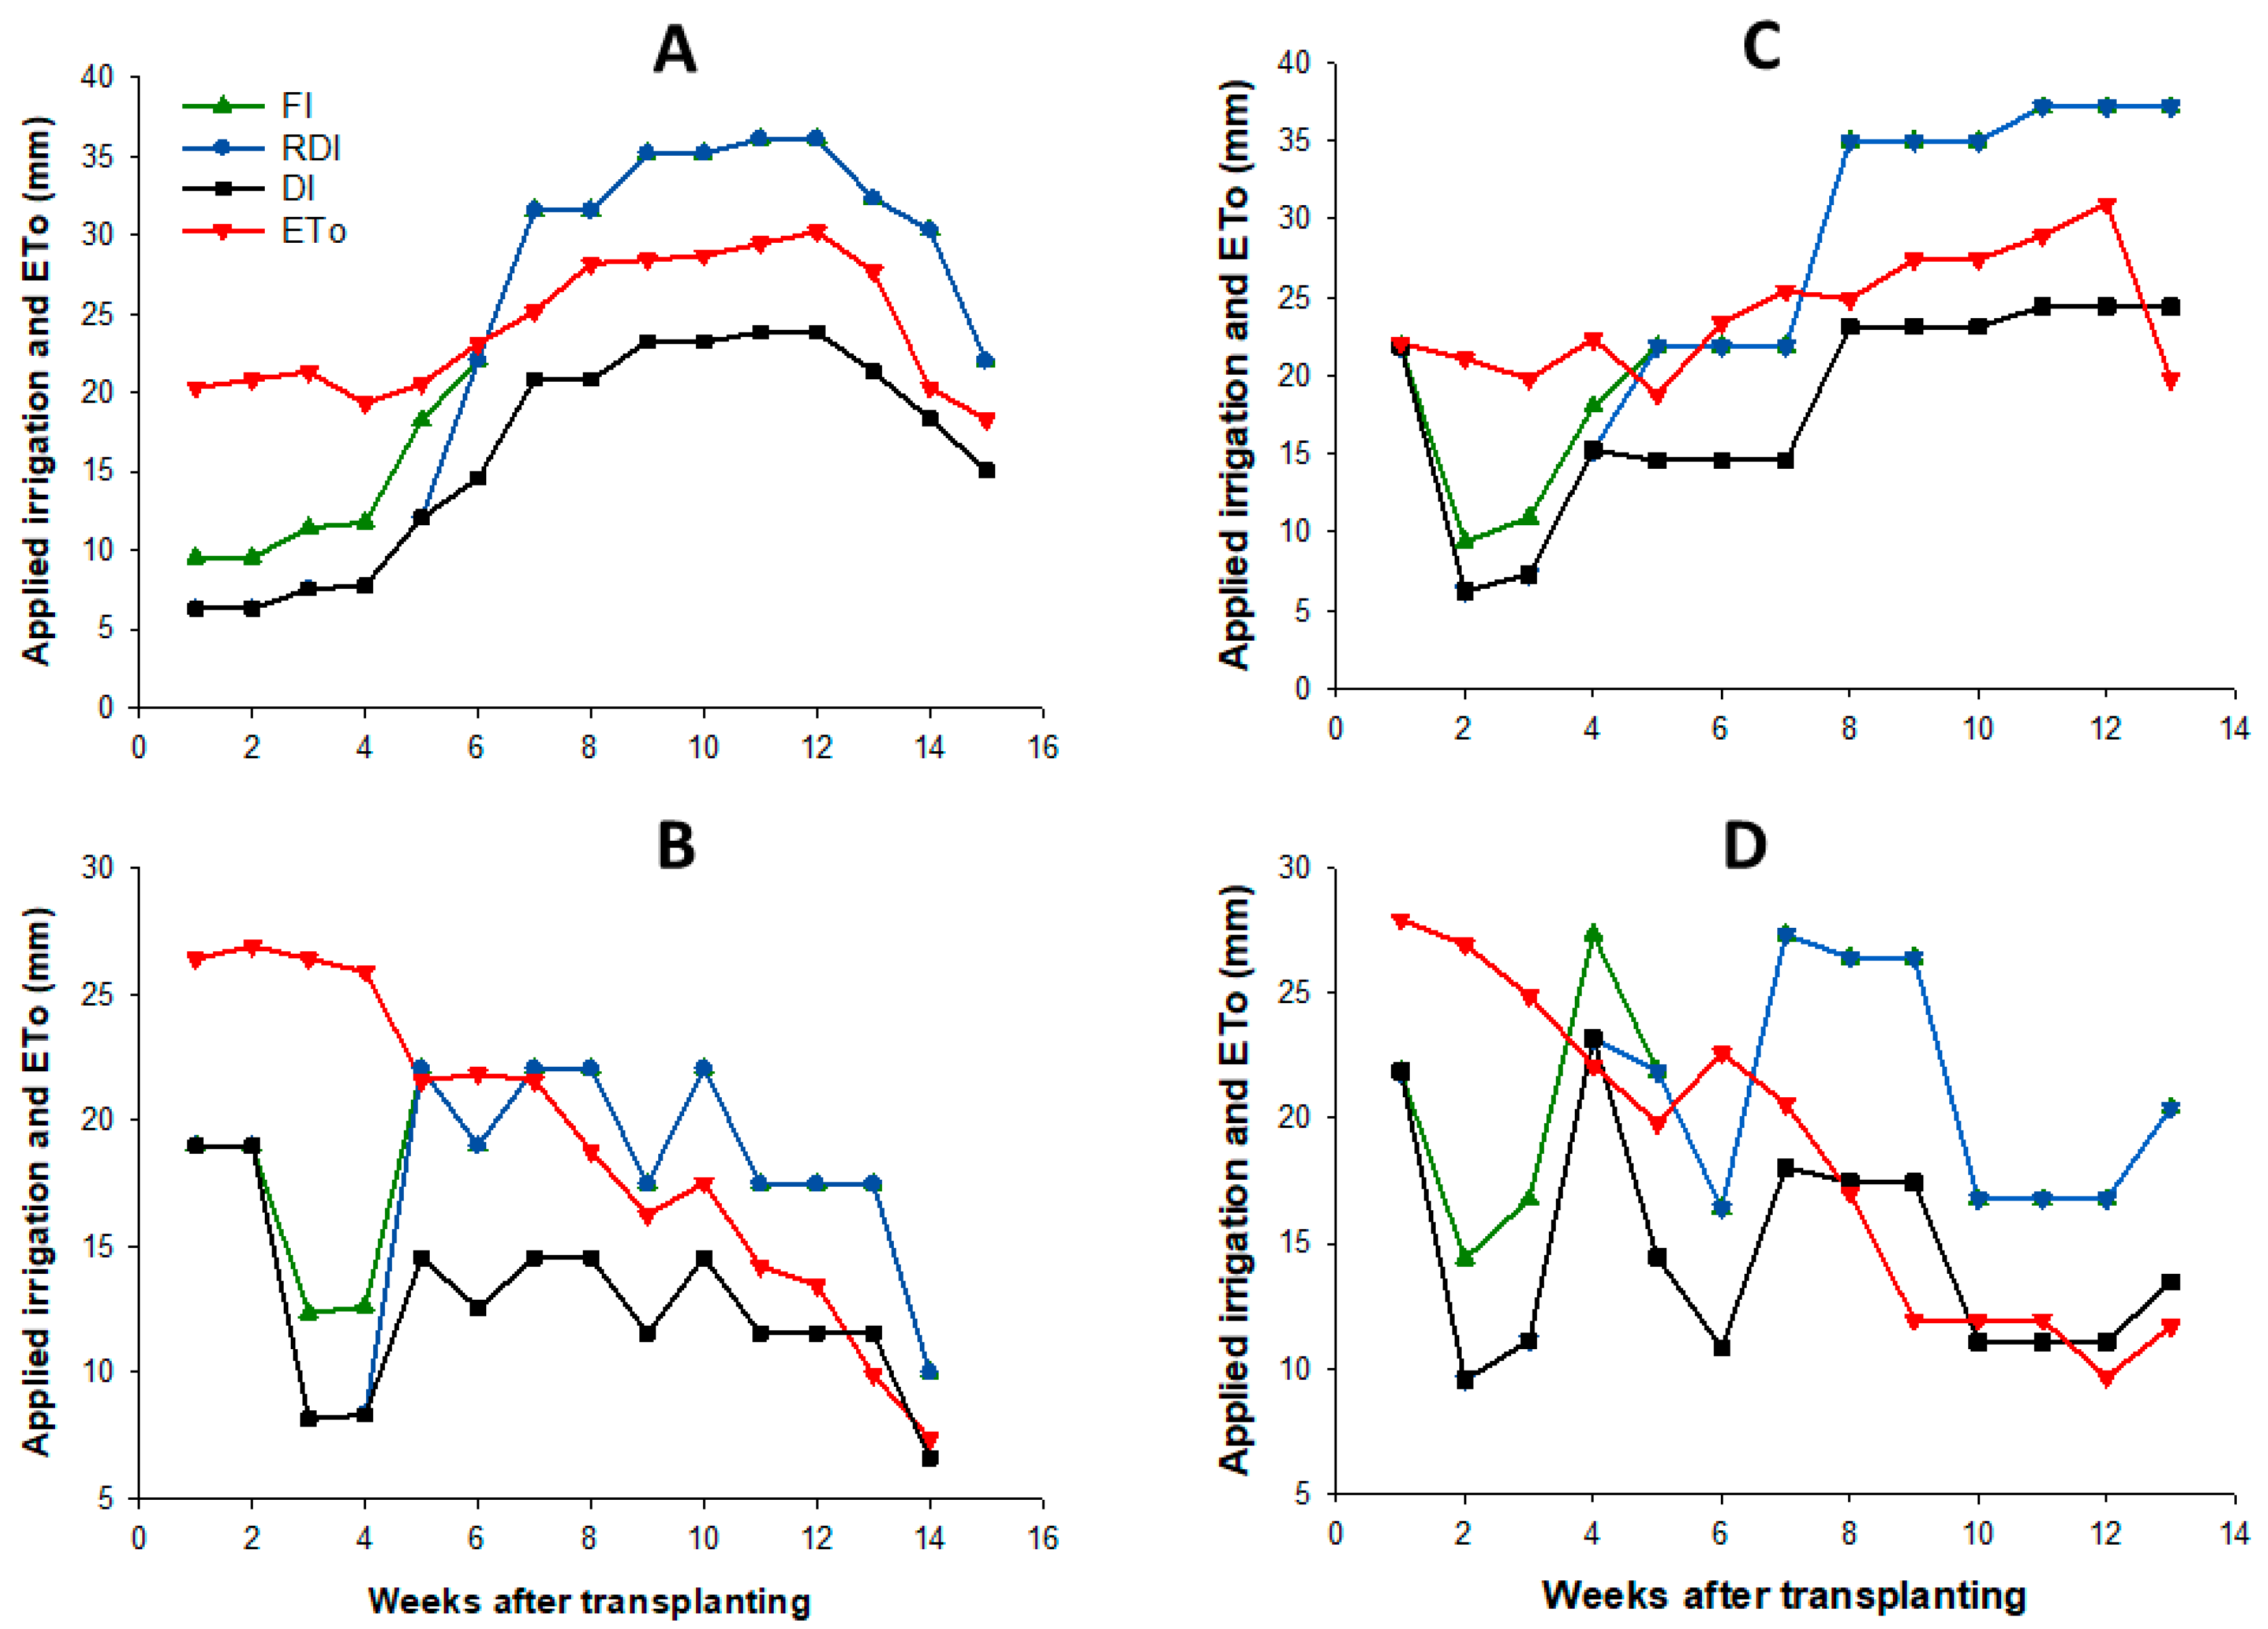
3.1. Weather Condition and Irrigation Water Application

The daily average air temperatures were 21.8 °C and 24.1 °C during SP-18 and FA-18 seasons, respectively (Figure 1). In the SP-18 season, the daily average temperature ranged from 13.2 °C to 25.5 °C and 9.9 °C to 28 °C during FA-18 season. The relatively lower daily average temperature observed during the SP-18 season increased the total season length by 1 week (15 weeks) compared to 14 weeks in the FA-18 season. Compared to the 2018 seasons, the average daily temperature patterns were similar for both SP-19 and SP-20 seasons. The daily average air temperatures were 23.4 °C and 23.3 °C during SP-19 and FA-19 seasons, respectively. The daily average temperatures ranged from 12.7 °C to 26.7 °C during the SP-19 season, and 12.3 °C to 28.2 °C during FA-19 season. The cumulative precipitations during the growing season were 257 and 207 mm for the SP-18 and FA-18 seasons, respectively, while the cumulative precipitations were 231 and 103 mm for the SP-19 and FA-19 seasons, respectively (Figure 1). As was typical of the fall season in Southwest Florida, most rain (159 mm, 57% of total season) was received within 40 days after transplanting (DAT) during FA-18, compared to 28 mm (11% of the total season) for the same period during SP-18 season. The cumulative rainfall during the SP-19 season (231 mm) was similar to the previous spring seasons, but the FA-19 season was unusually dry, with the total season rainfall (103 mm) lower than the previous fall seasons (Figure 1). Therefore, the soil at the study location was wet and near to the full field capacity during this season to ensure the optimum soil moisture conditions for bed formation.
In each season (except SP-18), irrigation water was applied at the similar amount of 100% ETc for all treatments early in the season to ensure the adequate soil moisture conditions for plant establishment during this period. Depending on the soil moisture content at planting, the application of a similar amount of irrigation early in the season lasted for 1 WAT (Figure 2C,D) or 2 WAT (Figure 2B). Due to the adequate soil moisture content at planting during the SP-18 season, the application of irrigation conditions for each treatment started at transplant (Figure 2A) and continued throughout the season. The total measurements for the irrigation water applied were 372, 344, and 248 mm during SP-18 season, and 250, 234, and 178 mm during FA-18 for FI, RDI, and DI, respectively. Similarly, for the 2019 seasons, the total measurements for the irrigation water applied were 342, 332, and 237 mm during SP-19 and 269, 255, and 191 mm during FA-19 for FI, RDI, and DI, respectively. Generally, the total irrigation water applied was lower during the fall seasons compared to the spring seasons in both years. The lower irrigation during the fall season was attributed to relatively lower ET0 (cumulative ET0 were 248 and 239 mm for FA-18 and FA-19, respectively) compared to the spring season (362 and 312 mm for SP-18 and SP-19, respectively).

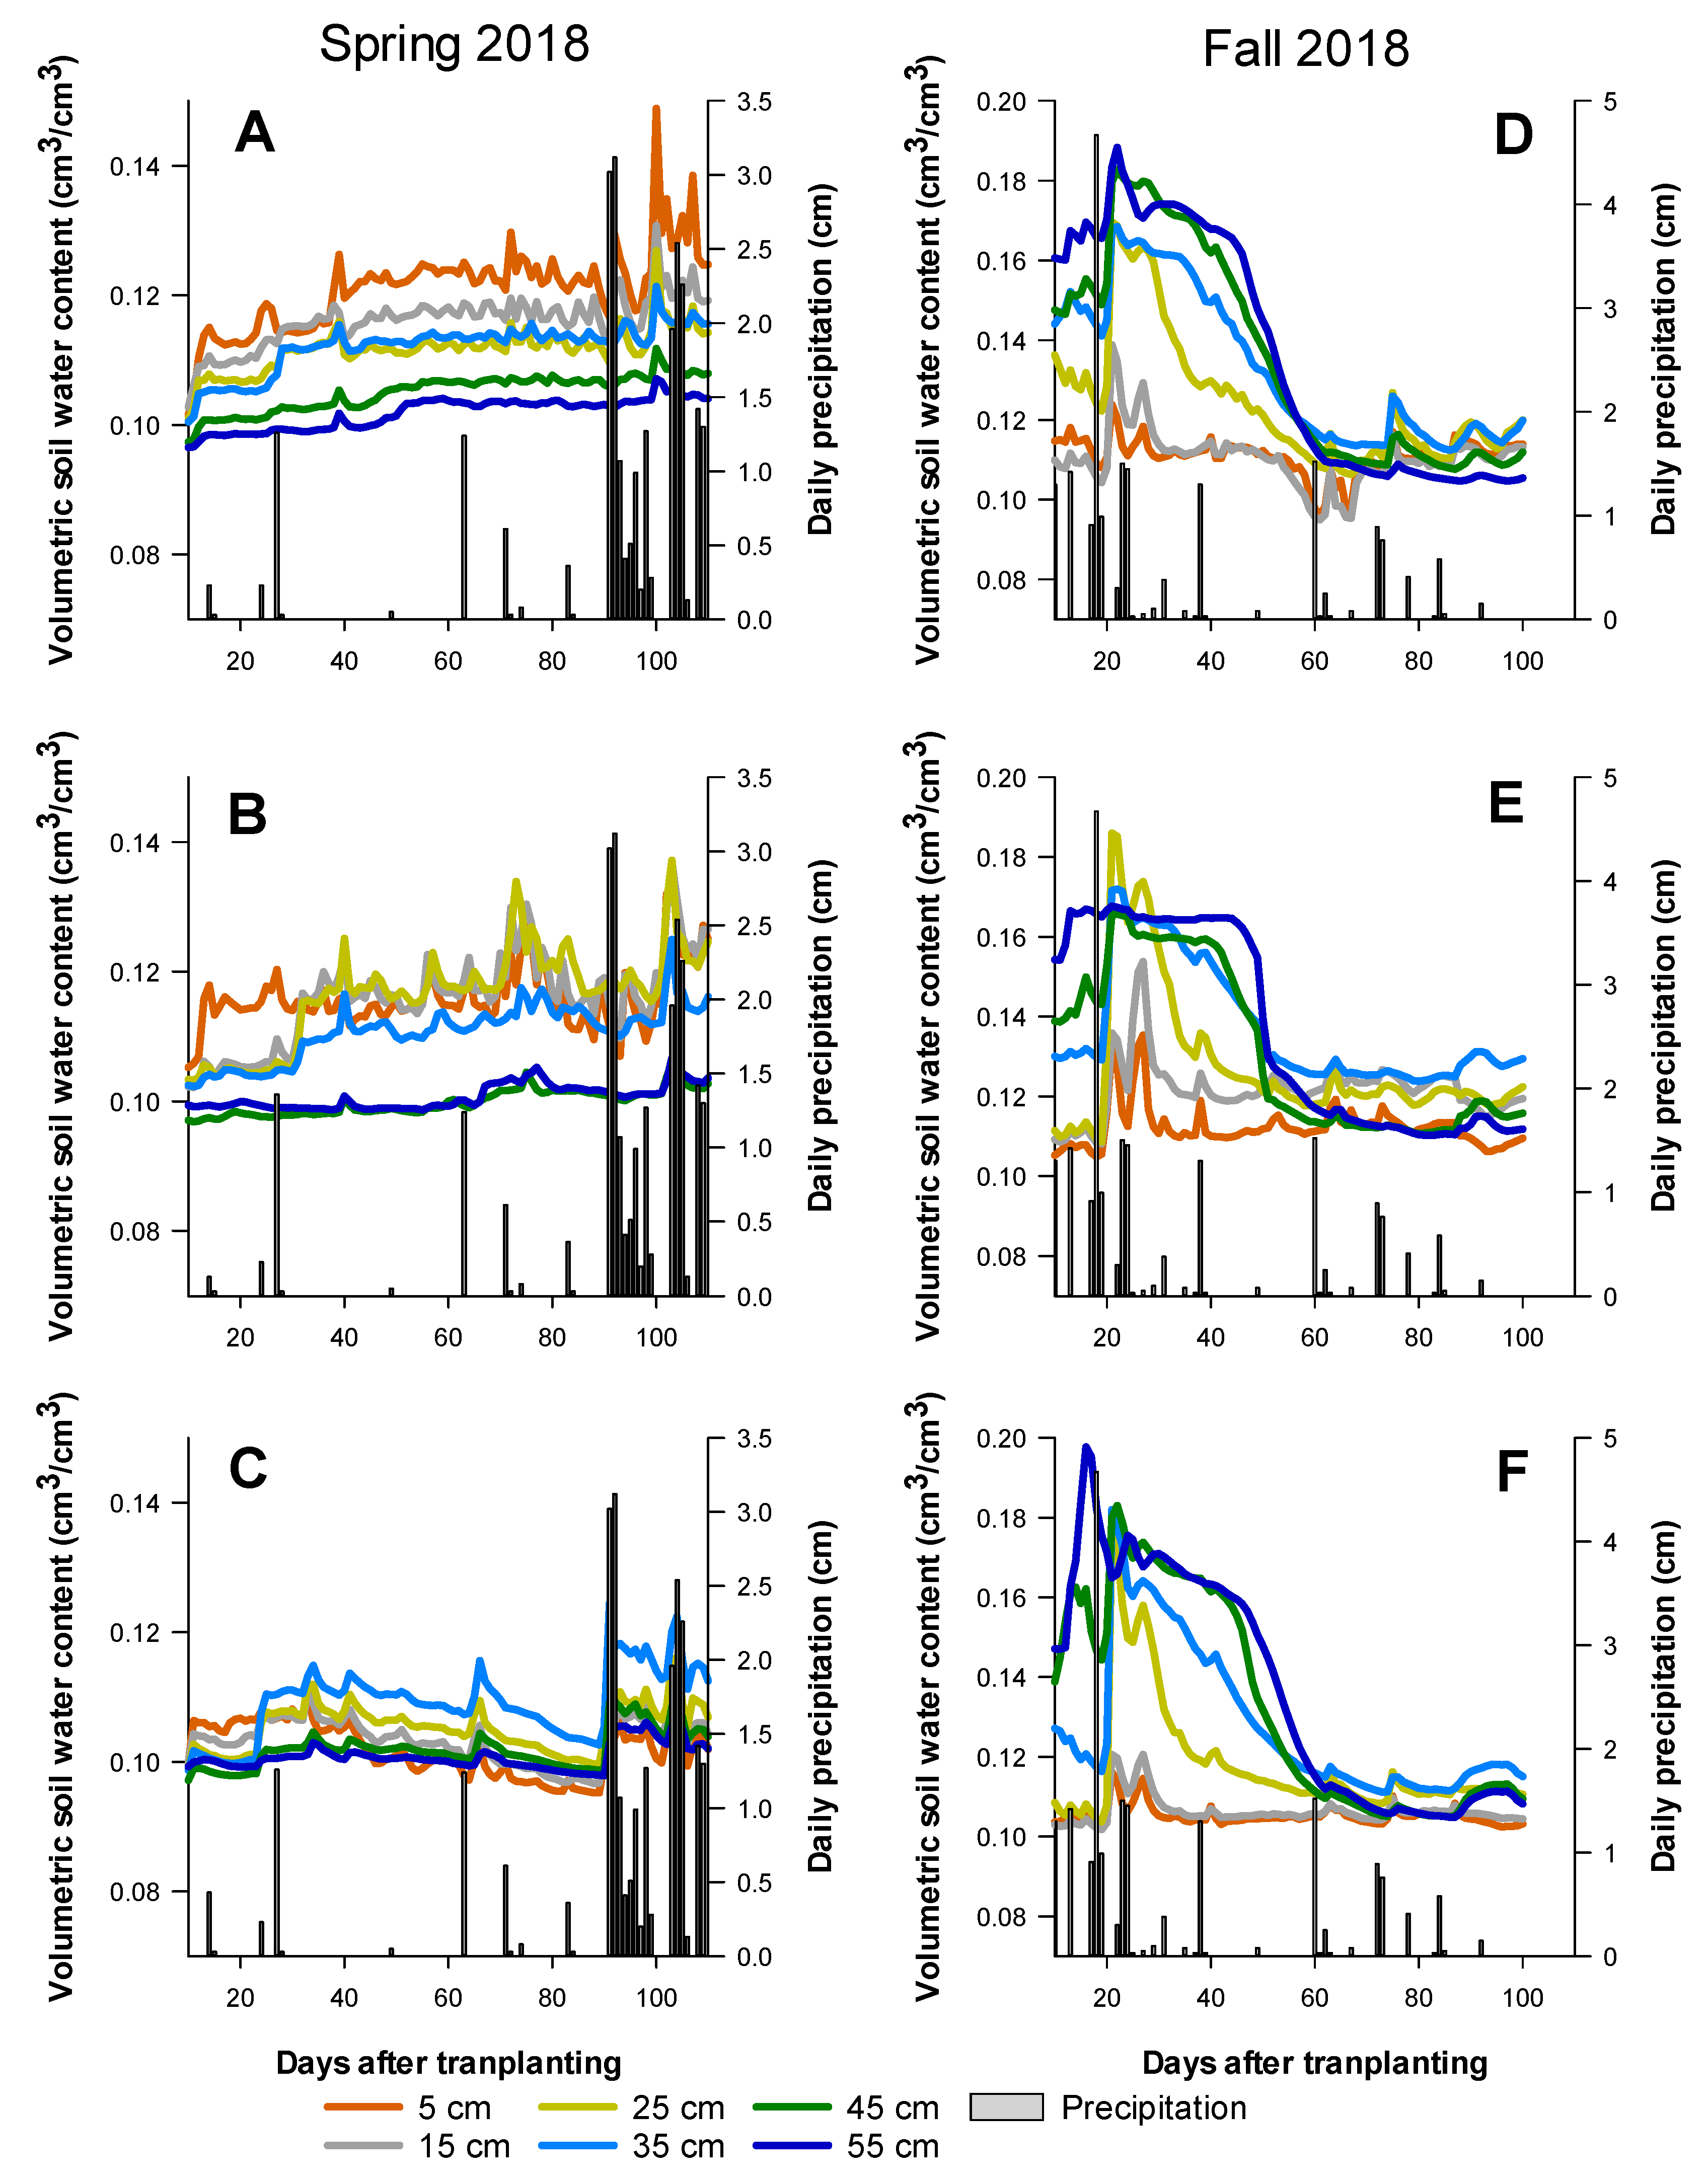
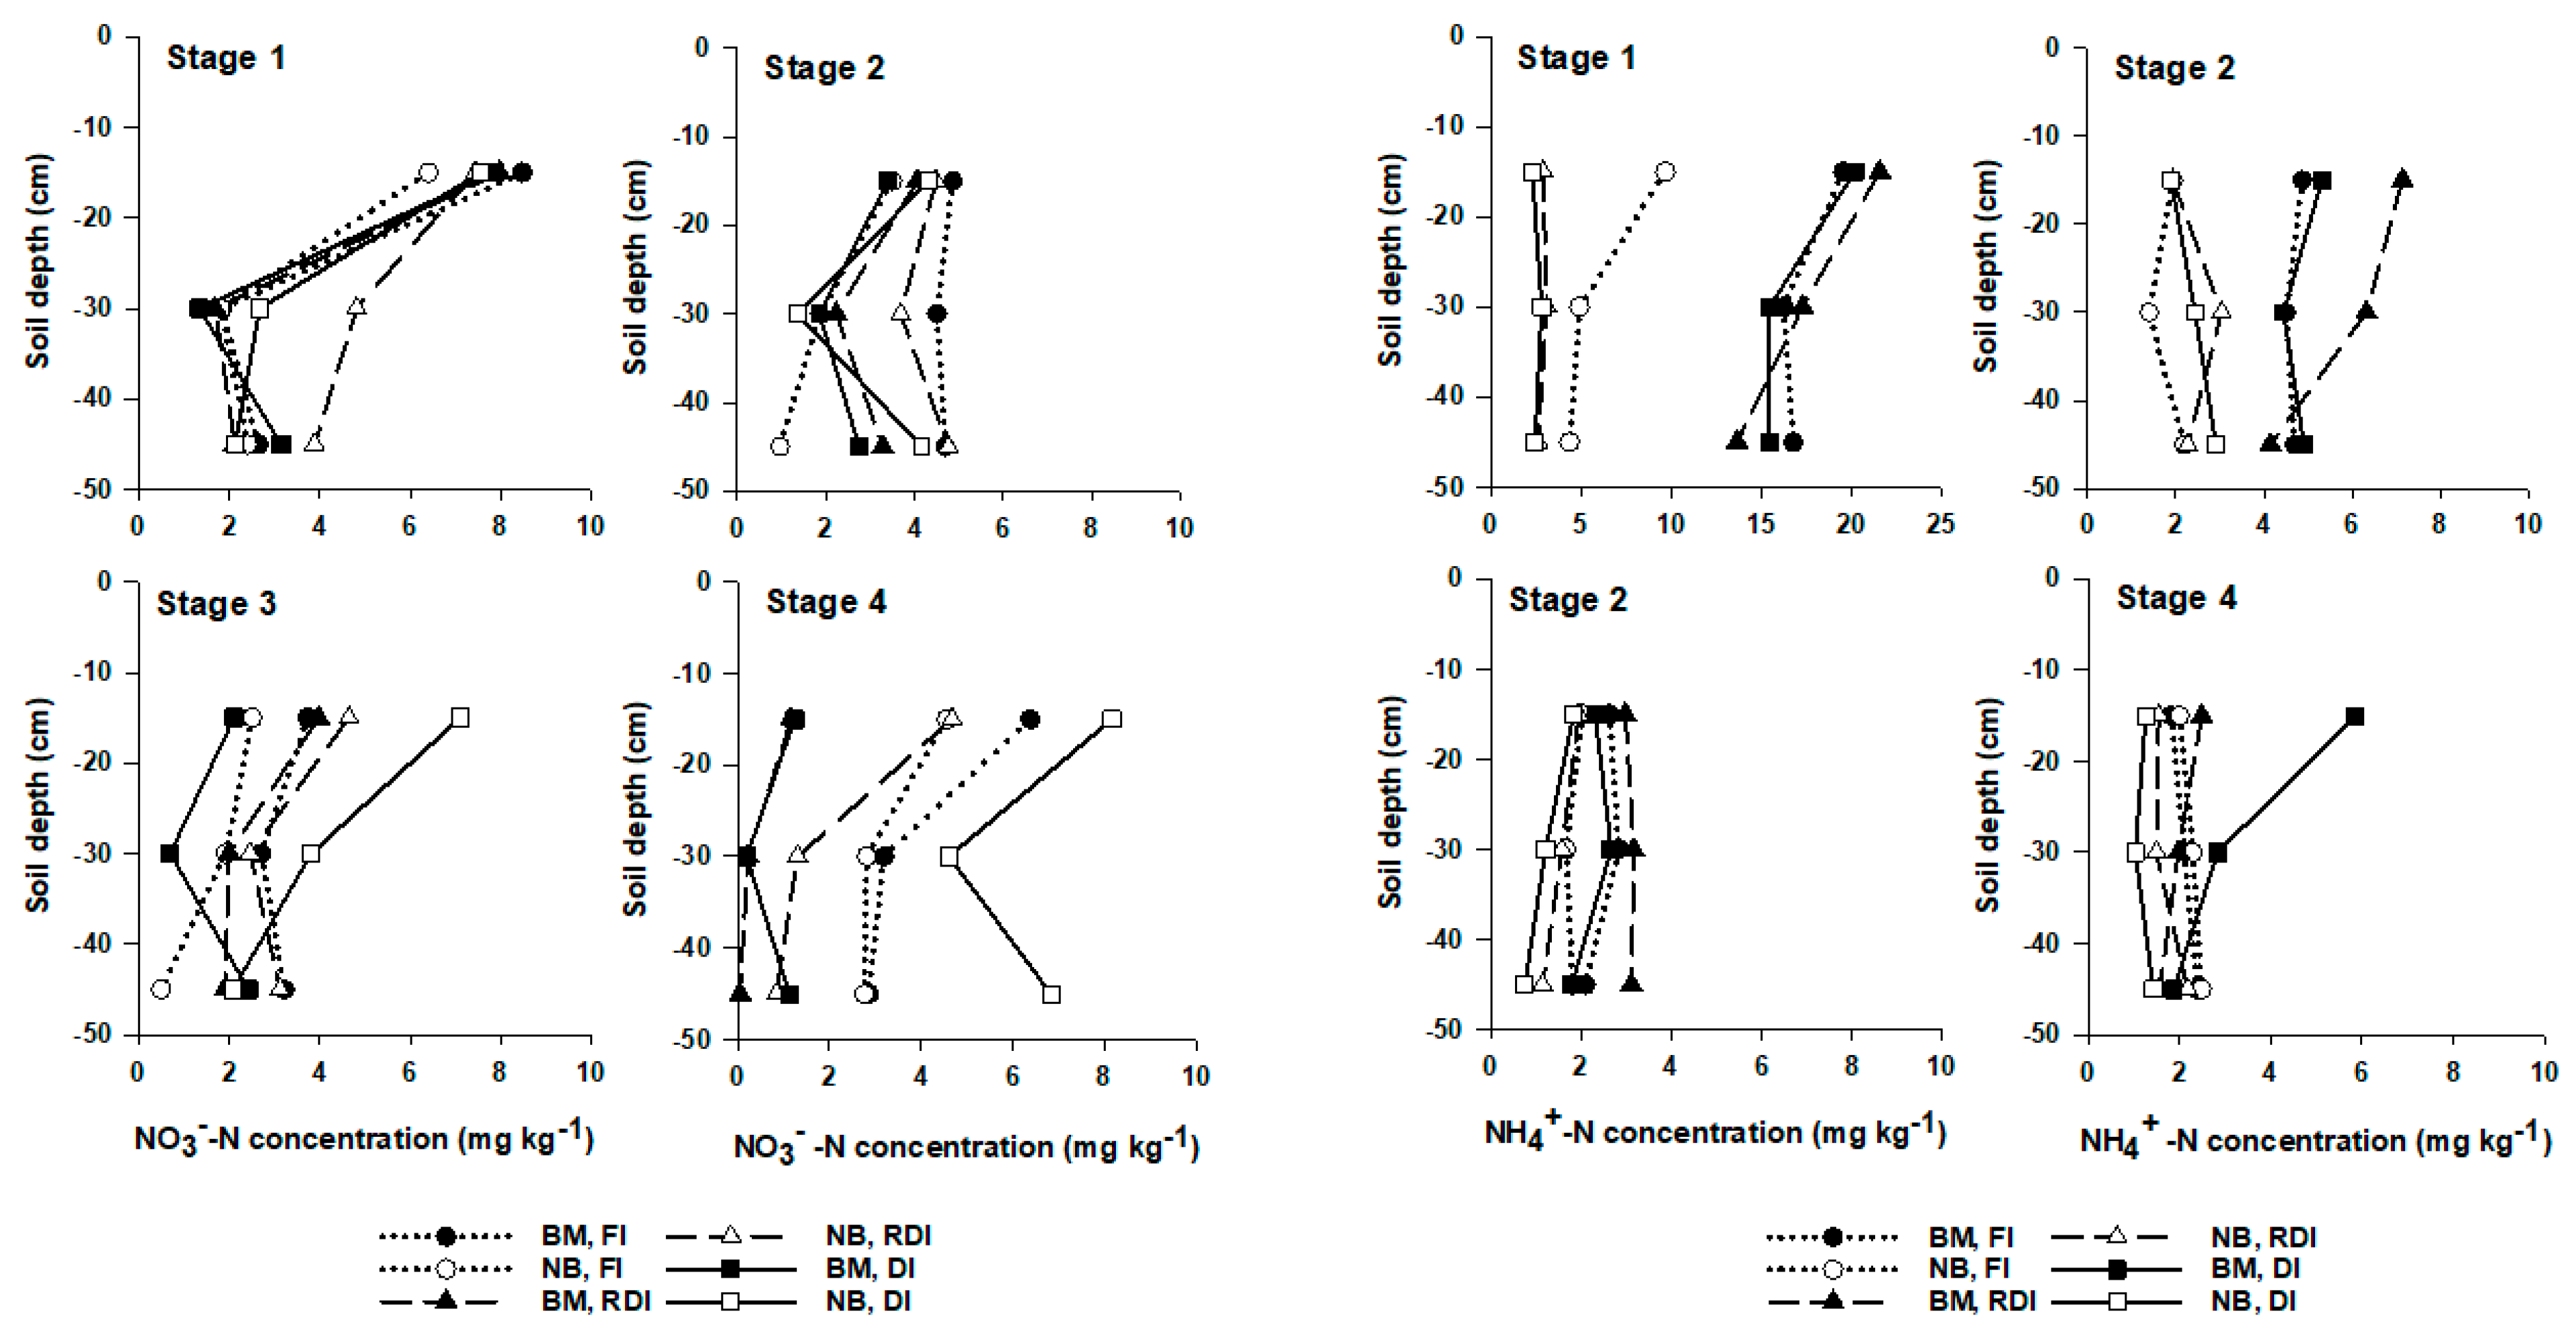
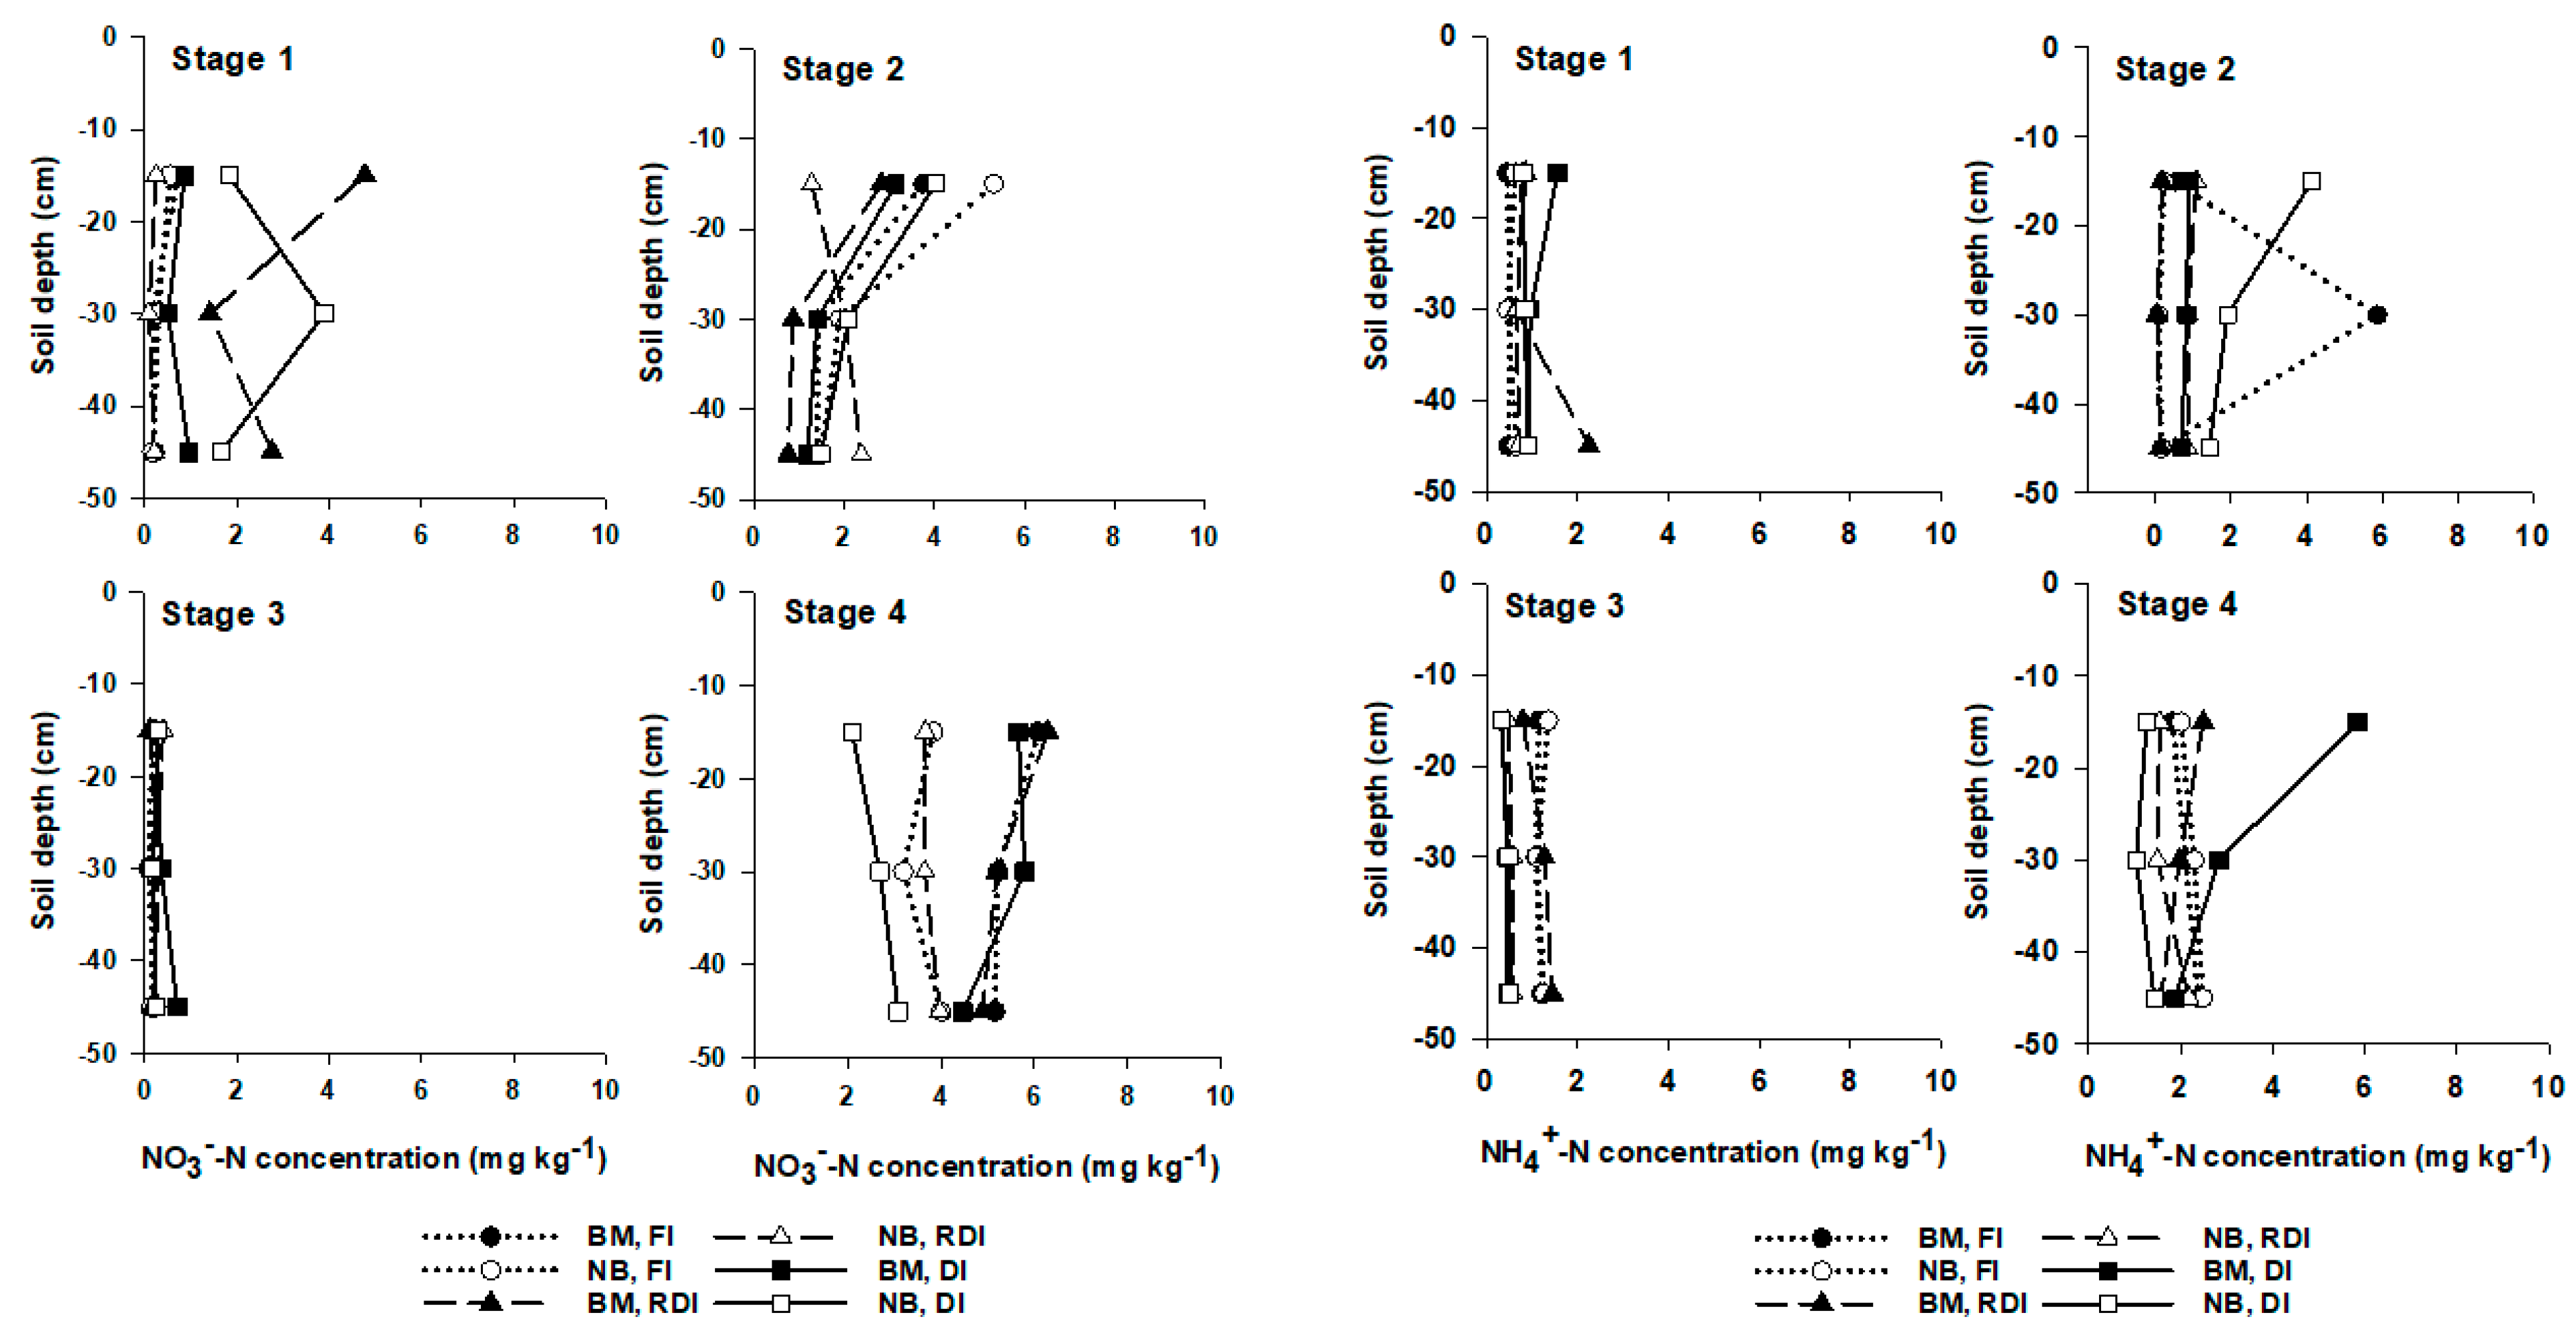
3.2. Sensor-Based Soil Moisture and Nutrient Distribution

During FA-18 season, soil moisture contents (SMC) were generally higher throughout the season within the first 35 cm soil depth for the FI irrigation treatment (Figure 3A) compared to DI (Figure 3C). Early in the season (before 30 DAT), the SMC at 15, 35, and 45 cm were similar and close to field capacity (about 0.1 cm3 cm−3) for the RDI (Figure 3B) and DI (Figure 3C) treatments but slightly lower compared to the FI treatment. The lower SMC at this stage for the RDI and DI treatments was due to the lower amount of irrigation applied (66% ETc) early in the season for both irrigation conditions. At about 30 DAT, the soil moisture sensor (SMS) recorded increases in SMC at 15, 25, and 35 cm soil depths for the RDI treatment (Figure 3B); however, no such movement or increases in SMC were observed under FI and DI irrigation conditions. The higher SMC at this stage, under the RDI irrigation treatment, was due to the transition from the deficit irrigation conditions (DI, 66% ETc) to full irrigation (FI, 100% ETc). Compared to the upper soil depths (5, 15, 25, and 35 cm), the SMC at 45 and 55 cm were generally lower, with fewer “spikes” or variations in the average daily SMC throughout the season. This suggested that irrigation water amounts, as applied in this season, were mostly maintained within the upper 35 cm of the soil depth and thus, nutrient leaching potential could be significantly minimized. Soil moisture distributions were not presented for the SP-19 and FA-19 seasons as patterns were similar to those observed during the 2018 seasons.
Soil moisture patterns during the FA-18 season (Figure 3C,D,F) were different compared to the SP-18 season. This difference was attributed to the variations in the rainfall patterns in both seasons. As previously described, about 159 mm (57% of the total season) of rain was received within 40 DAT during the FA-18, compared to 28.2 mm (11% of the total season) for the same period during SP-18 season. Hence, higher rainfall during the FA-18 season increased the SMC above the field capacity (up to 0.20 cm3 cm−3) compared to the SP-18 season (between 0.10 to 0.13 cm3 cm−3). Although during the FA-18 growing season SMC gradually declined across all depths, SMC was generally higher compared to SP-18 across all irrigation regimes up to about 60 DAT. Therefore, no appreciable differences in SMC were observed among all irrigation regimes during the FA-18 season.
As expected, the soil NH4+-N concentration during the SP-18 season was higher (up to 5 times higher) at CGS 1 and CGS 2 (Figure 4) for treatments with pre-plant fertilizer (BM) compared to those that received no pre-plant fertilizer (NB). Higher NH4+-N concentrations at both 30 and 45 cm soil depth (especially at CGS 1) for the BM treatments in SP-18 indicated that the applied fertilizer during the pre-plant operation was incorporated by up to at least 45 cm soil depth. Considering the limited root growth for young tomato plants at this growth stage, it could be inferred that the pre-plant fertilizer application method (broadcast incorporation) used in this study may not be the most appropriate. This is because an important portion of the fertilizer applied as a pre-plant fertilizer was found beyond the immediate reach of the plants, especially during the early growth stages with limited root growth. Therefore, to increase nutrient concentration within the upper soil layers (15 cm) and enhance more vigorous early tomato growth, surface band placement may be considered a more appropriate pre-plant fertilizer application method for open-field fresh market tomato production. It was also observed that the soil NH4+-N concentration for the BM treatment declined steadily along the growing season. Since no leaching was observed, this decline was primarily attributed to an increase in plant uptake as the crop developed during the growth stages.
The pattern of soil NO3-N concentration during the SP-18 season differed from those observed for NH4+-N. At CGS 1 and CGS 2 (Figure 4), there were no clear observable differences in the soil NO3-N concentration among treatments regardless of N (BM and NB) or the irrigation regimes (FI, RDI, and DI). At CGS 1, the soil NO3-N concentration was higher within the first 15 cm soil depth and declined across CGS 2 due to plant uptake. At CGS 3 and 4, the continuous application of fertilizer through the fertigation for NB treatments generally maintained or increased soil NO3-N concentration. Even though fertigation started at CGS 3 for the BN treatments, the soil NO3-N concentration for these treatments steadily declined from CGS 3 to 4. Based on these results, early indication suggested that when pre-plant fertilizer was applied (at levels applied in this study), starting fertigation earlier could be a better practice to prevent a rapid soil NO3-N depletion, especially during a warmer season with rapid plant growth and nutrient uptake. Another possible alternative could be the allocation of a higher (above the 50 kg ha−1-N as applied in this study) proportion of fertilizer as a pre-plant fertilizer (especially during the drier spring seasons) to ensure a higher soil NO3-N concentration and increase the available N for plant uptake across growth stages.
The observed results for the soil NH4+-N and NO3-N distributions during the FA-18 season were different from those observed during the SP-18 season. Generally, NH4+-N and NO3-N (Figure 5) concentrations were much lower during the FA-18 compared to the SP-18 season regardless of the N and irrigation application regime. A lower soil nutrient content during the FA-18 season could potentially be as a result of one, or the combination of, the following plausible reasons: (1) An increase in early plant growth, and thus nutrient uptake during the warmer FA-18 season may have resulted in a faster depletion of soil N compared to a cooler early SP-18 season. (2) The delayed fertigation (BM treatment) for 4 WAT may have been too long and, since no pre-plant N fertilizer was applied to the NB treatments, the fertilizer application through fertigation may not have provided enough nutrient reserve for the early rapid growth. (3) As previously discussed, the frequent rain events received early during the FA-18 season increased the SMC (within the root zone) to up to 100% higher than the field capacity; therefore, the lower soil N content during this season may have resulted in leaching. The soil NH4+-N and NO3-N contents for both the SP-19 and FA-19 seasons were similar to those observed during the SP-18 season (data not included) thus, indicating that the lower nutrient content during the FA-18 season may have been caused by leaching.

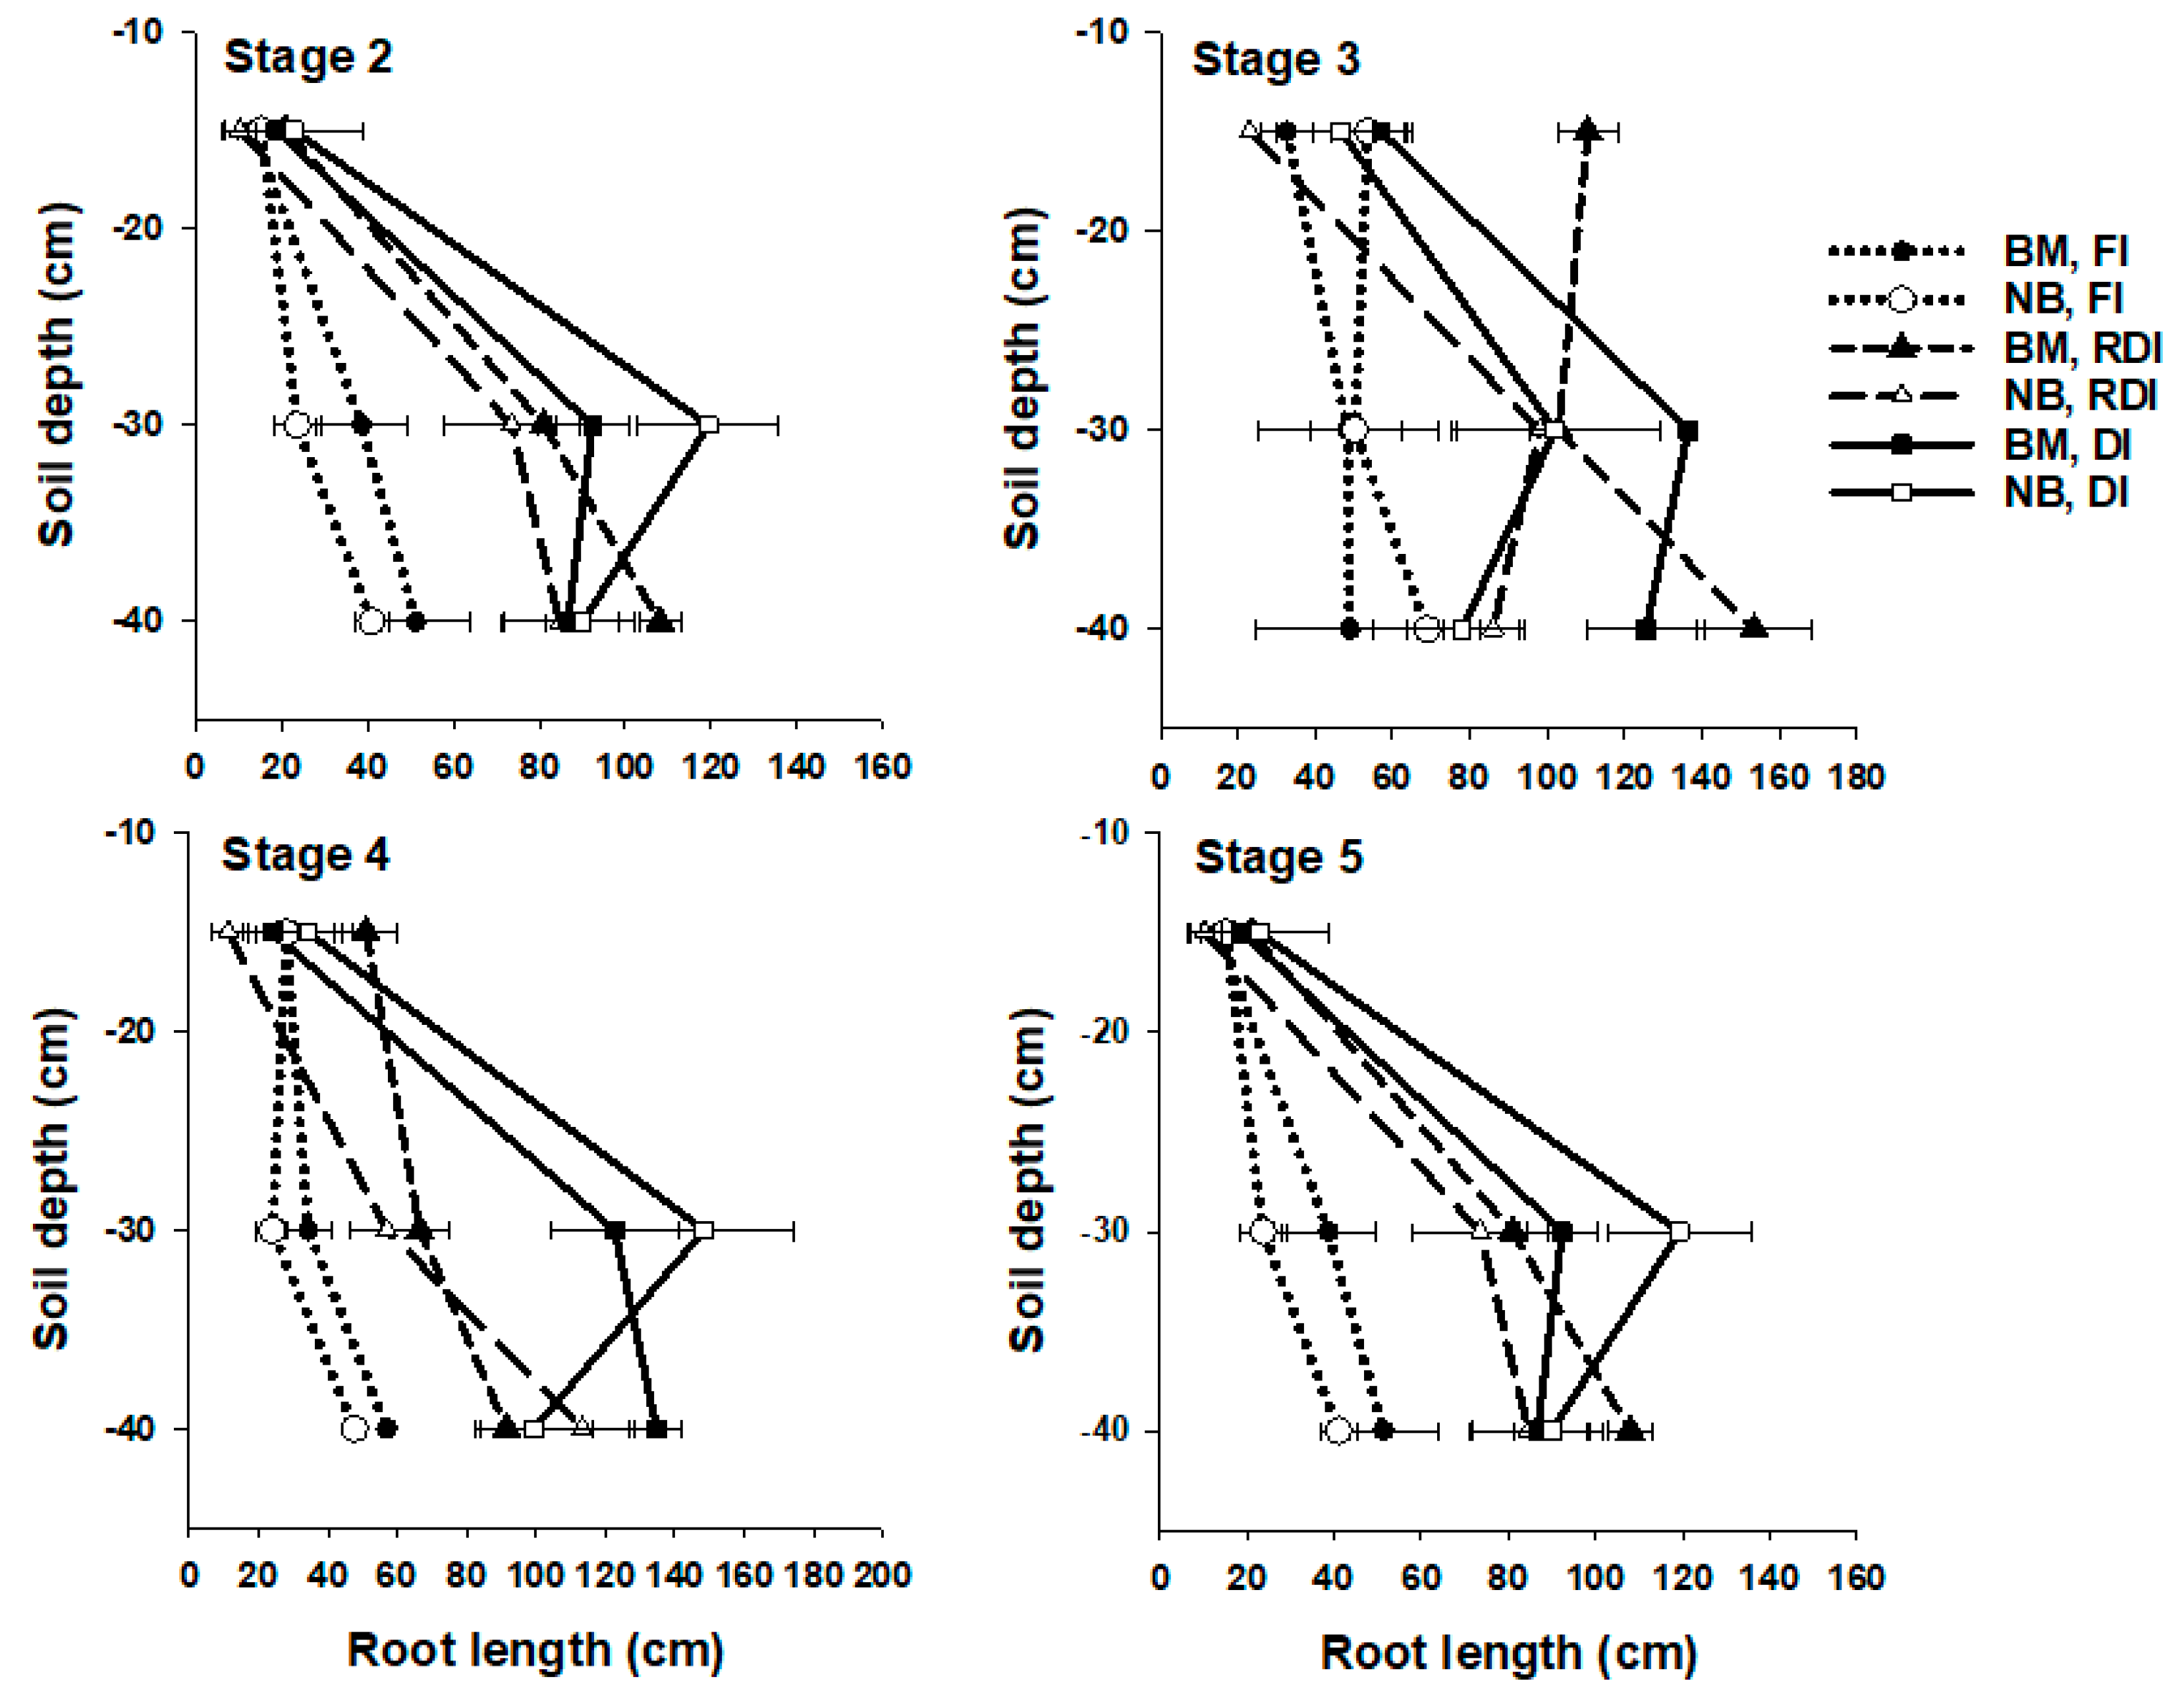
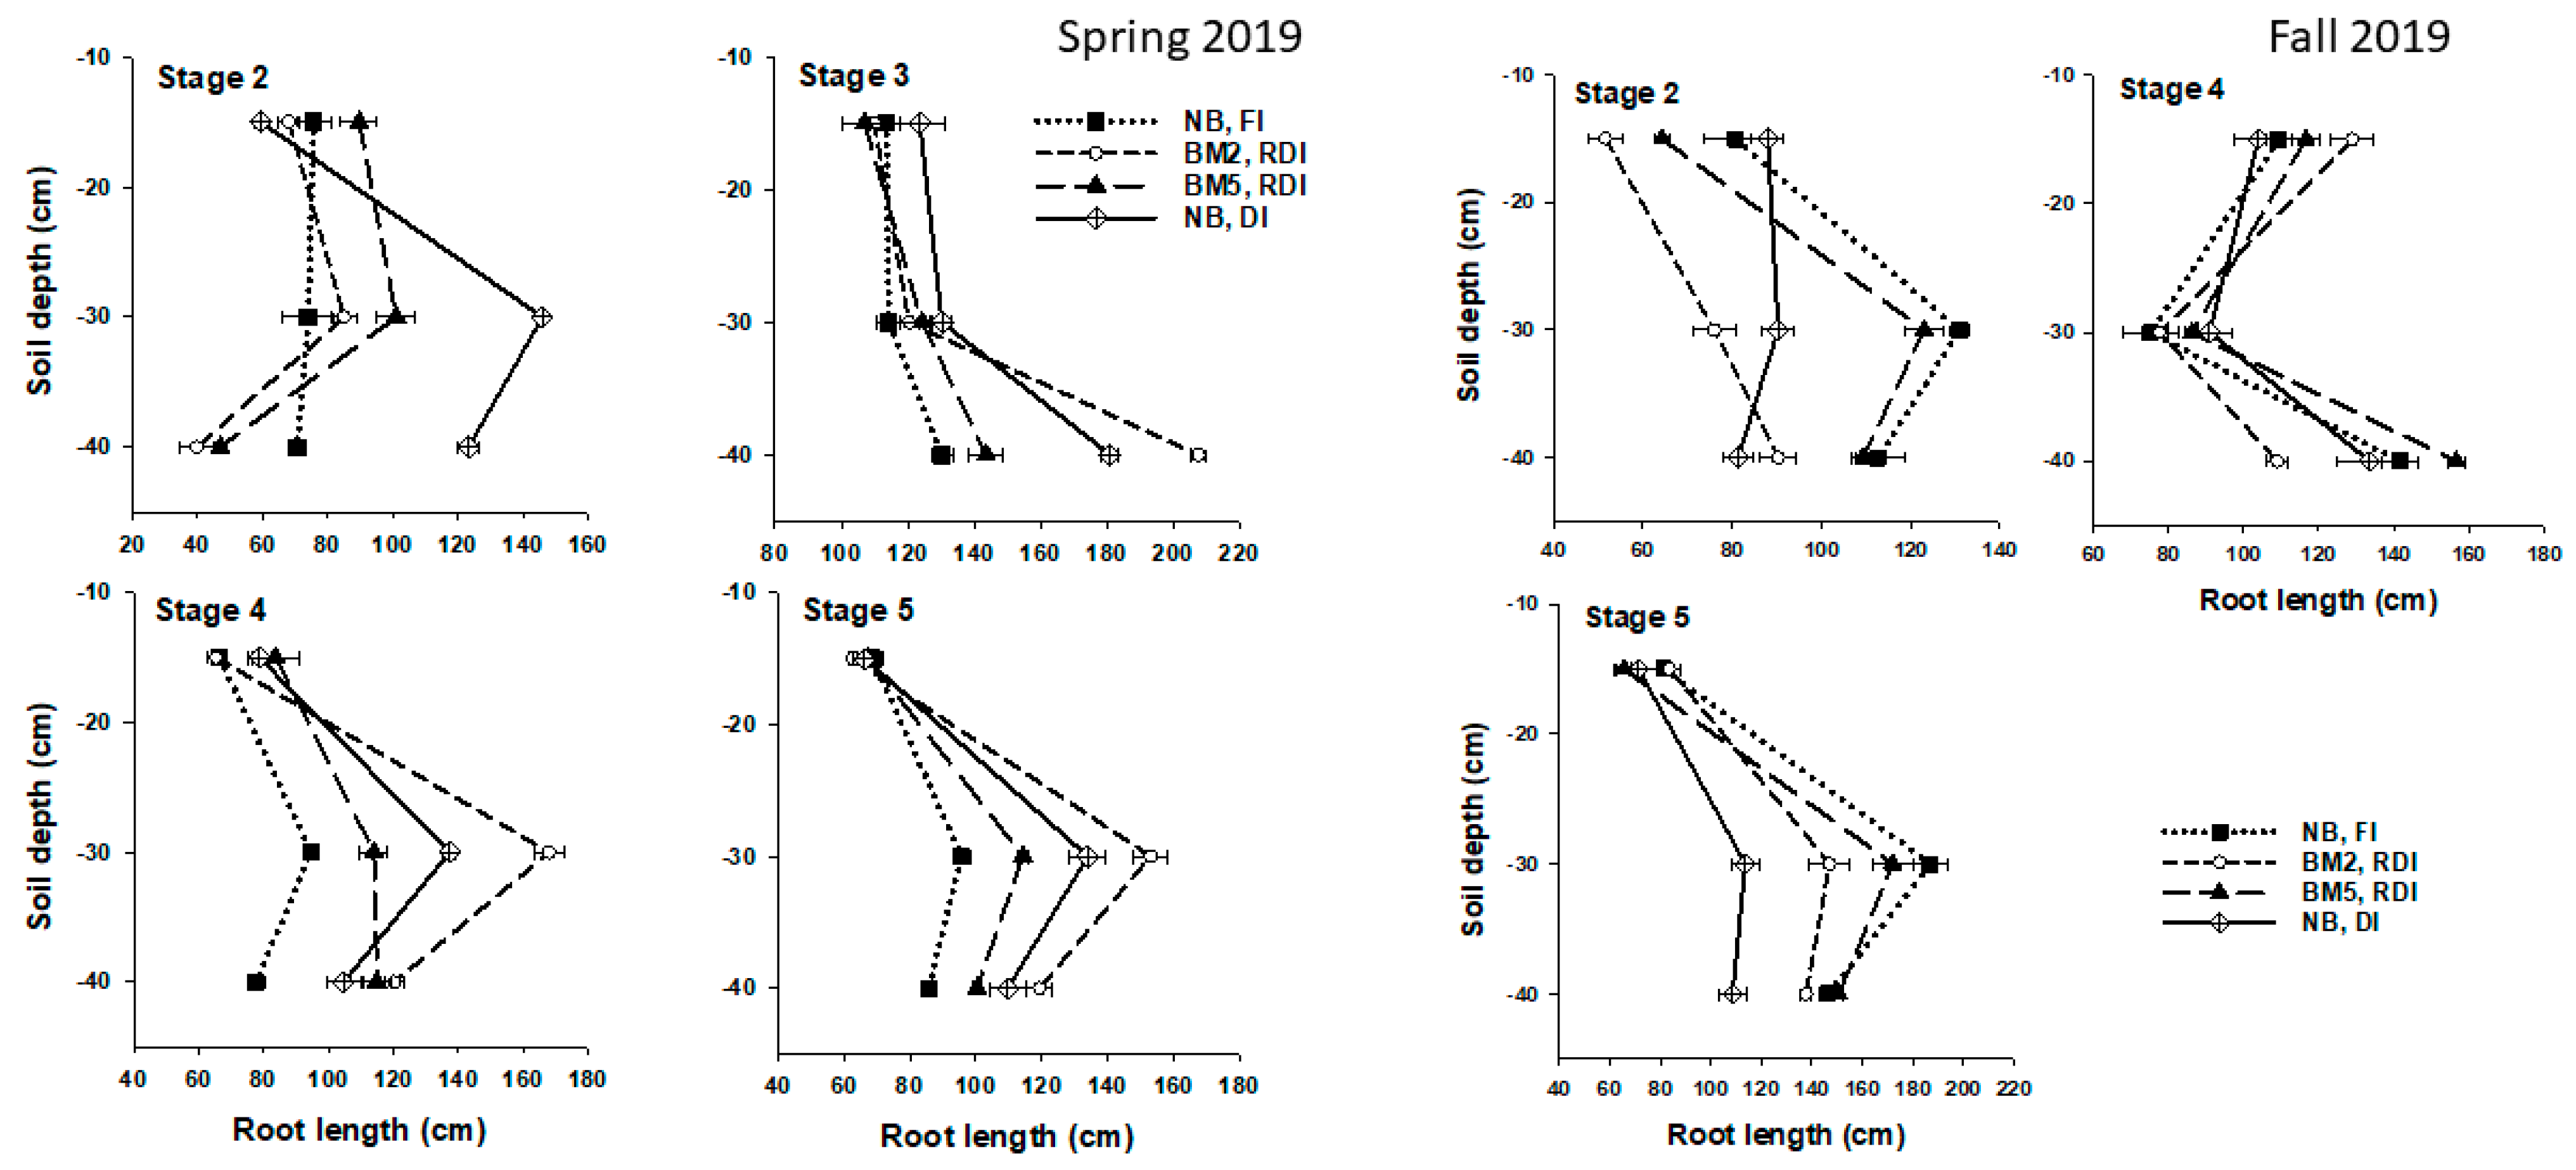
3.3. Tomato Root Growth and Development as Affected by N Application and Irrigation Regimes

Root growth was evaluated for each treatment during the SP-18 (Figure 6), SP-19, and FA-19 (Figure 7) seasons. Root growth was not evaluated during FA-18 due to the poor growing season that resulted from the low soil N content. For each treatment in every growing season, root growth was evaluated at three different soil depths (0–15, 15–30, and 30–40 cm). Root growth was evaluated at each growth stage except for CGS 1 due to limited root growth. During the SP-18 season, there were differences in the total root length at each of the CGS evaluated (Figure 6). Across all growth stages, the root length was similar among all treatments within the first 15 cm; however, there were observable differences in the total root length among treatments at lower depths (15–30 and 30–40 cm). Across all growth stages, total root length was lowest under FI compared to RDI and DI treatments. Unlike irrigation, the N application timing (with or without pre-plant fertilizer) did not have any significant effects on tomato root growth, except at CGS 2 when root length was higher for BM treatments under RDI and DI irrigation regimes. Similar results were obtained during the SP-19 season; however, the root growth pattern was different during the FA-19 season (Figure 7). Surprisingly, the root growth during the FA-19 season did not follow a clear and consistent pattern compared to the SP-18 and SP-19 seasons; therefore, treatment effects were not significant. Compared to other seasons, the lack of significant differences in root growth among treatments during FA-19 was attributed to high soil moisture content at planting (data not included). As previously described, the FA-19 season was unusually dry, hence the soil at the study site was wet (to near field capacity within the first 20 cm soil depth) to create the optimum moisture conditions for bed formation and early plant growth. This resulted in an ample soil moisture content early in the season. Therefore, the high soil moisture content could have eliminated the potential effects of water-limited conditions on tomato root development, resulting in no differences in root growth among treatments regardless of the irrigation application rate.
The results from the present study were contrary to those reported by Zotarelli et al. [25] for tomato under drip irrigation. In their study, the authors reported about 70–75% of the total tomato root length density within the first 15 cm of soil depth and 15–20% between 15–30 cm soil depth. However, our study showed that, regardless of irrigation conditions, tomato root length was lowest (average value of 13%) within the first 15 cm compared to 40% from 15–30 cm and 47% from 30–40 cm soil depths. Additionally, based on the report by these authors, the effective rooting depths for open-field, fresh-market tomato production in Florida could be assumed to be limited to 30 cm soil depth. In fact, other studies have indicated that a shallower root depth may be assumed as crop roots tend to be restricted to the small soil volume near the emitter when the drip is used for irrigation [25,26,27,28]. However, our results demonstrated that up to 87% of the total tomato root length was concentrated between 15 and 40 cm of soil depth (for DI and RDI). Although at a lesser magnitude, a similar root growth pattern was observed for the FI irrigation regime. This indicated that the effective root depth for tomato (especially under deficit irrigation conditions) could be beyond 30 cm. Therefore, the irrigation and nutrient management soil depths may be different from what was previously known for open-field fresh-market tomato production in Florida.
These results were similar to other reports in the literature that most tomato roots under drip irrigation could be found beyond 30 cm of soil depth [29,30,31]. The greater root length at lower soil depths (15–30 and 30–40 cm) under DI and RDI irrigation regimes, as observed in this present study, was an adaptation strategy known as primed acclimation [32,33] to increase the water uptake from lower soil depths in order meet crop water requirements. In addition, the results from this study were similar to those reported in previous studies that tomato root length increased under deficit irrigation compared to the full irrigation conditions [34,35].

3.4. Effects of Irrigation and N Application Rates on Tomato Growth or Biomass Accumulation

The results of the analysis of variance indicated that there were significant effects on biomass production between the SP-18 and FA-18 seasons, starting from CGS 3. The biomass production was higher during the FA-18 season compared to the SP-18 season at CGS 3–5. A higher biomass production during the FA-18 season was attributed to the warmer air temperatures reported during this season compared to the cooler SP-18 season [36]. Similarly, the results also indicated that both the irrigation and N application timing had significant effects on tomato biomass production during each growing season (Table 5). However, there were no significant interactions between the irrigation and N application timing on tomato biomass production at any of the CGS, thus suggesting that the effects of irrigation and N application timing (as applied in this study) on tomato growth were independent. During the SP-18 and FA-18 seasons (Table 4), irrigation had no significant effects on tomato biomass production across all the CGS, except at CGS 4 during the SP-18 season when growth was reduced under FI compared to DI and RDI. This result indicated that the observed increase in tomato root growth under the DI and RDI irrigation conditions (compared to FI) did not negatively affect tomato growth, suggesting a promising production practice with the potential opportunity for additional water savings in tomato production in Florida. A similar result was reported by Hooshmand et al. [37] on the effects of deficit irrigation in tomato production under dry climate conditions. The authors indicated that the deficit irrigation had no negative effects on tomato biomass production and other plant growth indicators, including leaf area index, specific leaf area and leaf area ratio.
Except at CGS 5, the BM conditions improved tomato growth or biomass production compared to NB across all CGS during the SP-18 season. Similar results were observed at CGS 1 and 2 during the FA-18 season (Table 5); however, during this season, plant growths were similar under both BM and NB treatments later in the growing season (CGS 3, 4, and 5). These results were similar to those obtained during the SP-19 and FA-19 seasons (Table 6) where biomass accumulation was higher under BM compared to the NB treatments. The increase in the N application rate or soil nutrient content increased tomato growth [38,39]; therefore, a greater biomass production for BM treatment could be attributed to the higher soil NH4+-N concentration from the pre-plant fertilizer, compared to treatments with no pre-plant fertilizer application. Contrary to the results obtained during the SP-18 and FA-18 seasons, these had no significant effects on tomato biomass production during the SP-19 and FA-19 seasons due to similar air temperature patterns during both seasons. The results from these studies clearly demonstrated that pre-plant N-based fertilizer was essential for tomato growth. Therefore, the application and efficient management of pre-plant N-based fertilizer could be considered as the most essential and best management practice in tomato production to obtain more vigorous tomato growth after transplanting.

3.5. Effects of Irrigation and N Application Timing on Tomato Yield

Both the SP-18 and FA-18 seasons had no effects on the total marketable yield (TMY) and there were no significant interactions between the irrigation and N application timing in the tomato yield (Table 7). Similarly, the ANOVA results during the SP-18 season indicated that both irrigation and N applications had independent significant effects on TMY, but no differences in TMY were observed during the FA-18 season among the treatments. As with the biomass production, TMY was higher under BM compared to NB treatments. During the SP-18 season, TMY was 23% higher under BM treatment compared to the NB; however, the yield was similar for both BN and NB treatments during the FA-18 season (Table 7). There were no significant differences in TMY between FI and RDI during the SP-18 season but TMY was significantly lower for DI treatment. These results suggested that, although the application of deficit irrigation (66% ETc) throughout the growing season (DI) may reduce tomato yield, there was no yield penalty when the deficit irrigation was applied only during the early vegetative stages (CGS 1 and 2). Therefore, under Florida production conditions, the RDI regime may present an important strategy for water conservation in tomato production.
During the FA-18 season, the yield was much lower across all treatments, and the N application timing had no effects on tomato yield. As discussed earlier, early indications suggested that the lower yield during the FA-18 season, especially for BM treatment, was because of nutrient depletion, which may have resulted from a rapid early (CGS 1 and 2) growth due to warmer temperatures. Therefore, modifying the BM treatment (for 2019 seasons) by an early start of fertigation at 3 WAT (BM3) could maintain a higher soil nutrient content compared with a starting fertigation at 5 WAT (BM5) as applied during the FA-18 season. However, contrary to this proposition, there were no observable differences in yield between the earlier (BM3) or later start of fertigation (BM5) during the SP-19 and FA-19 (Table 7) seasons. Based on the results from the follow-up studies during the 2019 seasons, a poor crop performance or lower productivity during the FA-18 season was not due to a late start of fertigation, thus confirming that poor yield during this season was due to leaching (from a high soil moisture content earlier in the season). Yield responses during both seasons (SP-19 and FA-19) were similar to those observed during the SP-18 season where tomato yield was significantly higher for BM compared to NB. These results were similar to those reported by Dangler and Locascio [40]; that the average tomato yield decreased linearly as the percentage of N applied through fertigation increased from 50% to 100%. Earlier research on the N application on Florida sandy soils suggested less yield response with fertigated N compared to pre-plant N [41]. Other studies reported a higher yield response (up to 10%) with the combination of pre-plant and fertigated N, compared to pre-plant only [40,41]. Accordingly [42], the combination of 40% pre-plant N and 60% fertigation increased (by up to 40%) in late-season, large and extra-large tomato fruit categories.

4. Conclusions

This study evaluated the effects of irrigation and N application timing on open-field, fresh-market tomato production. The results showed that pre-plant N fertilizer was essential in tomato production as this practice increased the soil N concentration for early plant growth and had a greater yield compared to 100% fertigation. Although pre-plant fertilizer increased early growth, it was observed that the soil incorporation of pre-plant fertilizer may reduce N concentration within the root zone early in the season. Therefore, band placement (on the bed surface) of pre-plant fertilizer may be considered a more appropriate pre-plant fertilizer application method in open-field tomato production. The N application timing had no effects on tomato root growth; however, the tomato root growth was lowest under the FI irrigation regime compared to DI or RDI regimes. Additionally, it was observed that the application of DI throughout the growing season reduced the total marketable yield of tomato. However, RDI had no negative effects on the total marketable yield compared to the full irrigation conditions. Therefore, RDI may provide an important benefit through improved water savings in tomato production. Therefore, more studies with a focus on RDI irrigation management practices in tomato production would be considered essential to enhance water conservation in tomato production.

Author Contributions

Conceptualization, I.T.A. and K.T.M. Methodology, data collection and original data analysis: I.T.A. Data presentation, writing, reviewing, and editing I.T.A. and K.T.M. Both authors have read and agreed to the published version of the manuscript.

Funding

This research was funded by United States Department of Agriculture/National Institute of Food and Agriculture.

Institutional Review Statement

Not applicable.

Informed Consent Statement

Not applicable.

Acknowledgments

The authors would like to thank all the staff of soil and water science laboratory, Southwest Florida Research and Education Center, Immokalee, Florida for their assistance in setting up the experiment, field sampling, laboratory analysis of the collected data. We also thank the anonymous reviewer for providing valuable feedback.

Conflicts of Interest

The authors declare no conflict of interest.

References

  1. Hochmuth, G.; Cordasco, K. A Summary of N, P, and K Research with Tomato in Florida 1. Fla. Coop. Ext. Serv. Inst. Food Agric. Sci. 2008. Available online: http://edis.ifas.ufl.edu (accessed on 7 September 2021).
  2. Zotarelli, L.; Dukes, M.D.; Scholberg, J.M.S.; Muñoz-Carpena, R.; Icerman, J. Tomato nitrogen accumulation and fertilizer use efficiency on a sandy soil, as affected by nitrogen rate and irrigation scheduling. Agric. Water Manag. 2009, 96, 1247–1258. [Google Scholar] [CrossRef]
  3. Ayankojo, I.T.; Morgan, K.T.; Mahmoud, K. Evaluation of Soil Water and Nitrogen Distribution by Site-Specific Irrigation Scheduling Method in Tomato Crop Grown on Sandy Soil. Soil Sci. Soc. Am. J. 2019, 83, 761–771. [Google Scholar] [CrossRef] [Green Version]
  4. Liu, G.D.; Simonne, E.H.; Morgan, K.T.; Hochmuth, G.J.; Agehara, S.; Mylavarapu, R. Fertilizer Management for Vegetable Production in Florida. In Florida Vegetable Production Handbook; Dittmar, P., Freeman, J., Paret, M., Smith, H., Eds.; IFAS Extension: Gainesville, FL, USA, 2019; pp. 3–9. [Google Scholar]
  5. Hartz, T.K.; Hochmuth, G.J. Fertility Management of Drip-irrigated Vegetables. Horttechnology 1996, 6, 168–172. [Google Scholar] [CrossRef] [Green Version]
  6. Wang, Q.; Liu, G.; Morgan, K.T.; Li, Y. HS1269/HS1269: Implementing the Four Rs (4Rs) in Nutrient Stewardship for Tomato Production. EDIS 2020. Available online: https://edis.ifas.ufl.edu/publication/HS1269 (accessed on 7 September 2021).
  7. Alva, A.K.; Paramasivam, S.; Fares, A.; Delgado, J.A.; Mattos, D., Jr.; Sajwan, K. Nitrogen and Irrigation Management Practices to Improve Nitrogen Uptake Efficiency and Minimize Leaching Losses. J. Crop. Improv. 2008, 15, 369–420. [Google Scholar] [CrossRef]
  8. Liu, G.; Zotarelli, Y.; Li, D.; Wang, Q.; Ozores-Hampton, M. Controlled-Release and Slow-Release Fertilizers as Nutrient Management Tools. UF/IFAS Ext. Serv. 2014. Available online: https://edis.ifas.ufl.edu/publication/HS1255 (accessed on 7 September 2021).
  9. Sainju, U.M.; Singh, B.P.; Rahman, S.; Reddy, V.R. Soil Nitrate-Nitrogen under Tomato following Tillage, Cover Cropping, and Nitrogen Fertilization. J. Environ. Qual. 1999, 28, 1837–1844. [Google Scholar] [CrossRef]
  10. Zhang, T.Q.; Liu, K.; Tan, C.S.; Warner, J.; Wang, Y.T. Processing Tomato Nitrogen Utilization and Soil Residual Nitrogen as Influenced by Nitrogen and Phosphorus Additions with Drip-Fertigation. Soil Sci. Soc. Am. J. 2011, 75, 738–745. [Google Scholar] [CrossRef]
  11. Sweeney, D.; Graetz, D.; Bottcher, A.; Locascio, S.J.; Campbell, K. Tomato yield and nitrogen recovery as influenced by irrigation method, nitrogen source, and mulch. HortScience 1987, 22, 27–29. [Google Scholar]
  12. USDA Web Soil Survey. Available online: https://websoilsurvey.sc.egov.usda.gov/App/WebSoilSurvey.aspx (accessed on 27 September 2021).
  13. Kadyampakeni, D.M.; Morgan, K.T.; Schumann, A.W.; Nkedi-Kizza, P.; Obreza, T.A. Water Use in Drip-and Microsprinkler-Irrigated Citrus Trees Soil & Water Management & Conservation. Soil Sci. Soc. Am. J. 2014, 78, 1351–1361. [Google Scholar] [CrossRef]
  14. FAWN—Florida Automated Weather Network. Available online: https://fawn.ifas.ufl.edu/ (accessed on 27 September 2021).
  15. Freeman, J.H.; Mcavoy, E.J.; Boyd, N.S.; Kanissery, R.; Smith, H.A.; Desaeger, J.; Noling, J.W.; Vallad, G.E. Tomato Production Botany and Planting. In Vegetable Production Handbook of Florida; Dittmar, P., Freeman, J., Paret, M., Smith, H., Eds.; IFAS Entension: Gainesville, FL, USA, 2019; pp. 348–392. [Google Scholar]
  16. Allen, R.G.; Pereira, L.S.; Raes, D. Crop Evapotranspiration-Guidelines for Computing Crop Water Requirements-FAO Irrigation and Drainage Paper 56 Table of Contents; FAO: Rome, Italy, 1998. [Google Scholar]
  17. Migliaccio, K.W.; Morgan, K.T.; Vellidis, G.; Zotarelli, L.; Fraisse, C.; Zurweller, B.A.; Andreis, J.H.; Crane, J.H.; Rowland, D.L. Smartphone apps for irrigation scheduling. Trans. ASABE 2016, 59, 291–301. [Google Scholar] [CrossRef]
  18. Ayankojo, I.T.; Morgan, K.T.; Ozores-Hampton, M.; Migliaccio, K.W. Effects of real-time location-specific drip irrigation scheduling on water use, plant growth, nutrient accumulation, and yield of Florida fresh-market tomato. HortScience 2018, 53, 1372–1378. [Google Scholar] [CrossRef] [Green Version]
  19. Stanley, C.D.; Clark, G.A. Water Requirements for Drip-Irrigated Tomato Production in Southwest Florida 1. EDIS 2004, 1–3. [Google Scholar]
  20. USDA United States Standards for Grades of Fresh Tomatoes. Available online: https://www.ams.usda.gov/sites/default/files/media/Tomato_Standard%5B1%5D.pdf (accessed on 27 September 2021).
  21. Mylavarapu, R.S.; Moon, D.L.; Professor, A. UF/IFAS Extension Soil Testing Laboratory (ESTL) Analytical Procedures and Training Manual 1 Circular 1248. EDIS 2002. Available online: http://edis.ifas.ufl.edu (accessed on 7 September 2021).
  22. Katul, G.; Todd, P.; Pataki, D.; Kabala, Z.J.; Oren, R. Soil water depletion by oak trees and the influence of root water uptake on the moisture content spatial statistics. Water Resour. Res. 1997, 33, 611–623. [Google Scholar] [CrossRef] [Green Version]
  23. Morgan, K.T.; Parsons, L.R.; Wheaton, T.A.; Pitts, D.J.; Obreza, T.A. Field Calibration of a Capacitance Water Content Probe in Fine Sand Soils. Soil Sci. Soc. Am. J. 1999, 63, 987–989. [Google Scholar] [CrossRef]
  24. Morgan, K.T.; Parsons, L.R.; Adair Wheaton, T. Comparison of laboratory- and field-derived soil water retention curves for a fine sand soil using tensiometric, resistance and capacitance methods. Plant Soil 2001, 234, 153–157. [Google Scholar] [CrossRef]
  25. Zotarelli, L.; Scholberg, J.M.; Dukes, M.D.; Muñoz-Carpena, R.; Icerman, J. Tomato yield, biomass accumulation, root distribution and irrigation water use efficiency on a sandy soil, as affected by nitrogen rate and irrigation scheduling. Agric. Water Manag. 2009, 96, 23–34. [Google Scholar] [CrossRef]
  26. Goldberg, D.; Gornat, B.; Bar, Y. The distribution of roots, water and minerals as a result of trickle irrigation. J. Am. Soc. Hortic. Sci. 1974. Available online: https://agris.fao.org/agris-search/search.do?recordID=AG19760063991#.XtvDSmJ_Clu (accessed on 7 September 2021).
  27. Persaud, N.; Locascio, S.J.; Geraldson, C.M. Influence of fertilizer rate and placement and irrigation method on plant nutrient status, soil soluble salt and root distribution of mulched tomatoes. Proc. Soil Crop. Sci. Soc. Fla. 1977. Available online: https://agris.fao.org/agris-search/search.do?recordID=US19780267328 (accessed on 7 September 2021).
  28. Bar-Yosef, B.; Stammers, C.; Sagiv, B. Growth of Trickle-Irrigated Tomato as Related to Rooting Volume and Uptake of N and Water1. Agron. J. 1980, 72, 815–822. [Google Scholar] [CrossRef]
  29. Oliveira, M.D.R.G.; Calado, A.M.; Portas, C.A.M. Tomato root distribution under drip irrigation. J. Am. Soc. Hortic. Sci. 1996, 121, 644–648. [Google Scholar] [CrossRef] [Green Version]
  30. RMA Machado, M.O.C.P. Tomato root distribution, yield and fruit quality under subsurface drip irrigation. Plant Soil 2003, 255, 333–341. [Google Scholar] [CrossRef] [Green Version]
  31. Machado, R.M.A.; Oliveira, M.G. Tomato root distribution, yield and fruit quality under different subsurface drip irrigation regimes and depths. Irrig. Sci. 2005, 24, 15–24. [Google Scholar] [CrossRef] [Green Version]
  32. Rowland, D.L.; Faircloth, W.H.; Payton, P.; Tissue, D.T.; Ferrell, J.A.; Sorensen, R.B.; Butts, C.L. Primed acclimation of cultivated peanut (Arachis hypogaea L.) through the use of deficit irrigation timed to crop developmental periods. Agric. Water Manag. 2012, 113, 85–95. [Google Scholar] [CrossRef] [Green Version]
  33. Vincent, C.; Rowland, D.; Schaffer, B.; Bassil, E.; Racette, K.; Zurweller, B. Primed acclimation: A physiological process offers a strategy for more resilient and irrigation-efficient crop production. Plant Sci. 2019, 295, 110240. [Google Scholar] [CrossRef]
  34. Ayankojo, I.T.; Morgan, K.T.; Kadyampakeni, D.M.; Alfred, L. Tomato Growth, Yield, and Root Development, Soil Nitrogen and Water Distribution as Affected by Nitrogen and Irrigation Rates on a Florida Sandy Soil. HortScience 2020, 55, 1744–1755. [Google Scholar] [CrossRef]
  35. Shabbir, A.; Mao, H.; Ullah, I.; Buttar, N.A.; Ajmal, M.; Solangi, K.A. Improving Water Use Efficiency by Optimizing the Root Distribution Patterns under Varying Drip Emitter Density and Drought Stress for Cherry Tomato. Agronomy 2020, 11, 3. [Google Scholar] [CrossRef]
  36. Ayankojo, I.T.; Morgan, K.T. Increasing Air Temperatures and Its Effects on Growth and Productivity of Tomato in South Florida. Plants 2020, 9, 1245. [Google Scholar] [CrossRef]
  37. Hooshmand, M.; Albaji, M.; Boroomand nasab, S.; Alam zadeh Ansari, N. The effect of deficit irrigation on yield and yield components of greenhouse tomato (Solanum lycopersicum) in hydroponic culture in Ahvaz region, Iran. Sci. Hortic. 2019, 254, 84–90. [Google Scholar] [CrossRef]
  38. Ozores-Hampton, M.; Di Gioia, F.; Sato, S.; Simonne, E.; Morgan, K. Effects of nitrogen rates on nitrogen, phosphorous, and potassium partitioning, accumulation, and use efficiency in seepage-irrigated fresh market tomatoes. HortScience 2015, 50, 1636–1643. [Google Scholar] [CrossRef] [Green Version]
  39. Warner, J.; Zhang, T.Q.; Hao, X. Effects of nitrogen fertilization on fruit yield and quality of processing tomatoes. Can. J. Plant Sci. 2011, 84, 865–871. [Google Scholar] [CrossRef]
  40. Dangler, J.M.; Locascio, S.J. Yield of Trickle-irrigated Tomatoes as Affected by Time of N and K Application. J. Am. Soc. Hortic. Sci. 2019, 115, 585–589. [Google Scholar] [CrossRef] [Green Version]
  41. Locascio, S.J.; Olson, S.M.; Rhoads, F.M. Water quantity and time of N and K application for trickle-irrigated tomatoes. Am. Soc. Hortic. Sci. 1989, 114, 265–268. [Google Scholar]
  42. Locascio, S.J.; Smajstrla, A.G. Drip irrigated tomato as affected by water quantity and N and K application timing. Florida State Hortic. Soc. Proc. 1989. Available online: https://worldveg.tind.io/record/26268 (accessed on 7 September 2021).
Figure 1. Average daily air temperatures and cumulative precipitations during the spring and fall tomato growing seasons in both 2018 and 2019 in Immokalee, Florida.
Agronomy 11 01968 g001
Figure 2. Weekly irrigation water applied and evapotranspiration (ET0) value during spring (A) and fall (B) seasons of 2018 and spring (C) and fall (D) seasons of 2019 in Immokalee Florida.
Agronomy 11 01968 g002
Figure 3. Average daily soil moisture distribution and daily precipitation for full irrigation (A), regulated deficit irrigation (B), deficit irrigation (C) during spring 2018 season and full irrigation (D), regulated deficit irrigation (E), and deficit irrigation (F) during fall 2018 season.
Agronomy 11 01968 g003
Figure 4. Soil NO3-N and NH4+-N distributions as affected by N application timing [(25% pre-plant with 75% fertigation (BM), and zero pre-plant with 100% fertigation (NB)] under full irrigation (FI, 100% ETc), deficit irrigation (DI, 66% ETc) and regulated deficit irrigation (RDI, 66% 0–4 weeks after transplanting and 100% ETc from week 5) during spring 2018 season in Immokalee Florida.
Agronomy 11 01968 g004
Figure 5. Soil NO3-N and NH4+-N distributions as affected by N application timing [(25% pre-plant with 75% fertigation (BM), and zero pre-plant with 100% fertigation (NB)] under full irrigation (FI, 100% ETc), deficit irrigation (DI, 66% ETc) and regulated deficit irrigation (RDI, 66% 0–4 weeks after transplanting and 100% ETc from week 5) during fall 2018 season in Immokalee Florida.
Agronomy 11 01968 g005
Figure 6. Effects of irrigation and N application timing on tomato root length during spring 2018 season in Immokalee, Florida. (BM = 25% pre-plant with 75% fertigation, NB = zero pre-plant with 100% fertigation. FI = full irrigation at 100% ETc, DI = deficit irrigation at 66% ETc and RDI = regulated deficit irrigation at 66% ETc, 0-4 weeks after transplanting and 100% ETc from week 5). Error bars = 1 standard error.
Agronomy 11 01968 g006
Figure 7. Effects of irrigation and N application timing on tomato root length during 2019 growing seasons in Immokalee, Florida. (BM = 25% pre-plant with 75% fertigation, NB = zero pre-plant with 100% fertigation. FI = full irrigation at 100% ETc, DI = deficit irrigation at 66% ETc and RDI = regulated deficit irrigation at 66% ETc, 0–4 weeks after transplanting and 100% ETc from week 5). Error bars = 1 standard error.
Agronomy 11 01968 g007
Table 1. The physical and chemical properties of the soil at the study location.
Soil DepthpH Organic MatterCation
Exchange Capacity
Bulk DensitySaturated
Hydraulic
Conductivity
Hydraulic Conductivity at Field
Capacity
Saturated Moisture ContentMoisture Content at Field Capacity Residual Moisture Content
cm %cmolc kg−1g cm−3cm h−1m3 m−3
0–155.60.617.631.6215.820.370.340.090.013
15–305.20.410.741.6213.970.130.360.100.013
30–455.80.490.331.5913.220.630.390.100.013
Soil to water ratio = 1:2 (w/v). Table adapted from Kadyampakeni et al., 2014b.
Table 2. Treatment specifications during the 2018 and 2019 growing seasons.
Treatment # Irrigation ApplicationN Fertilizer TimingTreatment Details
spring and fall 2018
1Full irrigation (FI)25% pre-plant and 75% fertigation (BM)Pre-plant N with full irrigation
2Zero pre-plant and 100% fertigation (NB)Fertigation with full irrigation
3Regulated deficit irrigation (RDI)BMPre-plant with regulated deficit irrigation
4NBFertigation with regulated irrigation
5Deficit irrigation (DI)BMPre-plant N with deficit irrigation
6NBFertigation with deficit irrigation
spring and fall 2019
1FINBFertigation with full irrigation
2RDIBM3RDI with pre-plant N and fertigation starting at 3 weeks after transplanting
3RDIBMRDI with pre-plant N and fertigation starting at 5 weeks after transplanting
4DINBFertigation with deficit irrigation
FI = full irrigation at 100% ETc throughout the season, DI = deficit irrigation at 66% ETc throughout the season, RDI = regulated deficit irrigation (DI at from 0–4 weeks after transplanting and FI from 5 weeks after transplanting). Fertigation for BM treatment started at 5 weeks after transplanting. Fertigation for BM3 started at 3 weeks after transplanting.
Table 3. Description of the tomato developmental stages and Kc values used as the guide for sampling collection.
StageKC
Values
KC Duration (DAT)Stage Descriptions
10.40–18From transplant till 9 or more leaves on the main shoot unfolded
20.7819–37From first flower open till 8th inflorescence first flower opened
31.038–83From 9th inflorescence first flower opening till fruits reach typical size but no color changes
41.084–95Fruit maturity till first harvest
50.8595–Later harvestAfter first harvest till last harvest
DAT = days after transplanting.
Table 4. Weekly nutrient applications at each crop growth stage (CGS) during spring and fall seasons of 2018.
N TreatmentsNutrientPreplantCGS 1CGS 2CGS 3CGS 4CGS 5
kg ha−1kg ha−1week−1
BMN56.00--19.6015.68-
K2O28.00--25.2016.80-
P2O514.00-----
NBN-7.459.4115.689.417.06
K2O28.007.0010.5017.5010.507.00
P2O514.00-----
BM3N56.00-8.4021.008.40-
K2O28.00--25.2016.80-
P2O514.00-----
CGS 1 = week 1–2, CGS 2 = week 3–4, CGS 3 = week 5–11, CGS 4 = week 12–13, CGS 5 = week 14. Total season nutrient application was the same for all treatments. BM = treatments with 25% (56 kg ha−1) preplant N and 75% as fertigation starting at 5 weeks after transplanting. NB = treatments with 100% fertigation. BM3 = treatments with 25% (56 kg ha−1) preplant N and 75% as fertigation starting at 3 weeks after transplanting. NB = treatments with 100% fertigation.
Table 5. Effects of nitrogen (N) and irrigation application timing on tomato growth or biomass accumulation during spring and fall seasons of 2018 in Immokalee, Florida.
TreatmentStage 1Stage 2Stage 3Stage 4Stage 5
SpringFallSpringFallSpringFallSpringFallSpringFall
Nitrogen (N)kg ha−1
BM68.74 90.44242.66 367.61853.75 946.002003.18 2057.002556.001594.00
NB53.80 43.39190.44 185.42654.79 949.001628.84 2372.002664.101924.00
Irrigation (I)
FW63.8858.59201.85248.81714.52 985.001603.81 b2160.002751.201728.00
MD58.2867.18219.49332.20799.54 950.001920.99 a2218.002485.601547.00
LW61.6464.07228.31255.53734.75 966.001923.23 a2266.002593.302002.00
Season (S)
Spring61.27-216.55-734.62-1816.00-1759.00-
Fall63.20-276.52-967.22-2214.40-2610.00-
Stat. significance
N*********ns**nsnsns
Insnsnsnsnsns*nsnsns
Sns-ns-***-***-***-
N × Insnsnsnsnsnsnsnsnsns
S × N***-***-*-**-ns-
S × Ins-ns-ns-ns-ns-
S × N × Ins-ns-ns-ns-ns-
*, **, and *** denote statistically significant difference among treatments at α value between 0.05–0.01, 0.009–0.005 and <0.005, respectively. ns = no significant difference at α ≤ 0.05.
Table 6. Effects of nitrogen (N) and irrigation application timing on tomato growth or biomass accumulation during spring and fall seasons of 2019 in Immokalee, Florida.
TreatmentStage 1Stage 2Stage 3Stage 4Stage 5
SpringFallSpringFallSpringFallSpringFallSpringFall
NIrrigationkg ha−1
NBFI83.99 b74.26 b343.37 b473.501597.00 bc-2137.60 b1487.45 b2221.352262.10
BM2RDI124.47 a123.66 a449.35 a576.631951.23 ab-3107.12 a2151.98 a2479.131932.38
BM5RDI136.08 a118.98 a429.54 a550.472082.5 a-3333.86 a2146.33 a1660.971795.37
NBDI104.59 b75.42 b344.51 ab478.431396.67 c-1808.53 b1530.06 b2082.382016.45
Season
Spring 112.28-391.69---2596.80-2111.00-
Fall 98.08-519.76---1829.00-2001.60-
Stat. significance
Treatment*****ns***-***nsns
Seasonns-ns---**-ns-
Season × Treatmentns-ns---ns-ns-
Means with different letters indicate statistical differences at α ≤ 0.05. *, **, and *** denote statistically significant difference among treatments at α value between 0.05–0.01, 0.009–0.005 and <0.005, respectively. ns = no significant difference at α ≤ 0.05. TB = total biomass production at each growth stage.
Table 7. Effects of nitrogen (N) and irrigation application timing on tomato yield during 2018 and 2019 growing seasons in Immokalee, Florida.
2018 Season2019 Season
TreatmentSpring Fall TreatmentSpring Fall
TMYCullTMYCullTMYCullTMYCull
Nitrogen (N)Mg ha−1IDDescriptionMg ha−1
BM50.612.6527.956.80T1FI, NB42.47 b2.8547.42 b2.16
NB39.502.4226.662.41T2RDI, BM358.56 a1.5961.93 a2.19
Irrigation (I) T3RDI, BM558.83 a1.0757.64 a2.48
FW43.71 b2.8125.103.57T4DI, NB38.77 b0.6738.88 b2.87
MD52.47 a2.5329.695.28Season
LW38.98 b2.3627.535.28Spring51.472.43--
Season (S) Fall49.681.55--
Spring42.522.53--Stat. significance
Fall22.924.57--Treatment**ns*ns
Stat. significance Seasonnsns--
N**nsnsnsSeason × treatmentnsns--
I***nsnsns
S*****--
N × Insns--
S × N***--
S × Insns--
S × N × Insns--
Means with different letters indicate statistical differences at α ≤ 0.05. *, **, and *** denote statistically significant difference among treatments at α value between 0.05–0.01, 0.009–0.005 and <0.005, respectively. ns = no significant difference at α ≤ 0.05. TB = total biomass production at each growth stage.
Publisher’s Note: MDPI stays neutral with regard to jurisdictional claims in published maps and institutional affiliations.

