Article

Linear Relationship of a Soil Total Water Potential Function and Relative Yield—A Technique to Control Salinity and Water Stress on Golf Courses and Other Irrigated Fields

1
Faculdade de Ciências e Tecnologia, Campus de Gambelas, Edifício 8, Universidade do Algarve, 8005-139 Faro, Portugal
2
Centro de Investigação Professor Doutor Joaquim Veríssimo Serrão, Casa de Portugal e de Camões, 2005-157 Santarém, Portugal
3
Department of Irrigation and Melioration, Faculty of Hydromelioration, Tashkent Institute of Irrigation and Agricultural Mechanization Engineers, Kori-Niyoziy Str. 39, Tashkent 100000, Uzbekistan
4
Bjacob Blaustein Institute for Desert Research, Ben Gurion University of the Negev, Beer Sheva 84105, Israel
5
Rua Padre António Vieira, 24 Unidade de I&D Centro de Geo-Sistemas, CVRM Instituto Superior Técnico—Lisbon, 8100-611 Loulé, Portugal
*
Author to whom correspondence should be addressed.
Agronomy 2021, 11(10), 1916; https://doi.org/10.3390/agronomy11101916
Submission received: 12 August 2021 / Revised: 17 September 2021 / Accepted: 20 September 2021 / Published: 24 September 2021

Abstract

:
A simple empirical approach is proposed for the determination of crop relative yield (%) through the soil total water potential (kPa). Recurring to decimal logarithms, from analytical exponential expressions, a linear simple relationship of soil total water potential Ψt (matric Ψm + potential Ψo) function and crop relative yield was studied and developed. The combination of the salinity model, the soil water retention model and the matric potential approach were used to reach this objective. The representation of turfgrass crop relative yield (%) versus a function of soil total water potential f(Ψt) values was shown through a log-normal graph (y = a + mx); the log scale axis “y” (ordinates) defines relative yield Yr, being two the origin ordinate “a” and “m” the slope; the normal decimal scale axis “x” (abscissa) is the function of soil total water potential f(Ψt). Hence, it is possible, using only two experimental points, to define a simple linear relation between a function of soil total water potential and crop relative yield, for a soil matric potential value lower than −20 kPa. This approach was first tested on golf courses (perennial turfgrass fields), but it was further decided to extend it to other annual crop fields, focused on the model generalization. The experimental plots were established, respectively, in Algarve, Alentejo and Oeiras (Portugal) and in the North Negev (Israel). Sprinkler and trickle irrigation systems, under randomized blocks and/or water and salt gradient techniques, were used for water application with a precise irrigation water and salt distribution. Results indicated that there is a high agreement between the experimental and the prediction values (R2 = 0.92). Moreover, the precision of this very simple and easy tool applied to turfgrass fields and other irrigated soils, including their crop yields, under several different sites and climatic conditions, can contribute to its generalization.

1. Introduction

Lack of water and high salinity of soil and irrigation water are high-cause great problems for crop productions in arid and semi-arid regions [1,2,3,4]. The major effect of soil salinity is a reduction in plant water uptake [5]. Hence, the salinity condition in the root zone hinders moisture extraction from soil by plants because of osmotic potential development in soil water, due to the presence of salts, which ultimately decreases transpiration of plants, and thereby affects crop yield [6,7]. Therefore, the additional presence of salinity stress decreases the relative yield response due to water stress; similarly, under water stress, the relative yield response to increasing salinity is reduced [8]. On the other hand, when saline water is the only source available to the farm, it is necessary to avoid the reduction of irrigation doses to prevent excessive salt accumulation in the root zone with unavoidable effects on crop yield [9]. Hence, it is assumed that water uptake depends on matric and osmotic potentials [10], being the soil total water potential a sum of several soil potentials, especially the matric and osmotic potential [11]. Soil water retention curve plays an important role in simulating soil water movement and assessing soil water holding capacity and availability [12]. Soil water retention curves are crucial for characterizing soil moisture dynamics and are particularly relevant in the context of irrigation management [13]. The quantification of the soil water potential is necessary for a variety of applications in both agricultural and horticultural systems, such as optimization of irrigation volumes and fertilization; it has been employed in a variety of studies and applications to optimize irrigation schedule and to investigate ways in which water-saving irrigation can help to save water, increase water productivity and optimize production [14]. However, the direct measurement of soil parameters for unsaturated soils requires complicated laboratory tests and it is often expensive and time consuming, according to [15,16,17]. Linear relationships of transpiration and yield have been computed for various crops and climates under different soil water conditions [18] and under various salinity conditions [19]. Investigations into water potentials in the soil–plant system are of great relevance in environments with abiotic stresses, such as salinity and drought [20]. Later, soil salinity and matric potential interactions on yield response were studied [19]. The simplified diffusion convection equation to obtain production functions, including the effects of water, salinity and nutrition conditions, was solved by [21]. Later, a model was presented in which the wilting point is a function of the soil salt content [22] at a higher salinity, the water content at wilting point is higher than at low salinity, resulting in an insufficient amount of available water, and, therefore, a reduced yield. This model shows that the movement of salts in the soil is solely dependent on the movement of water in soil; it shows that the effect of salinity is simulated by its effect on the wilting point, thus reducing the soil available water content [23]. However, when the crop foliage is wet by sprinkling with saline water, plants are subject to additional salt damage [24]. These salt effects were studied on corn leaves [1] and lettuce [25].
An inverted logistic exponential equation for quantifying crop salt tolerance was presented by [26], showing how salt tolerance data can be used by coupling an appropriate salt balance model with a least-squares optimization method. Later, it was conducted during a thorough study on this model that was “crowned “and widely used with the initials vGG [27]. These models describe the plant as a pipeline of water, and, therefore the water uptake and transpiration are synonymous terms such that the yield, which is dependent upon the transpiration rate, is given as a unique function of soil water potential or soil osmotic potential [28]. To account for the dynamic processes and the simulation of water and salts in the soil, plant and atmosphere continuum, several well-known models were used successfully, such as the SWAP (Sil Water Atmosphere Plant) model [29]. This model was applied to a high number of simulations, such as: (1) to account for various salinity effects in field crops irrigated with saline water, simulating soil profiles of salinity and water content comparing them with observed data; moreover, it is compared to measured and calculated transpiration from a field experiment with several salinity treatments [30], (2) to simulate saline water irrigation for seed maize [31] and (3) to model soil water-heat dynamic changes in seed–maize fields [32]. Later, other models were developed, such as HYDRUS [33], SALTMED [34] and LAWSTAC [16]. However, they did not present the linearity and the simplicity of this.
The objectives of this study were:
  • To develop a simple new model describing the effect of total soil water potential Ψt (matric Ψm + osmotic Ψo) (matric + osmotic) on relative crop production.
  • To replace the standard models, generally demanding a high number of laboratorial determinations due to a higher number of experimental points, and to be represented by curves not as attractive as the straight line defined only by two experimental points.

2. Theory

According to [2], the theoretical soil-water retention curve is given by:
ϴw = A e−{[(pF)^2]/[(B^2]}
where: A and B are soil parameters specific for each curve and ϴw is soil gravimetric content (kg water/100 kg soil). The graphical representation of ϴ versus (pF)2 values in a log-normal graph, with (pF)2 in the normal scale and ϴ in the log scale, shows, in fact, a straight-line pattern [2] from pF 2 (field capacity zone) to pF 4.2 (wilting point zone). It was already recently suggested by [35] that the log-logistic and lognormal distributions are more suitable to model soil’s pore distribution than other tested distributions. As the dry bulk density is constant for each specific soil type, and relation between gravimetric soil water content ϴw and volumetric soil water content ϴ is depending solely on the dry bulk density, it shall be used as the soil volumetric content ϴ (% = m3 water/100 m3 soil) for our further studies. However, the Soil Science Society of America [36] considers obsolete the pF concept, and, therefore, matrix potential will be expressed by “h” cm (water), through the pF concept, as follows:
pF = ln |Ψm|
Combining Equations (1) and (2), and using the soil volumetric water content ϴ instead of the gravimetric soil water content ϴw, it will be obtained
ϴ = A e−[(ln (|Ψm|)]^2/B^2.
which can be written as:
e−[(ln |Ψm|)]^2/B^2 = ϴ/A
Equation (3) was studied and developed by [3] and it was confirmed by its high rigor for |Ψm| ≥ 100 cm H2O (retention zone). This is due to cavitation initiated by entrapped air bubbles or the liquid’s own vapor pressure [37]. This air entry point is around this value and provokes a second branch curve explained by a curve inflexion that occurs near that point. These two right-lined segments with different slopes individualized [38], one of them in the retention zone and the other in the drainage zone (|Ψm| ≤ 100 cm H2O). Therefore, for |Ψm| ≥ 100 cm H2O, the exponential curve was logarithmic, and it was obtained as a high correlated linear function for a large range of soils [3], varying the correlation coefficient from 0.956 (light soils) up to 0.999 (heavy soils), as follows:
By combining Equations (3) and (4), using the soil volumetric water content ϴv [% (m3 water m−3 soil)] instead of the gravimetric soil water content ϴw and by using Ψm expressed in kPa, it will be obtained by the expression:
ϴv = A e−[(ln (10|Ψm|)]^2/B^2
Recurring to logarithms, Equation (4) takes the linear form as follows, and it obtained a high correlated linear function for a large range of soils [3], as follows:
log ϴv = log A − {[log (10 |Ψm|)]2/B2} log e
and
ϴv1 ϴv2−1 = e {[ln (10 |Ψm2|)]^2 − [ln (10 |Ψm|)]^2}/B^2 (nonlinear form)
log ϴv − 1log ϴv2 = B−2 {[log (10 |Ψm2|)]2 − log [(10 |Ψm1|]2} (linear form)
where Ψm1 and Ψm2 are soil matric potential (kPa) values. Equation (8) may be easily graphical when represented in a log-normal scale, where log scale (ordinates) defines ϴv, and the normal (decimal) scale defines {[(ln (10 |Ψm2|)]2 − [(ln (10 |Ψm1|)]2}, being B−2 the slope.
For non-saline soils, it was assumed by [39] that the soil available water content readily available to plants ϴASW is the difference between the volume of soil water content at field capacity (ϴfc) and at permanent wilting point (ϴwp), and Equation (8) takes the form
log ϴvfc − log ϴv2 = B−2 {[log (10 |Ψm2|)]2 − log [(10 |Ψmfc|]2}
being Ψmfc = −33 kPa value (retention zone limits the value for mineral soils and attributed to field capacity), according to the concepts of: [38,39,40,41,42,43]. Equation (9) takes the form
log ϴvfc − log ϴv2 = B−2 {[log (10 |Ψm2|)]2 − (2.5)2}
Under soil water stress conditions, stomatal conductance decreases and, consequently, transpiration T (mm) and CO2 are reduced [44]. Moreover, observations have shown a linear relation between irrigated crops and climates, under conditions of water deficit [45,46], as follows:
Y = k T
where k is a homogeneity factor, obtained by [47]:
k = m/E0
where m is a crop factor and E0 is average seasonal free water evaporation.
The crop yield response to soil total water potential will be presented on a relative basis, which offers a simple way and a uniform manner of presenting data from different crops, locations and years.
According to Equations (9)–(12), it may be written
ln YrM − ln Yr = Ch {[log (10 |Ψm2|)]2 − 6.25}
where Ψm2 < −33 kPa; YrM represents the maximal relative yield of the irrigated crop (100%) and Yr the relative yield (%), being Fh a specific factor of homogeneity.
YrM represents 100% of the relative yield and Ψm2 is the actual soil matric potential value. Equation (13) may be expressed by
2 − ln Yr = Fh {[log (10 |Ψm2|)]2 − 6.25}
Equation (14) may be reduced to
ln Yr = 2 − Fh {[log (10 |Ψm2|)]2 − 6.25}
The salt concentration of a relatively diluted soil solution is roughly linearly related to the electrical conductivity (EC), which in itself is linearly related to the osmotic potential (Ψo). Because EC (dS m−1) is easily measured, it is advantageous to express it in terms of EC [48] and to convert it to osmotic potential Ψo (cm H2O),
Ψo = − 360 EC
The soil total water potential Ψt can be expressed as the algebraic sum of the soil component potentials, which effects are acting on soil water behavior, as follows:
Ψt = Ψm + Ψo + Ψp + Ψg
where: Ψm, Ψo, Ψp and Ψg are, respectively, the matrix potential, soil osmotic potential, pressure potential and the gravitational potential. All these soil component potentials are additive and among them soil matric potential Ψm is the dominant potential, followed by the osmotic potential Ψo [49], and therefore Equation (17) may be reduced to
Ψt = Ψm + Ψo
or, combining Equations (16) and (18):
Ψt = Ψm − 360 EC
where Ψm may be obtained, respectively, from Equations (4)–(6) or, more easily, through its determination by the graphical representation than by the algebraic procedure.
A crop production system is characterized by the link between the crop yield Y and the factor involved in it.
The crop yield response to soil total water potential will be presented on a relative basis, which offers a simple way and uniform manner of presenting data from different crops, locations and years. This response is given as a function the soil total water potential Ψt, as follows:
Y = f (Ψt)
Linear relationships between water use and yield have been modeled for various crops and climates under conditions of water deficit [50,51] and conditions of salt stress [11,52,53,54]. On the other hand, Hanks and co-authors [55,56] have described the equation of soil water flow within a plant root extraction, as follows
δϴ/δt = {[(δ/δz) K (ϴ)] [(Ψh/Ψz)]} + A(z)
where t is the time (s), z the depth (m), K the soil hydraulic conductivity (m s−1), Ψh is the soil hydraulic potential expressed by the sum Ψm + Ψg (Pa) and A(z) is the plant root extraction function, which depends on Ψm and Ψo (Pa).
The crop yield response to total soil water potential will be presented on a relative basis, which offers a simple way and uniform manner of presenting data from different crops, locations and years. According to the influence of the salt concentration on the availability of soil water [48] Equation (15) takes the following form:
Log Yr = log 100 − m {[log (10 |Ψt|)]2 − [log (10 |ΨtYrM|)]2}
where ΨtYrM represents the total soil water potential when relative yield Yr reaches 100%.
Equation (22) shows a linear function for a large range of irrigated crops, and may be easily graphical represented by a straight line, in a log-normal scale, as follows:
y = m x + b
where: the log scale axis “y” (ordinates) defines relative yield Yr (%), being 2 the original ordinate “b” and “m” the slope; the normal decimal scale axis “x” (abscissa) is the f (Ψt), according to Equation (22), and it is represented by
f (Ψt) = {[log (10 |Ψt|)]2 − [log (10 |ΨtYrM|)]2}

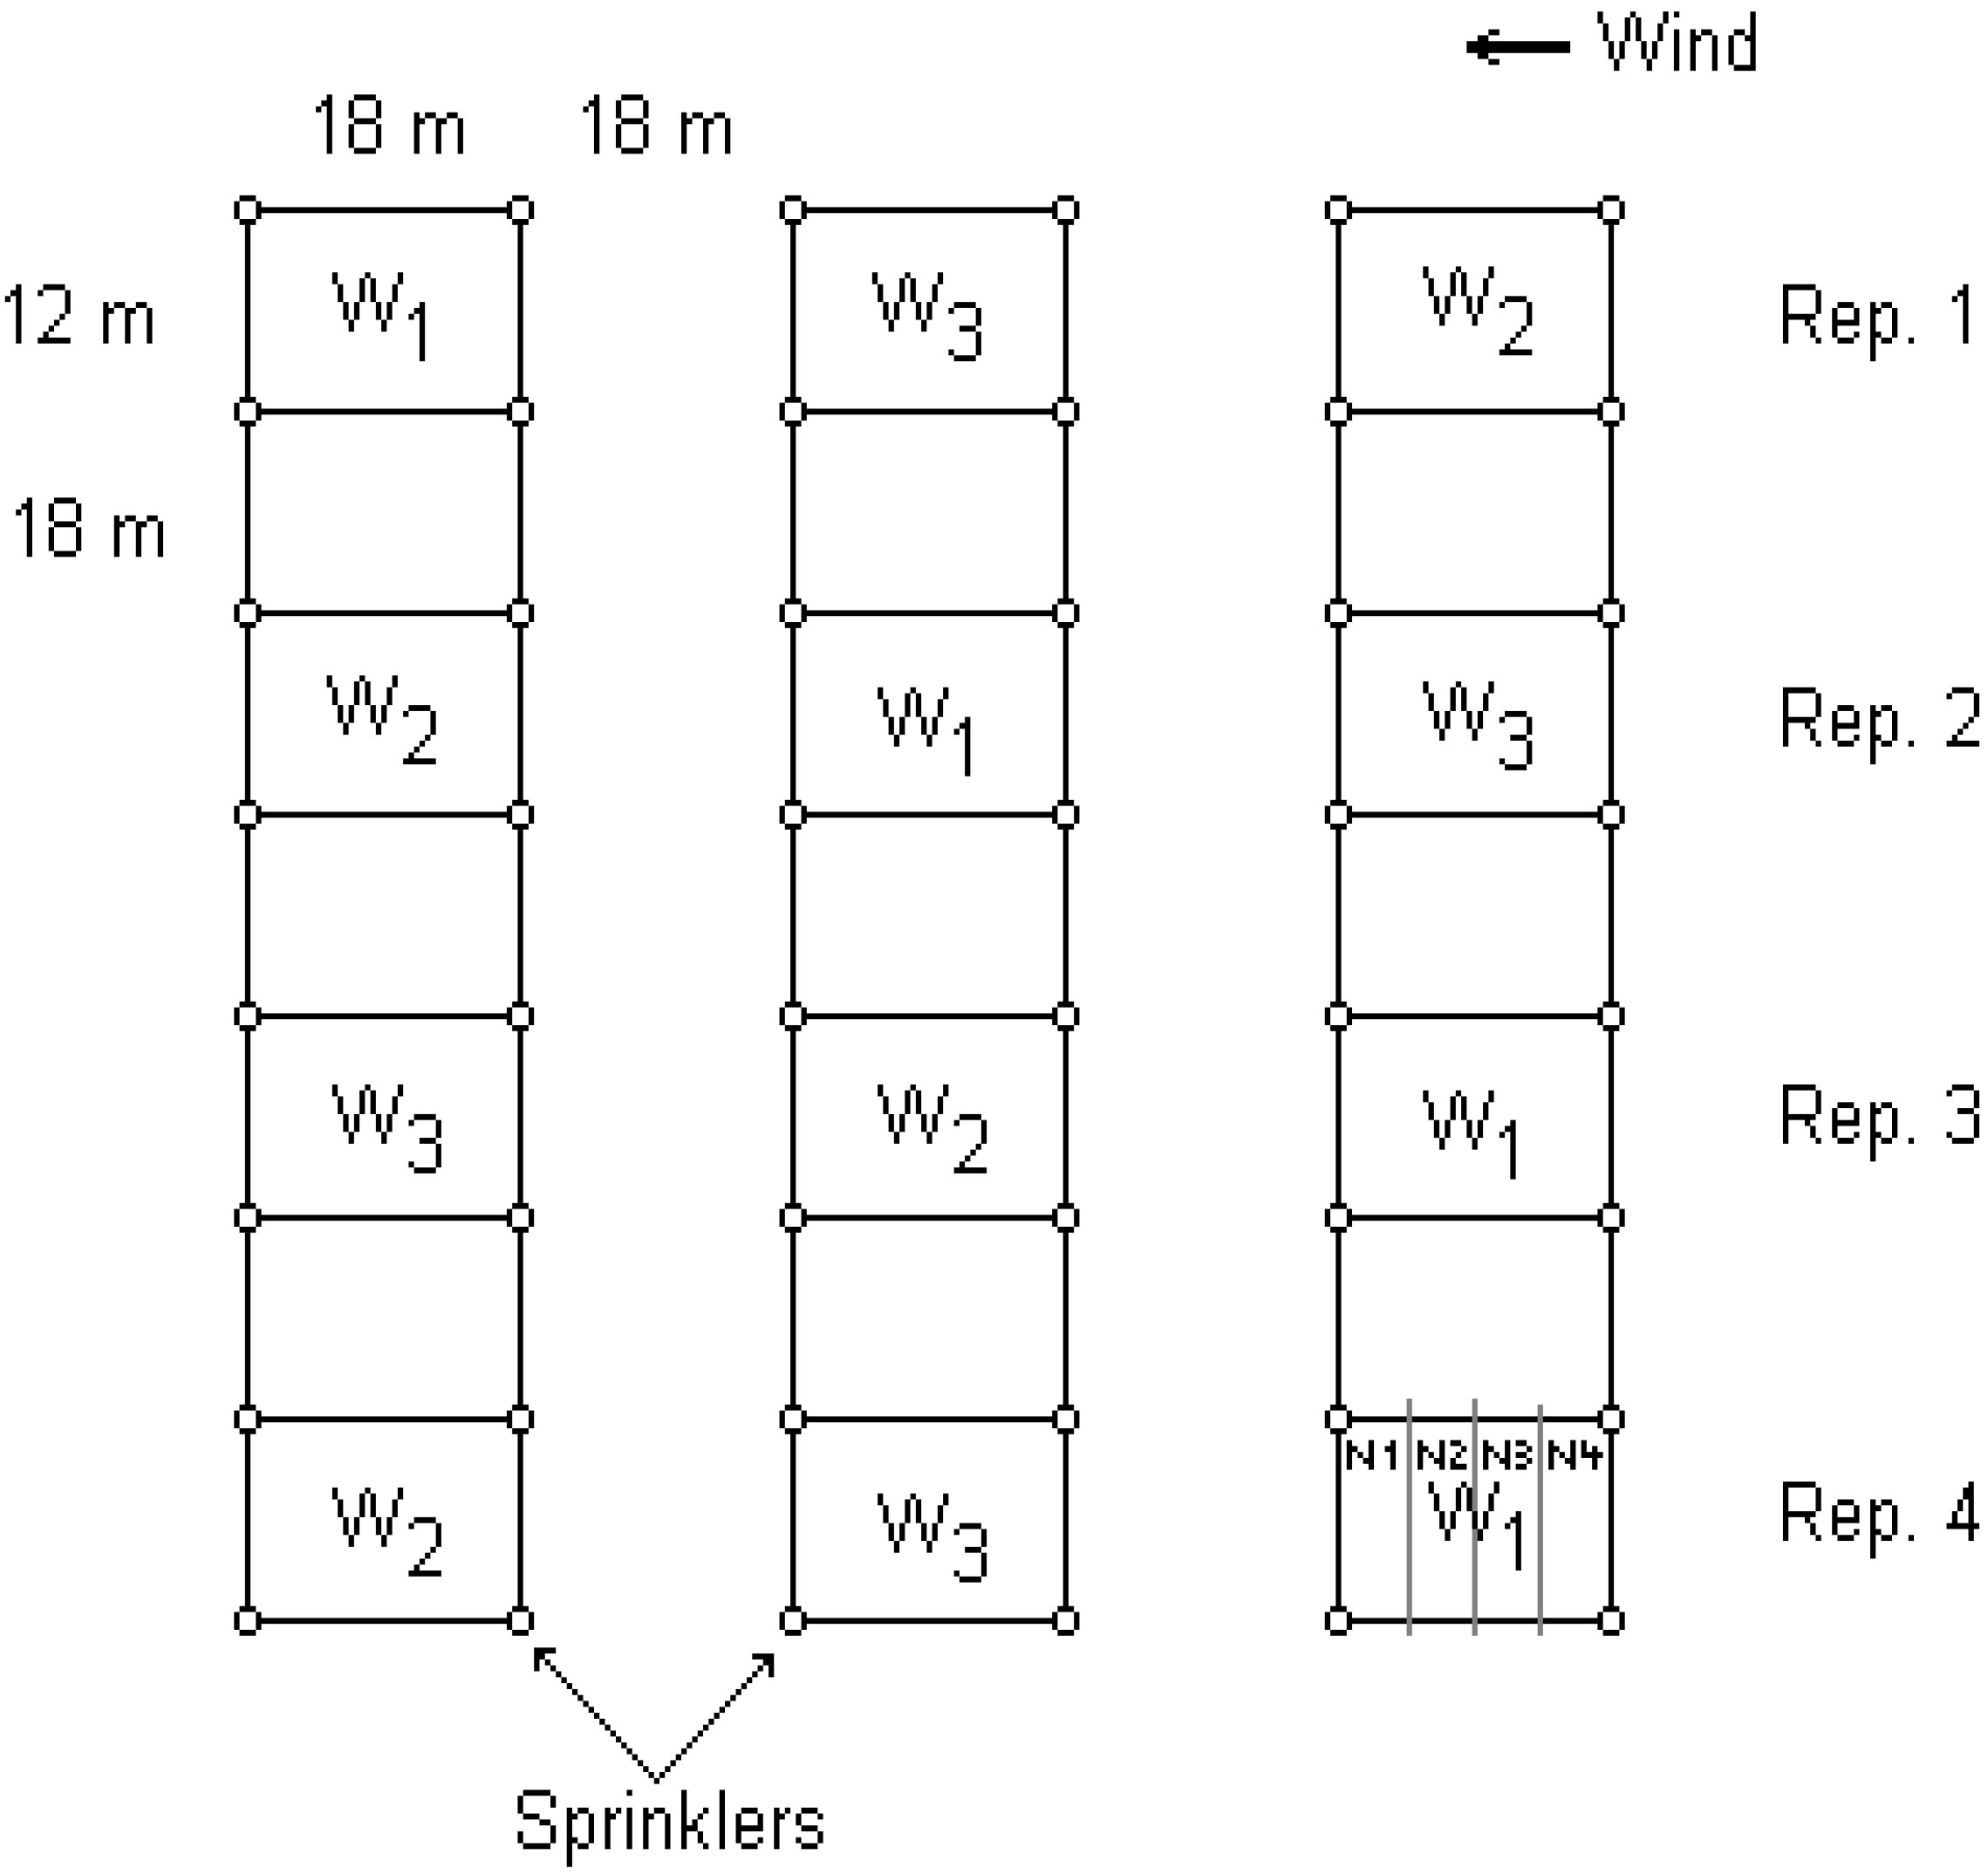
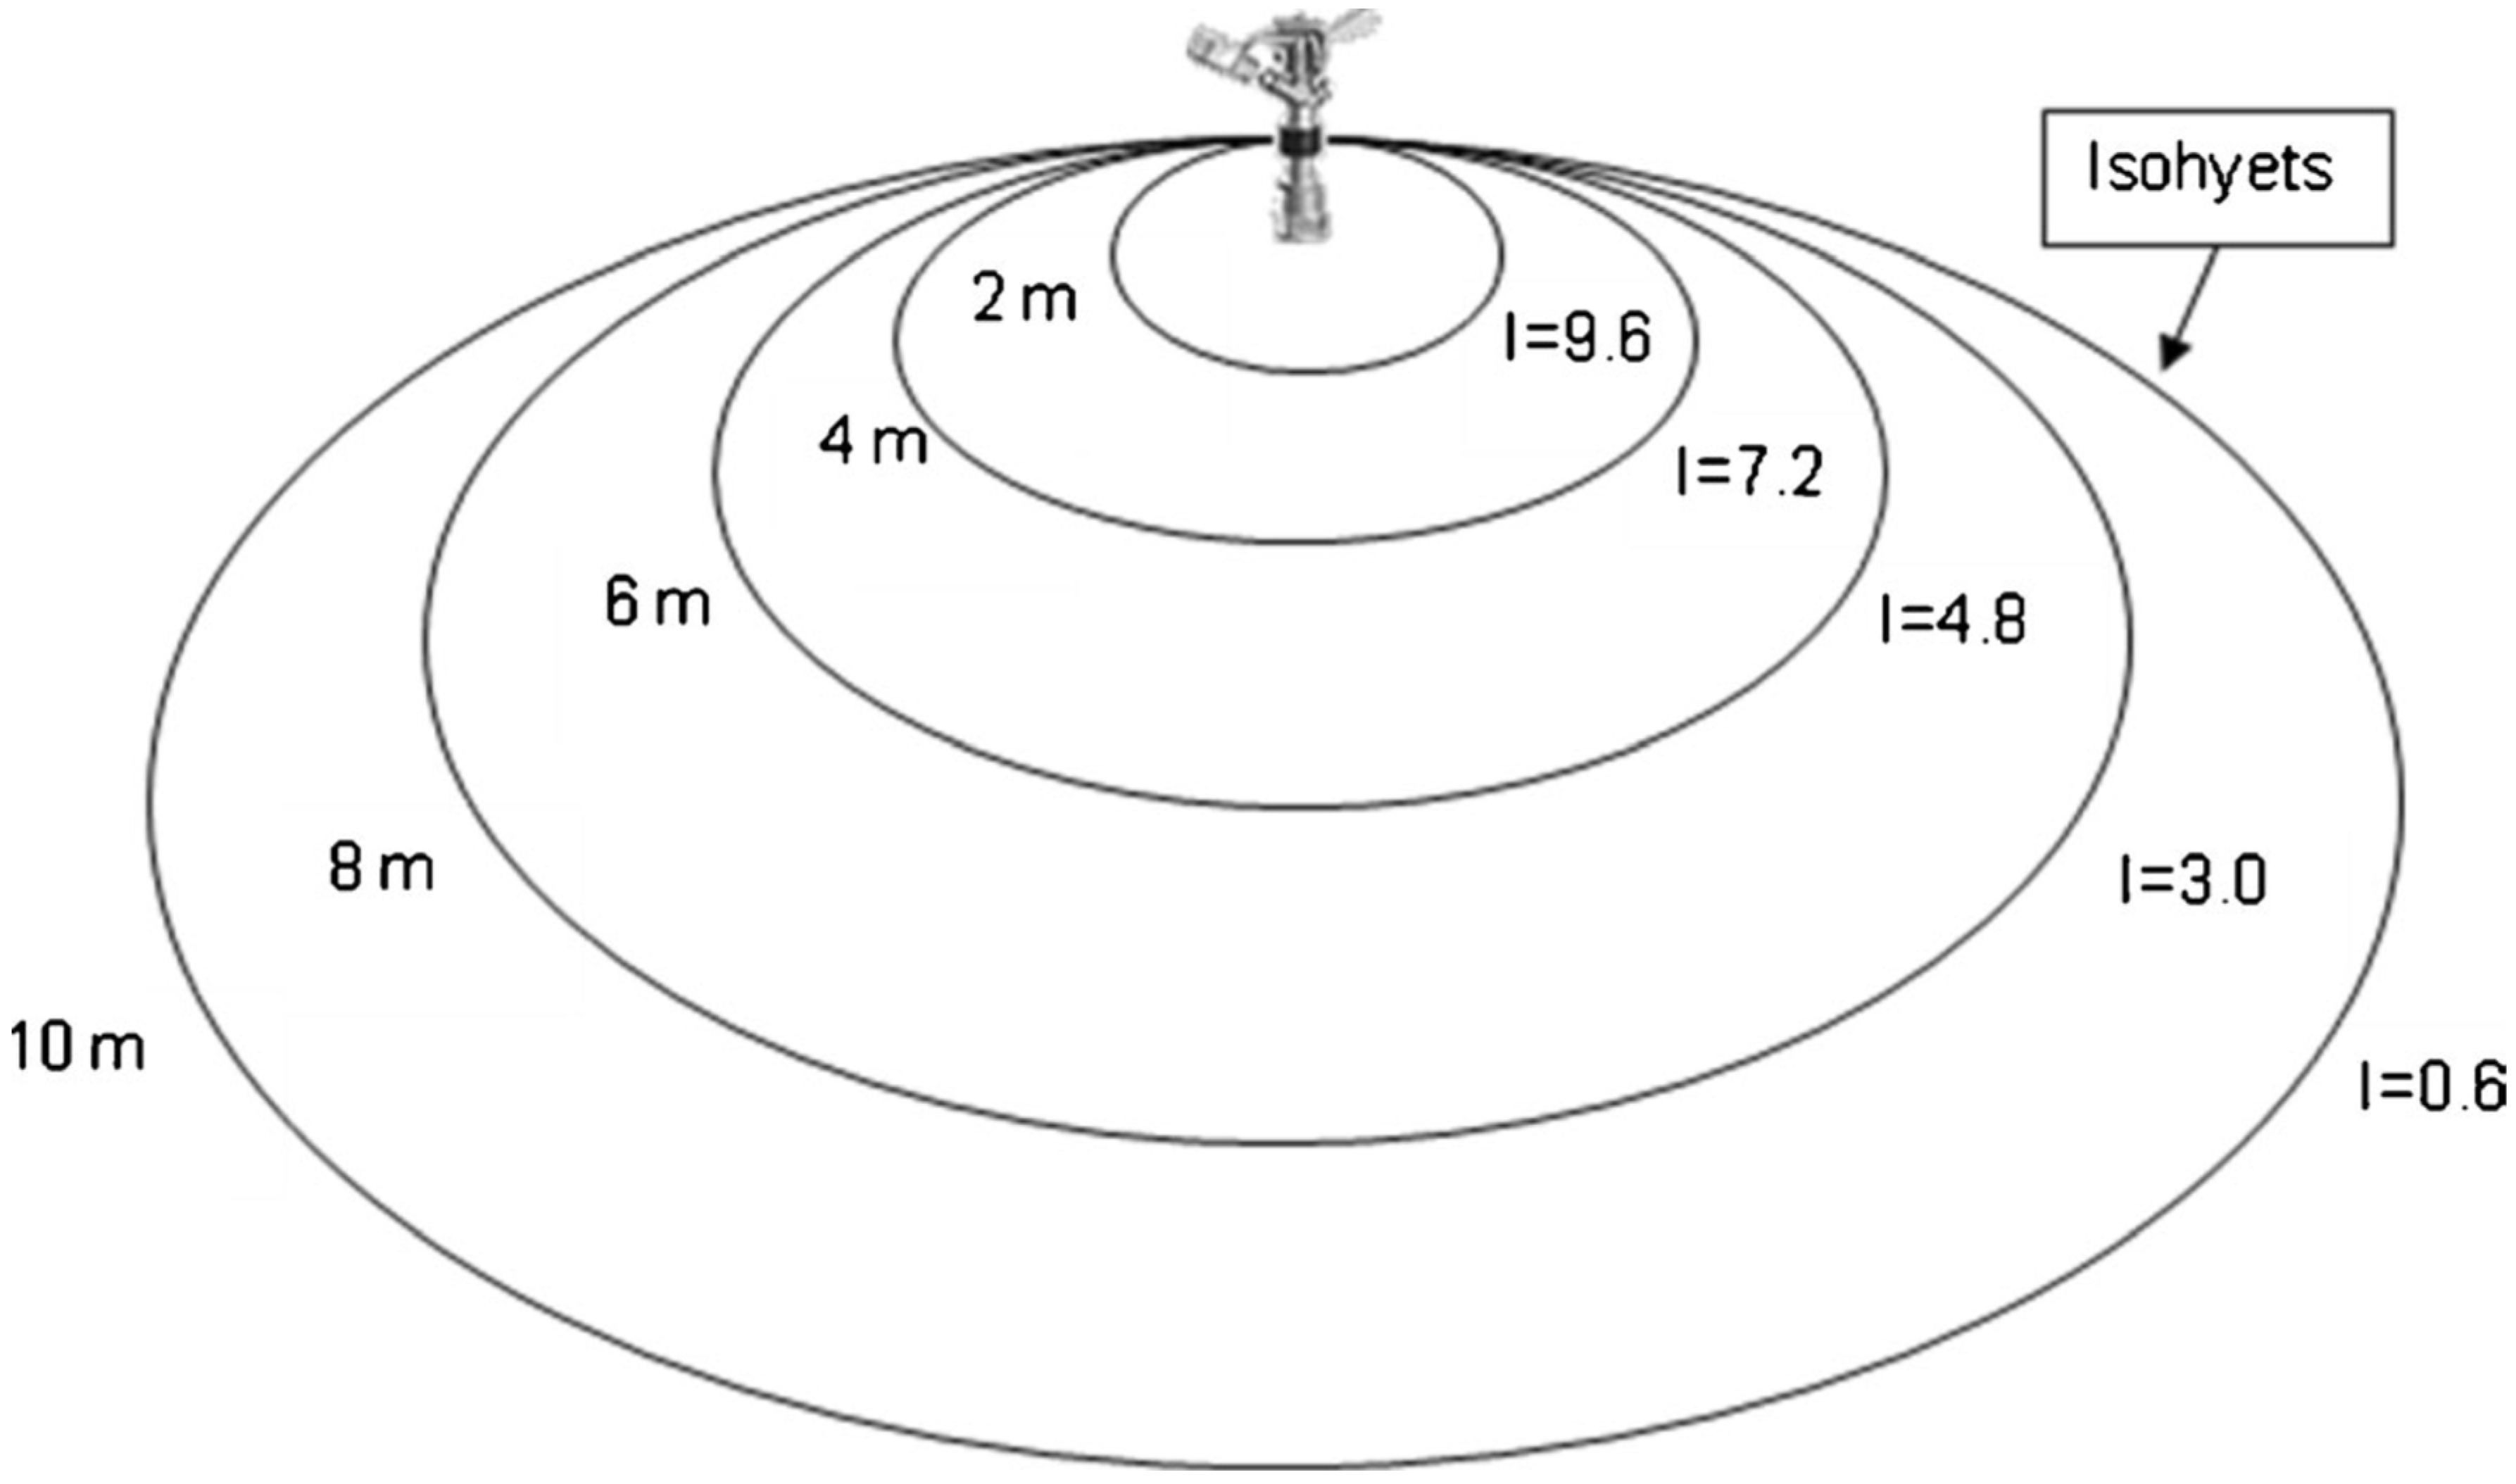
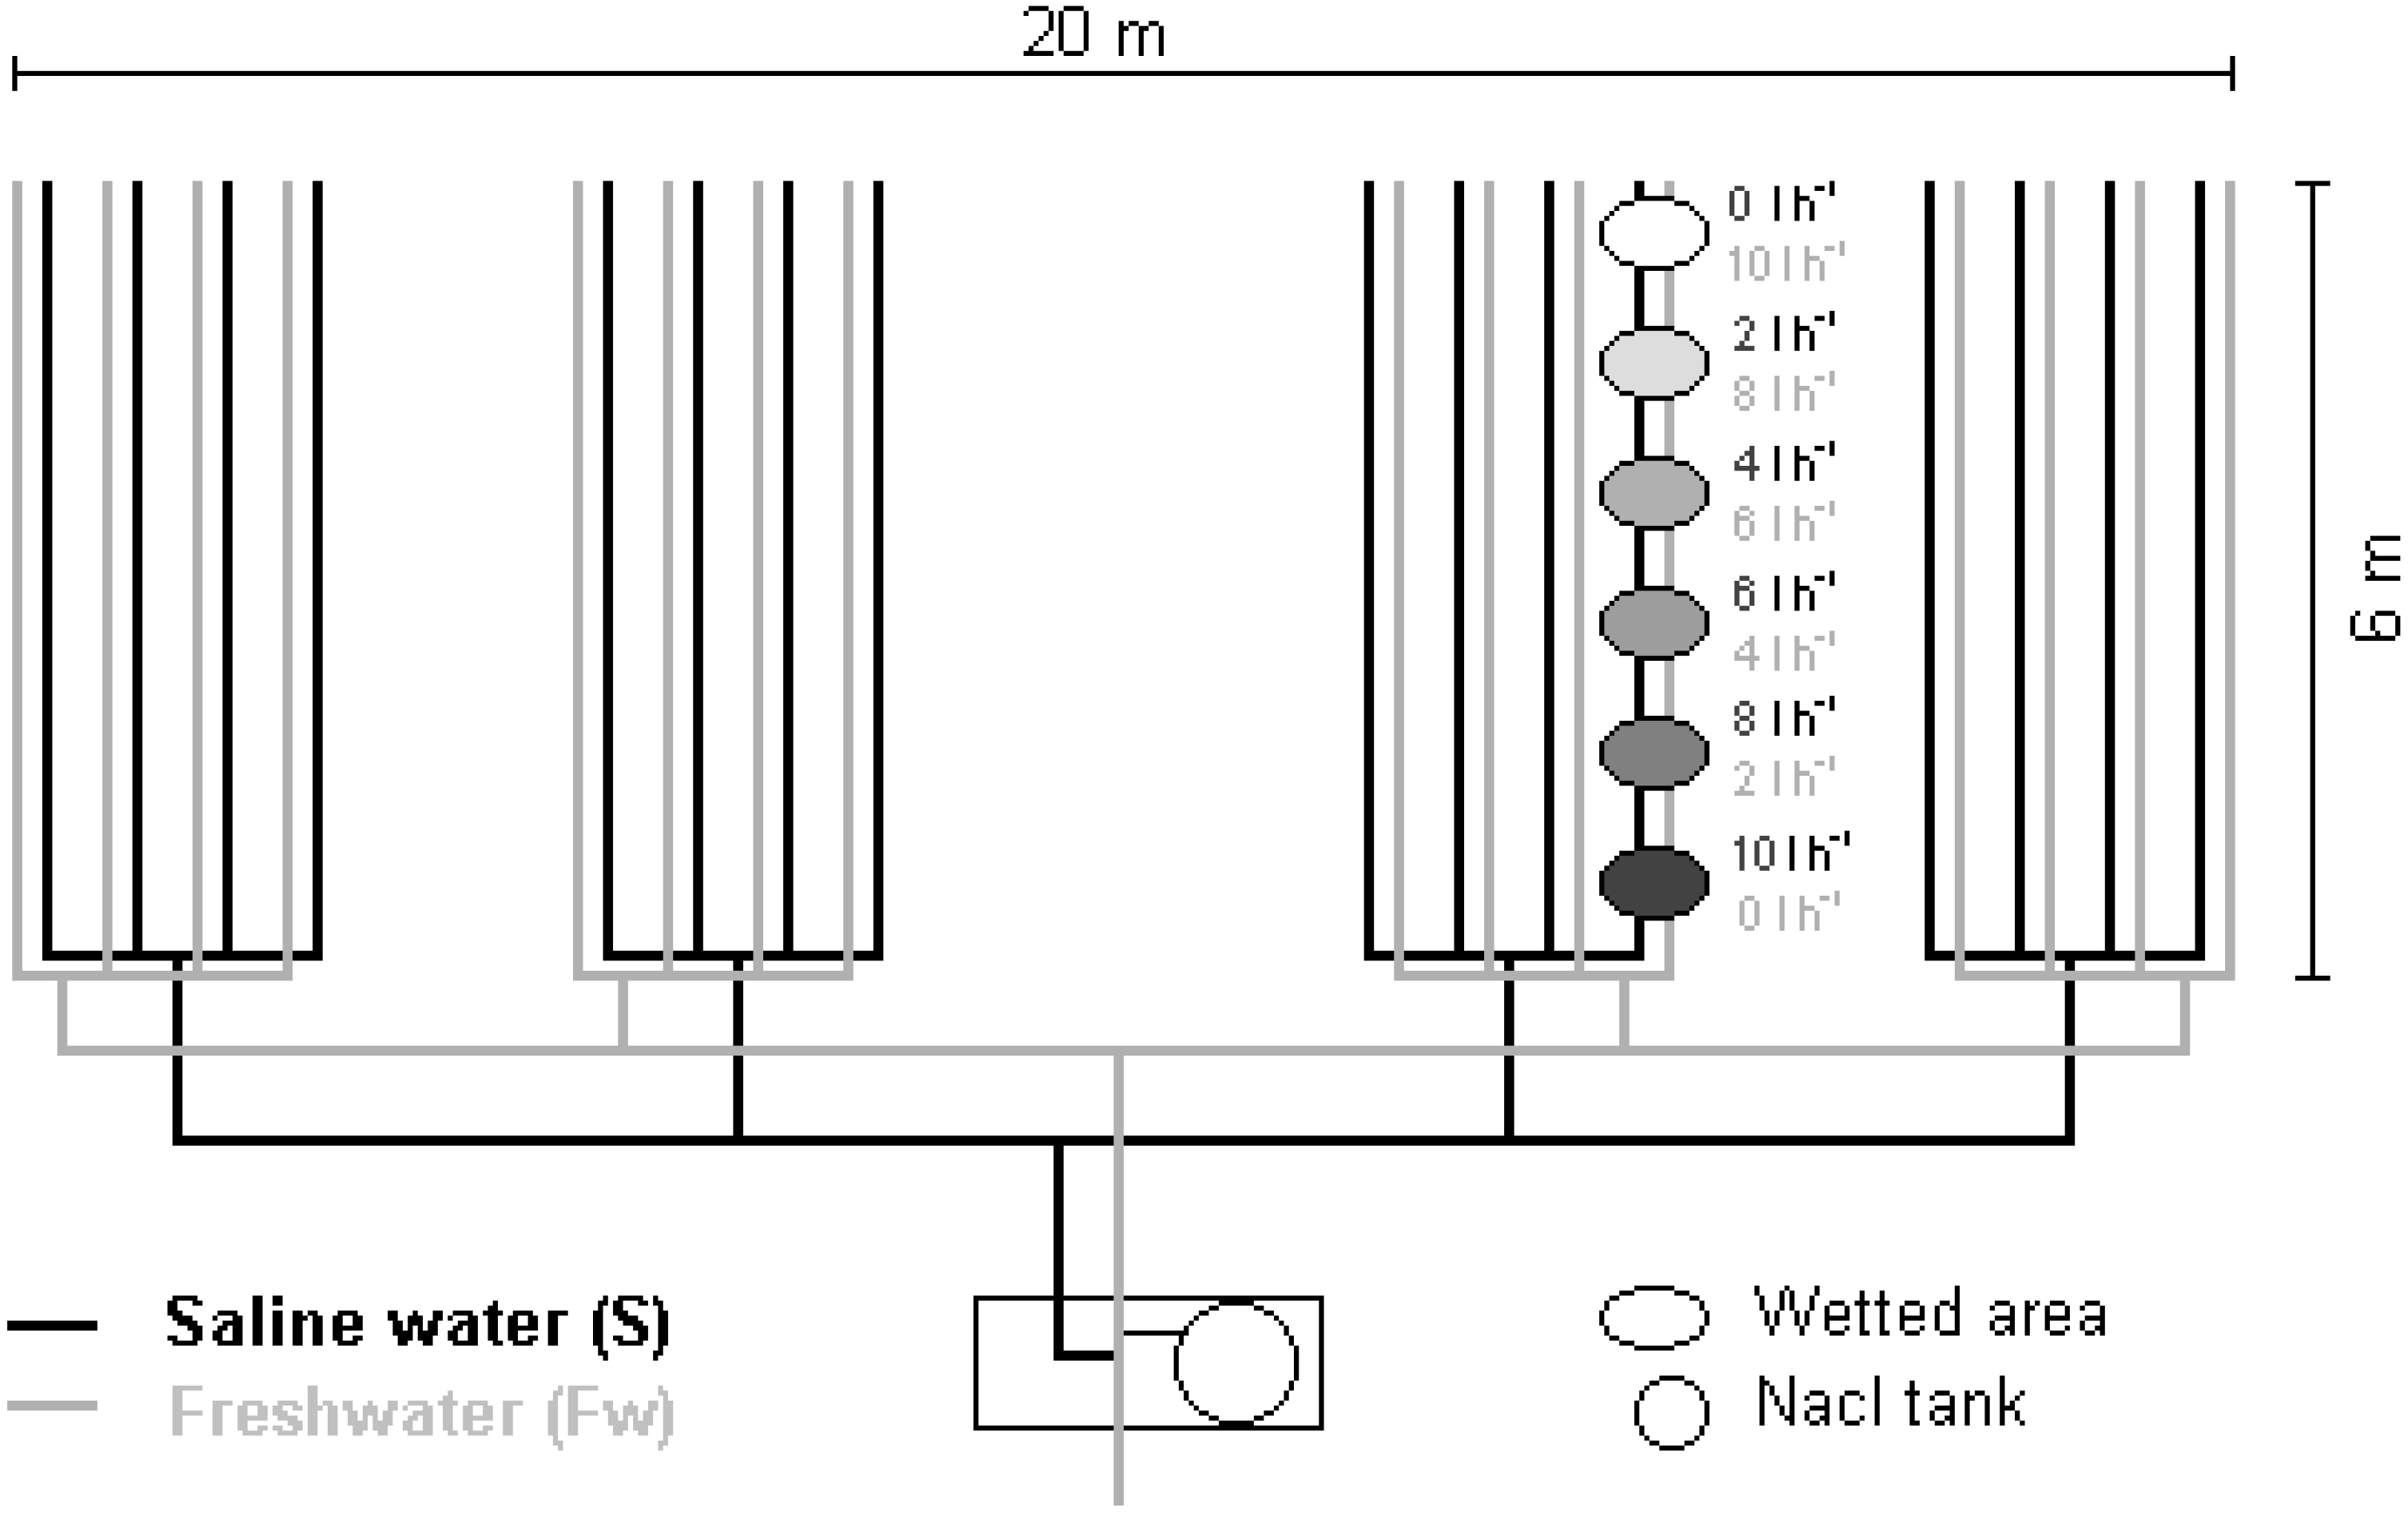
3. Materials and Methods

The experimental turfgrass fields were established in several golf courses and other lawn fields in Faro, Algarve, Portugal [57]. Horticultural crops (lettuce and cabbage) experiments were carried out in the University of Algarve, Faro, Portugal; sunflower experimental plots were conducted in Evora, Portugal; corn forage fields were established in the National Agricultural Research Station, Oeiras, Portugal; grain corn experimental plots were carried out in the Ramat Negev Agro-research Center, Ashalim, North Negev, Israel. Their geographic coordinates are, respectively: Faro, Portugal, University of Algarve (Lat. 37°01′ N, Long. 7°56′ E); Vale de Lobo golf course (latitude 37°03′22″ N and longitude 08°00′09″ W); Salgados golf course (latitude 37°05′36″ and longitude 08°19′27″ W); Evora, Portugal (Lat. 38°34′ N, Long. 7°55′ W); Oeiras, Portugal (Lat. 38°41′ N, Long. 9°18′ W); Ashalim, Israel (Lat. 31°05′ N, Long. 34°41′). Table 1 shows the studied sprinkle irrigated turfgrasses and their distribution on the different areas of the turfgrass fields [58].
Sprinkler and trickle irrigation systems under randomized blocks or point/line source techniques were used for water application with a precise irrigation water distribution, as follows:
(1)
Randomized blocks (sprinkle irrigation system) experimental design was applied to corn forage [57], according to Figure 1.
(2)
Sprinkler double line source experimental design was applied to corn, grain and cabbage [59], according to Figure 2.
(3)
Sprinkler point source experimental design was applied to turfgrass and sunflower [60], according to Figure 3.
(4)
Double emitter source experimental design was applied to cabbage and lettuce [61], according to Figure 4.
Christiansen [62] coefficient of water distribution uniformity (CUC) was always above 80% for sprinklers [9] and above 90% for drip irrigation [63]. The plots were irrigated once a day. To control soil water along the soil profile, soil water content was monitored periodically during the experiment and gravimetrically measured for a 0.0–0.3 m depth. It was based upon the direct determination of the moisture content and dry weight of the material in the oven at 105 ° C until constant weight. Soil water retention was determined by measuring the water content at six different matric potential values, which were determined by water content retained through the Richards pressure-membrane extraction apparatus. Extraction of soil solution was conducted recurring to suction cups. Seedbed and basic fertilization were made according to regional conventional agro-techniques.
Table 2 and Table 3 show, respectively, the soil properties of turfgrass fields and soil properties and irrigation methods of the other irrigated crop fields.
Replications number of measured soil volumetric water content θv for each matric potential Ψm value was always higher than 4.
The effects of treatments were evaluated using the analysis of variance (ANOVA), when no cause-and-effect relationship was known. The statistical test Dunnett T3 was selected, in order to identify the statistical difference among multiple mean values at the 95% significance level. Direction from [64,65,66] was used. When problems of lack of randomization were known due to the point source experimental design, a geostatistical approach was undertaken [67]; this approach shows that simple random sampling and the calculation of an average, usually used for the normal procedure of soil sampling in Agriculture, is not always the best answer. These geostatistical methods describe the spatial variability and help to produce standard deviation maps, showing the confidence of the samples taken in an area, where trend removal and direction of anisotropy of some soil properties was facilitated with kriging. Moreover, spatial variable experiments substitute, very efficiently and economically, conventional experimental designs, like randomized blocks due to use of much lower areas, less pollution of the environment, elimination of borders and research costs being saved, such as equipment, water, energy, fertilizers, plants, crops, pesticides, workers and management.

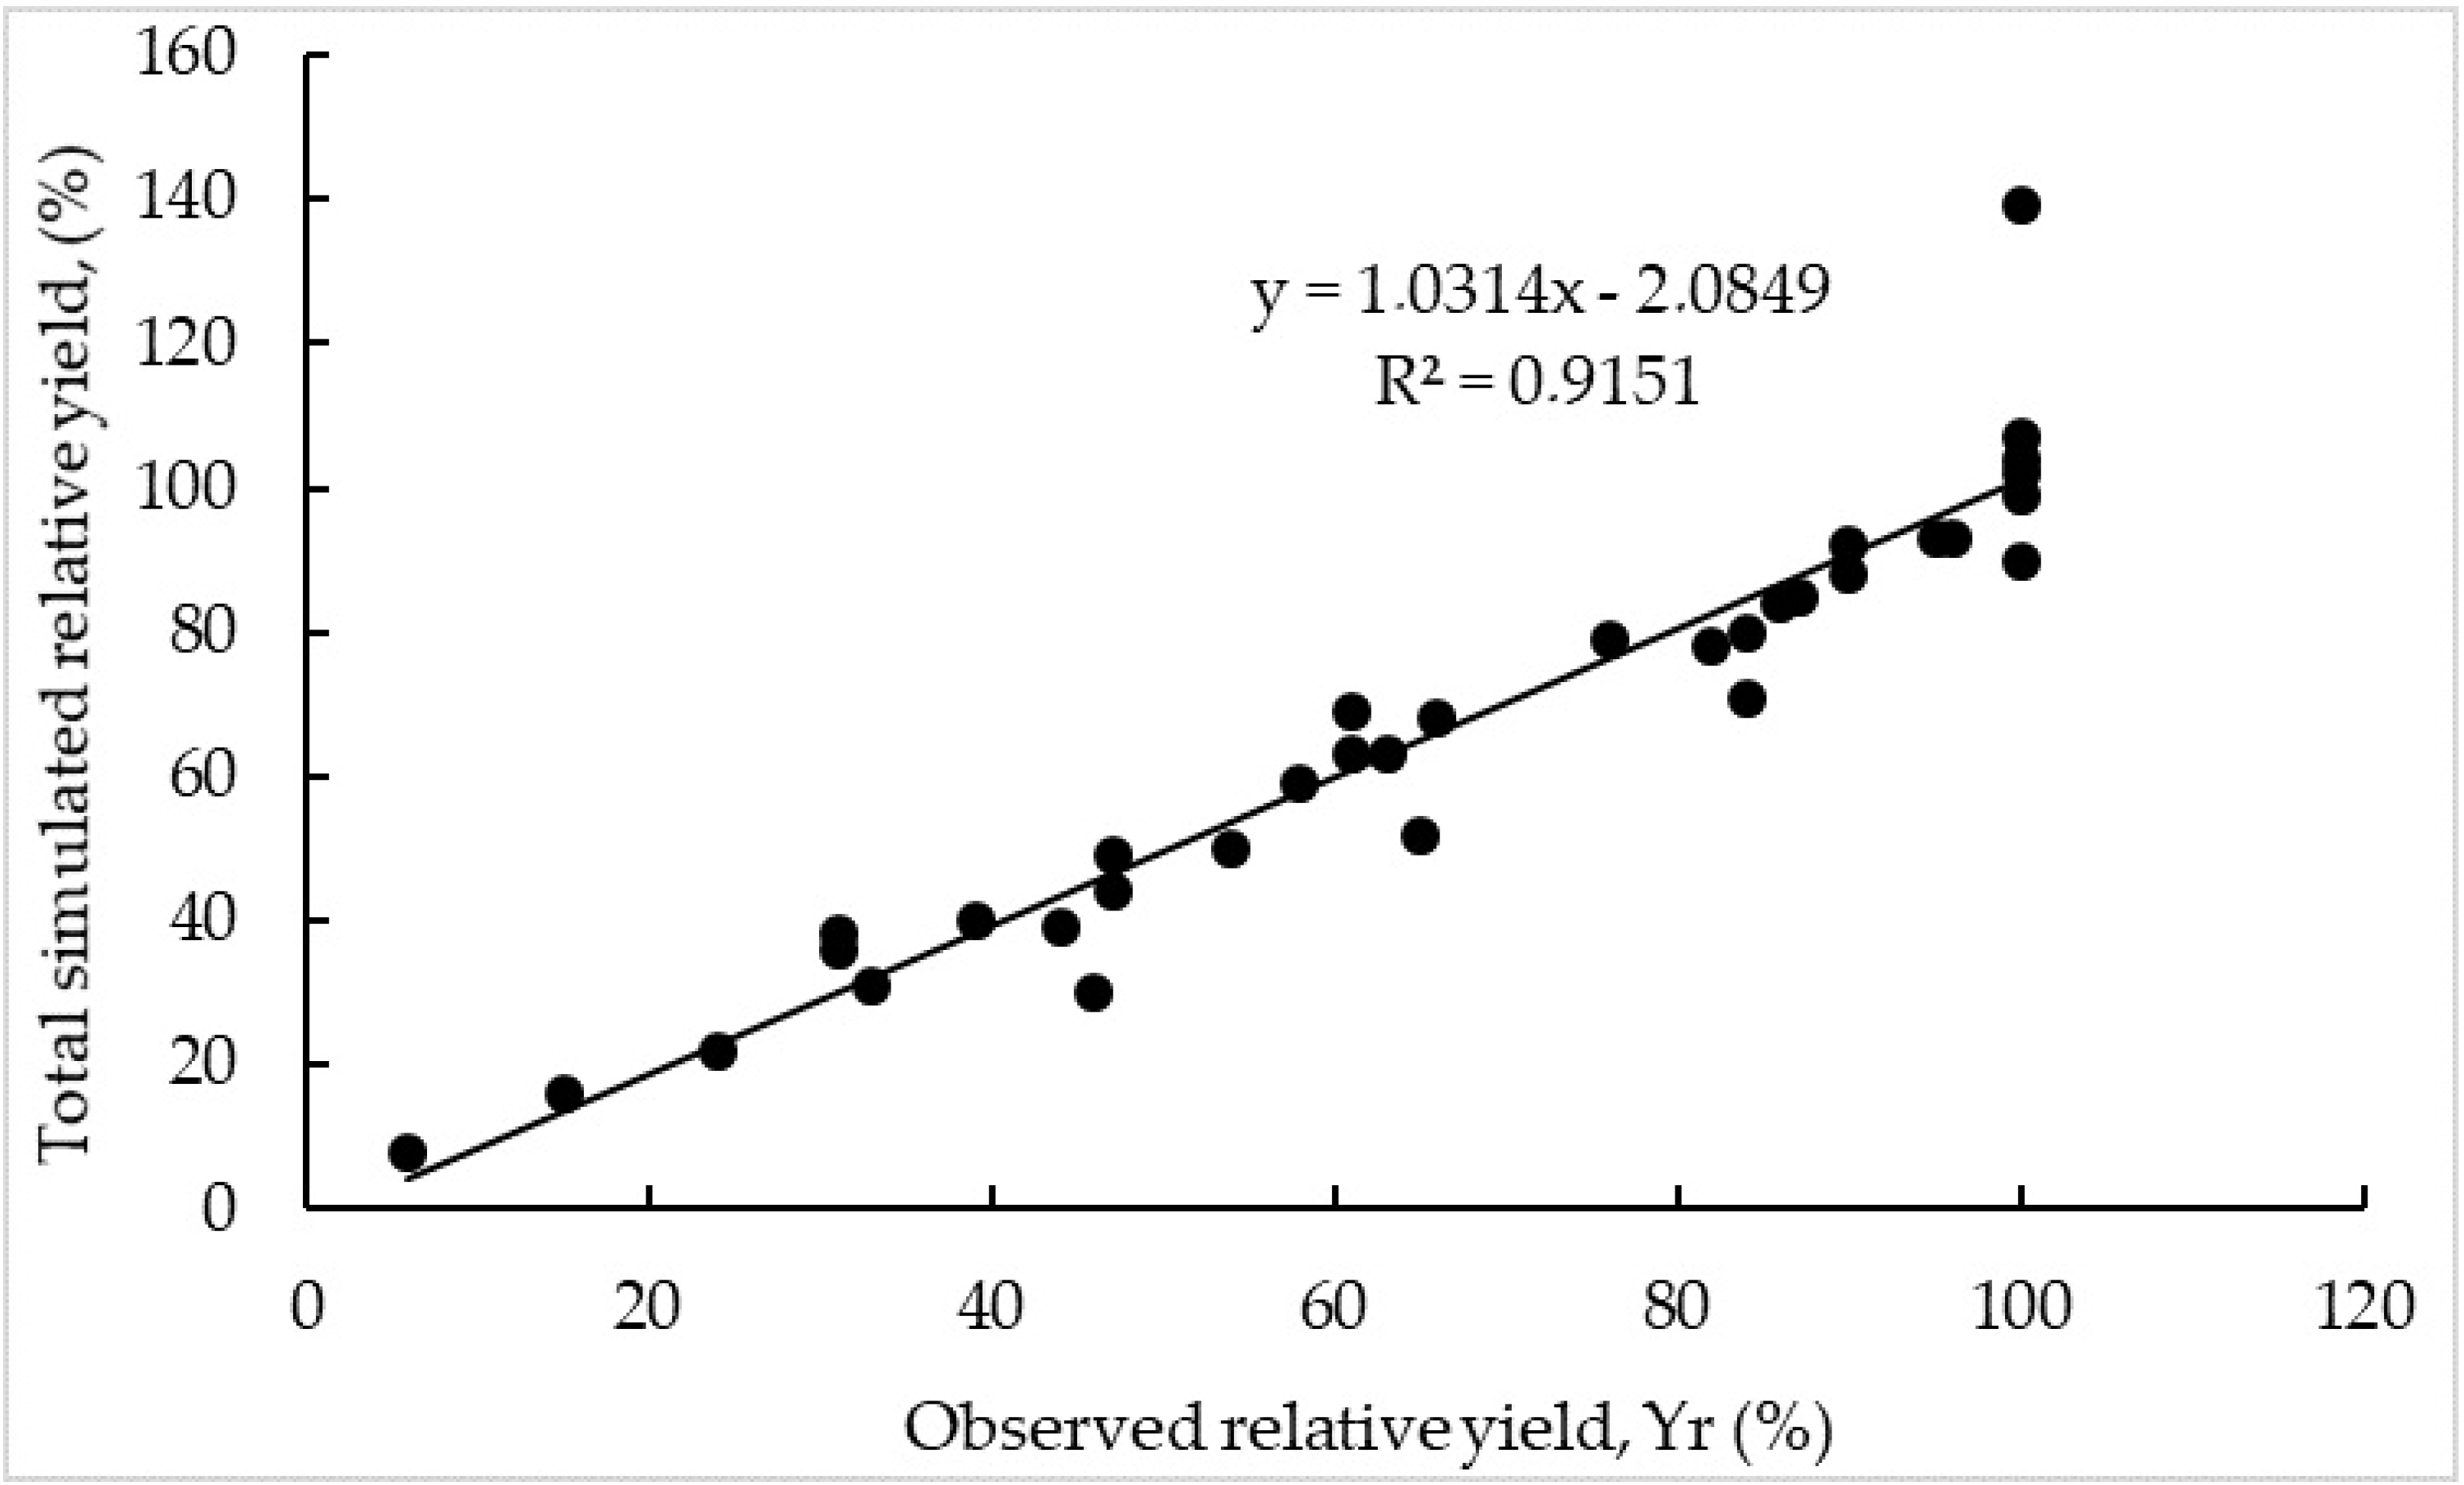
4. Results and Discussion

Table 4 and Table 5 show the function of the soil total water potential f(Ψt) and the data needed to its calculation, according to the Equations (22) and (24), respectively, to the experimental turfgrass fields and to the other irrigated crops fields. In Table 4, it is shown that the effect of soil water content variations on the function of the soil total water potential f(Ψt), for several turfgrass fields and sites under different salinity levels.
Table 5 shows the effect of both variations—soil water and salinity different levels—on the function of the soil total water potential f(Ψt), for several other irrigated crop fields and sites.
Yield response results to soil total potential (Ψt) show the general tendency of the relation between yield and soil water and salt concentration corresponds to well-known results published in other scientific papers: the lower the soil total potential (Ψt), the lower relative yield [65,66,67].
Table 6 shows the turfgrass yield response to wastewater, ground water and potable water application, for five trials (wastewater VLW-ECw = 2.1 dS m−1, groundwater VLG- 1.2 m−1, wastewater SGW-ECw = 2.4 dS m−1, UAW-ECw = 1.6 dS m−1 and wastewater SG-ECw = 2.4 dS m−1). For a low soil matric potential (Ψm close to −1500 kPa), water was the limiting factor, increasing the function of the soil total water potential f(Ψt) being relative yield Yr sharply reduced. Hence, it may be seen that grass yield was lower [higher f(Ψt)] on the wastewater treatments, especially the VLW near the dry level, and higher yield [lower f(Ψt)] was obtained on the UAP treatment due to the osmotic pressure values of the soil. For intermediate soil matric potential values (−33 kPa > Ψm > −240 kPa), wastewater application triggered slightly higher yields compared to potable water application, especially if Ψm was close to higher values (−10 kPa > Ψm > −33 kPa). This was due to the probably lower concentration of nutrients of the potable water when compared to the wastewater. On the other hand, Yr was enhanced with an increasing rate of soil water content and, therefore, with the decrease of f(Ψt), especially if Ψm is close to higher values (−10 kPa > Ψm > −33 kPa). This was due probably to the lower concentration of nutrients of the potable water when compared to the wastewater.
Table 7 shows several other irrigated crop yields (corn grain CgS, corn forage CfS, sunflower SfS, lettuce LD, cabbage CS and cabbage CD) response to water and salt application, underground water and potable (sprinkler S or drip D irrigation). The negative slope means that the relative yield (logarithmic Y axis) decreases with the enhance of the function of the soil total water potential f(Ψt), shown in decimal abscissa axis. Several major aspects may be seen: for the corn grain that, for very high content saline water (6.2 dS m−1) and a f(Ψt) = 3.32, there is still a relative yield at about 76%; this is due to the large amounts of irrigation water used and, therefore, the water used to increase the leaching of salts, being the yields slightly influenced by the salinity effects. For low water application, the effect of water in forage yield was more pronounced that the corn forage yields were more sensitive than the grain corn yield to the [(f(Ψt)] due the to the pronounced effects of water amounts in forage being yield lower than 70% when [(f(Ψt)] > 4. Sunflower was also very sensitive to the lack of water, decreasing sharply the yields (Yr < 15%) when [(f(Ψt)] > 8. The lettuce yields were highly influenced by the salinity effects under high salinity levels. Hence, from 2.5 dS m−1 to 3.9 dS m−1, the yield decreased up to 61% [(f(Ψt) = 0.95], and for more than 8.5 dS m−1 yield reached only less 40% [(f(Ψt) > 2.87]. This was due probably to the use of drip instead of sprinkler irrigation (the leaves were not wet by the saline water), and soil water content was around the field capacity. In relation to cabbage, on sprinkle irrigation system (low soil osmotic pressure) cabbage relative yield was decreasing monotonically with the increase of the f(Ψ0 %t); on drip irrigation system, with the increase of soil osmotic potential from dS m−1 0.9 up to 3, dS m−1 the relative yield Yr decreased near 40% [(f(Ψt) > 2.4].
Table 8 shows the regression analysis of the relationship between turfgrass relative yield Yr (%) and the function of the soil total water potential f(Ψt). It can be seen that the coefficient of determination (0.95 < R2 < 1.00) is very high for field conditions.
The sensitivity of the yield was higher on the wastewater treatments, namely VLW (sharper increase) due to the higher salinity level when compared to potable water treatment UAP, explained by soil leaching. On the other hand, the enhancement was lower for the UAP treatment (monotonic increase), due to its lower concentration of nutrients combined with soil leaching. It can be seen that the slope is very close to 1, the intercept is quite small, and the coefficient of determination R2 (0.95 < R2 < 1.00) is very high.
Table 9 shows the regression analysis of the relationship between the relative yield Yr (%) of several irrigated crops and a function of the soil total water potential f(Ψt).
It can be seen that the coefficient of determination R2 (0.89 < R2 < 0.96) is high for field conditions.
The results show that the soil moisture and soil salt concentration characteristics curves could be approximated by exponentials, for a soil matric potential (Ψm) higher than −10 kPa. The hypothesis is advanced according to which the yield Y = f (Ψt) curves (Equation (20)) may be represented by a straight line (Equation (22)) and, therefore, with a linear graphical representation in a suitable axis system.
Relationship between total simulated and observed relative yields is presented in Figure 5. The slope is very close to 1, the intercept is quite small and the coefficient of determination R2 (0.92) is very high for field conditions; however, its value is relatively lower than the R2 obtained by the logarithmic values of the relative yield (Table 8 and Table 9), once natural values are used instead of logarithmical values.
It shows that the regression is highly significant, and, therefore, the predicting ability of this approach is very good and capable of describing the relative yield response to the function soil total water potential f(Ψt).
Given the importance of this approach, more data that are experimental should be obtained to increase the number of model simulations. Hence, in the future, it is advisable to do additional research in order to obtain more modelling results, being higher than the validation of this approach.
Recurring to decimal logarithms, from analytical exponential expressions, a linear simple relationship of soil total water potential Ψt (matric Ψm + potential Ψo) function and crop relative yield was studied and developed, according to Equations (22)–(24). The process is displayed by a flowchart that is given below (Figure 6).

5. Conclusions

This work showed that a simple empirical tool described the crop response to the soil total water potential Ψt (matric Ψm + osmotic Ψo) due to the low number of the involved parameters and a rapid and accurate determination. Moreover, it is possible, with only two experimental points, to define the above relationship for soil matric potential Ψm values lower than −20 kPa. On the other hand, the establishment of conventional soil water retention functions is a slow process, demanding a high number of laboratory determinations due to a higher number of experimental points; also, they are generally presented by curves not as attractive as the straight lines obtained by this simple approach. The results showed a high agreement between the experimental and the predicted values (R2 = 0.92). Moreover, the precision of this tool applied to grass fields and other different irrigated fields, under different soil types and climatic conditions, can contribute to its generalization. There are multiple numbers of applications of this empirical tool, mainly related to salinity and water stress, involving the planning and management of irrigation (water quality, amounts and frequency) and desalination projects, soil leaching, fertilization enhance and the use of clean desalination techniques (decrease of irrigation amounts and use of drought tolerant and salt removing species).

Author Contributions

Conceptualization, J.B. and J.B.A.; methodology, J.B. and J.B.A.; formal analysis, G.B.; investigation, M.C.; data curation, G.B.; writing—original draft preparation, J.B. and J.B.A.; writing—review and editing, G.B.; supervision, T.P.; funding acquisition, T.P. All authors have read and agreed to the published version of the manuscript.

Funding

This research was funded by the Fundação para a Ciência e Tecnologia, grant number PTDC/GES-URB/31928/2017.

Institutional Review Board Statement

Not applicable because the study did not involve humans.

Informed Consent Statement

Not applicable because the study did not involve humans.

Data Availability Statement

Data will be available upon request.

Conflicts of Interest

The authors declare no conflict of interest.

References

  1. Beltrão, J.; Ben Asher, J.; Magnusson, D. Sweet corn response to combined effects of saline water and nitrogen fertilization. Acta Hortic. 1993, 335, 53–58. [Google Scholar] [CrossRef]
  2. Gomes, M.P.; Silva, A.A. A curva teórica do pF e a sua importância na economia da água do solo. Garcia Horta 1960, 8, 231–241, (In Portuguese, with an English summary). [Google Scholar]
  3. Beltrao, J. Le contrôle des doses d’irrigation par le tensiomètre Hommes. Terre Eaux 1982, 12, 103–110. (In French) [Google Scholar]
  4. Minhas, P.S.; Tiago, B.R.; Ben-Galc, A.; Pereira, L.S. Coping with salinity in irrigated agriculture: Crop evapotranspiration and water management issues. Agric. Water Manag. 2020, 227, 105832. [Google Scholar] [CrossRef]
  5. Allen, R.G.; Pereira, L.S.; Raes, D.; Smith, M. Crop Evapotranspiration: Guidelines for Computing Crop Water Requirements. FAO Irrigation and Drainage Paper; FAO (Food and Agriculture Organization): Rome, Italy, 1998; Paper 56. [Google Scholar]
  6. Lamsal, K.; Paudyal, G.N.; Saeed, M. Model for assessing impact of salinity on soil water availability and crop yield. Agric. Water Manag. 1999, 41, 57–70. [Google Scholar] [CrossRef]
  7. Pourmonammadali, B.; Hosseinfard, S.J.; Salehi, H.; Shirani, H.; Estandiarpour-Boroujani, I. Effect of soil properties, water quality and management practices on pistáchio yield in Rasfsanjan region, Southeast Iran. Agric. Water Manag. 2019, 213, 894–902. [Google Scholar] [CrossRef]
  8. Ors, S.; Suarez, D.L. Spinach biomass yield and physiological response to interactive salinity and water stress. Agric. Water Manag. 2017, 190, 31–41. [Google Scholar] [CrossRef]
  9. Rallo, G.; Amel, M.B.; Latrech, B. Effects of saline and deficit irrigation on soil-plant water status and potato crop yield under the semiarid climate of Tunisia. Sustainability 2019, 11, 2706. [Google Scholar]
  10. Machado, R.M.A.; Serralheiro, R.P. Soil salinity: Effect on vegetable crop growth. Management practices to prevent and mitigate soil salinization. Horticulturae 2017, 3, 30. [Google Scholar] [CrossRef]
  11. Bresler, E.; Hoffman, G.J. Irrigation management for soil salinity control: Theories and tests. Soil Sci. Soc. Am. J. 1986, 50, 1552–1560. [Google Scholar] [CrossRef]
  12. Pan, T.; Hou, S.; Liu, Y.; Tan, Q. Comparison of three models fitting the soil water retention curves in a degraded alpine meadow region. Sci. Rep. 2019, 9, 18407. [Google Scholar] [CrossRef] [PubMed]
  13. Ket, P.; Oeurng, C.; Degré, A. Estimating soil water retention curve by inverse modelling from combination of in situ dynamic soil water content and soil potential data. Soil Syst. 2018, 2, 55. [Google Scholar] [CrossRef] [Green Version]
  14. Bitelli, M. Measuring soil water potential for water management in agriculture: A review. Sustainability 2010, 2, 1226–1251. [Google Scholar] [CrossRef] [Green Version]
  15. D’Emilio, A.; Aiello, R.; Consoli, S.; Vanella, D.; Iovino, M.O. Artificial neural networks for predicting the water retention curve of sicilian agricultural soils. Water 2018, 10, 1431. [Google Scholar] [CrossRef] [Green Version]
  16. Chen, Y. Soil-water retention curves derived as a function of soil dry density. GeoHazards 2020, 1, 2. [Google Scholar] [CrossRef] [Green Version]
  17. Capparelli, G.; Spolverino, G. An empirical approach for modeling hysteresis behavior of pyroclastic soils. Hydrology 2020, 7, 14. [Google Scholar] [CrossRef] [Green Version]
  18. Ben-Gal1, A.; Karlberg, L.; Jansson, P.; Uri Shani, U. Temporal robustness of linear relationships between production and transpiration. Plant Soil 2003, 251, 211–218. [Google Scholar] [CrossRef]
  19. Khataar, M.; Mohammadi, M.; Shabani, F. Soil salinity and matric potential interaction on water use, water use efficiency and yield response factor of bean and wheat. Sci. Rep. 2018, 8, 2679. [Google Scholar] [CrossRef]
  20. Duarte, H.; Souza, E. Soil water potentials and Capsicum annuum L. under salinity. Rev. Bras. Ciênc. Solo 2016, 40, e0150220. [Google Scholar]
  21. Ben Asher, J. Combined processes of ions and water uptake: A mathematical model and its implications. Isr. Agrisearch 1988, 335, 53–56. [Google Scholar]
  22. Beltrão, J.; Ben Asher, J. The effect of salinity on corn yield using CERES-Maize model. Irrig. Drain. Syst. 1997, 11, 15–28. [Google Scholar] [CrossRef]
  23. Beltrão, J.; Brito, J.; Neves, M.A.; Seita, J. Salt removal potential of turfgrasses in golf courses in the Mediterranean basin. WSEAS Trans. Environ. Dev. 2009, 5, 394–403. [Google Scholar]
  24. Maas, E.V. Crop tolerance to saline sprinkling water. Plant Soil 1985, 89, 273–284. [Google Scholar] [CrossRef]
  25. Beltrão, J.; Trindade, D.; Correia, P.J. Lettuce yield response to salinity of irrigation water. Acta Hortic. 1997, 449, 623–628. [Google Scholar] [CrossRef] [Green Version]
  26. Van Genuchten, M.T.; Hoffman, G.C. Analysis of salt tolerance data. In Soil Salinity Under Irrigation—Process and Management. Ecological Studies; Shainberg, I., Shalhevet, J., Eds.; Springer: New York, NY, USA, 1984; pp. 258–271. [Google Scholar]
  27. Van Genuchten, M.T.; Gupta, S.K. A reassessment of the crop tolerance response function. J. Indian Soc. Soil Sci. 1993, 41, 730–737. [Google Scholar]
  28. Ben Asher, J.; Beltrão, J.; Aksoy, U.; Anaç, D.; Anaç, S. Modeling the effect of salt removing species in crop rotation. Int. J. Energy Environ. 2012, 3, 350–359. [Google Scholar]
  29. Van Dam, J.C.; Huygen, J.; Wesselimg, J.G.; Feddes, R.A.; Kabat, P.; Van Walsum, P.E.V.; Groenendijk, P.; Van Diepen, C.A. Theory of SWAP Version 2.0 Simulation of Water Flow, Solute Transport, and Plant Growth in the Soil Water Atmosphere Plant Environment; Report 71 Department of Water Resources Wageningen Agricultural University: Wageningen, The Netherlands; DLO Winand Staring Centre: Wageningen, The Netherlands, 1997; p. 167. [Google Scholar]
  30. Ben Asher, J.; Beltrao, J.; Aksoy, U.; Anaç, D.; Anaç, S. Controlling and simulating the use of salt removing species. Int. J. Energy Environ. 2012, 3, 360–369. [Google Scholar]
  31. Yan, C.; Feng, S.; Huo, Z.; Ji, Q. Simulation of saline water irrigation for seed maize in arid China based on SWAP model. Sustainability 2019, 11, 4264. [Google Scholar] [CrossRef] [Green Version]
  32. Zan, Y.; Man, X.; Shukla, M.K.; Li, S. Modeling soil water-heat dynamic changes in seed-maize fields under film mulching and deficit irrigation conditions. Water 2020, 12, 1330. [Google Scholar]
  33. Simunek, J.; van Genuchten, M.T.; Sejna, M. The HYDRUS-1D Software Package for Simulating the One-Dimensional Movement of Water, Heat, and Multiple Solutes in Variably-Saturated Media Version 4; CSIRO: Canberra, Australia, 2007. [Google Scholar]
  34. Ragab, R.; Battilani, A.; Matovic, G.; Chartzoulakis, K. SALTMED model as an integrated management tool for water, crop, soil and N-fertilizer water management strategies and productivity: Field and simulation study. Irrig. Drain. 2015, 64, 1–12. [Google Scholar] [CrossRef] [Green Version]
  35. Zheng, W.; Shen, C.; Wang, L.P.; Jin, Y. An empirical soil water retention model based on probability laws for pore-size distribution. Vadose Zine J. 2020, 19, e20065. [Google Scholar]
  36. SSSA. Glossary of Soil Science Terms; Soil Science Society of America: Madison, WI, USA, 1979; p. 37. [Google Scholar]
  37. Or, D.; Tuller, M. Cavitation during desaturation of porous media under tension. Water Resour. Res. 2002, 38, 19. [Google Scholar] [CrossRef]
  38. Gomes, M.P. Characteristic soil water retention curves approach by exponentials and by the irrigation point. Pedon 1986, 6, 93–99, (In Portuguese, with an English summary). [Google Scholar]
  39. Veihmeyer, F.J.; Hendrickson, A.H. The relation of soil moisture to cultivation and plant growth. Proc. Intern. Congr. Soil Sci. 1931, 3, 498–513. [Google Scholar]
  40. Richards, L.A.; Weaver, L.R. Moisture retention by some irrigated soils as related to soil moisture tension. J. Agric. Res. 1944, 69, 215–235. [Google Scholar]
  41. Colman, E.A. A laboratory procedure for determining the field capacity of soils. Soil Sci. 1947, 63, 277–283. [Google Scholar] [CrossRef]
  42. Nachabe, M.H. Refining the definition of field capacity in the literature. J. Irrig. Drain. Eng. 1998, 124, 230–232. [Google Scholar] [CrossRef]
  43. Kirkham, M.B. Principles of Soil and Plant Water Relations; Elsevier: Amsterdam, The Netherlands; Academic Press: San Diego, CA, USA, 2005; p. 500. [Google Scholar]
  44. Ramos, T.B.; Horta, A.; Gonçalves, M.C.; Martins, J.C.; Pereira, L.S. Development of ternary diagrams for estimating water retention properties using geostatistical approaches. Geoderma 2014, 230–231, 229–242. [Google Scholar] [CrossRef]
  45. Slayter, R.O. Plant Water Relationships; Academic Press: New York, NY, USA, 1967. [Google Scholar]
  46. Childs, S.W.; Hanks, R.J. Model of salinity effects on crop growth. Soil Sci. Soc. Am. J. 1975, 39, 617–622. [Google Scholar] [CrossRef]
  47. Letey, J.; Dinar, A.; Knapp, K.C. Crop-water production function model for saline irrigation waters. Soil Sci. Soc. Am. J. 1985, 49, 1005–1009. [Google Scholar] [CrossRef]
  48. Hanks, R.J.; Hill, R.W. Modeling Crop Response to Irrigation, in Relation to Soils, Climate and Salinity; IIIC Volcany Center: Bet Dagan, Israel, 1980. [Google Scholar]
  49. Beltrão, J.; Silva, A.A.; Ben Asher, J. Modeling the effect of capillary water rise in corn yield in Portugal. Irrig. Drain. Syst. 1996, 10, 179–189. [Google Scholar] [CrossRef]
  50. Tapias, J.C.; Salgot, M. The influence of peat content 0n water retention in the substrata of some golf course greens: Determination from mathematical models. Agrochimica 2003, 47, 28–39. [Google Scholar]
  51. de Wit, C.T. Transpiration and Crop Yields. Agricultural Research Reports 64.6; PUDOC: Wageningen, The Netherlands, 1958; p. 88. [Google Scholar]
  52. Bresler, E. Application of a conceptual model to irrigation water requirement and salt tolerance of crops. Soil Sci. Soc. Am. J. 1987, 51, 788–793. [Google Scholar] [CrossRef]
  53. Hanks, R.J. Model for predicting plant yield as influenced by water use. Agron. J. 1974, 66, 660–665. [Google Scholar] [CrossRef]
  54. Shani, U.; Dudley, L.M. Field studies of crop response to drought and salt stress. Soil Sci. Soc. Am. J. 2001, 65, 1522–1528. [Google Scholar] [CrossRef]
  55. Hanks, R.J.; Nimah, M.N. Integrating plant and water status measurements. Irrig. Sci. 1988, 9, 319–332. [Google Scholar] [CrossRef]
  56. Beltrão, J.; Correia, P.J.; Costa, M.S.; Gamito, P.; Santos, R.; Seita, J. The influence of nutrients on turfgrass response to treated wastewater application, under several saline conditions and irrigation regimes. Environ. Process. 2014, 1, 105–113. [Google Scholar] [CrossRef] [Green Version]
  57. Beltrão, J. Irrigation experimental designs. Options Mediterr. 1999, 44, 209–227. [Google Scholar]
  58. Costa, M.; Beltrao, J.; Dionisio, L.P.; Guerrero, C.; Brito, J.; Matos, L.; Rebelo, L.; Gamito, P. Response of fairway grasses of golf courses to potable water irrigation compared to wastewater application. Acta Hortic. 2002, 573, 357–362. [Google Scholar] [CrossRef]
  59. Magnusson, D.A.; Ben Asher, J.; de Malach, Y.A. continuous two variable design using the line source concept. Agron. J. 1988, 80, 132–133. [Google Scholar] [CrossRef]
  60. Or, D.; Hanks, R.J. A single point source for the measurement of irrigation production functions. Irrig. Sci. 1992, 13, 55–64. [Google Scholar] [CrossRef]
  61. Khaydarova, V.; Beltrão, J. Response of lettuce yield to the combined effects of salts, nitrogen and water. Trans. Environ. Dev. 2006, 2, 512–518. [Google Scholar]
  62. Christiansen, J. Irrigation by Sprinkling; Bulletin 670; University of California: Berkeley, CA, USA, 1942. [Google Scholar]
  63. Mahmoudi-Eshkaftaki, M.; Rafiee, M. Optimization of irrigation management. A multi-objective approach based on crop yield, growth, evapotranspiration, water use efficiency and soil salinity. J. Clean. Prod. 2020, 252, 119901. [Google Scholar] [CrossRef]
  64. Beltrão, J.; Jesus, S.B.; Sousa, P.B.; Carvalho, I.; Trindade, D.; Rodrigues, M.H.; Machado, A. Efficiency of triple emitter source (TES) for irrigation experiments of horticultural crops, Turkey. Acta Hortic. 2002, 573, 183–188. [Google Scholar] [CrossRef] [Green Version]
  65. Costa, M.; Beltrão, J.; Brito, J.M.; Guerrero, C. Turfgrass plant quality response to different water regimes. WSEAS Trans. Environ. Dev. 2011, 7, 167–176. [Google Scholar]
  66. Beltrão, J.; Jesus, S.B.; Trindade, D.; Miguel, M.G.; Neves, M.A.; Panagopoulus, T.; Ben Asher, J. Combined effects of salts and nitrogen on the yield function of Lettuce. Acta Hortic. 2002, 573, 363–368. [Google Scholar] [CrossRef]
  67. Panagopoulos, T.; Jesus, J.; Antunes, M.D.C.; Beltrão, J. Analysis of spatial interpolation for optimising management of a salinized field cultivated with lettuce. Eur. J. Agron. 2006, 24, 1–10. [Google Scholar] [CrossRef]
Figure 1. Schematic representation of the randomized blocks experiments. The plots marked by W1 to W3 denote three sprinkler irrigation levels. Each plot marked by W is divided at random into four subplots of salt treatments (N1, N2, N3, N4). Number of replications are four.
Agronomy 11 01916 g001
Figure 2. Experimental plot layout of the double line source irrigation system designed to produce saline gradients (o—sprinkler; S—saline water (ECw = 12 dS m−1); nS—fresh water (ECw = 1 dS m−1).
Agronomy 11 01916 g002
Figure 3. Point source experimental design was applied in the Salgados golf course. Irrigation gradient was expressed by the daily net irrigation rates (I, mm d−1) and the distance from the sprinkler in meters. The irrigation circle was divided into salt treatment sectors.
Agronomy 11 01916 g003
Figure 4. Layout of the double emitter source DES. The emitters on the two-coupled lines have different discharges, but their cumulative discharge at each trickling point was constant along the lateral (10 L h−1 for each trickling point). However, the varying discharges of the emitters provoked varying salt concentrations of each trickling point along the lateral, and the darkness represents increasing salinity.
Agronomy 11 01916 g004
Figure 5. Relationship between total simulated and observed relative yield values (%) for all crops.
Agronomy 11 01916 g005
Figure 6. Flowchart describing independent validation of Equations (1) and (2) by processing data collected from experiments on golf courses.
Agronomy 11 01916 g006
Table 1. Turfgrass fields—symbols cultivars and irrigation water source.
Turfgrass FieldSymbolTurfgrassWater Source
Salgados golf courseSGWCynodon dactylon [L.] Perswastewater
Vale de Lobo golf courseVLWFestuca rubra, L.; Lolium perene, L.; Poa pratensis, L.wastewater
Vale de Lobo golfVLGground water
University of AlgarveUAWCynodon dactylon [L.] Pers Paspalum dilatatum, PoiretWastewater
University of AlgarveUAPPotable water
Table 2. Soil properties of the turfgrass fields.
Turfgrass FieldTurfgrass FieldTexturepH (H2O)Depth (m)ϴfc m3 m−3ϴwp m3 m−3ECw dS m−1
Salgados golf courseSGWSandy soil8.50.300.090.021.5
Vale de Lobo golf courseVLWLoamy sand soil7.20.300.160.072.1
VLG7.30.300.160.071.2
University of AlgarveUAWClay soil7.20.300.430.302.2
UAP0.30.300.430.300.3
Table 3. Other irrigated crops—irrigation method and soil properties.
Crop NameCrop SymbolIrrigation MethodSoil TextureSoil pH (H2O)Soil Depth (m)ϴfc m3 m−3ϴwp m3 m−3
Corn grainCgSSprinklesilty clay loam7.60.00–0.300.260.11
Corn forageCfSSprinkleclay loam8.00.00–0.300.310.17
SunflowerSfSSprinkleclay loam7.00.00–0.300.270.16
LettuceLDDriploamy sand6.30.0–0.200.050.03
CabbageCaSSprinkleloamy sand6.30.00–0.200.120.05
CabbageCaDDriploamy sand6.30.00–0.200.120.05
Table 4. Turfgrass fields—function soil total water potential f(Ψt) and data needed to its calculation, according to the above theory.
Turfgrass Fieldsϴv m3 m−3ECw
dS m−1
|Ψm| kPa|Ψo| kPa|Ψt| kPaLog (10|Ψt|)[log (10 |Ψt|)]2[log (10|ΨtYrM|)]2f(Ψt)
Salgados golf course
SGW
0.122.41086962.988.888.880.00
0.092.433861193.089.498.880.61
0.062.4100861863.2710.698.881.81
0.042.4240863263.5112.328.883.44
0.022.415008615864.2017.648.888.76
Vale de Lobo golf course
VLW
0.192.11076862.938.588.580.00
0.162.133761093.049.248.580.66
0.132.1100761763.2510.528.581.94
0.112.1240763163.5012.258.583.67
0.072.115007615764.2017.648.589.06
Vale de Lobo golf course
VLG
0.191.2.1043532.727.407.400.00
0.161.23343762.888.297.400.89
0.131.2100431433.169.997.402.59
0.111.2240432833.4511.907.404.53
0.071.215004315434.1917.567.4010.16
University of Algarve UAW0.451.61058682.838.018.010.00
0.431.63358912.968.768.010.75
0.371.6100581583.2010.248.012.23
0.291.6240582983.4712.048.014.03
0.301.615005815584.1917.568.019.55
University of Algarve UAP0.450.31011212.325.385.380.00
0.430.33311442.646.975.380.59
0.370.3100111113.059.305.383.92
0.290.3240112513.4011.565.386.18
0.300.315001115114.1817.475.3812.09
Table 5. Other irrigated crops—function soil total water potential f(Ψt) and data needed for its calculation, according to the above theory.
Irrigated Cropϴv m3 m−3ECw
dS m−1
Ψm kPaΨo kPaΨt kPaLog (10|Ψt|)[log (10 |Ψt|)]2[log (10|ΨtYrM|)]2f(Ψt)
Corn grain CgS0.231.13340732.868.188.180.00
0.232.033721053.029.128.180.94
0.233.7331331663.2210.378.182.19
0.235.3331912243.3511.228.183.04
0.236.2332232533.4011.568.183.38
Corn forage CfS0.290.57918972.998.948.940.00
0.270.5126181443.169.998.941.05
0.260.5158181763.2510.568.941.62
0.240.5251182693.4311.768.942.82
0.230.5398184163.6213.108.944.16
0.220.5501185193.7213.848.944.90
Sunflower SfS0.270.63322552.747.517.510.00
0.240.689221113.059.307.511.79
0.220.6182222043.3110.967.513.45
0.200.6363223853.5912.867.515.35
0.180.6741227633.8815.077.517.56
0.160.615862216074.2117.697.5110.18
Lettuce LD0.052.533891223.099.539.530.00
0.053.9331401733.2410.489.530.95
0.056.2332232563.4111.629.532.09
0.058.3332993323.5212.409.532.87
0.0511.3334074403.6413.279.533.74
Cabbage CaS0.115.5791982773.4411.8511.850.00
0.1075.51001982983.4712.0711.850.27
0.0955.51581983563.5512.6111.850.76
0.095.52001983983.6012.9611.851.11
0.085.53161985143.7113.7711.851.92
0..075.55011986993.8414.7811.852.93
Cabbage CaD0.050.893332652.817.917.910.00
0.053.64331311643.2110.347.912.43
0.055.76332072403.3811.437.913.52
0.057.60332743103.4912.197.914.28
0.059.64333473803.5812.817.914.90
0.0510.98333954283.6313.197.915.28
Table 6. Turfgrass relative yield Yr (%) response to the function of the soil total water potential f(Ψt).
Turfgrass Fieldf(Ψt)Yr (%) Obs.Log Yr (%) Obs.logYr (%) Calcul.Yr (%) Calcul.
Salgados golf course
SGW
0.001002.002.024105.682
0.61961.981.97794.842
1.81781.891.89578.524
3.44611.791.76057.544
8.76221.341.35322.542
Vale de Lobo golf course
VLW
0.001002.001.96892.897
0.66831.921.90079.430
1.94541.731.76658.345
3.67301.481.58638.548
9.06121.081.02610.617
Vale de Lobo golf course
VLG
0.001002.001.94588.105
0.89761.891.88676.913
2.59541.731.77359.293
4.53401.601.64544.157
10.2201.301.26918.578
University of Algarve UAW0.001002.001.94187.297
0.75811.911.90680.538
2.23581.761.83868.865
4.03561.751.75556.885
9.55321.511.50031.623
University of Algarve UAP0.001002.001.97895.060
0.59871.941.95990.991
3.92731.861.85271.121
6.18571.761.78060.256
12.1401.601.59138.994
Table 7. Irrigated crops relative yield Yr (%) response to the function of the soil total water potential f(Ψt).
Irrigated CropF(Ψt)Yr (%) Obs.Log Yr (%) Obs.logYr (%) Calcul.Yr (%) Calcul.
Corn grain CgS0.001002.001.993498.60
0.94901.951.966192.49
2.19871.941.929985.11
3.04841.921.905280.35
3.38761.881.895478.52
Corn forage CfS0.001002.002.0161103.75
1.05951.981.970293.37
1.62901.951.945288.10
2.82821.911.892778.29
4.16661.821.834168.23
4.90631.801.801763.39
Sunflower SfS0.001002.002.1442139.31
1.79861.931.922783.890
3.45651.811.717352.12
5.35461.661.482330.34
7.56151.181.208816.18
10.1860.780.88467.68
Lettuce LD0.001002.001.953690.07
0.95611.791.835768.55
2.09471.671.694149.43
2.87391.591.597339.54
3.74331.521.489330.83
Cabbage CS0.001002.002.0294107.00
0.27961.981.965892.64
0.76841.921.850470.80
1.11581.761.768058.61
1.92311.491.577237.76
2.93241.381.339221.83
Cabbage CD0.001002.002.0080101.86
2.43611.791.802363.39
3.52541.731.701050.23
4.28471.671.645644.26
4.90441.641.593139.17
5.28311.491.561036.39
Table 8. Regression analysis of the relationship between turfgrass relative yield Yr (%) and a function of the soil total water potential f(Ψt).
Turfgrass FieldRegression EquationR2
Salgados SGWlog Yr = log 105.68 − 0.077 f(Ψt)0.994
Vale de Lobo VLWlog Yr = log 92.90 − 0.104 f(Ψt)0.972
Vale de Lobo VLGlog Yr = log 88.11 − 0.066 f(Ψt)0.974
Un. Algarve UAWlog Yr = log 87.30 − 0.046 f(Ψt)0.953
Un. Algarve UAPlog Yr = log 95.06 − 0.032 f(Ψt)0.986
Table 9. Regression analysis of the relationship between the relative yield Yr (%) of several irrigated crops and the function of the soil total water potential f(Ψt).
CropRegression EquationR2
Corn grain CgSlog Yr = log 98.60 − 0.02090 f(Ψt)0.888
Corn forage CfSlog Yr = log 103.75 − 0.04376 f(Ψt)0.925
Sunflower SfSlog Yr = log 139.31 − 0.124 f(Ψt)0.937
Lettuce LDlog Yr = log 90.07 − 0.1244 f(Ψt)0.959
Cabbage CSlog Yr = log 107.00 − 0.0236 f(Ψt)0.959
Cabbage CDlog Yr = log 101.86 − 0.08468 f(Ψt)0.942
Publisher’s Note: MDPI stays neutral with regard to jurisdictional claims in published maps and institutional affiliations.

