Article

Development and Characterization of Synthetic Hexaploid Wheat for Improving the Resistance of Common Wheat to Leaf Rust and Heat Stress

1
Department of Plant Biotechnology, College of Life Sciences and Biotechnology, Korea University, Anam-dong 5-ga, Seongbuk-gu, Seoul 02841, Korea
2
Institute of Life Science and Natural Resources, Korea University, Seoul 02841, Korea
3
Global Wheat Program, International Maize and Wheat Improvement Center, Carretera México-Veracruz Km. 45, El Batán, Texcoco C.P. 56237, Mexico
4
Department of Molecular Biotechnology, College of Agriculture and Life Sciences, Bioenergy Research Center, Chonnam National University, Gwangju 61186, Korea
*
Authors to whom correspondence should be addressed.
Agronomy 2021, 11(1), 18; https://doi.org/10.3390/agronomy11010018
Submission received: 9 November 2020 / Revised: 9 December 2020 / Accepted: 21 December 2020 / Published: 24 December 2020

Abstract

:
Synthetic hexaploid wheat (SHW) is a valuable resource for breeding because it possesses more desirable traits, such as better yield and abiotic and biotic stress tolerance than common wheat. In this study, our group developed a SHW line, named ‘SynDT’, which has markedly better characteristics than Korean bread wheat ‘Keumkang’. The SynDT line is thermotolerant as it rapidly expresses heat shock proteins under heat stress. In addition, this line exhibits resistance to leaf rust by inducing the expression of antifungal enzymes, mainly chitinase, along with the rapid and high expression of pathogen-related genes. Moreover, it possesses the favorable traits of its parent wheat lines Triticum durum #24 and Aegilops tauschii #52. Therefore, the SynDT wheat line can be used as a breeding material for improving local common wheat cultivars.

1. Introduction

Hexaploid common wheat or bread wheat (Triticum aestivum L.; hexaploid genome = AABBDD) is a crucial cereal crop worldwide. A third of the global population depends on this crop, and the rise in global population has led to an increased demand for bread wheat. However, sustainable wheat production is threatened as wheat productivity has not improved significantly over time [1]. This challenge can be explained by the narrow genetic diversity of bread wheat, which is the result of a bottleneck event during its evolution, as only a few accessions of the donor species were involved in its origin and evolution [2]. Synthetic hexaploid wheat (SHW) has been artificially developed to address this issue. To mimic the natural hybridization of bread wheat, tetraploid Triticum turgidum L. wheat (2n = 4x = 28, AABB) and diploid Aegilops tauschii Coss. (2n = 2x = 14, DD) were selectively crossed to pass the elite genes of desirable traits to their progenies [2]. Consequently, SHW is a valuable source of genetic variability, with favorable traits, such as improved yield and abiotic and biotic stress tolerance, which are the primary targets of modern breeding strategies [3]. A previous study on genetic diversity in SHW has reported that this breed has higher levels of diverse amplified fragment length polymorphisms (39%) than common bread wheat (12–21%) [4]. To date, China is one of the successful countries to have managed to completely utilize SHW as a genetic resource. The well-known representative SHW line, “Chuanmai 42”, has a high average yield, and its synthetic derivative lines (SDLs) are commonly used in wheat breeding [5].
Leaf rust (LR) is a common disease in wheat caused by the fungi Puccinia triticina [6]. The fungi usually attack the leaf blades and cause a decrease in kernel weights and numbers per head. LR disease in the early stage of growth results in 30% yield loss [7]. SHW is a genetically variable source of LR resistance. “Syn137” (68.111/RGB-U//Ward/3/A. tauschii [WX629]) is resistant to LR at the seedling stage owing to the presence of a dominant LR resistance gene on chromosome 5D [8]. Moreover, “Synthetic 45” is resistant to 20 pathotypes of LR at the seedling stage. Genetic mapping has shown that the resistant gene, LrSyn45, is located on chromosome 1D [9]. A novel LR-resistant gene, Lr32, has also been identified in synthetic wheat [5]. Therefore, developing LR-resistant SHW is one of the main strategies for crop improvement.
Climate change has caused an increase in global temperature, adversely affecting plant growth. In plants, heat stress (HS) is known to cause irreversible damage when the temperature exceeds threshold levels [10]. HS negatively affects all stages of plant development [11]. Additionally, wheat is sensitive to HS. It is estimated that an increase in temperature of 1 °C causes a 6% reduction in wheat production [12]. Thus, developing SHW resistant to HS is essential. Advanced wheat lines derived from SHW have shown 13% higher yield under HS conditions than their parent lines [13]. Multiple synthetic derivatives have also shown high tolerance to HS [14].
Despite the outstanding tolerance of SHW to environmental stresses, it still processes undesirable agronomic traits, making it unsuitable for commercial usage [9]. Thus, these desirable traits of SHW are usually transferred to domesticated bread wheat to generate SDLs for the improvement of local common wheat cultivars. Many SDLs that have been registered worldwide show higher genetic diversity than their parent lines [9]. In this study, for common wheat cultivar improvement, SHW lines that can confer resistance to HS and/or LR were developed. These lines can be used as breeding materials for improving local cultivars. Our findings showed that, in comparison to Keumkang, a bread wheat cultivar that is widely grown in Korea, the SHW line developed in the present study (named SynDT) was tolerant to HS and LR. In the future, this SHW line can be crossed with local bread wheat cultivar for improving stress tolerance.

2. Materials and Methods

2.1. Plant Materials

The SHW lines, SynDT #1 and #2, are the progeny of artificial crossing between T. durum #24 (T. turgidum LEUCURUM 33) and Ae. tauschii #52 (Ae. tauschii TA 1616). Both T. durum #24 and Ae. tauschii #52 were obtained from the International Maize and Wheat Improvement Center (CIMMYT) (Table S3). The embryo was rescued, and the plantlets were grown for several weeks in half-strength MS media before it was transferred to soil. Before the heading stage, the chromosomes were doubled by colchicine treatment (solution concentration: 0.5 mg/mL); next, the plants were grown until the grains were set. The collected grains were checked and amplified. Keumkang was used for comparison with SHW.

2.2. Confirmation of D Genome in SynDT

For crossing, T. durum were chosen as receivers and Ae. tauschii as donors. Therefore, to verify the success of pollination by confirming the presence of the D genome on the synthetic wheat line, which is inherited from Ae. tauschii, a SCAR-marker, SCS253, was utilized. This marker is linked to Lr19 gene and on 7D chromosomes. The PCR condition, which is described by Huseynova et al. (2013) [15], is used to get the SCS253 bands in SynDT line and its parent wheats.

2.3. LR Infection

The P. triticina strain, HSZ0742 (NCBI Gene Bank DQ41710.1), was provided by the Korea Research Institute of Chemical Technology.
The wheat grains were sown in soil for eight days (23 °C, 16 h light/8 h dark) before infection with P. triticina. Three pots per wheat line were planted for each replicate. The plants were infected as described in a previous study [16]. The phenotype images were acquired at 8 days postinoculation (dpi).

2.4. HS Treatment

The grains were sown in soil for six days (23 °C, 16 h light/8 h dark) before being exposed to HS. Three pots per wheat line (20 grains in each pot) were planted for each replicate. At day 6, the wheat was exposed to 45 °C temperature for 8 h and then returned to normal conditions (23 °C, 16 h light/8 h dark). At day 7 or 8, HS exposure, as performed on day 6, was repeated. Images were acquired after 4 days of recovery.

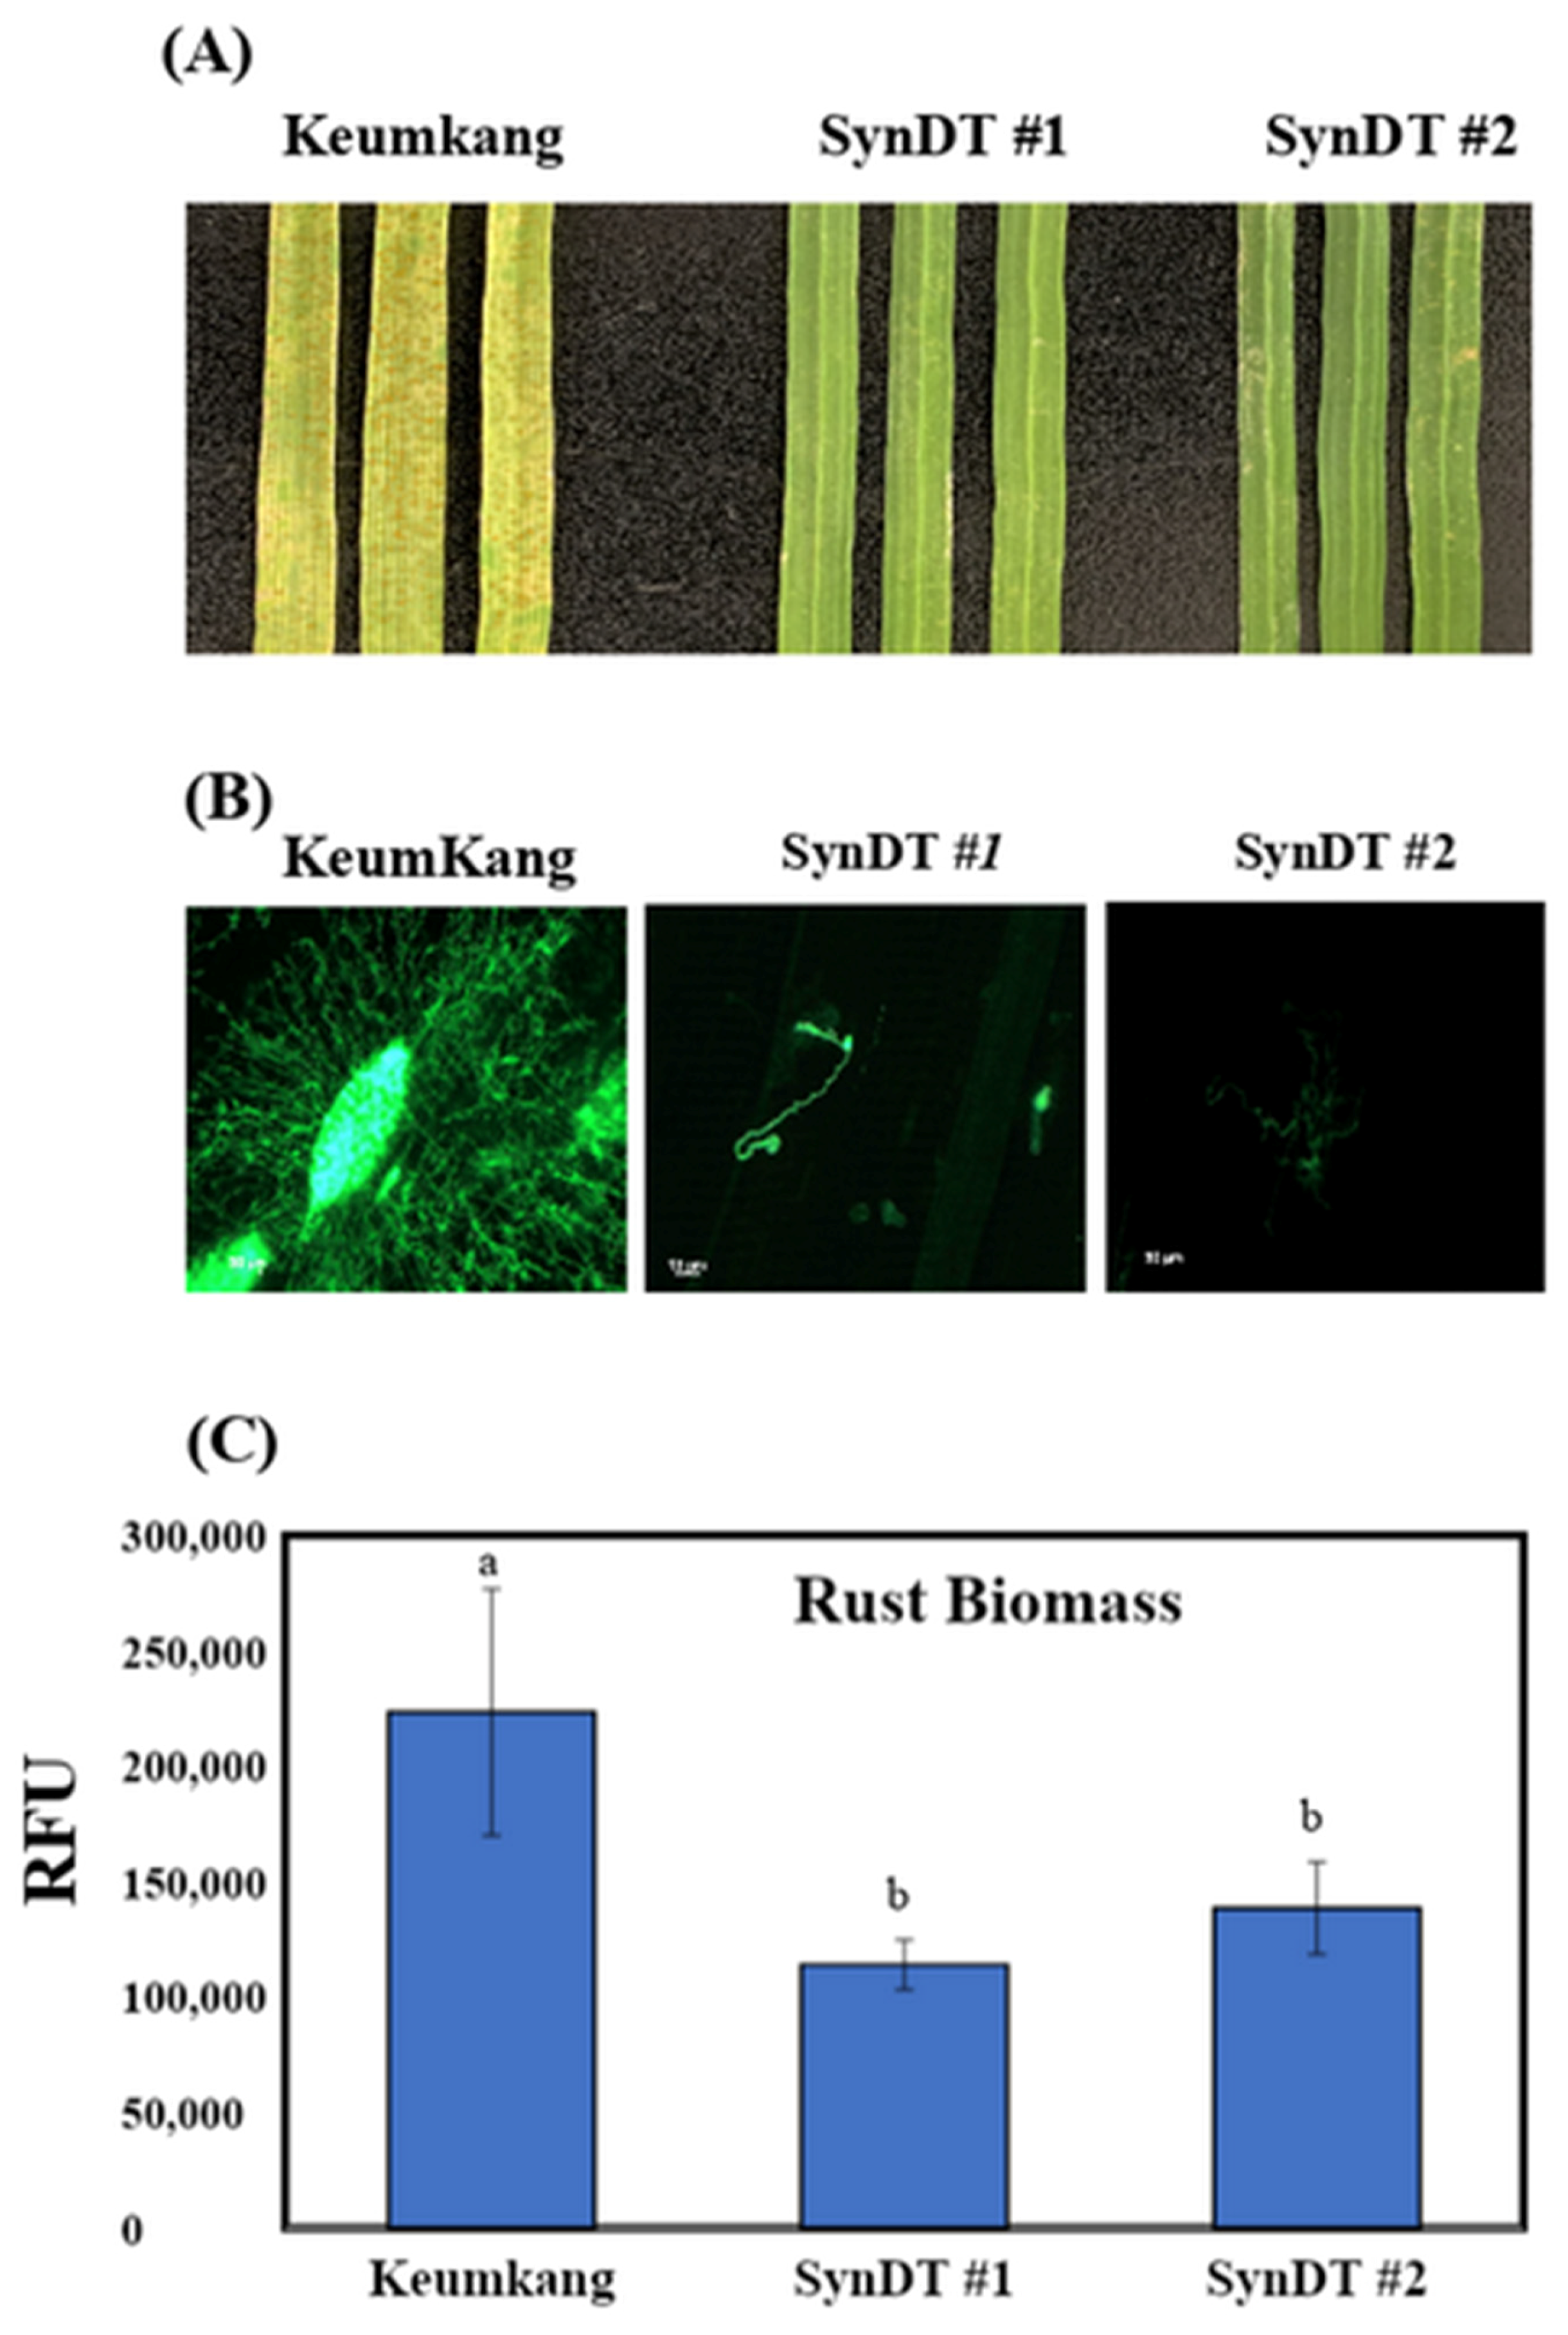
2.5. Microscopy and Rust Biomass Assay

At 8 dpi, LR samples from 5 leaves were collected for either microscopy or rust biomass assays. This was performed according to the detailed protocol described by Truong et al. (2019) [16].

2.6. Protein Extraction and Enzyme Assays: Chitinase, β-1,3-Glucanase, Peroxidase Activity Assays

Fifty milligrams of LR samples from 3 leaves were collected at 0, 6, and 24 h post-inoculation (hpi). Total protein was extracted using PRO-PREPTM protein extraction solution (iNtRON Biotechnology). The extracted solution was utilized for three enzyme assays: chitinase, β-1,3-glucanase, and peroxidase assays. These assays were performed based on a previously reported protocol [16].

2.7. Real Time RT-PCR Analysis

For HS, 6-day-old seedlings were exposed to a temperature of 45 °C for 0, 4, and 8 h. In contrast, 8-day-old seedlings were infected with P. triticina spores at 0, 6, and 24 h. The samples from 3 leaves were collected and ground in liquid nitrogen. Total RNA was extracted using TRIzol (Ambion, Life Technologies, Carlsbad, CA, USA) solution. After incubation, the samples were centrifuged at 13,000 rpm for 10 min at 4 °C. The supernatant was transferred to new Eppendorf following by adding 200 µL chloroform, mixing and incubating for 3 min at room temperature. The samples were then centrifuged, and the supernatant was added isopropanol, inverting, and standing on ice for 10 min. After centrifugation, the supernatant was discarded, washed with 70% ethanol and the pellets were dried for an hour. After that, DEPC distilled water was added and incubated in 55 °C for 10 min. The quality of RNA is checked by agarose gel running. From that, cDNA is synthesized by using the Thermo Scientific RevertAid first strand cDNA synthesis kit [17]. The difference in transcript levels was determined by qRT-PCR analysis (CFX connect Real-Time PCR, Bio Rad, Hercules, California 94404, USA). The internal control for normalization was Plant actin eu97. The primers used in this study are listed in Table S1. The qRT-PCR data were analyzed by Bio-Rad CFX Manager 3.1 software.

2.8. Data Analysis

For robust results, each experiment was repeated at least twice. One set of representative data was chosen for analysis. The standard deviation (SD) value was calculated from three replicates of each treatment. Statistical Analysis System (SAS) was used to perform one-way analysis of variance (ANOVA) and Tukey’s test (α = 0.05). Among lines within a treatment condition, different letters (a, b, or c) indicate significant different based on one-way ANOVA (p < 0.05).

3. Results and Discussion

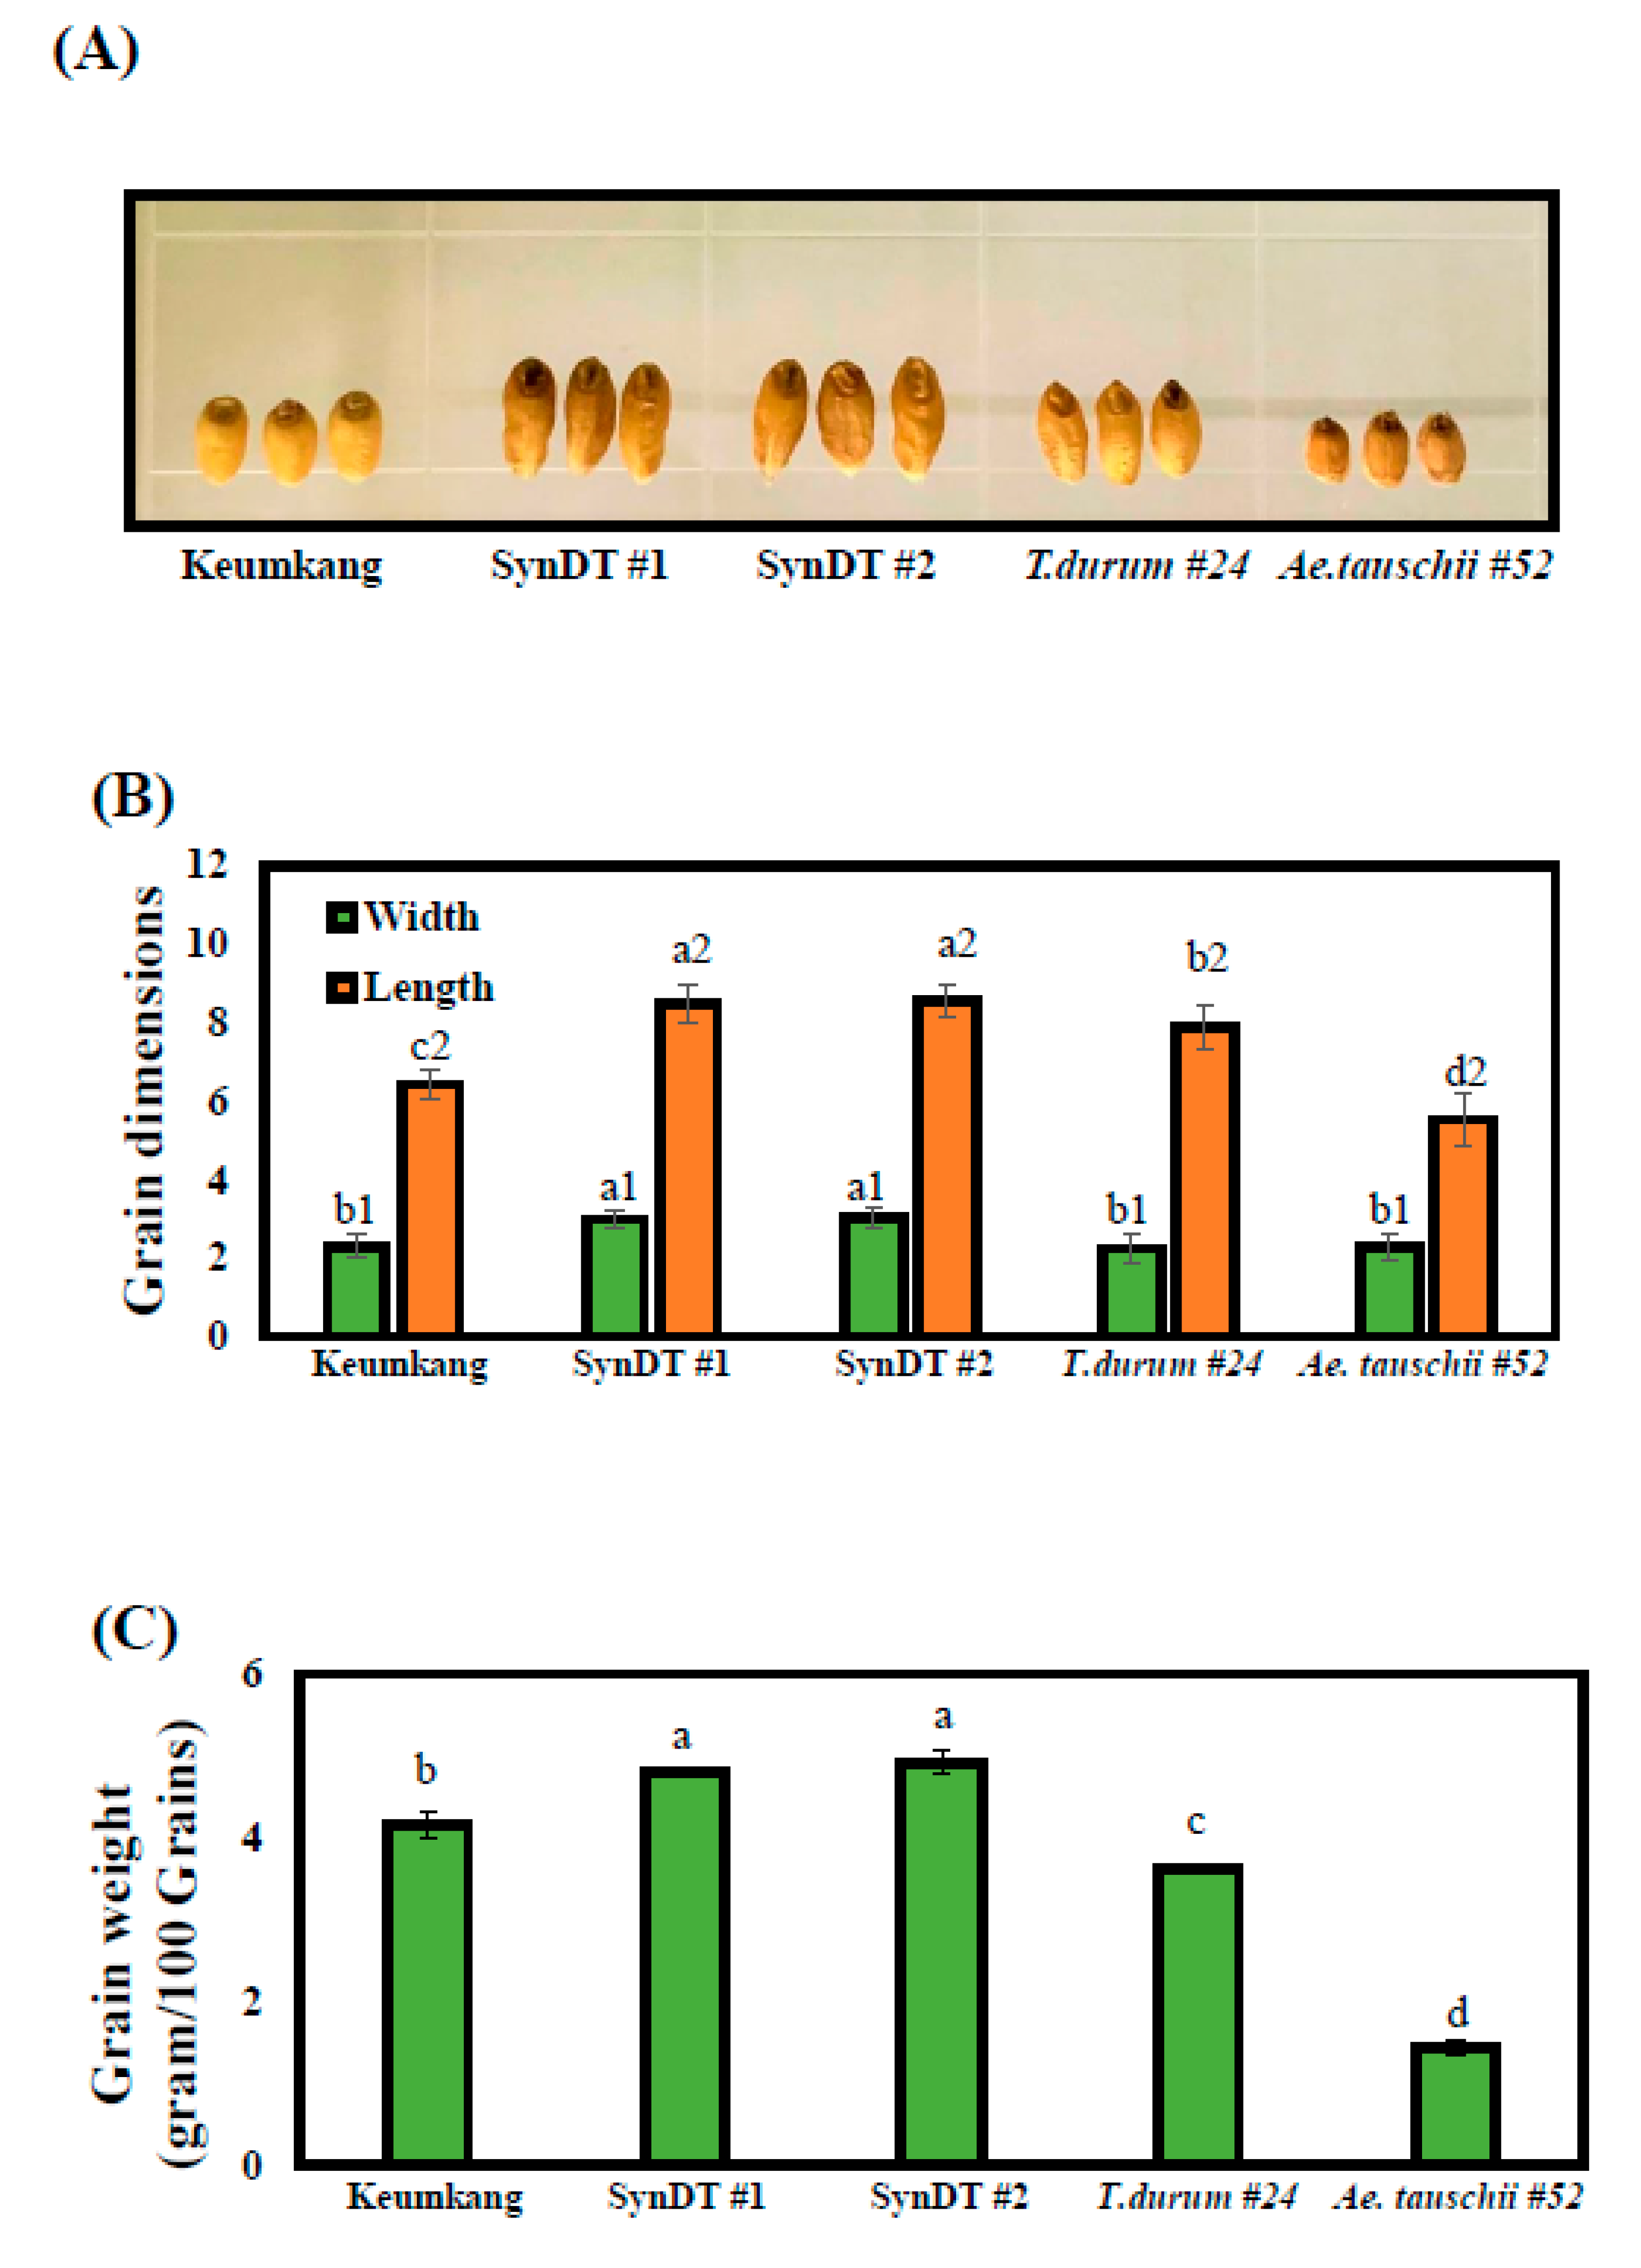
3.1. Process of Generating Synthetic Wheats and Their Morphology

In this study, more than 50 lines each of T. durum and Ae. tauschii cultivars were obtained from the CIMMYT. Preliminary screening was done to select the cultivars with at least mild tolerance to HS or LR (data not shown). Both T. durum and Ae. tauschii were planted in the field for grain amplification and crossing. For crossing, we chose T. durum as receivers and Ae. tauschii as donors. Before the grain-filling stages, we performed emasculation. The anthers inside each spikelet from T. durum were removed and covered with polythene bags. Three days after emasculation, the pollens of Ae. tauschii were transferred to the emasculated T. durum. After three weeks, we collected the synthetic grains without endosperms. The embryos of synthetic grains were rescued and placed on MS media containing NAA hormone until they were large and strong enough to grow in soil (Figure 1A). At this stage, the synthetic plants were haploid; when the plants attained maturity, we treated them with colchicine to double their chromosome number and let them grow until the kernels were set. Figure 1B illustrates the process of colchicine treatment: removing the plants from the soil, leaving small leaves, washing off the soil in roots, immersing the plant roots in colchicine solution and aeration for 6 h, rinsing with water, and replanting the treated plants back to the soil. After colchicine treatment, the spikes, and kernels of the synthetic plants were successfully set (Figure 1C). To verify our synthetic wheats, we checked the presence of the D genome from Ae. tauschii, using the SCS253 marker. Through the preliminary PCR experiments, we found that this marker is only shown bands in the Ae. Tauschii but not T. durum lines, which is a specific marker to check the presence of D genome in hexaploid wheat. As shown in Figure 1D, T. durum #24, which contains the A and B genomes, did not have any band of SCS253 marker. Only A. tauschii #52 and SynDT #1 and #2 containing the D genome showed bands at 737 bp. The confirmed synthetic wheat plants were planted in the field for grain amplification.
In this study, the responses of our synthetic wheat (SynDT) to LR and HS were compared to those of Keumkang. In addition, we also examined T. durum #24 and Ae. tauschii #52, which are the parents of SynDT. Before studying their response to LR and HS, we also observed that the studied wheat varieties had different grain morphology and weight. SynDT had large grains, with long and thin shape. Compared to Keumkang, T. durum #24 is longer in length but similar in width. Keumkang has short and round shapes, whereas those of Ae. tauschii #52 were the smallest (Figure 2A,B). Furthermore, there is a correlation between grain size and weight. The order of weights of 100 grains/line is SynDT > Keumkang > T. durum #24 > Ae. tauschii #52 (Figure 2C, Table S4). The size of wheat grains is one of the most crucial agronomic traits because of its effect on grain weight, milling quality, and market price [18]. In addition, larger grains may have favorable traits of increased yield and seedling vigor [19]. Taken together, our synthetic wheat lines have larger and heavier grains, which is a promising trait for breeding value.

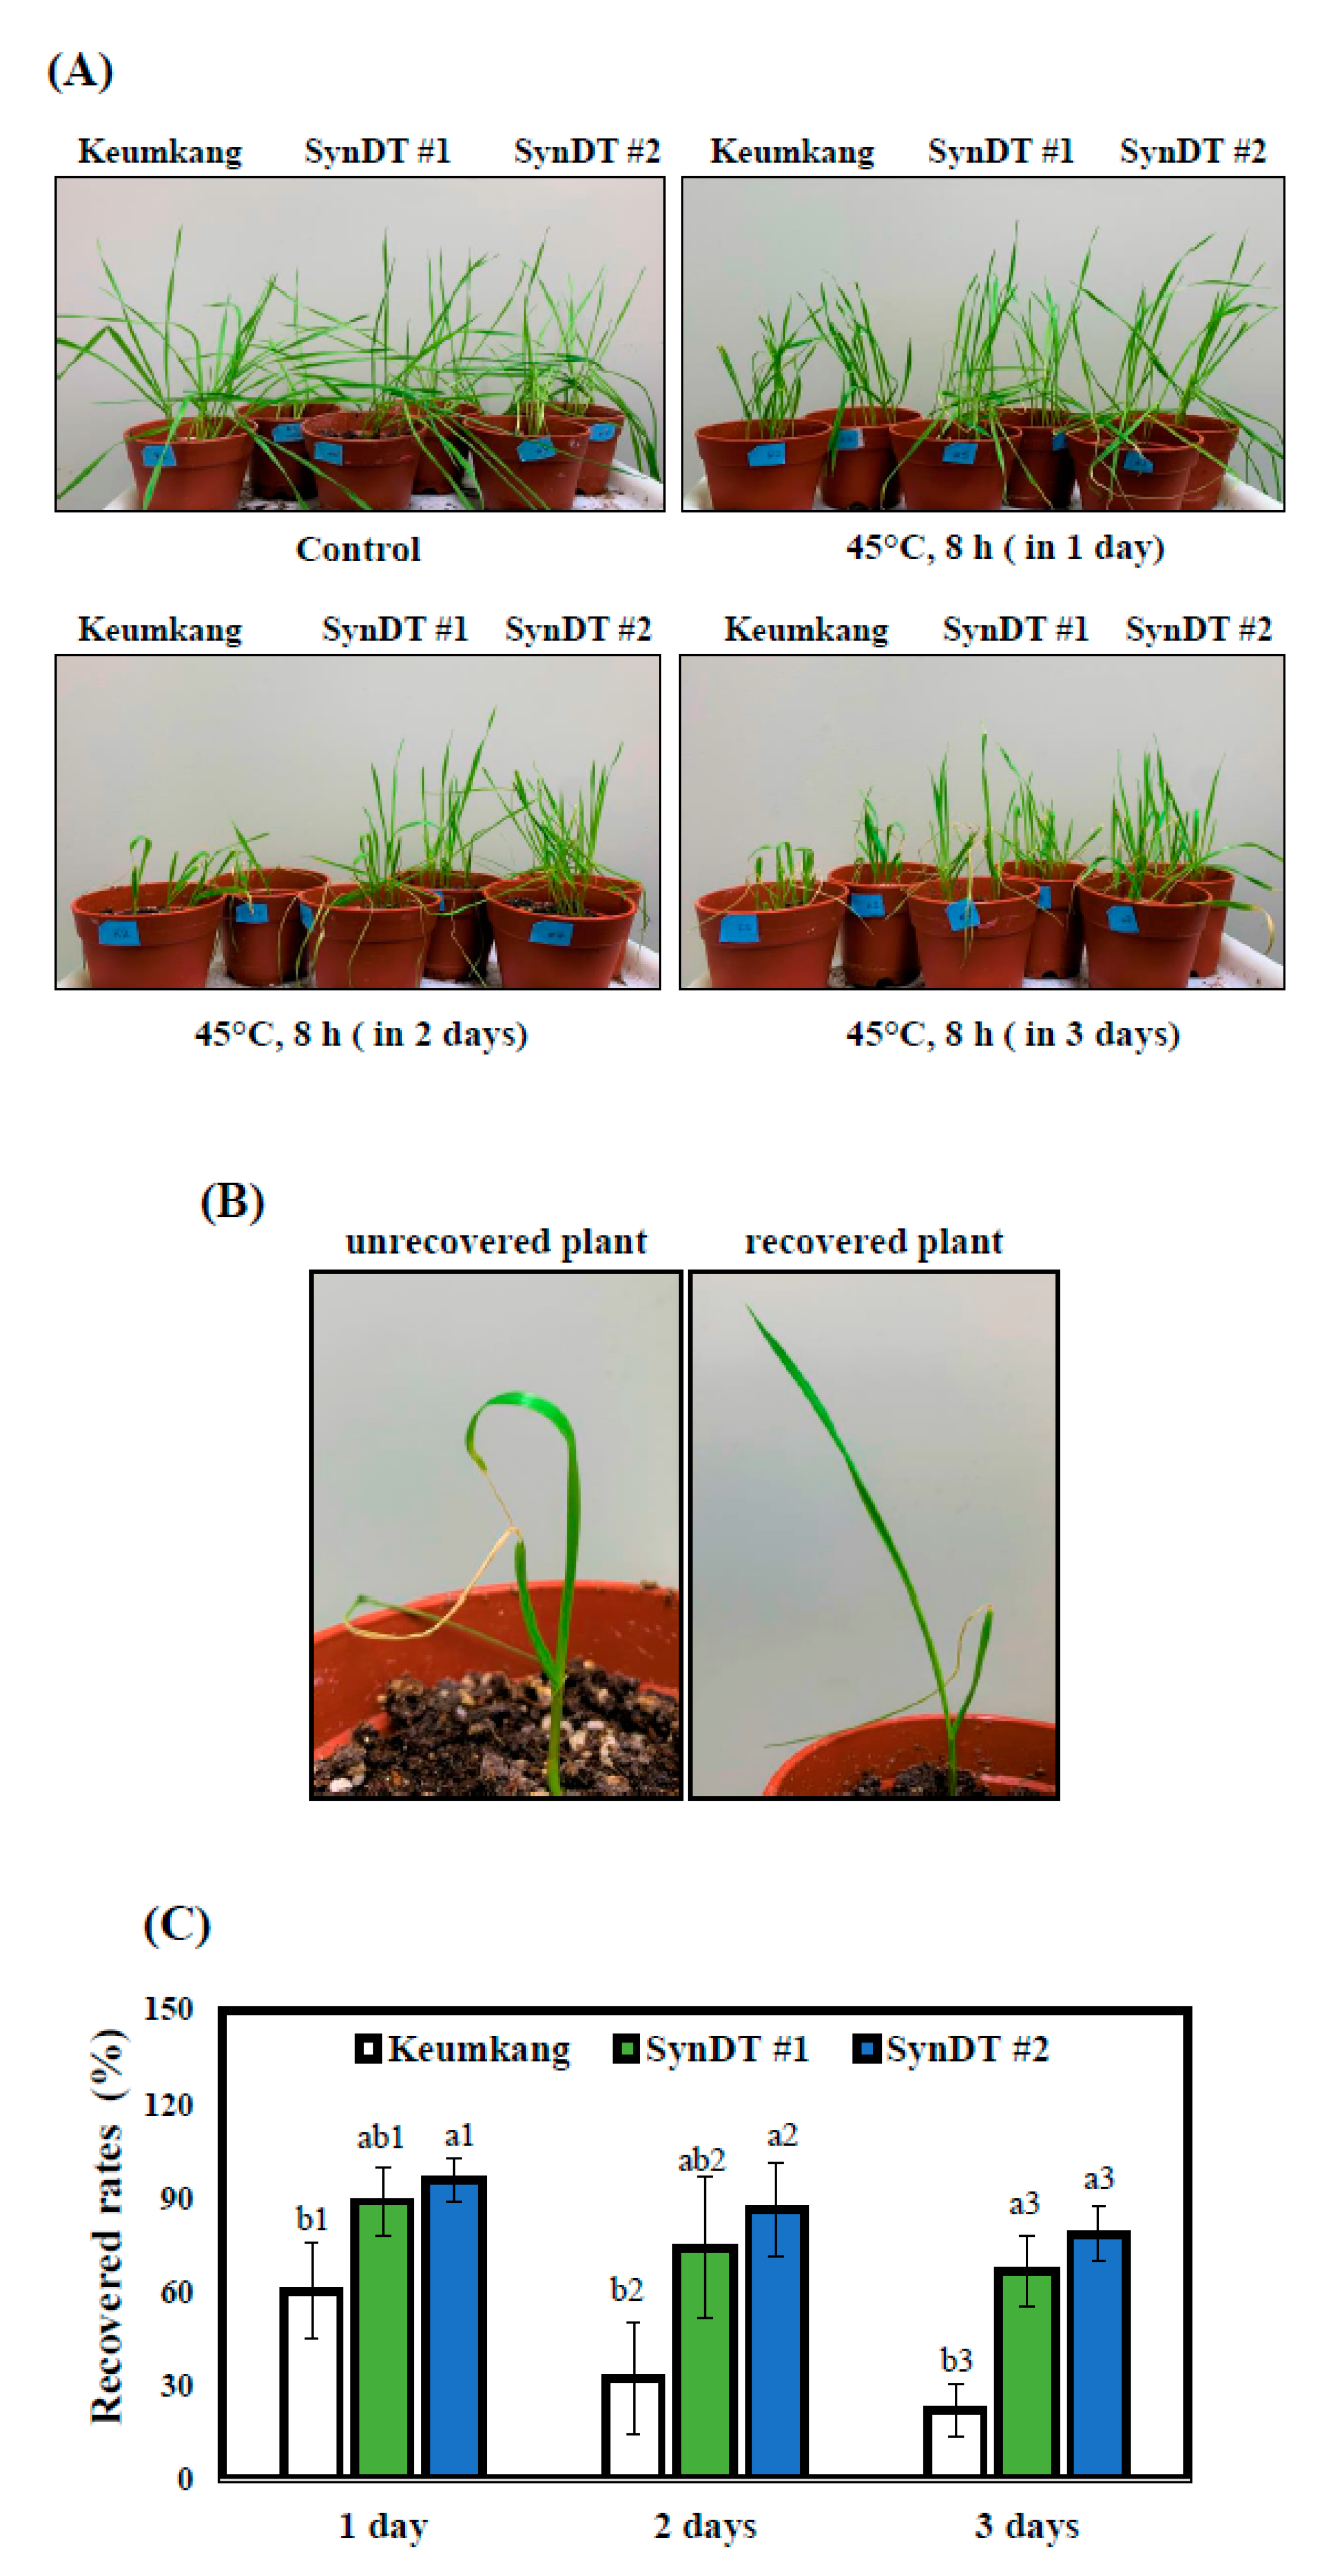
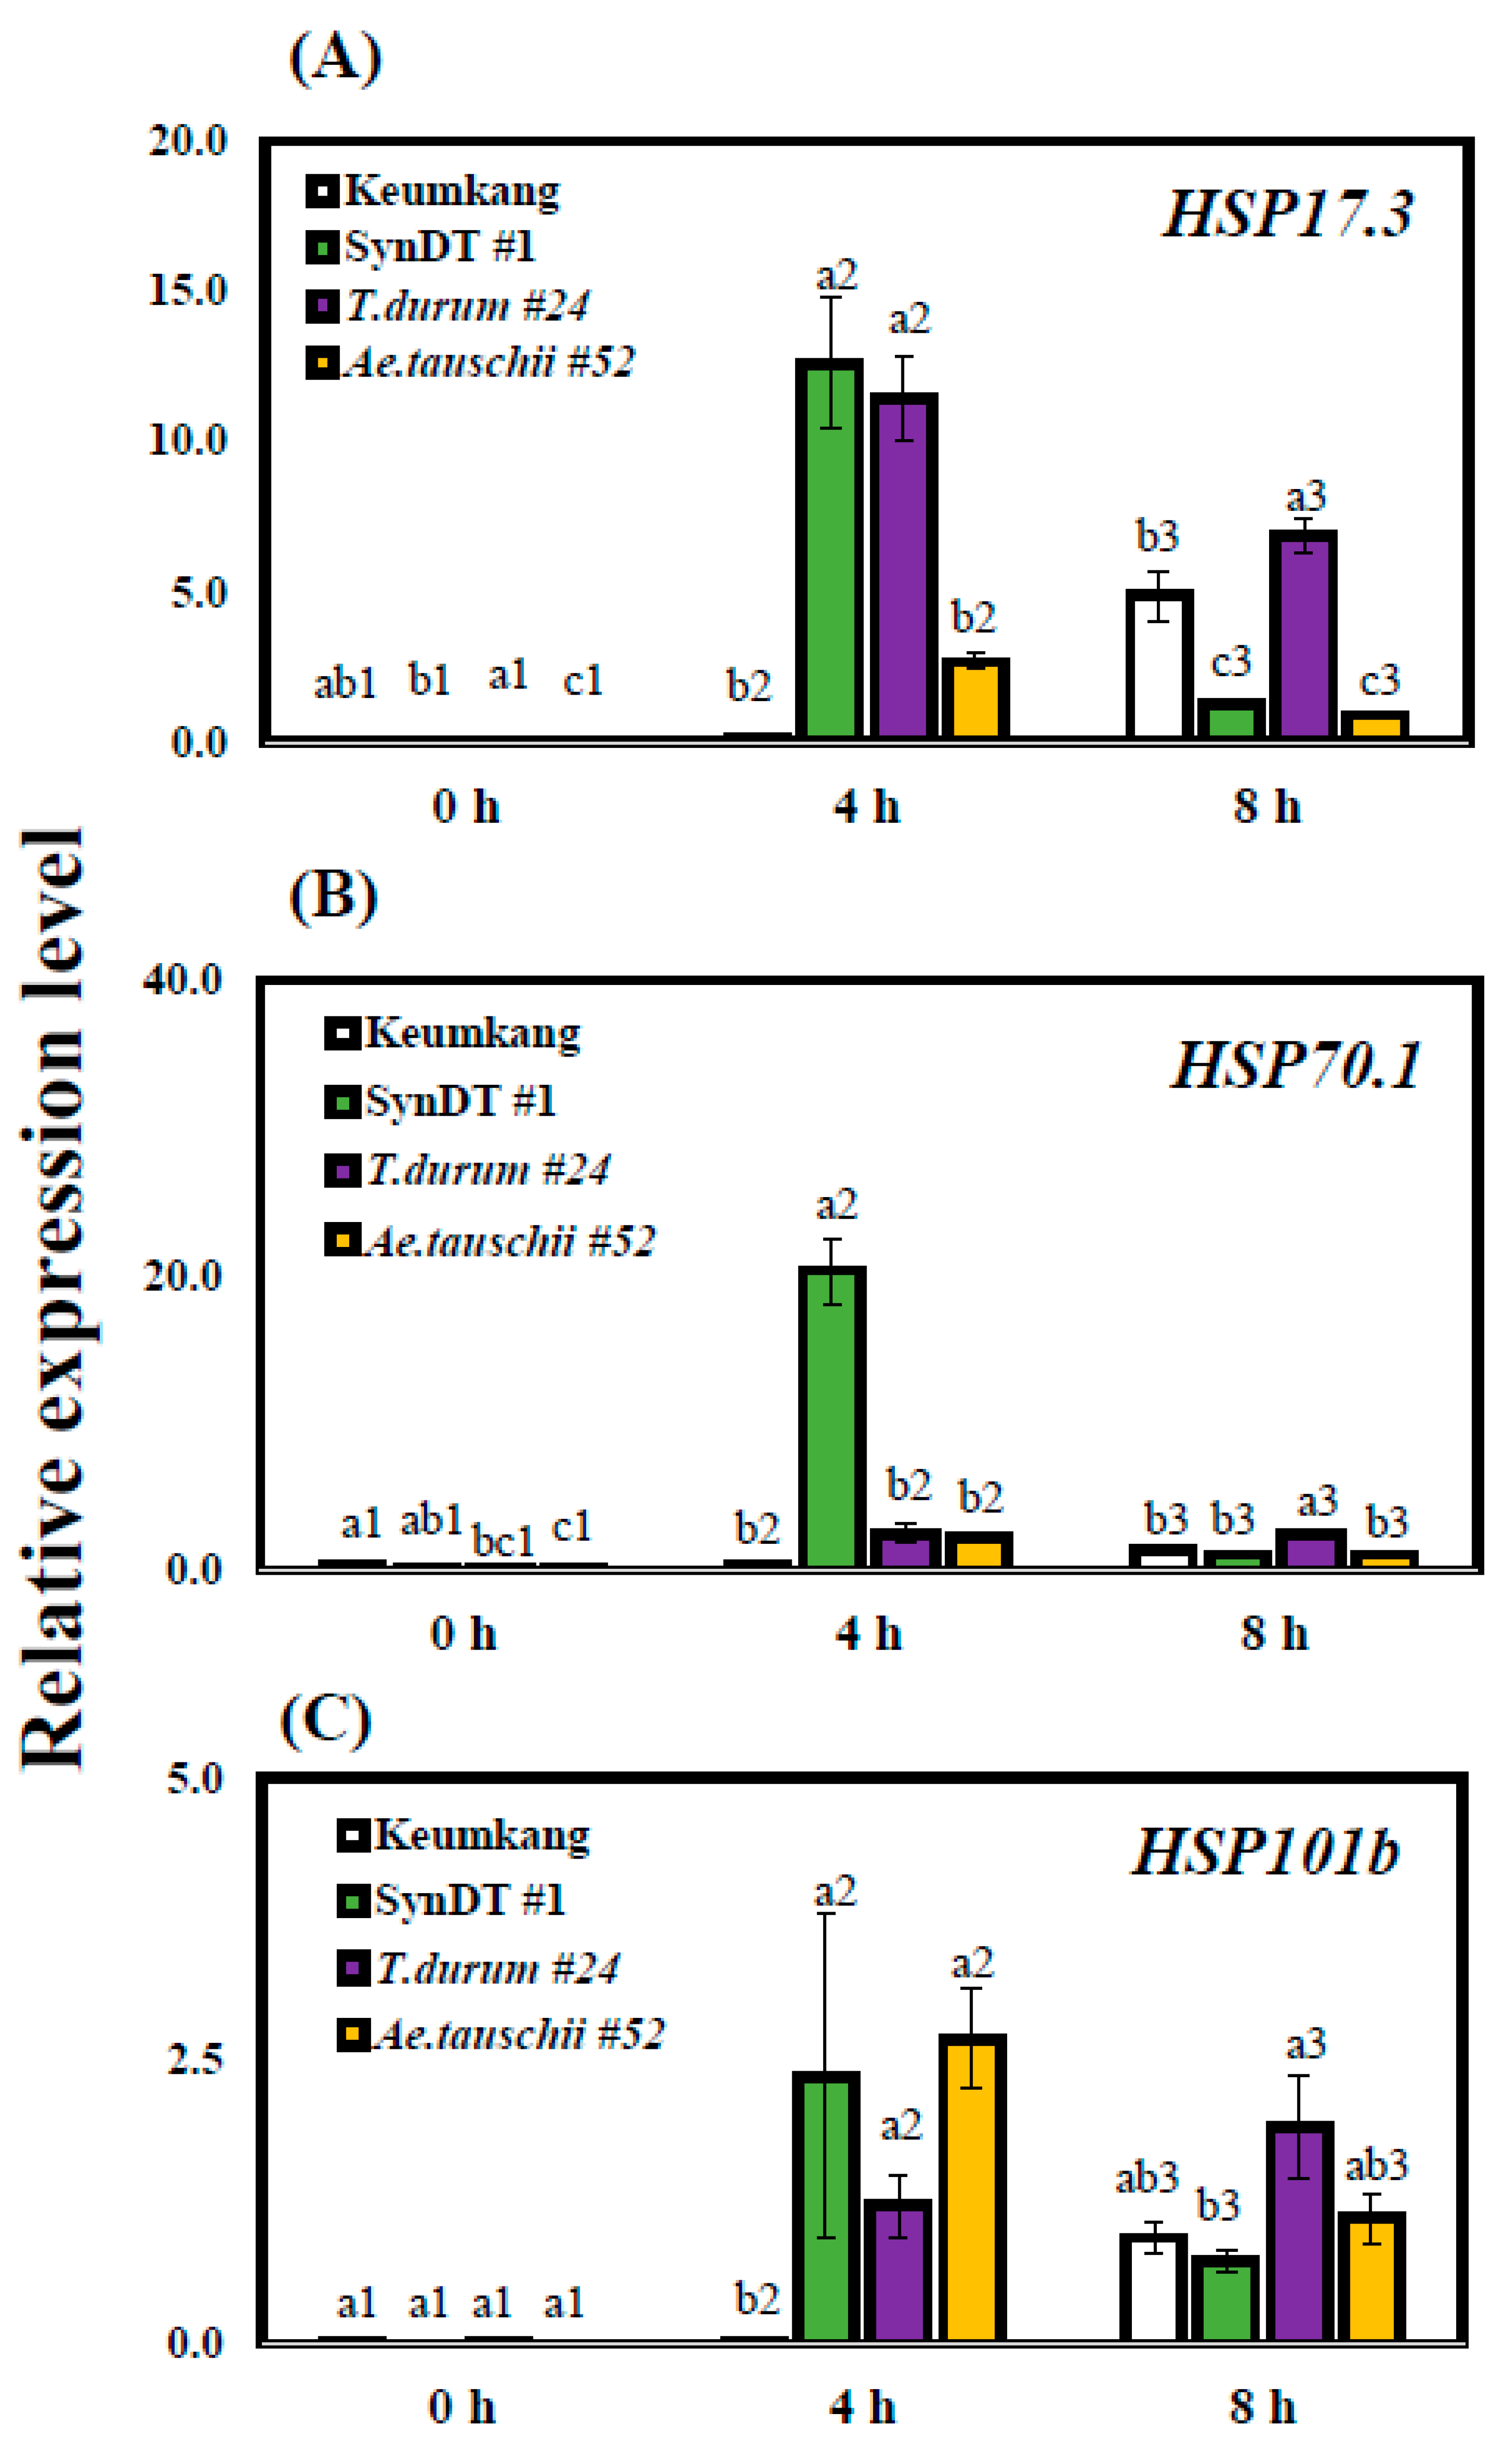
3.2. Tolerance of SynDT to HS Due to the Induction of HSPs

First, we examined the response of our synthetic wheat to HS. The 6-day-old wheat seedlings were subjected to extreme HS at 45 °C for 1, 2, or 3 consecutive days for 8 h per day. After 4 days of recovery, we observed that SynDT lines grew better than Keumkang, with full second leaves emerging from the stem. Most of the Keumkang plants were severely affected by HS, with their second leaves being damaged and growing abnormally (Figure 3A,B). Therefore, based on the growth statuses of the second leaves, we measured the recovery rates of the studied wheat lines, and found that SynDT lines have higher recovery rates than Keumkang (Figure 3C, Table S5). Keumkang was included in this study for good comparison [16] because, in a previous study, Keumkang had the highest tolerance to HS among the common Korean wheat cultivars. Additionally, we checked the response of the parent wheat, T. durum #24 and Ae. tauschii #52, to HS and found that Ae. tauschii #52 is more tolerant to HS than Keumkang and T. durum #24 (Figure S1). Therefore, we believe that the HS tolerance of SynDT lines is mainly inherited from Ae. tauschii #52. In addition, some studies have revealed that the D genome from Ae. tauschii is a valuable resource for the variability in improved agronomic traits [20,21].
At the molecular level, the response to HS is mainly characterized by the expression of HSPs. The increased accumulation of HSPs might contribute to thermotolerance [22]. Under stress conditions, HSPs play a role in protein stabilization and refolding [23]. Therefore, we examined the transcript levels of HSP17.3 (NCBI X58279.1), HSP70.1 (NCBI KJ027551.1), and HSP101b (NCBI AF097363) (Tables S2 and S6). HSP17.3 is a small HSP (sHSP) that binds to non-native proteins to prevent thermal aggregation [23]. The transcript levels of HSP17.3 were quickly induced in response to HS (Figure 4A). At the 4 h time point, HS significantly increased the expression levels of HSP17.3 in SynDT #1 compared to that in Keumkang (106-fold); HSP17.3 expression in T. durum #24 was also upregulated. At 8 h, the transcript levels of HSP17.3 were reduced in most wheat lines except in Keumkang. In a previous study, the expression of HSP17 was also induced in response to HS in “HD2329” and “C-306” wheat cultivars [24]. HSP70 belongs to one of the main families of HSPs and functions as a chaperone in protein refolding and prevents aggregation [22]. HSP70 is also involved in the response to various environmental stress factors, such as heat, cold, oxidative stress, heavy metals, and pathogens [25]. In our study, HS exposure also induced the expression of HSP70.1, particularly in SynDT #1 at 4 h (Figure 4B). At 8 h of HS, the expression levels of HSP70.1 showed no difference between Keumkang and SynDT #1. HSP70.1 expression in the parent T. durum #24 was maintained at 4 and 8 h of HS exposure. Similarly, SynDT #1 showed significantly higher HSP101b expression than Keumkang at 4 h (262-fold). There was no difference in the transcript levels of HSP101b after 8 h of HS. Moreover, the expression of HSP101b in T. durum #24 was higher at 8 h than at 4 h. In contrast, Ae. tauschii #52 had higher transcript levels of HSP101b at 4 h compared to that at 8 h. HSP101 is known to reactivate aggregated proteins [26]. In maize, the accumulation of HSP101 protein was increased in response to HS [27]. Thus, SynDT showed higher expression levels of HSPs than Keumkang, especially at 4 h, indicating that the former responded to HS more quickly than Keumkang to protect the plants from damage. Moreover, in the parent lines, HSP17.3 and HSP70.1 were mainly expressed in T. durum #24, while HSP101b was expressed in both.

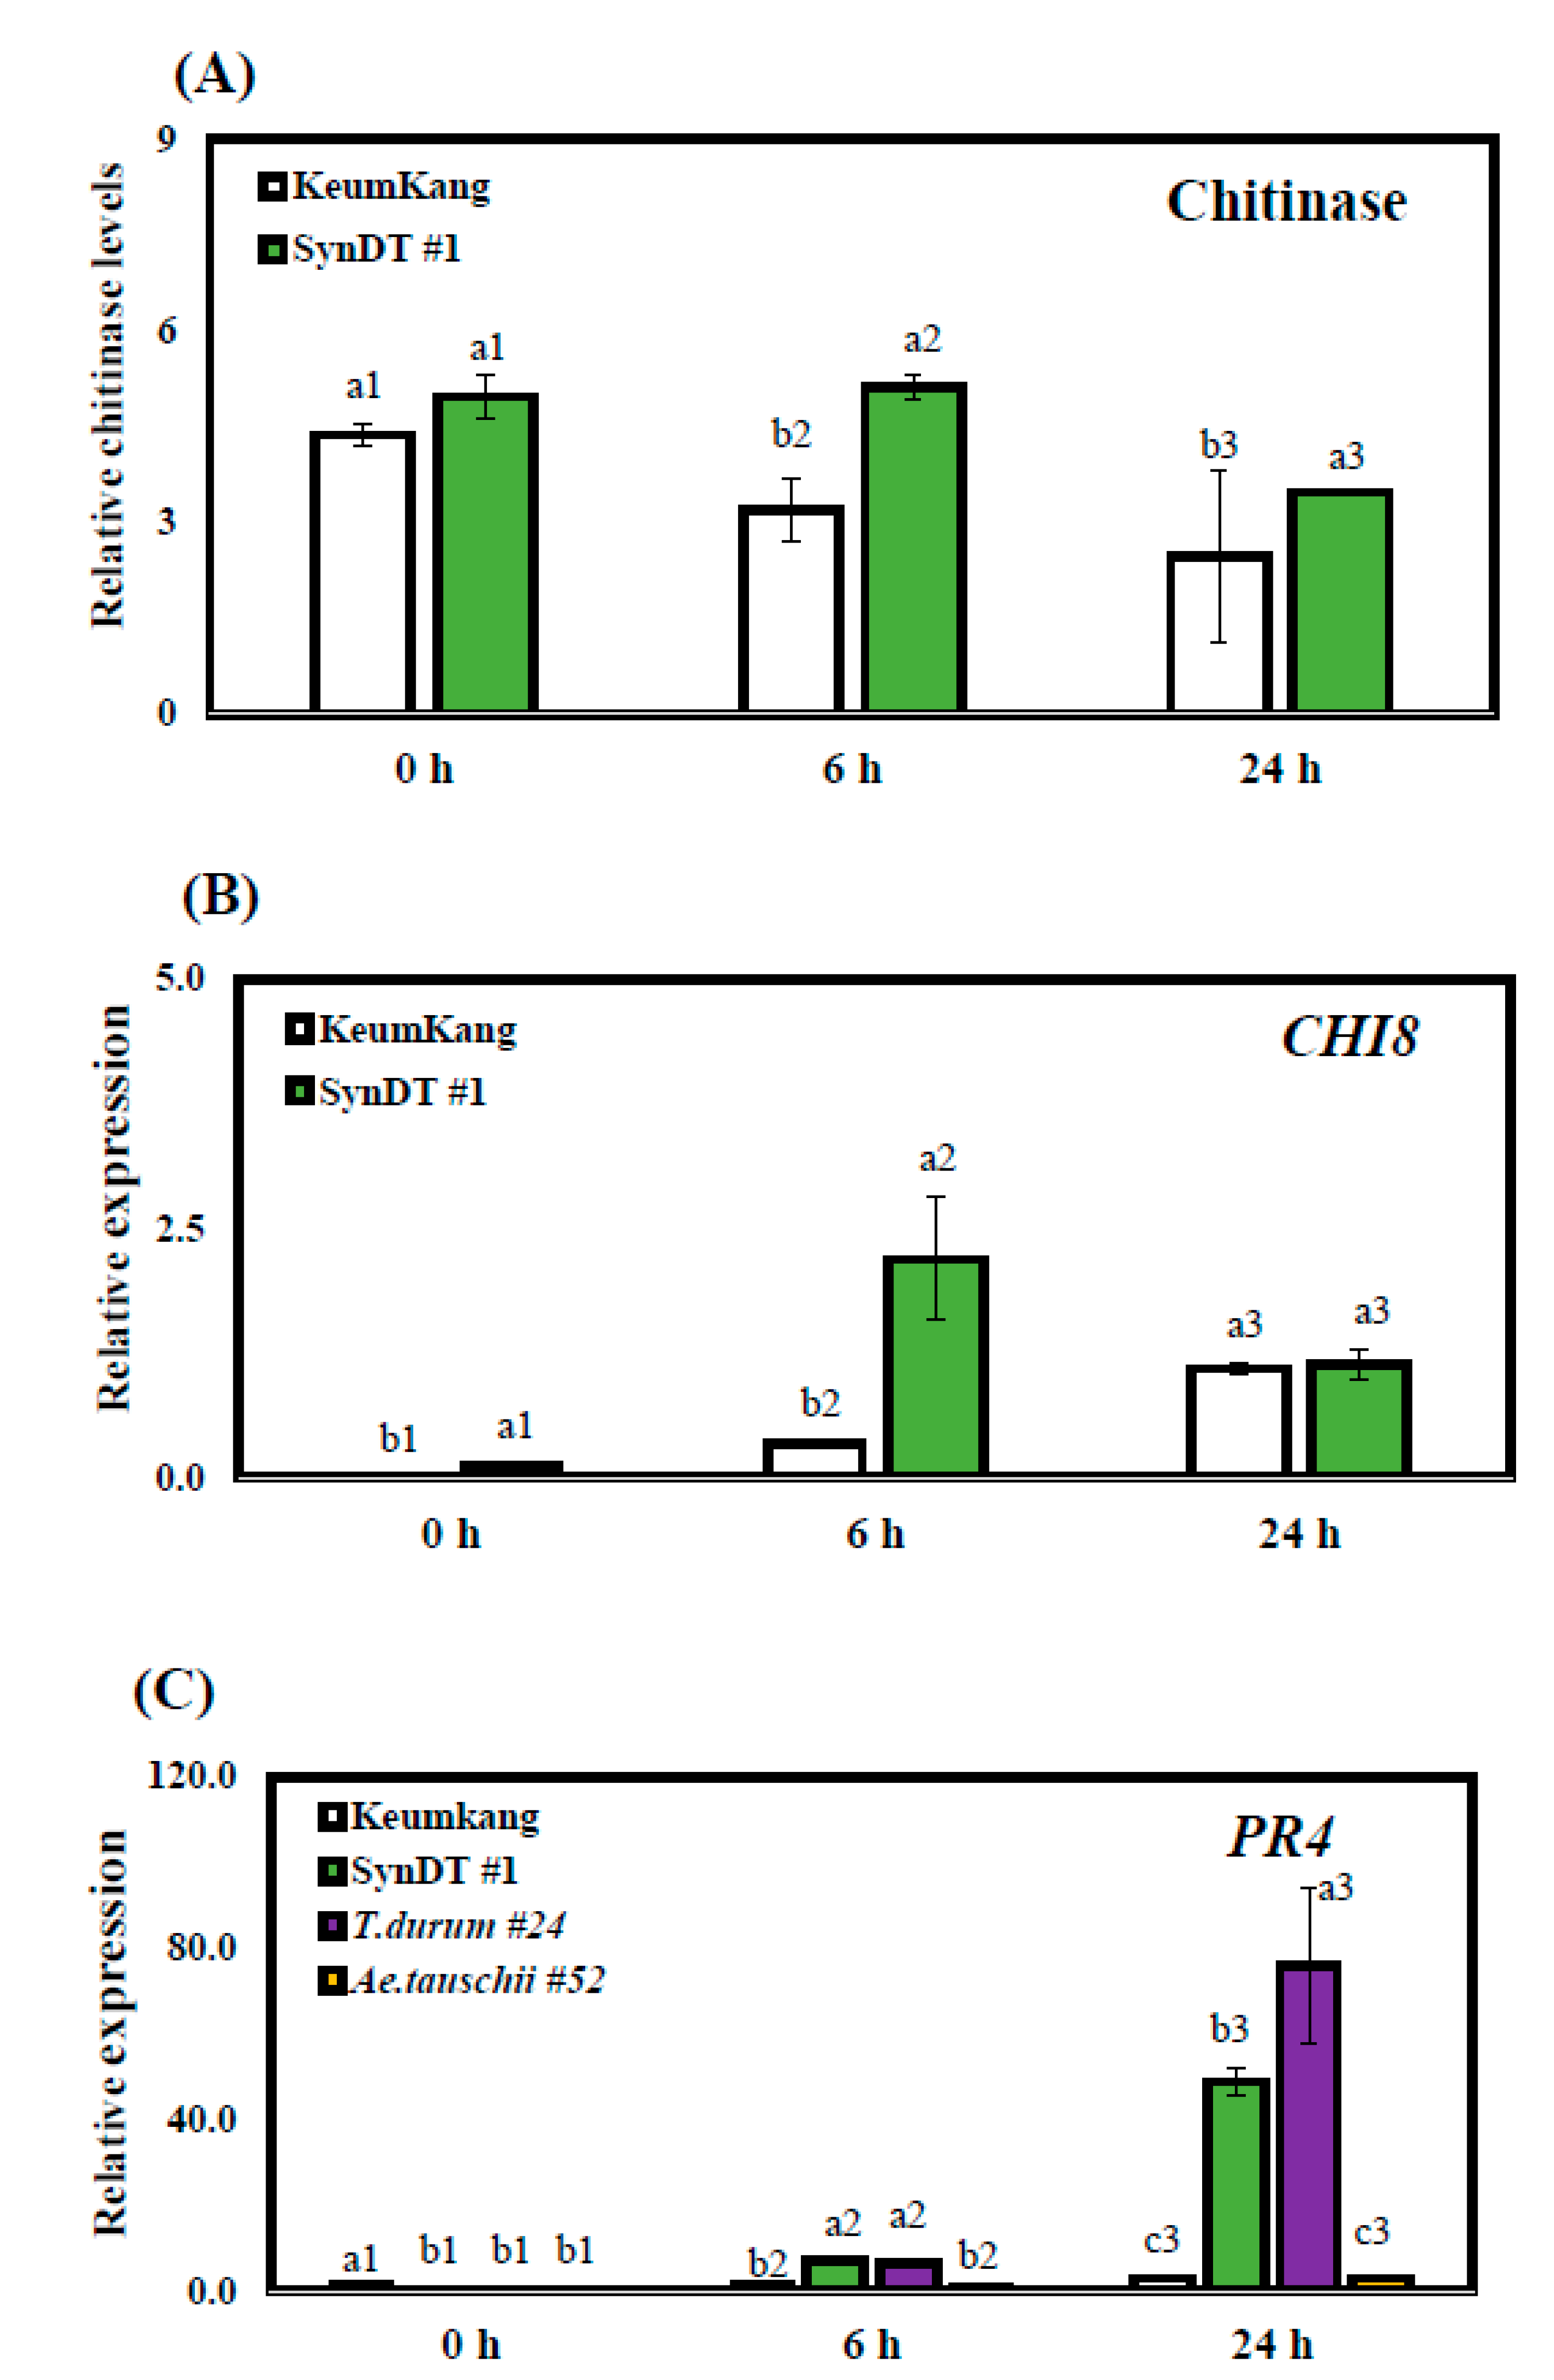
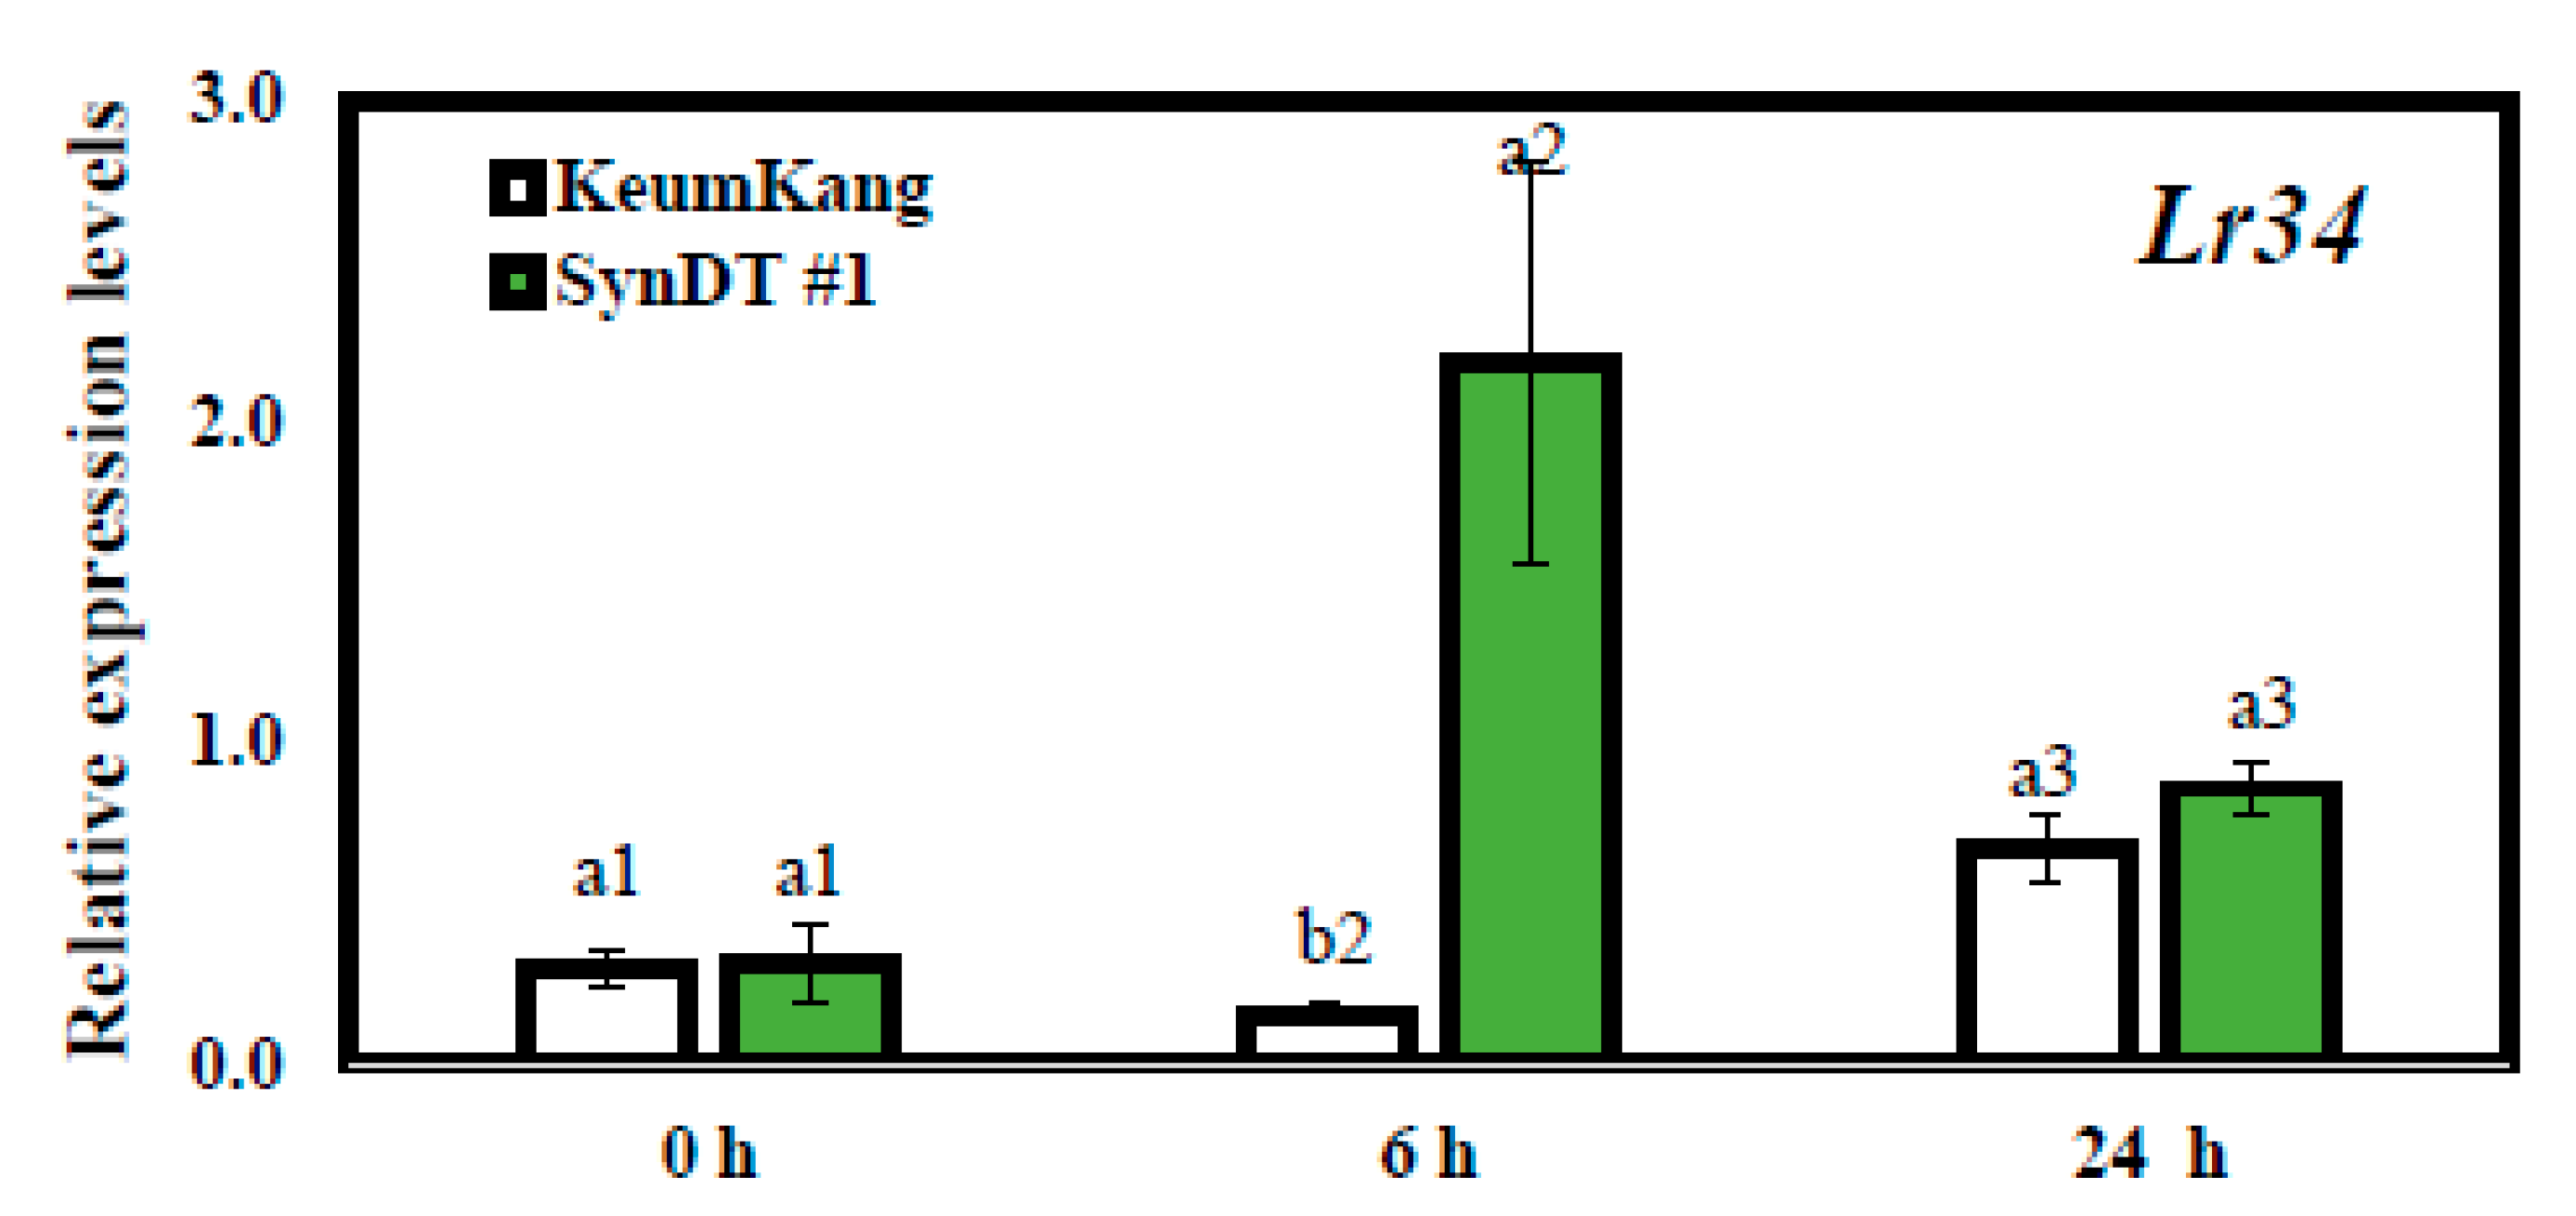
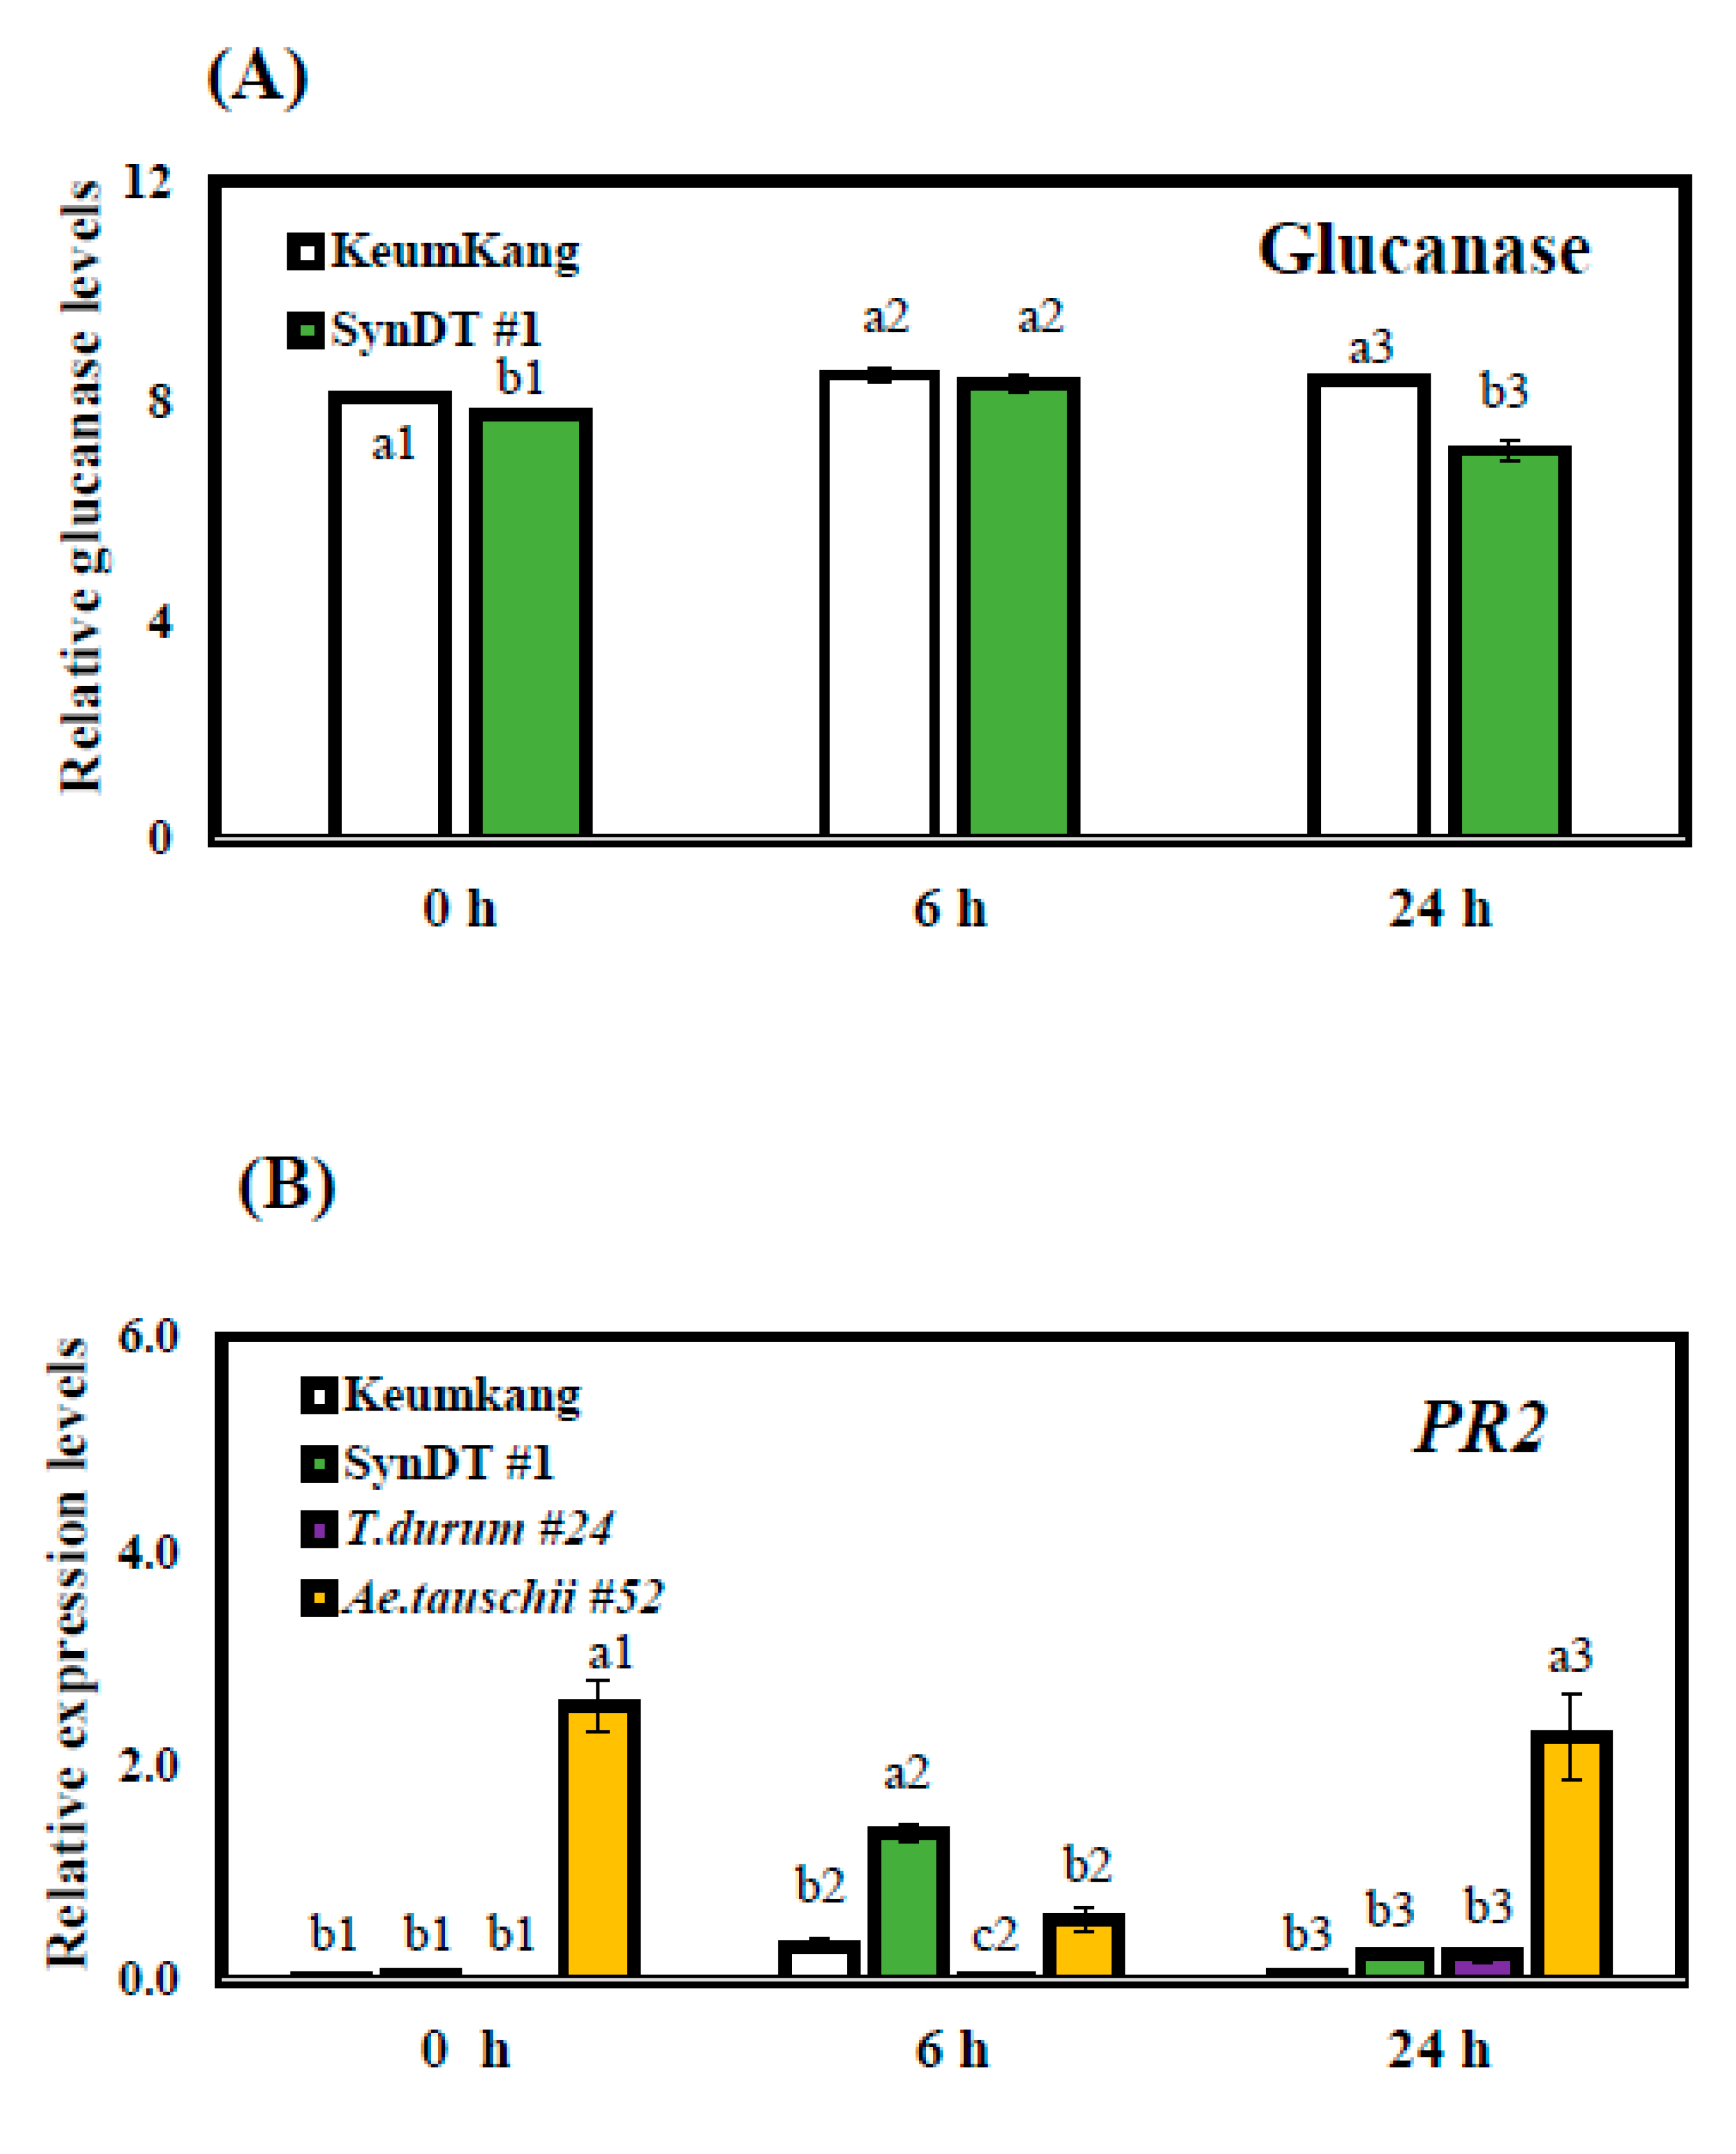
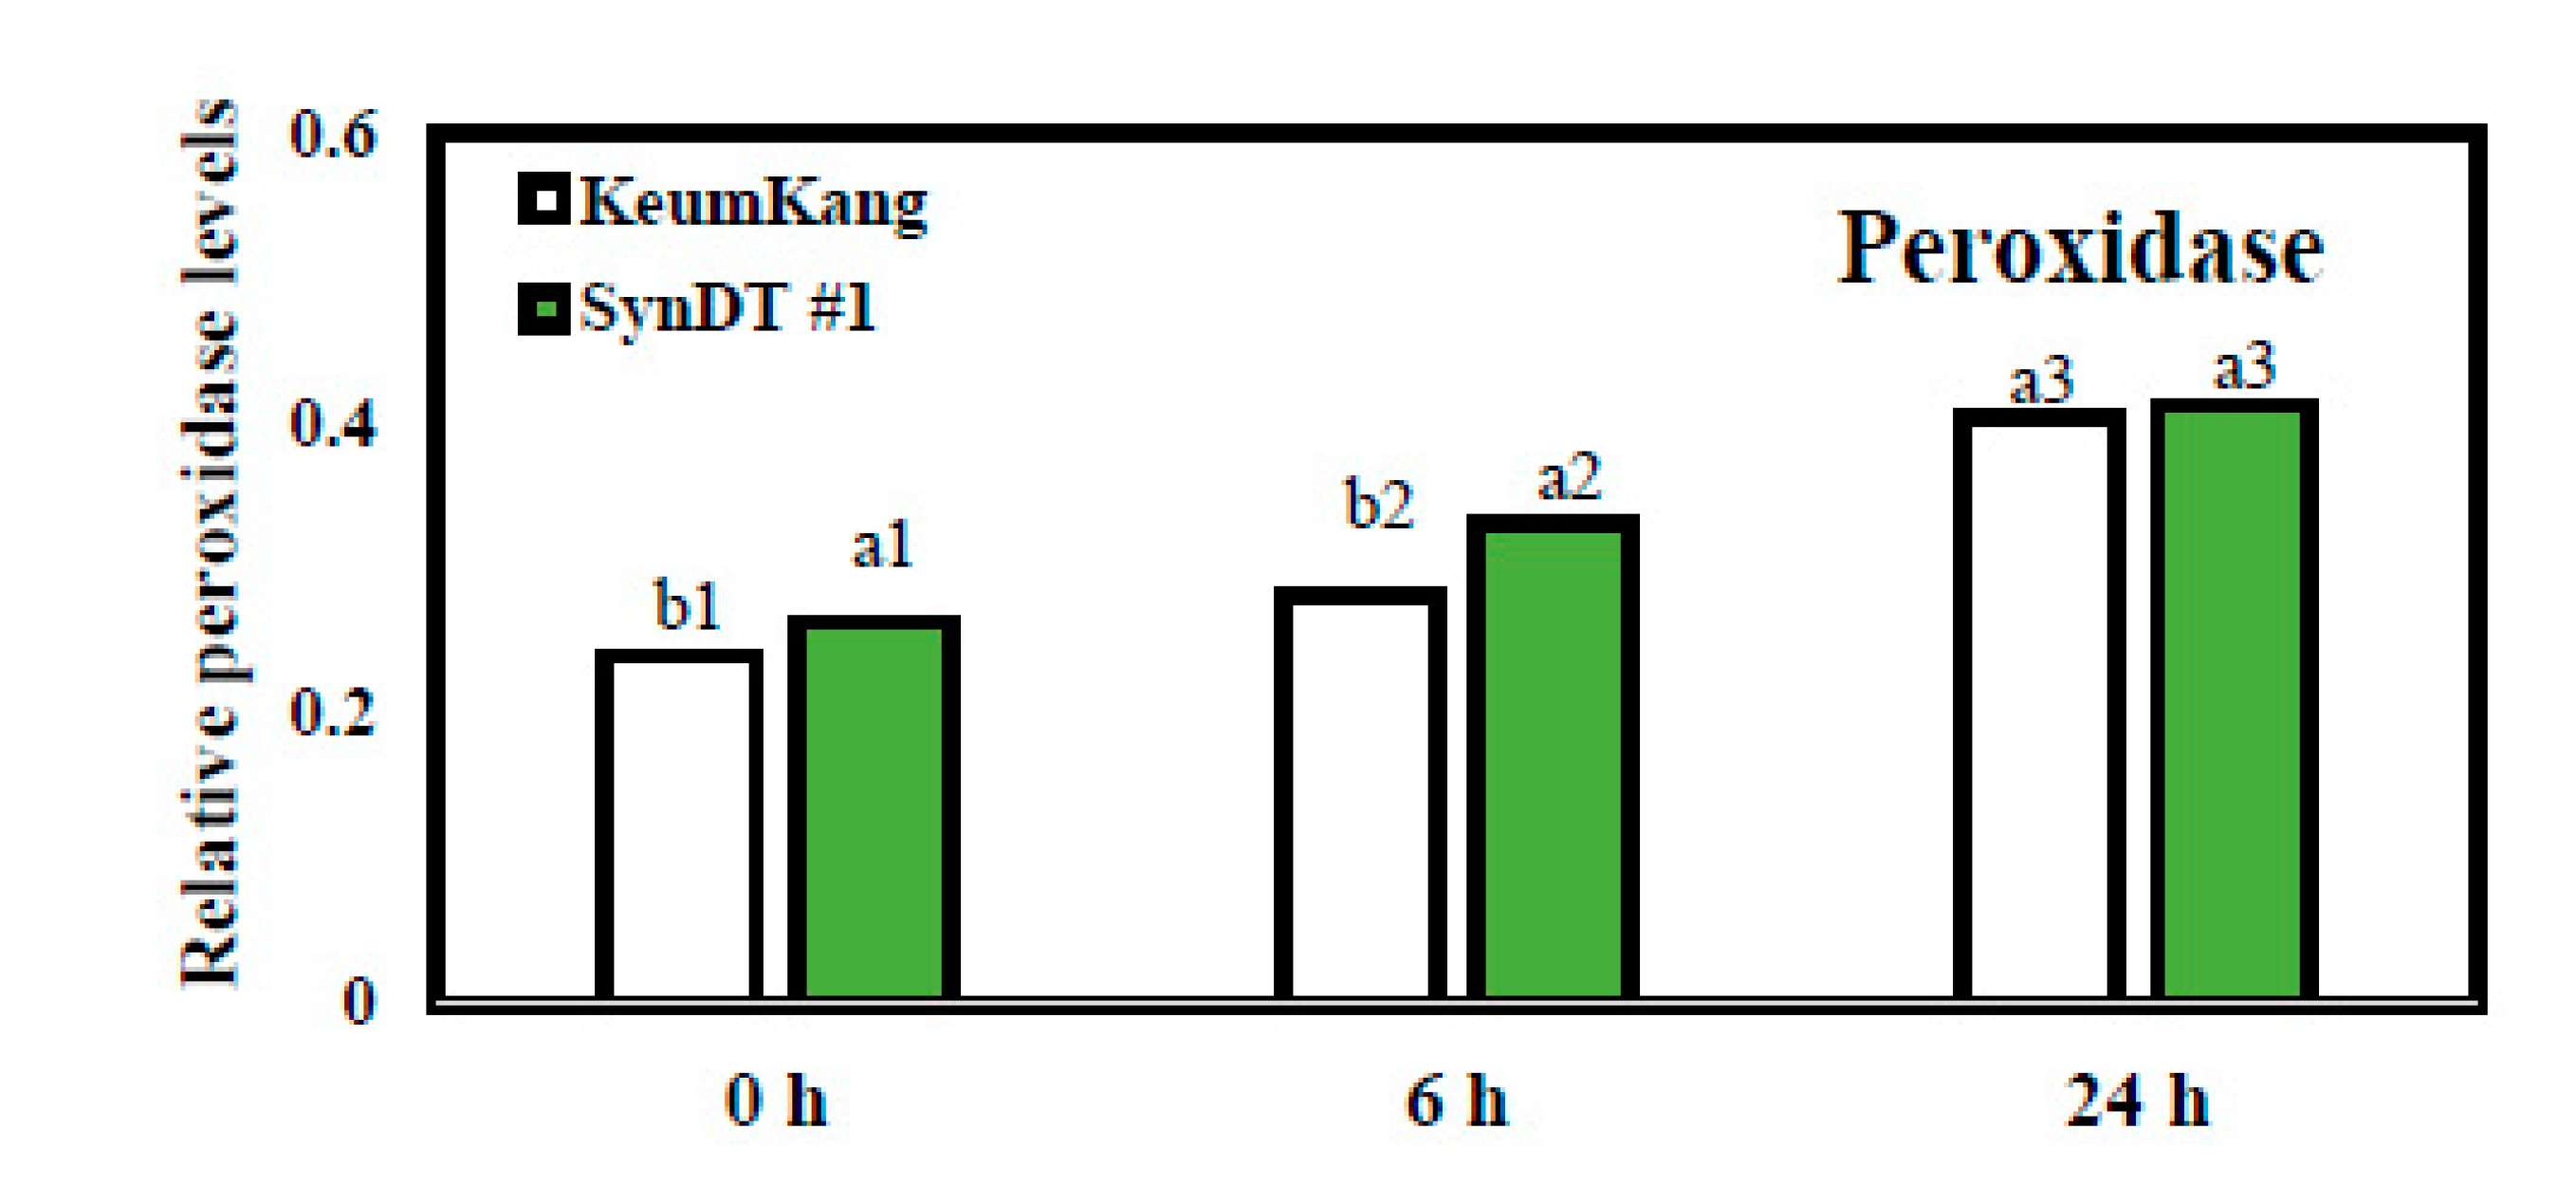
3.3. Resistance of SynDT Wheat Cultivar to LR by the Induction of Chitinase and PR Genes

All 8-day-old wheat lines were infected with P. triticina. After 10 dpi, urediniospores were observed on the leaf surface of Keumkang, whereas no spores were detected on those of SynDT #1 and #2 (Figure 5A). Microscopy revealed that a mass of hyphae had developed from the infected sites in Keumkang, but not in the synthetic wheats (Figure 5B). In addition, the results of rust biomass were consistent with those observed using microscopy (Figure 5C, Table S7). We also checked the response of T. durum #24 and Ae. tauschii #52 to LR and found that T. durum #24 was mildly sensitive to LR, whereas Ae. tauschii #52 was resistant (Figure S2). Therefore, we believe that our synthetic wheats may have inherited the LR-resistant phenotype from Ae. tauschii #52.
Plants have multiple mechanisms to defend themselves from pathogenic infections. Among these, the accumulation of antifungal proteins is vital in inhibiting fungal growth. Chitinase, β-1,3-glucanase, and peroxidase are common antifungal proteins that induce LR. The first component of fungi in contact with plants is its cell wall, of which chitin is one of the fundamental components. Chitinase can hydrolyze the substrate, chitin, into N-acetylglucosamine oligomers [28,29]. We determined the chitinase levels of 8-day-old infected seedlings. Both Keumkang and SynDT cultivars showed a gradual reduction in chitinase levels at the time of LR exposure. However, at 6 and 24 hpi, the chitinase activity of the SynDT cultivar was significantly higher than that of Keumkang (1.6-fold and 1.4-fold, respectively) (Figure 6A, Table S8). Furthermore, the transcript levels of CHI8, a chitinase-encoding gene, were upregulated when Keumkang and SynDT lines were infected with LR, and SynDT showed the highest expression at 6 hpi (Figure 6B, Table S8). There was no difference in the transcript levels of CHI8 at 24 hpi, indicating that CHI8 is an early responsive gene during infection, especially in the SynDT cultivar. We also checked the transcript levels of the PR genes involved in systemic acquired resistance (SAR) [30]. Among the PR genes, PR4 encodes the chitin-binding protein [31]. We found that the expression levels of PR4 were upregulated in response to LR (Figure 6C, Table S8). At 6 hpi, the SynDT line had significantly higher PR4 levels than Keumkang. The transcript levels of PR4 in SynDT substantially increased at 24 hpi. Between parent wheats, T. durum #24 showed a greater induction of PR4 transcript levels compared to that of Ae. tauschii #52 at 6 and 24 hpi.
ß-1,3-Glucan, a substrate of β-1,3-glucanase, is another important component of the fungal cell wall. In combination with chitinase, β-1,3-glucanase catalyzes the hydrolytic cleavage of β-1,3/1,6-glucans in the cell wall [32,33]. In our study, in response to LR, the glucanase levels of Keumkang and SynDT were similar at 6 hpi but decreased in the SynDT line at 24 hpi (Figure 7A, Table S9). Moreover, the PR2 gene, which encodes proteins with β-endoglucanase activity, was more induced in SynDT at 6 and 24 hpi, compared to Keumkang. PR2 was also highly expressed in Ae. tauschii #52 (Figure 7B, Table S9). Numerous studies have shown the upregulation of PR genes in plants in response to pathogenic infections [34,35,36]. Both PR2 and PR4 are considered important proteins that can be targeted in the fungal cell wall, thereby leading to fungal death. The coaction of PR genes can increase the resistance to pathogenic attacks in plants [37]. Therefore, the upregulation of PR2 and PR4 in the SynDT line can partially explain its resistant phenotype. β-1,3-glucanase and chitinase belong to the PR2 and PR4 families, respectively. Moreover, it is known that chitinase, along with β-1,3-glucanase, can inhibit the hyphal growth of many pathogenic species [38]. Our results reconfirmed that chitinase is the primary enzyme responsible for LR resistance in the SynDT wheat cultivar.
We further checked peroxidase activity and observed that the levels of peroxidase increased gradually in response to LR in both Keumkang and SynDT, but it was slightly higher in the latter (Figure 8, Table S10). The enzyme peroxidase is crucial for the synthesis of lignin, leading to cell wall lignification, which serves as a physical barrier against infections [39]. In plants, protective levels vary, which are determined by specific enzyme activity, enzyme concentration and localization inside cells, host–pathogen interactions, and fungal characteristics [39]. Therefore, the study on defensive responses is complicated. In our study, the combination of different antifungal proteins, especially chitinase activity, could be involved in the cascade to prevent LR in SynDT cultivar.
Lastly, Lr34, which encodes the ATP-binding cassette (ABC) transporter, is a well-known LR resistance gene in many wheat cultivars [40]. Lr34 is located on chromosome 7DS and is one of the crucial resistance genes in wheat breeding because of its ability to inhibit multiple pathogenic species [39]. Our results showed that Lr34 had significantly higher expression levels in SynDT than in Keumkang (14.1-fold), particularly at 6 hpi (Figure 9, Table S11). Therefore, the fast response of Lr34 in SynDT may contribute to LR resistance.

4. Conclusions

Thus, in comparison to Keumkang, SynDT showed higher resistance to both HS and LR. SynDT is tolerant to HS, owing to the elite genes from its parents and fast-induced HSPs that protect cells from detrimental effects. SynDT also showed enhanced chitinase activity and high transcript levels of PR genes that help to cope with LR. Recently, the use of SHW in wheat breeding as a genetic resource has gained promising results for the improvement of common wheat worldwide. Furthermore, the possession of valuable genes in SynDT is critical in common wheat breeding for stress tolerance. In the future, SynDT can be used as a breeding material for local Korean bread wheat cultivars.

Supplementary Materials

The following are available online at https://www.mdpi.com/2073-4395/11/1/18/s1, Figure S1: Phenotype and recovery rates of Keumkang, Triticum durum #24, and Aegilops tauschii #52 in response to heat stress (HS). (A) Growth performance of Keumkang, T. durum #24, and Ae. tauschii #52 after 4 days of recovery from HS. (B) Recovery rates of Keumkang, T. durum #24, and Ae. tauschii #52 in response to HS. The experiments were conducted at least twice to verify that the results were consistent. Standard deviation value was calculated from three replicates in each treatment. One-way ANOVA and Tukey’s test (α = 0.05) were performed using SAS. Different letters (a, b, or c) indicate significant differences (p < 0.05). Figure S2: Phenotype, microscopy, and rust biomass of Keumkang, Triticum durum #24, and Aegilops tauschii #52 in response to leaf rust (LR). (A) Phenotype of Keumkang, T. durum #24, and Ae. tauschii #52 in response to LR. (B) Development of hyphae under the microscope in Keumkang, T. durum #24, and Ae. tauschii #52. (C) Quantification of the rust biomass of Keumkang, T. durum #24, and Ae. tauschii #52. The experiments were conducted at least twice to verify that the results were consistent. Standard deviation value was calculated from three replicates in each treatment. One-way ANOVA and Tukey’s test (α = 0.05) were performed using SAS. Different letters (a, b, or c) indicate significant differences (p < 0.05). Table S1: The lists of used primers in this study. Table S2: The lists of IWGCS RefSeqv1.1 gene name in this study. The IWGCS RefSeqv1.1 gene name of three HSPs genes used in this study were searched by using the BLAST tool from Ensembl Plants (http://plants.ensembl.org/index.html). Table S3: The accession number and sources of T. durum and Ae. tauschii in this study. The accession number of T. durum #24, and Ae. tauschii #52 were used in this study and the resources were provided for purchase purpose. Table S4: Grain morphology of all studied wheat cultivars in Figure 2. Grain weight (in grams—g), grain width (in millimeter s–mm), and grain length (mm) of Keumkang, SynDT #1 and #2, T. durum #24, and Ae. tauschii #52. Standard deviation value was calculated from three replicates in each treatment. The data represent the mean of three technical replicates and standard deviation (mean ± SD). Table S5: The recovery rates of Keumkang, SynDT #1, and SynDT #2 in Figure 3C. Six-day-old wheat seedlings were exposed to HS at 45 °C for 8 h for 1, 2, or 3 consecutive days. The percentages (%) of survival plants were obtained 4 days after HS treatment. The experiments were conducted at least twice to verify that the results were consistent. Standard deviation value was calculated from three replicates in each treatment. The data represent the mean of three technical replicates and standard deviation (mean ± SD). Table S6: Transcript levels of HSP genes (HSP17.3, HSP70.1, HSP101b) in response to HS in Figure 4. Six-day-old wheat seedlings were exposed to HS at 45 °C for 4 and 8 h. The samples were collected for RNA extraction and cDNA synthesis. Actin97 was used as the internal control. The experiments were conducted at least twice to verify that the results were consistent. Standard deviation value was calculated from three replicates in each treatment. The data represent the mean of three technical replicates and standard deviation (mean ± SD). Table S7: The rust biomass of Keumkang and SynDT #1 and #2 in response to LR infection in Figure 5C. Eight-day-old seedlings were exposed to LR. After 10 days, a picture was taken, and samples were collected for observations under a microscope or to quantify LR. The experiments were conducted at least twice to verify that the results were consistent. The data represent the mean of three technical replicates and standard deviation (mean ± SD). Table S8: Chitinase levels, the transcript levels of CHI8, the relative expression levels of PR4 and in response to LR infection at 0, 6, and 24 hpi in Figure 6. Eight-day-old seedlings were exposed to LR. The samples were collected after 0, 6, and 24 hpi for enzymatic assay or to measure the transcript levels. The experiments were conducted at least twice to verify that the results were consistent. Standard deviation value was calculated from three replicates in each treatment. The data represent the mean of three technical replicates and standard deviation (mean ± SD). Table S9: Glucanase levels, relative expression levels of PR2 in response to LR infection at 0, 6, and 24 hpi in Figure 7. Eight-day-old seedlings were exposed to LR. Samples were collected after 0, 6, and 24 hpi for enzymatic assay or to measure transcript levels. The experiments were conducted at least twice to verify that the results were consistent. Standard deviation value was calculated from three replicates in each treatment. The data represent the mean of three technical replicates and standard deviation (mean ± SD). Table S10: Levels of peroxidase in Keumkang and SynDT #1 in response to LR at 0, 6, and 24 hpi in Figure 8. Eight-day-old seedlings were exposed to LR. Samples were collected after 0, 6, and 24 hpi for enzymatic assay. The experiments were conducted at least twice to verify that the results were consistent. Standard deviation value was calculated from three replicates in each treatment. The data represent the mean of three technical replicates and standard deviation (mean ± SD). Table S11: Relative transcript levels of Lr34 gene in Keumkang, SynDT #1 in response to leaf rust (LR) at 0, 6, and 24 hpi in Figure 9. Eight-day-old seedlings were exposed to LR. Samples were collected after 0, 6, and 24 hpi for RNA extraction and cDNA synthesis. Actin97 was used as internal control. The experiments were conducted at least twice to verify that the results were consistent. Standard deviation value was calculated from three replicates in each treatment. The data represent the mean of three technical replicates and standard deviation (mean ± SD).

Author Contributions

Data curation, H.A.T., H.L. (Hyeri Lee), M.K. and S.W.H.; Formal analysis, H.A.T.; Supervision, S.W.H. and H.L. (Hojoung Lee); Writing—original draft, H.A.T.; Writing—review and editing, H.A.T. and H.L. (Hyeri Lee). All authors have read and agreed to the published version of the manuscript.

Funding

This work was funded by the National Institute of Crop Science, Rural Development Administration, Republic of Korea (to Hojoung Lee, grant number PJ012496022018), and the National Research Foundation of Korea (to Hojoung Lee, 2019; grant NRF-2019R1A2C1088417) and by a Korea University Grant.

Conflicts of Interest

The authors declare no conflict of interests.

References

  1. Rana, R.M.; Bilal, M.; Rehman, S.U.; Iqbal, F.; Shah, M.K.N. Synthetic Wheat; a New Hope for the Hungry World. Asian J. Agric. Biol. 2013, 1, 91–94. [Google Scholar]
  2. Li, J.; Wan, H.-S.; Yang, W.-Y. Synthetic hexaploid wheat enhances variation and adaptive evolution of bread wheat in breeding processes. J. Syst. Evol. 2014, 52, 735–742. [Google Scholar] [CrossRef]
  3. Greveniotis, V.; Zotis, S.; Sioki, E.; Ipsilandis, C.; Breeding, A. Concept to improve the performance of locally cultivated bread wheat (Triticum aestivum L.) cultivars. Czech J. Genet. Plant Breed. 2019, 56, 1–8. [Google Scholar] [CrossRef]
  4. Das, M.K.; Bai, G.; Mujeeb-Kazi, A.; Rajaram, S. Genetic diversity among synthetic hexaploid wheat accessions (Triticum aestivum) with resistance to several fungal diseases. Genet. Resour. Crop Evol. 2016, 63, 1285–1296. [Google Scholar] [CrossRef]
  5. Li, A.; Liu, D.; Yang, W.; Kishii, M.; Mao, L. Synthetic hexaploid wheat: Yesterday, today, and tomorrow. Engineering 2018, 4, 552–558. [Google Scholar] [CrossRef]
  6. Duplessis, S.; Bakkeren, G.; Hamelin, R. Chapter Six-Advancing Knowledge on Biology of Rust Fungi Through Genomics. In Advances in Botanical Research; Martin, F.M., Ed.; Academic Press: Cambridge, MA, USA, 2014; Volume 70, pp. 173–209. [Google Scholar]
  7. Draz, I.S.; Abou-Elseoud, M.S.; Kamara, A.-E.M.; Alaa-Eldein, O.A.-E.; El-Bebany, A.F. Screening of wheat genotypes for leaf rust resistance along with grain yield. Ann. Agric. Sci. 2015, 60, 29–39. [Google Scholar] [CrossRef] [Green Version]
  8. Mohler, V.; Schmolke, M.; Zeller, F.J.; Hsam, S.L.K. Genetic analysis of Aegilops tauschii-derived seedling resistance to leaf rust in synthetic hexaploid wheat. J. Appl. Genet. 2020, 61, 163–168. [Google Scholar] [CrossRef] [Green Version]
  9. Gyani, P.C.; Sharma, J.B.; Vinod; Mallik, N.; Jha, S.K. Inheritance and molecular mapping of leaf rust resistance gene in hexaploid wheat synthetic 45. Indian J. Genet. Plant Breed. 2017, 77, 214. [Google Scholar] [CrossRef]
  10. Zaidi, N.W.; Dar, M.H.; Singh, S.; Singh, U.S. Chapter 38 Trichoderma species as Abiotic Stress Relievers in Plants. In Biotechnology and Biology of Trichoderma; Gupta, V.K., Schmoll, M., Herrera-Estrella, A., Upadhyay, R.S., Druzhinina, I., Tuohy, M.G., Eds.; Elsevier: Amsterdam, The Netherlands, 2014; pp. 515–525. [Google Scholar]
  11. Pareek, A.; Dhankher, O.P.; Foyer, C.H. Mitigating the impact of climate change on plant productivity and ecosystem sustainability. J. Exp. Bot. 2020, 71, 451–456. [Google Scholar] [CrossRef]
  12. Akter, N.; Rafiqul Islam, M. Heat stress effects and management in wheat. A Review. Agron. Sustain. Dev. 2017, 37. [Google Scholar] [CrossRef]
  13. Cossani, C.M.; Reynolds, M.P. Heat Stress Adaptation in elite lines derived from synthetic hexaploid wheat. Crop. Sci. 2015, 55, 2719–2735. [Google Scholar] [CrossRef]
  14. Elbashir, A.A.E.; Gorafi, Y.S.A.; Tahir, I.S.A.; Kim, J.S.; Tsujimoto, H. Wheat multiple synthetic derivatives: A new source for heat stress tolerance adaptive traits. Breed. Sci. 2017, 67, 248–256. [Google Scholar] [CrossRef] [PubMed] [Green Version]
  15. Huseynova, I.M.; Guliyeva, F.B.; Rustamova, S.M.; Aliyev, J.A. PCR-Based Molecular Markers Linked to the Leaf Rust Resistance Gene Lr19 in Different Bread Wheat Cultivars. Adv. Biol. Chem. 2013, 3, 153–158. [Google Scholar] [CrossRef] [Green Version]
  16. Truong, H.A.; Lee, W.J.; Kishii, M.; Hong, S.-W.; Kang, C.-S.; Lee, B.C.; Lee, H. Assessment of synthetic hexaploid wheats in response to heat stress and leaf rust infection for the improvement of wheat production. Crop. Pasture Sci. 2019, 70, 837–848. [Google Scholar] [CrossRef]
  17. Jeong, C.Y.; Lee, W.J.; Truong, H.A.; Truon, C.S.; Hong, S.-W.; Lee, H. AtMybL-O modulates abscisic acid biosynthesis to optimize plant growth and aba signaling in response to drought stress. Appl. Biol. Chem. 2018, 61, 473–477. [Google Scholar] [CrossRef]
  18. Rasheed, A.; Xia, X.; Ogbonnaya, F.; Mahmood, T.; Zhang, Z.; Mujeeb-Kazi, A.; He, Z. Genome-wide association for grain morphology in synthetic hexaploid wheats using digital imaging analysis. BMC Plant Biol. 2014, 14, 128. [Google Scholar] [CrossRef] [Green Version]
  19. Gan, Y.; Stobbe, E.H. Seedling vigor and grain yield of ‘Roblin’ wheat affected by seed size. Agron.J. 1996, 88, 456–460. [Google Scholar] [CrossRef]
  20. Mujeeb-Kazi, A.; Gul, A.; Ahmad, I.; Farooq, M.; Rizwan, S.; Bux, H.; Iftikhar, S.; Asad, S.; Delgado, R. Aegilops tauschii, as a spot blotch (Cochliobolus sativus) resistance source for bread wheat improvement. Pak. J. Bot. 2007, 39, 1207–1216. [Google Scholar]
  21. Reynolds, M.; Dreccer, F.; Trethowan, R. Drought-adaptive traits derived from wheat wild relatives and landraces. J. Exp. Bot. 2007, 58, 177–186. [Google Scholar] [CrossRef] [Green Version]
  22. Waters, E.R.; Lee, G.J.; Vierling, E. Evolution, structure, and function of the small heat shock proteins in plants. J. Exp. Bot. 1996, 47, 325–338. [Google Scholar] [CrossRef]
  23. Park, C.J.; Seo, Y.S. Heat shock proteins: A review of the molecular chaperones for plant immunity. Plant Pathol. J. 2015, 31, 323–333. [Google Scholar] [CrossRef] [Green Version]
  24. Kumar, R.R.; Singh, G.P.; Sharma, S.K.; Singh, K.; Goswami, S.; Rai, R.D. Molecular cloning of HSP17 gene (SHSP) and their differential expression under exogenous putrescine and heat shock in wheat (Triticum aestivum). Afr. J. Biotechnol. 2012, 11, 16800–16808. [Google Scholar]
  25. Duan, Y.H.; Guo, J.; Ding, K.; Wang, S.J.; Zhang, H.; Dai, X.W.; Chen, Y.Y.; Govers, F.; Huang, L.L.; Kang, Z.S. Characterization of a wheat HSP70 Gene and its expression in response to stripe rust infection and abiotic stresses. Mol. Biol. Rep. 2011, 38, 301–307. [Google Scholar] [CrossRef] [PubMed]
  26. Parsell, D.A.; Lindquist, S. The function of heat-shock proteins in stress tolerance: Degradation and reactivation of damaged proteins. Annu. Rev. Genet. 1993, 27, 437–496. [Google Scholar] [CrossRef] [PubMed]
  27. Young, T.E.; Ling, J.; Geisler-Lee, C.J.; Tanguay, R.L.; Caldwell, C.; Gallie, D.R. Developmental and thermal regulation of the maize heat shock protein, HSP101. Plant Physiol. 2001, 127, 777–791. [Google Scholar] [CrossRef] [PubMed]
  28. Mohammadi, M.; Roohparvar, R.; Torabi, M. Induced chitinase activity in resistant wheat leaves inoculated with an incompatible race of Puccinia striiformis f. sp. tritici, the causal agent of yellow rust disease. Mycopathologia 2002, 154, 119–126. [Google Scholar] [CrossRef] [PubMed]
  29. Toufiq, N.; Tabassum, B.; Bhatti, M.U.; Khan, A.; Tariq, M.; Shahid, N.; Nasir, I.A.; Husnain, T. Improved antifungal activity of barley derived chitinase I gene that overexpress a 32 KDa recombinant chitinase in Escherichia coli host. Braz. J. Microbiol. 2018, 49, 414–421. [Google Scholar] [CrossRef] [PubMed]
  30. Zhang, J.; Du, X.; Wang, Q.; Chen, X.; Lv, D.; Xu, K.; Qu, S.; Zhang, Z. Expression of pathogenesis related genes in response to salicylic acid, methyl jasmonate and 1-aminocyclopropane-1-carboxylic acid in Malus hupehensis (Pamp.) Rehd. BMC Res. Notes 2010, 3, 208. [Google Scholar] [CrossRef] [Green Version]
  31. Selitrennikoff, C.P. Antifungal proteins. Appl. Environ. Microbiol. 2001, 67, 2883–2894. [Google Scholar] [CrossRef] [Green Version]
  32. Balasubramanian, V.; Vashisht, D.; Cletus, J.; Sakthivel, N. Plant β-1,3-glucanases: Their biological functions and transgenic expression against phytopathogenic fungi. Biotechnol. Lett. 2012, 34, 1983–1990. [Google Scholar] [CrossRef]
  33. Gupta, P.; Ravi, I.; Sharma, V. Induction of β-1,3-glucanase and chitinase activity in the defense response of Eruca sativa plants against the fungal pathogen Alternaria brassicicola. J. Plant Interact. 2013, 8, 155–161. [Google Scholar] [CrossRef]
  34. Ali, S.; Mir, Z.A.; Tyagi, A.; Bhat, J.A.; Chandrashekar, N.; Papolu, P.K.; Rawat, S.; Grover, A. identification and comparative analysis of Brassica juncea pathogenesis-related genes in response to hormonal, biotic and abiotic stresses. Acta Physiol. Plant. 2017, 39, 268. [Google Scholar] [CrossRef]
  35. Zhang, H.; Qiu, Y.; Yuan, C.; Chen, X.; Huang, L. Fine-Tuning of PR genes in wheat responding to different Puccinia rust species. J. Plant Physiol. Pathol. 2018, 6. [Google Scholar] [CrossRef]
  36. Li, X.-Y.; Gao, L.; Zhang, W.-H.; Liu, J.-K.; Zhang, Y.-J.; Wang, H.-Y.; Liu, D.-Q. Characteristic expression of wheat PR5 gene in response to infection by the leaf rust pathogen, Puccinia triticina. J. Plant Interact. 2015, 10, 132–141. [Google Scholar] [CrossRef]
  37. Ali, S.; Ganai, B.A.; Kamili, A.N.; Bhat, A.A.; Mir, Z.A.; Bhat, J.A.; Tyagi, A.; Islam, S.T.; Mushtaq, M.; Yadav, P.; et al. Pathogenesis-related proteins and peptides as promising tools for engineering plants with multiple stress tolerance. Microbiol. Res. 2018, 212–213, 29–37. [Google Scholar] [CrossRef]
  38. Boller, T. Antimicrobial Functions of the Plant Hydrolases, Chitinase and ß-1,3-Glucanase. In Mechanisms of Plant Defense Responses; Fritig, B., Legrand, M., Eds.; Springer: Dordrecht, The Netherlands, 1993; pp. 391–400. [Google Scholar]
  39. Yusupova, Z.R.; Khairullin, R.M.; Maksimov, I.V. The activity of peroxidase in various cell fractions of wheat plants infected with Septoria nodorum Berk. Russ. J. Plant Physiol. 2006, 53, 807–813. [Google Scholar] [CrossRef]
  40. German, S.E.; Kolmer, J.A. Effect of gene Lr34 in the enhancement of resistance to leaf rust of wheat. Theoret. J. Appl. Genet. 1992, 84, 97–105. [Google Scholar] [CrossRef]
Figure 1. Procedure for generation and confirmation of synthetic wheat lines. (A) Rescue and growth of embryo of synthetic grains. (1) The embryo of synthetic grains. (2) One-week-old synthetic plants. (3) Two-week-old synthetic plants. (4) One-month old synthetic plants. (B) Procedure of colchicine treatment. (1) The ready and mature plants for colchicine treatment. (2) The soil from the root sites was removed, along with small, weak leaves. (3) The roots were washed with water and allowed to dry for 30 min. (4) The plants were immersed in colchicine solution and aerated for 6 h. (5) The plants were rinsed for 30 min with water. (6) The treated plants were re-planted inside the pots. (C) Spike of SynDT. (D) Confirmation of D genome in SynDT using a SCS253 marker.
Agronomy 11 00018 g001
Figure 2. Grain morphology of all studied wheat cultivars. (A) Pictures of grain morphology of Keumkang, SynDT #1 and #2, T. durum #24, and Ae. tauschii #52. (B) Grain dimensions of Keumkang, SynDT #1 and #2, T. durum #24, and Ae. tauschii #52. (C) Weight of 100 grains of Keumkang, SynDT #1 and #2, T. durum #24, and Ae. tauschii #52. Standard deviation value was calculated from three replicates in each treatment. One-way ANOVA and Tukey’s test (α = 0.05) were performed using Statistical Analysis System (SAS). Different letters (a, b, or c) indicate significant differences (p < 0.05).
Agronomy 11 00018 g002
Figure 3. Growth performance of Keumkang and SynDT #1 and #2 in response to HS. (A) The phenotype of Keumkang, SynDT #1, and SynDT #2 after 4 days of recovery from HS at 45 °C for 8 h/day. (B) The criteria to distinguish between unrecovered and recovered plants from HS. (C) The recovery rates of Keumkang, SynDT #1, and SynDT #2. Six-day-old wheat seedlings were exposed to HS at 45 °C for 8 h for 1, 2, or 3 consecutive days. The pictures and quantification data were obtained 4 days after HS treatment. The experiments were conducted at least twice to verify that the results were consistent. Standard deviation value was calculated from three replicates in each treatment. One-way ANOVA and Tukey’s test (α = 0.05) were performed using SAS. Different letters (a, b, or c) indicate significant differences (p < 0.05).
Agronomy 11 00018 g003
Figure 4. Transcript levels of HSP genes in response to HS. (A) HSP17.3. (B) HSP70.1. (C) HSP101b. Six-day-old wheat seedlings were exposed to HS at 45 °C for 4 and 8 h. The samples were collected for RNA extraction and cDNA synthesis. Actin97 was used as the internal control. The experiments were conducted at least twice to verify that the results were consistent. Standard deviation value was calculated from three replicates in each treatment. One-way ANOVA and Tukey’s test (α = 0.05) were performed using SAS. Different letters (a, b, or c) indicate significant differences (p < 0.05).
Agronomy 11 00018 g004
Figure 5. Growth performance of Keumkang and SynDT #1 and #2 in response to LR infection. (A) The phenotype of Keumkang, SynDT #1, and SynDT #2 in response to LR. (B) The development of hyphae under the microscope. (C) The quantification of rust biomass. Eight-day-old seedlings were exposed to LR. After 10 days, a picture was taken, and samples were collected for observations under a microscope or to quantify LR. The experiments were conducted at least twice to verify that the results were consistent. The standard deviation value was calculated from three replicates in each treatment. One-way ANOVA and Tukey’s test (α = 0.05) were performed using SAS. Different letters (a, b, or c) indicate significant differences (p < 0.05).
Agronomy 11 00018 g005
Figure 6. Chitinase levels in response to LR infection. (A) The chitinase levels of Keumkang and SynDT #1 in response to LR at 0, 6, and 24 hpi. (B) The transcript levels of CHI8, chitinase-encoding enzymes in Keumkang and SynDT #1, in response to LR at 0, 6, and 24 hpi. (C) The relative expression levels of PR4 of Keumkang, SynDT #1, T. durum #24, and Ae. tauschii #52 in response to LR at 0, 6, and 24 hpi. Eight-day-old seedlings were exposed to LR. The samples were collected after 0, 6, and 24 hpi for enzymatic assay or to measure the transcript levels. The experiments were conducted at least twice to verify that the results were consistent. Standard deviation value was calculated from three replicates in each treatment. One-way ANOVA and Tukey’s test (α = 0.05) were performed using SAS. Different letters (a, b, or c) indicate significant differences (p < 0.05).
Agronomy 11 00018 g006
Figure 7. Glucanase levels in response to leaf rust (LR) infection. (A) Levels of glucanase in Keumkang and SynDT #1 in response to LR at 0, 6, and 24 hpi. (B) Relative expression levels of PR2 in Keumkang, SynDT #1, T. durum #24, and Ae. tauschii #52 in response to LR at 0, 6, and 24 hpi. Eight-day-old seedlings were exposed to LR. Samples were collected after 0, 6, and 24 hpi for enzymatic assay or to measure transcript levels. The experiments were conducted at least twice to verify that the results were consistent. Standard deviation value was calculated from three replicates in each treatment. One-way ANOVA and Tukey’s test (α = 0.05) were performed using SAS. Different letters (a, b, or c) indicate significant differences (p < 0.05).
Agronomy 11 00018 g007
Figure 8. Levels of peroxidase in Keumkang and SynDT #1 in response to leaf rust (LR) at 0, 6, and 24 hpi. Eight-day-old seedlings were exposed to LR. Samples were collected after 0, 6, and 24 hpi for enzymatic assay. The experiments were conducted at least twice to verify that the results were consistent. Standard deviation value was calculated from three replicates in each treatment. One-way ANOVA and Tukey’s test (α = 0.05) were performed using SAS. Different letters (a, b, or c) indicate significant differences (p < 0.05).
Agronomy 11 00018 g008
Figure 9. Relative transcript levels of Lr34 gene in Keumkang, SynDT #1 in response to leaf rust (LR) at 0, 6, and 24 hpi. Eight-day-old seedlings were exposed to LR. Samples were collected after 0, 6, and 24 hpi for RNA extraction and cDNA synthesis. Actin97 was used as internal control. The experiments were conducted at least twice to verify that the results were consistent. Standard deviation value was calculated from three replicates in each treatment. One-way ANOVA and Tukey’s test (α = 0.05) were performed using SAS. Different letters (a, b, or c) indicate significant differences (p < 0.05).
Agronomy 11 00018 g009
Publisher’s Note: MDPI stays neutral with regard to jurisdictional claims in published maps and institutional affiliations.

