Article

Screening of the Candidate DNA Barcodes for Three Important Amorphophallus Species Identification

1
State Key Laboratory of Hybrid Rice, College of Life Sciences, Wuhan University, Wuhan 430072, China
2
Institute of Konjac, Enshi Academy of Agricultural Sciences, Enshi 445000, China
3
Department of Biology, Faculty of Mathematics and Natural Sciences, Brawijaya University, Jl.Veteran Malang 65145, Indonesia
4
School of Chemistry, Chemical Engineering and Life Science, Wuhan University of Technology, Wuhan 430070, China
*
Authors to whom correspondence should be addressed.
Authors contribute equally to this work.
Agronomy 2020, 10(9), 1366; https://doi.org/10.3390/agronomy10091366
Submission received: 18 August 2020 / Revised: 3 September 2020 / Accepted: 7 September 2020 / Published: 11 September 2020
(This article belongs to the Section Crop Breeding and Genetics)

Abstract

:
Amorphophallus is widely distributed in Southeast Asia, Africa, and other places, with more than 170 species. Amorphophallus has high medicinal value and is commonly used in medicine. However, the current classification based on morphology is challenging in with regard to Amorphophallus and closely related species. This study used six barcodes, namely ITS2, matK, rcbL, nad1, trnH-psbA, and trnL-trnF, to evaluate their identification ability for three important Amorphophallus species, including A. konjac, A. albus, and A. muelleri. We recommend that trnH-psbA can be applied to the Amorphophallus trade, quickly identify the purity of A. konjac and A. albus and distinguish A. muelleri from its related species for A. konjac and A. albus genetic improvement.

1. Introduction

The Amorphophallus genus belongs to Araceae and is a perennial herb. It contains more than 170 species, mainly distributed throughout Asia and Africa [1]. Its tubers can produce many konjac glucomannan (KGM), which is widely used in medical fields [2]. Studies have found that KGM has therapeutic effects on many diseases, such as gastric cancer [3], inflammatory bowel disease [4], hyperglycemia, and hyperlipidemia [5,6], skin inflammation [7], and so on. KGM also has positive health effects, such as controlling body weight [8], maintaining a healthy intestinal flora ecology [9,10], etc. In the Amorphophallus market, the most widely traded are Amorphophallus konjac, followed by Amorphophallus albus. Among them, A. konjac has the highest glucomannan content, followed by A. albus [11]. Amorphophallus is usually made into dry chips for sale, and because there is no morphological difference between different Amorphophallus varieties, different Amorphophallus may be mixed in this process. This can lead to many problems, such as (1) mixed raw materials can cause economic losses to buyers or sellers, (2) mixed raw materials used in drug production can lead to insufficient efficacy or toxic effect, (3) diverse raw materials used in drug research can lead to wrong conclusions and affect new drugs’ development. Therefore, it is vital to identify the purity of Amorphophallus’ raw materials. The traditional classification of Amorphophallus is mainly based on the observation of leaves, petioles, tubers, buds, and flower organs [12], but in this case, it is impossible to classify according to these traits.
Amorphophallus muelleri is an important species of Amorphophallus, which belongs to the same subspecies as Amorphophallus bulbifer and Amorphophallus yuloensis [13]. Among those three species, only A. muelleri has varieties with a chromosome number of 2n = 26, which may be able to hybridize with A. konjac and A. albus. In addition, studies have found that A. muelleri has good disease resistance and heat tolerance propensity, and the content of KGM is also high [14]. Therefore, A. muelleri is an important germplasm resource for the genetic improvement of A. konjac and A. albus. But A. muelleri, A. bulbifer, and A. yuloensis are similar in morphology. Relying on morphology to distinguish them requires experts and is labor-intensive and time-consuming.
DNA barcode is a new technology that uses standard, short DNA sequences to quickly identify species [15]. It has been widely used in plants in many ways, such as distinction of species [16,17,18,19,20], assessment of biodiversity [21,22,23], the discovery of new species [24], and so on. With different studies, multiple single DNA barcodes have been proposed, such as the Chloroplast gene rbcL [25], matK [26], the plastid intergenic spacer trnH-psbA [27], and the nuclear ribosomal DNA internal transcribed region ITS/ITS2 [28,29,30,31]. Some combinations of barcodes have also been proposed, for example, in 2009, the Consortium for the Barcode of Life (CBOL) plant working group proposed rbcL + matK as the core barcode of plants [32]. Subsequently, Chinese scholars proposed to merge ITS/ ITS2 into a rbcL + matK core barcode as the barcode of seed plants [31].
In the genus Amorphophallus, some DNA fragments have been used to study the phylogenetic and genetic relationships of Amorphophallus species [1,33,34,35]. However, there is no such study of the classification of Amorphophallus species using DNA barcode.
In this study, we used six of the most widely used DNA barcodes (ITS2, matK, nad1, rbcL, trnL-trnF, trnH-psbA) to test their ability to identify Amorphophallus. Our objectives were to; (1) evaluate the performance of these six barcodes in those five (A. konjac, A. albus, A. muelleri, A. bulbifer, A. yuloensis) Amorphophallus species; and (2) to evaluate the classification efficiency of the six barcodes for A. konjac, A. albus, and A. muelleri. Based on the results, we will propose potential single-barcodes that are valuable to identify these three important Amorphophallus species.

2. Materials and Methods

2.1. Sampling Strategy

A total of 25 individuals of five Amorphophallus species (four A. bulbifer accessions, five A. konjac accessions, five A. albus accessions, five A. yuloensis accessions, and six A. muelleri accessions) were used for this study. Among them, A. konjac and A. albus were collected from Enshi, Hubei, China; A. bulbifer and A. muelleri were collected from Indonesia; A. yuloensis collected from Yunan, China. All the plants, as mentioned above, were transplanted in the Amorphophallus Resource Nursery of Wuhan University.
Healthy, fresh leaves of each plant were collected and dried immediately in silica gel for DNA extraction.

2.2. DNA Extraction, PCR Amplification, and Sequencing

Total genomic DNA was extracted from the dried leaves using the Plant Genomic DNA kit (Tiangen, Beijing, China) following the manufacturer’s protocol. DNA concentrations were estimated and standardized on 1.0% (w/v) agarose gels. Six barcodes were used, including a nuclear genome fragments ITS2, four chloroplast genome fragments matK, rbcL, trnL-trnF, and trnH-psbA, and one mitochondrial genome fragment nad1. The PCR reaction system includes 10 μL 2XSINGKE Master Mix (TSINGKE, Beijing, China), 1.5 μL (50 ng/μL) Template DNA, 6.9 μL ddH2O, 0.8 μL primer each. Their primers were all published (except for nad1), and their amplification procedures were improved (Table 1). PCR amplification was performed on a LifePro Thermal Cycler (BIOER, Hangzhou, China). The first generation of the two-terminal sequencing strategy was used to ensure the accuracy of the data. Purification and sequencing were completed in TSINGKE Biology Company (TSINGKE, Beijing, China).

2.3. Data Analysis

Raw sequences for each region were assembled and edited by SeqManTM, one of the LASERGENE software packages (DNASTAR, Inc. https://www.dnastar.com/), verified by a BLASTN search on GenBank. The sequence for subsequent analysis was uploaded to Genbank, and the Genbank serial number was obtained (Supplementary Table S1). Sequences were aligned using the ClustalW method in MEGA-X [42]. Then we removed the regions with low quality at the 5′and 3′ ends after sequence alignment. The sequence characteristics of the six regions were analyzed by DnaSP6 software [43]. We evaluated six barcodes’ classification efficiency using the Similarity-based method, Distance-based method, and Tree-based method. In the Similarity-based method, we used the “Best match” and “Best close match” algorithm from TaxonDNA software to test whether the matched query from the same species, the threshold is calculated by the “Pairwise Summary” function in this software [44]. The minimum interspecific distance should be greater than the maximum intraspecific distance in an ideal barcode, forming an obvious “Barcoding Gap” [45]. Therefore, we calculated pairwise genetic distances based on the Kimura 2-parameter (K2P) nucleotide substitution model obtained from MEGA-X [42]. The Automatic Barcode Gap Discovery (ABGD) program [46] was employed to test the identification ability of those barcodes, based on K2P distance; other settings were default values. Neighbor-joining (NJ) and Maximum-likelihood (ML) trees were constructed for each barcode by MEGA-X [42], based on a K2P distance model [47]. Relative support for the branches of the NJ and ML trees was assessed via 1000 bootstrap replicates. Only species with multiple individuals forming a monophyletic clade in trees with a bootstrap value above 70% were considered to be successfully identified. SPSS 22.0 software was used for all statistical calculations.

3. Results

3.1. Barcode Universality

With the universal primers, these six barcodes were successfully amplified in all samples. We sequenced a total of 150 sequences. Except for the failure of the trnH-psbA sequence of a sample, all others were successfully sequenced.

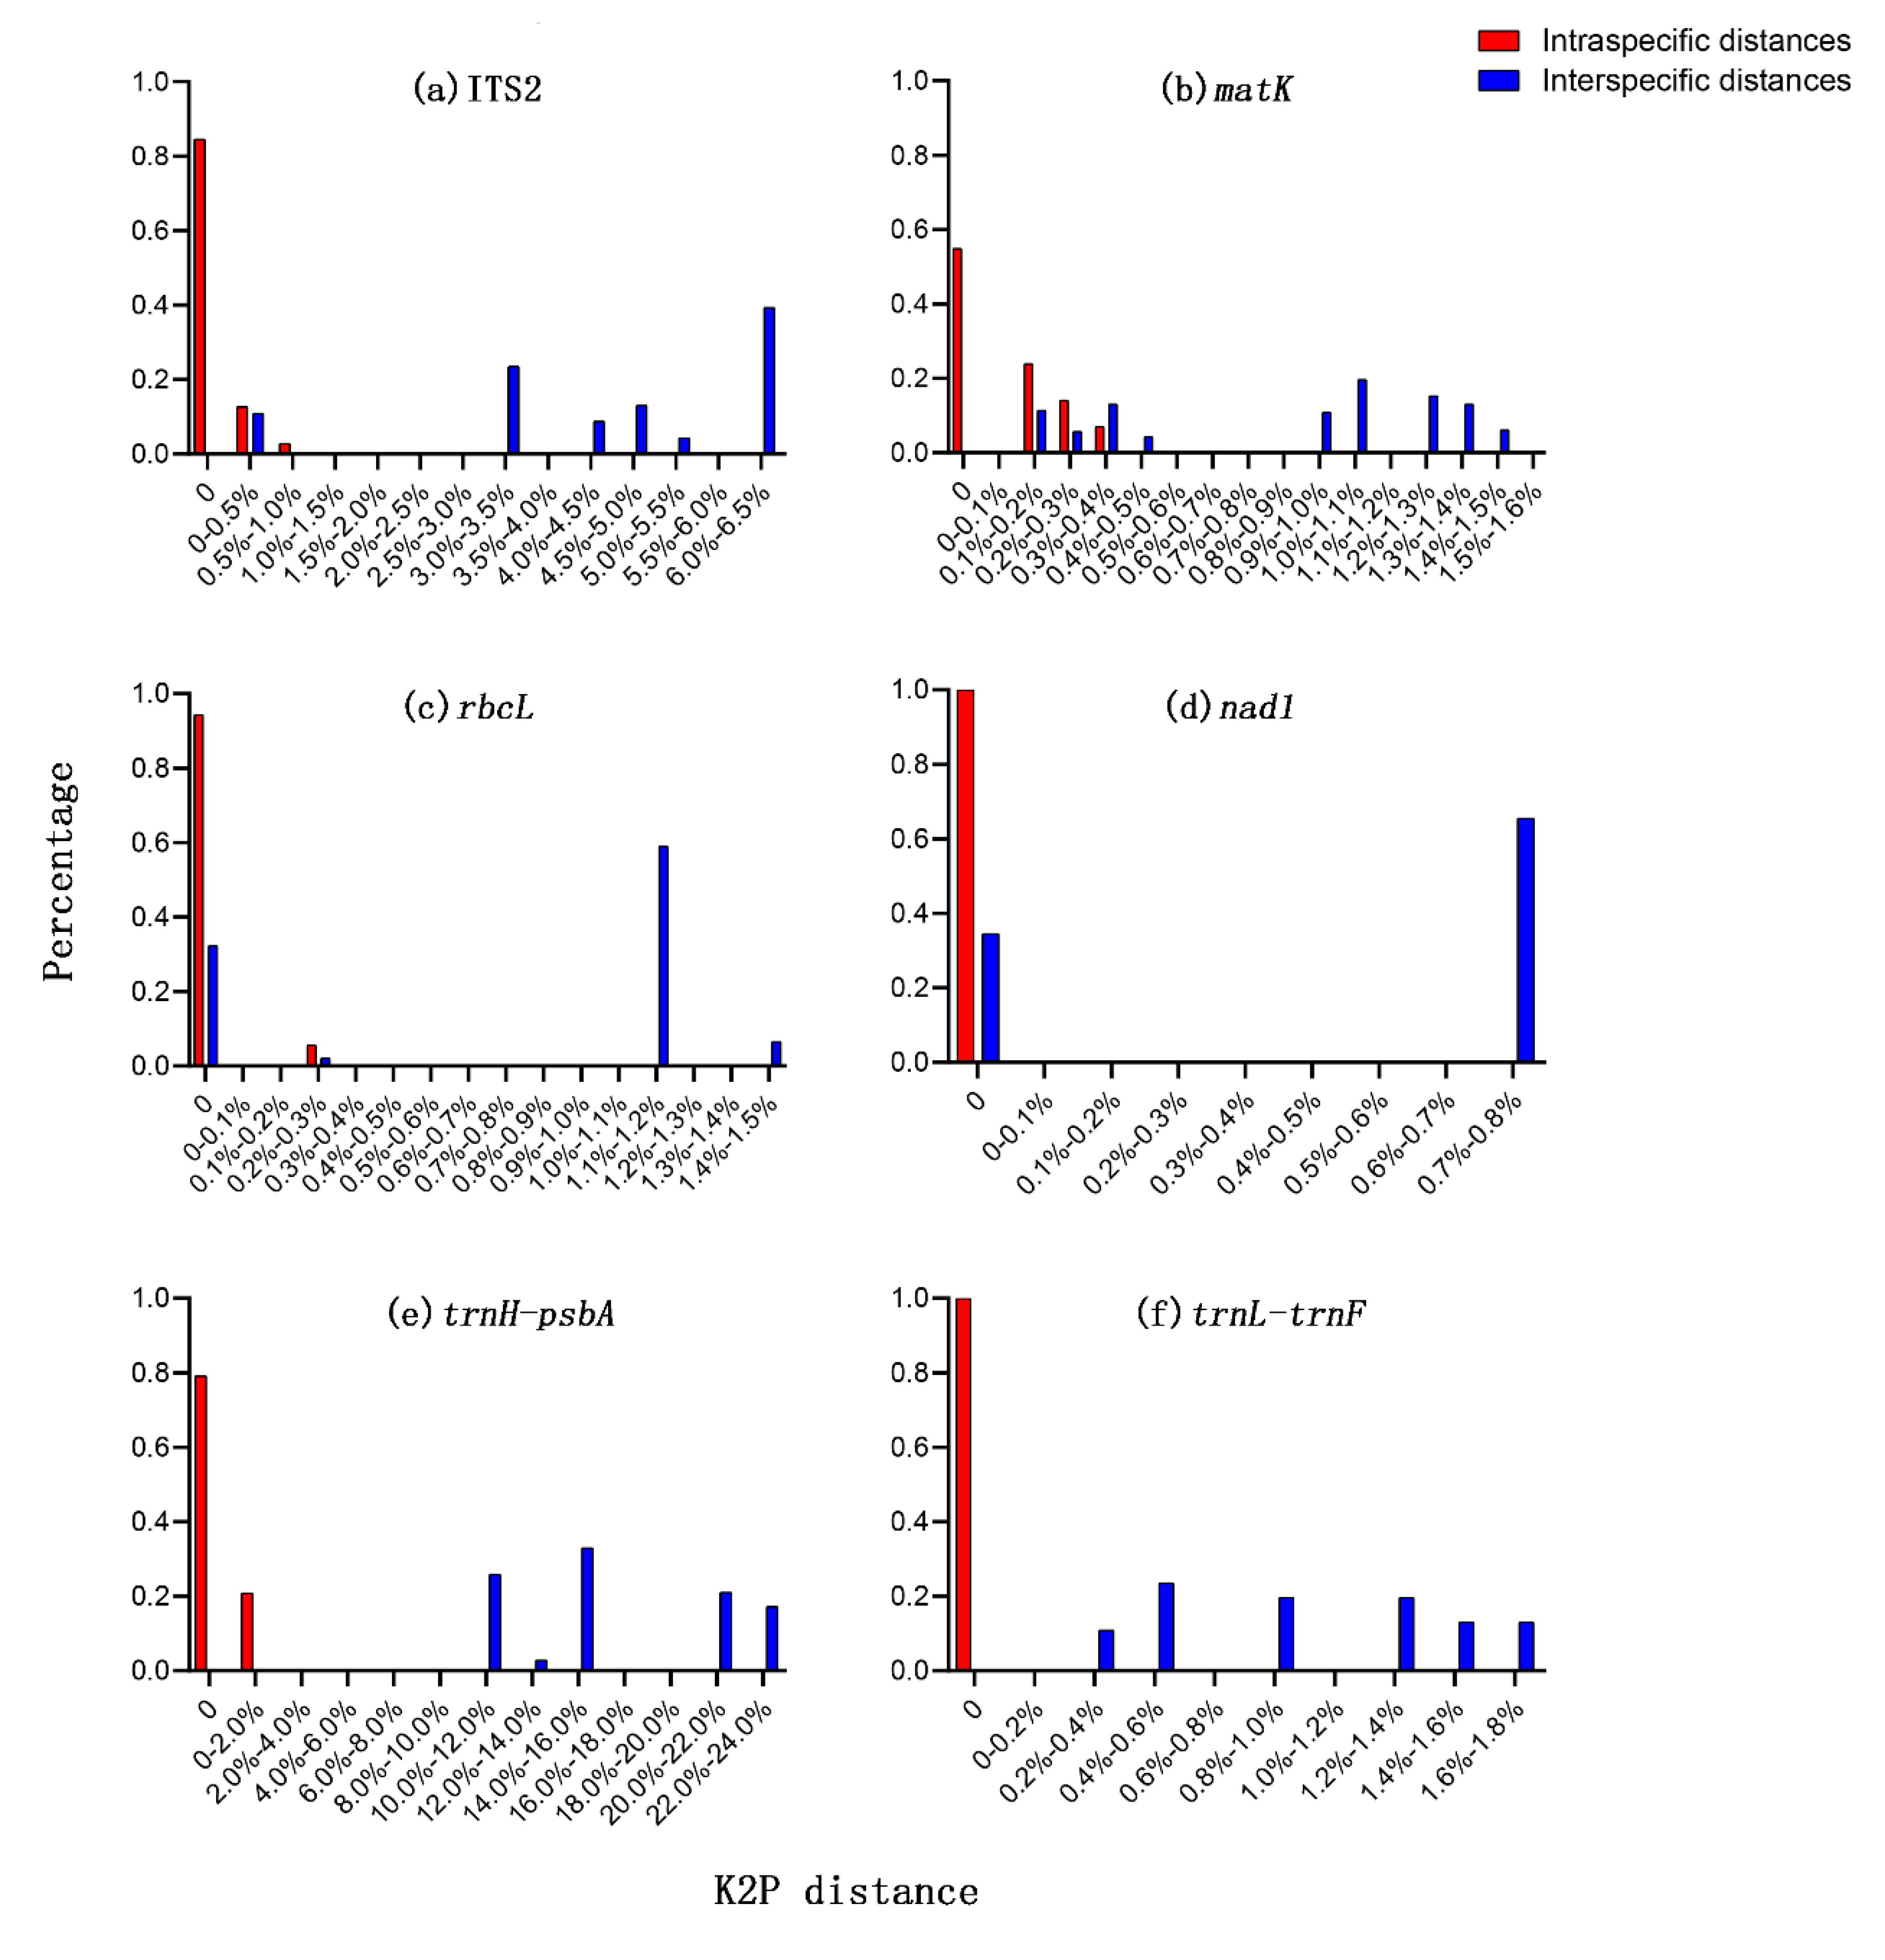
3.2. Sequence Characteristics

Among the six barcodes, nad1 showed the longest aligned sequence length (1255 bp) (Table 2); the shortest was trnL-trnF (410 bp). The highest ratio of variable sites and parsimony-informative sites was trnH-psbA (25.61%, 25.61%), followed by ITS2 (6.99%, 6.99%), trnL-trnF (1.71%, 1.71%), matK (1.68%, 1.68%), rbcL (1.47%, 1.17%), and the lowest was nad1 (0.72%, 0.72%). The largest interspecific distance was trnH-psbA, followed by ITS2, and the lowest was nad1. The lowest intraspecific distance was nad1 and trnL-trnF. The student’s t-test indicated that the interspecific distance of trnH-psbA was significantly greater (p < 0.05) than the remaining barcodes. See Table 2 for more details.

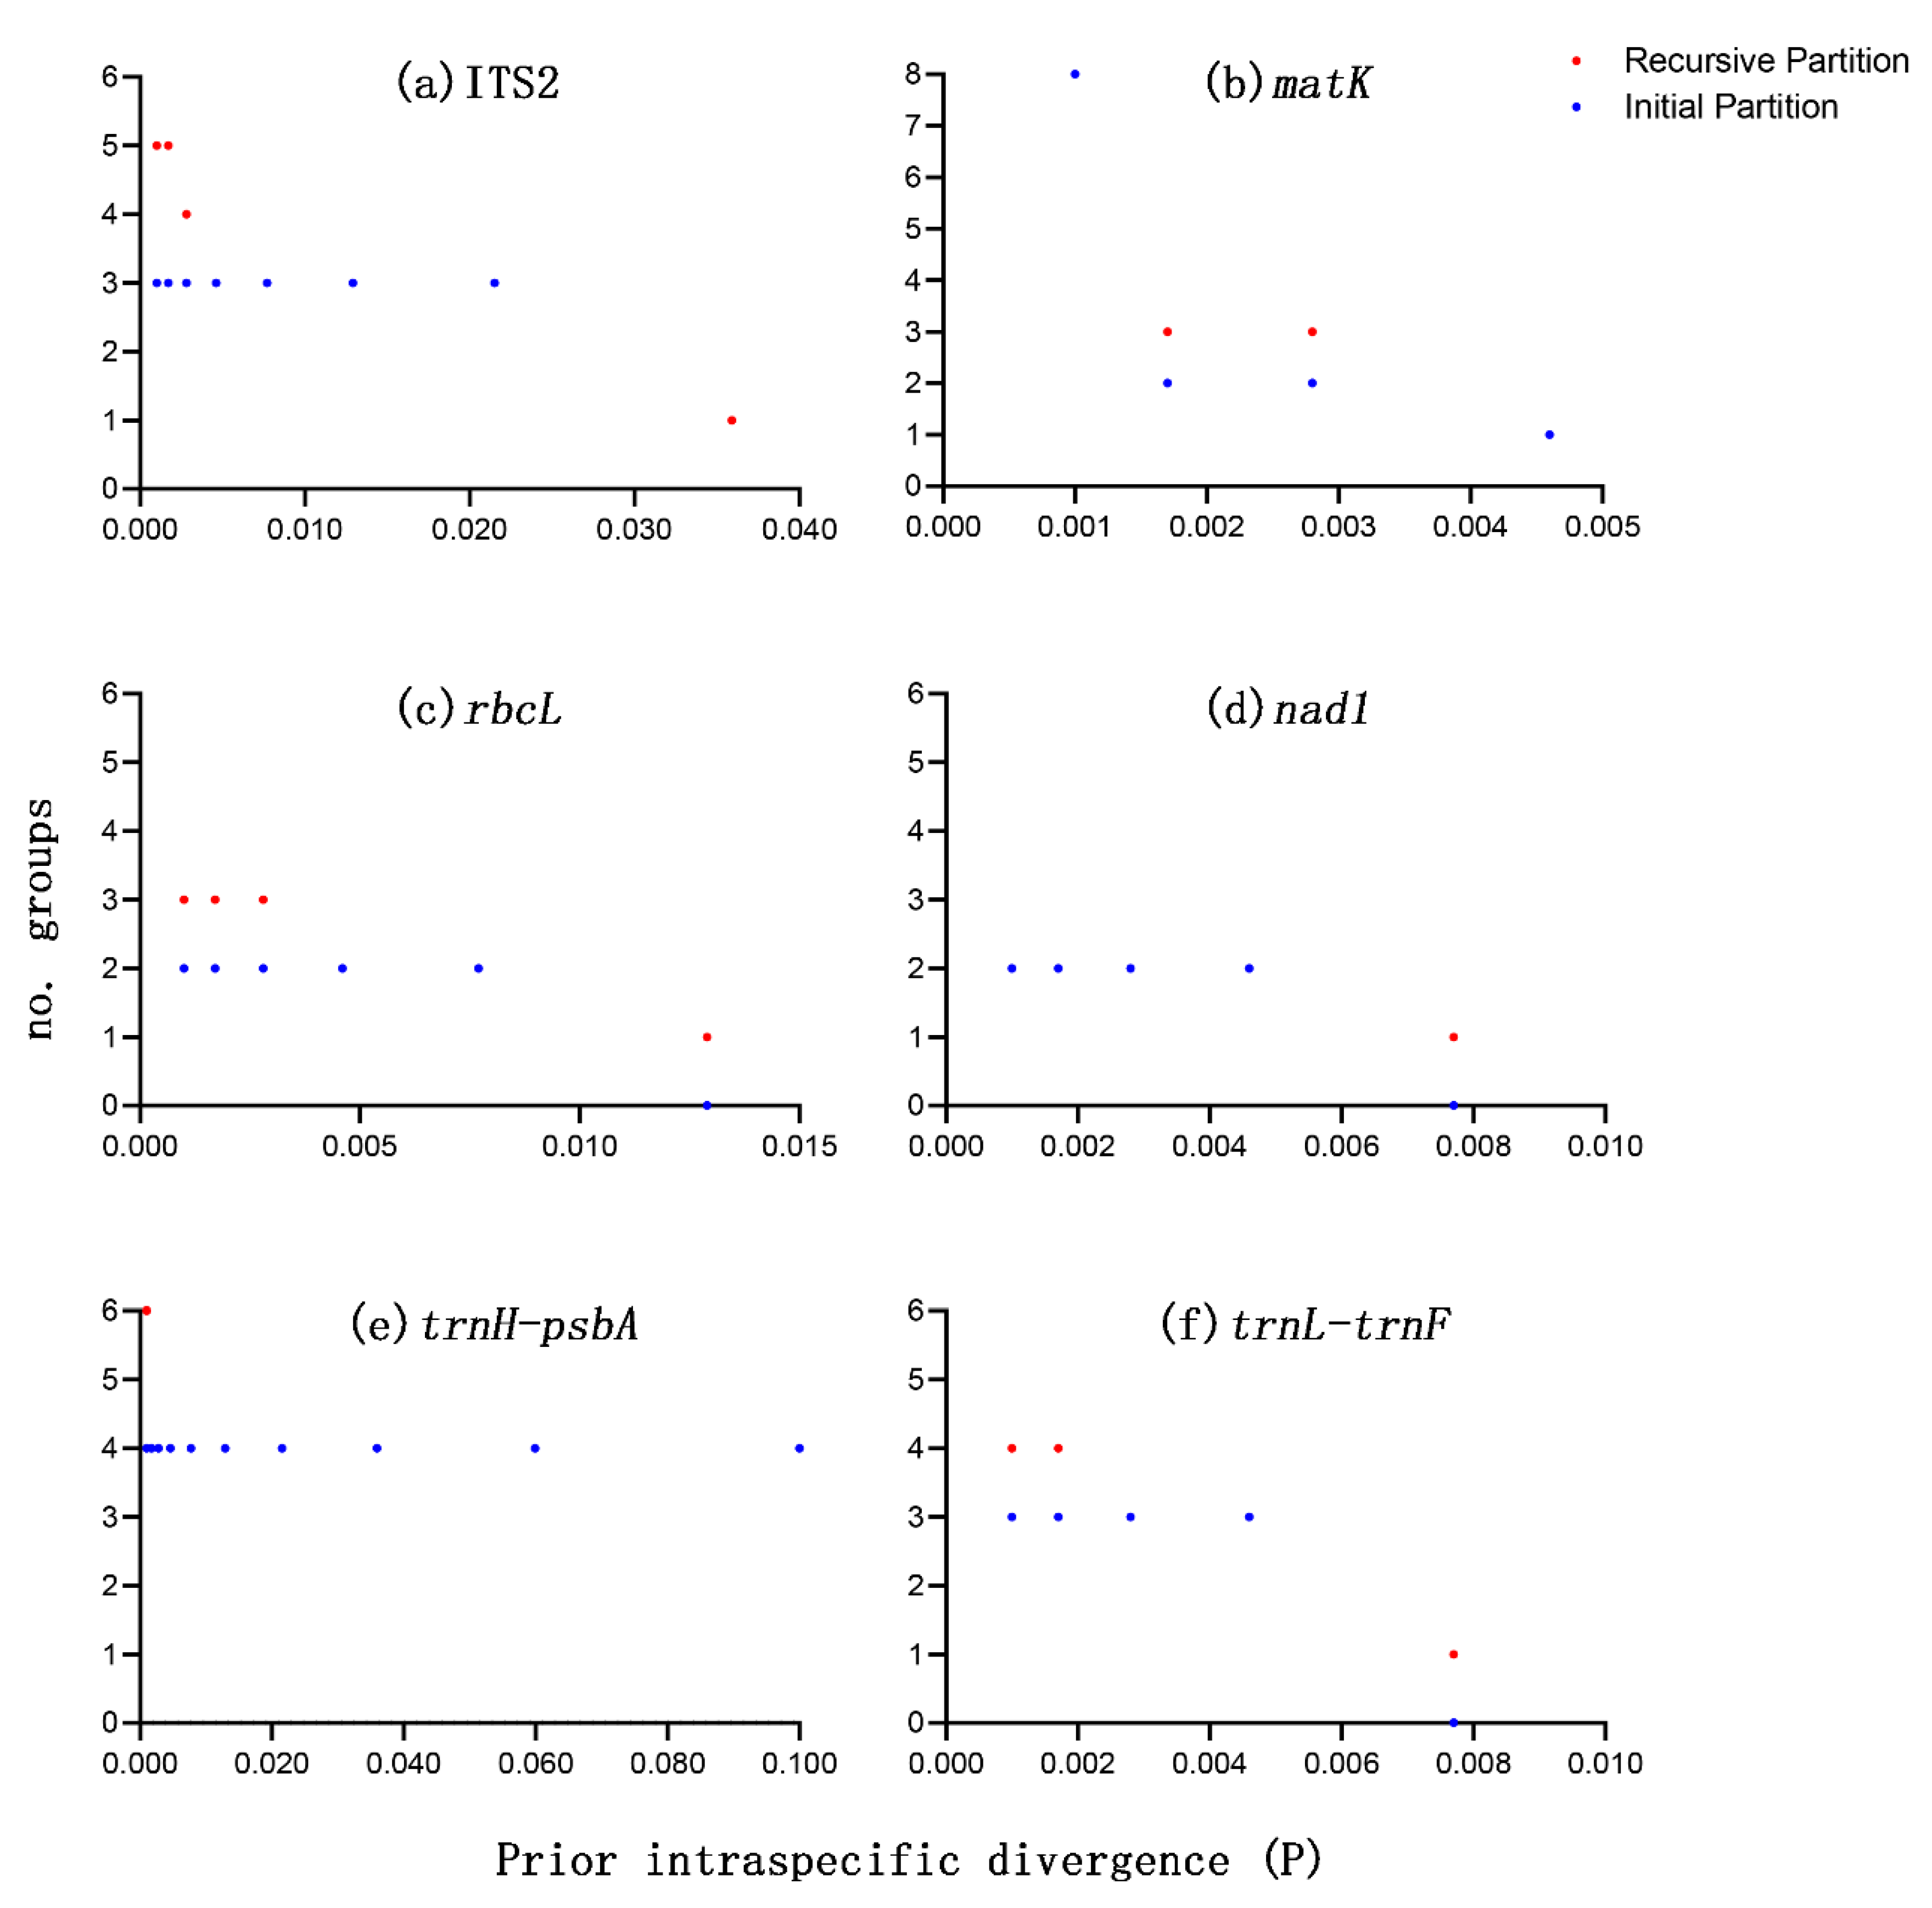
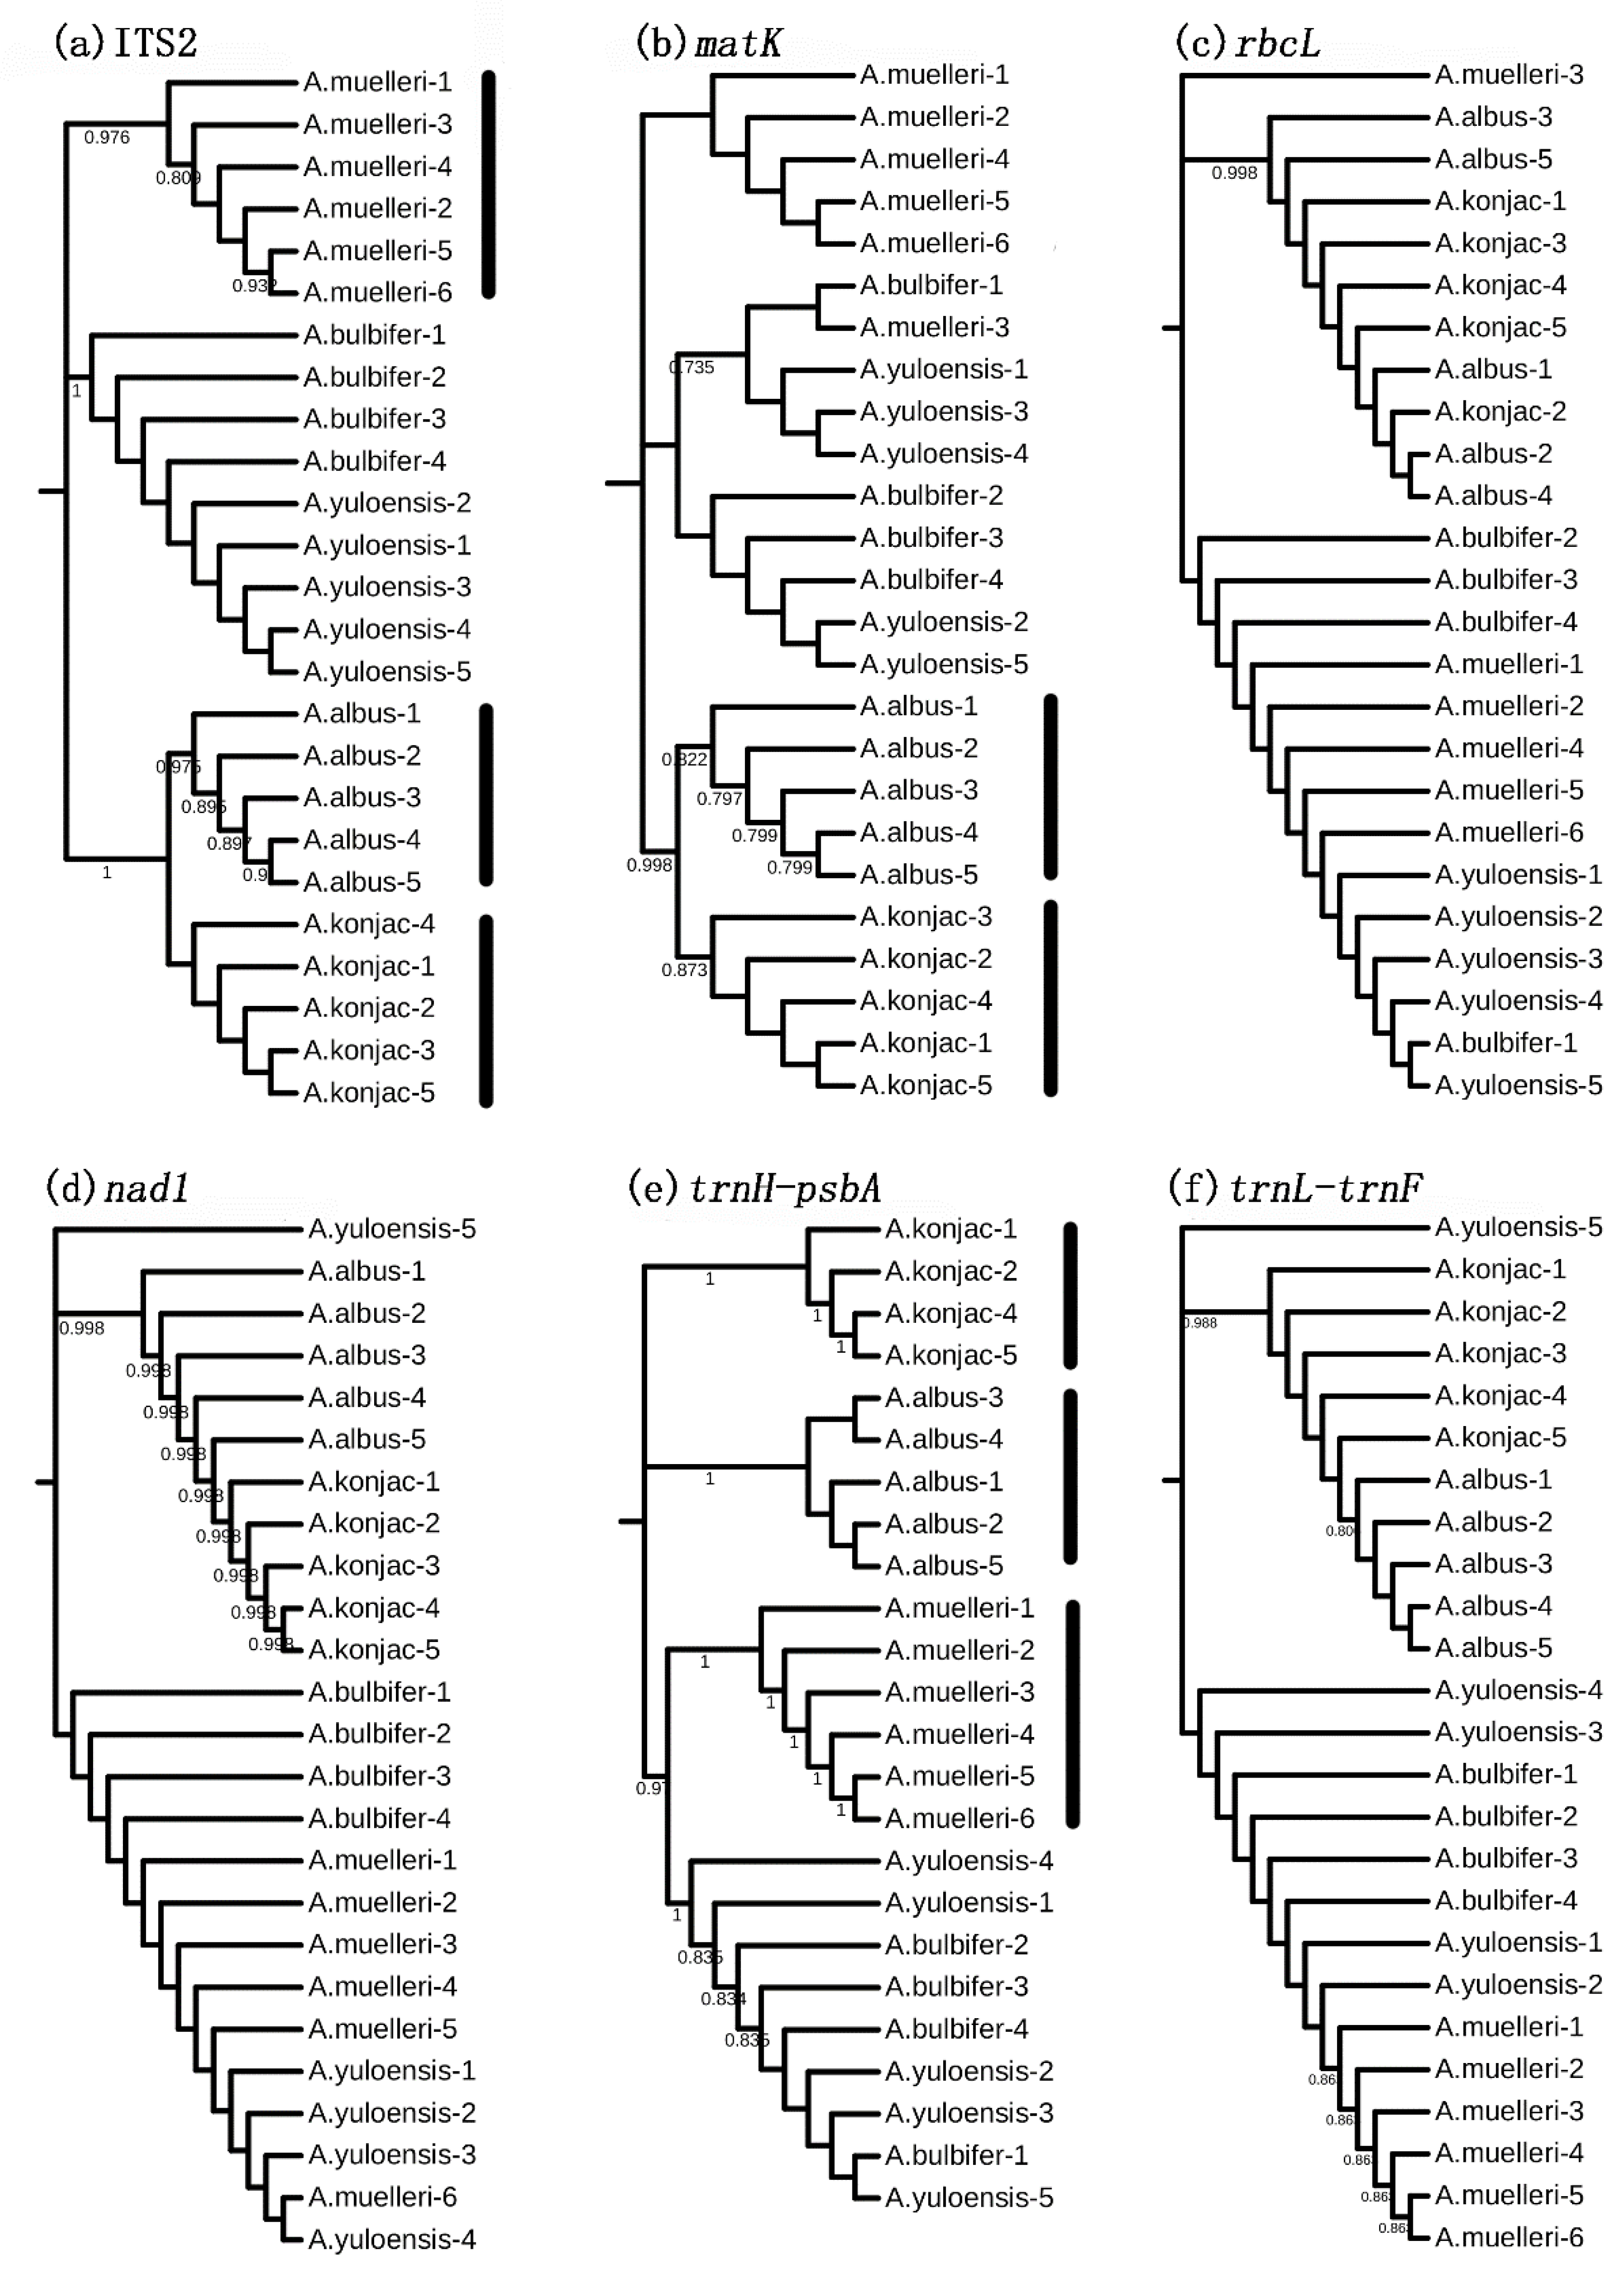
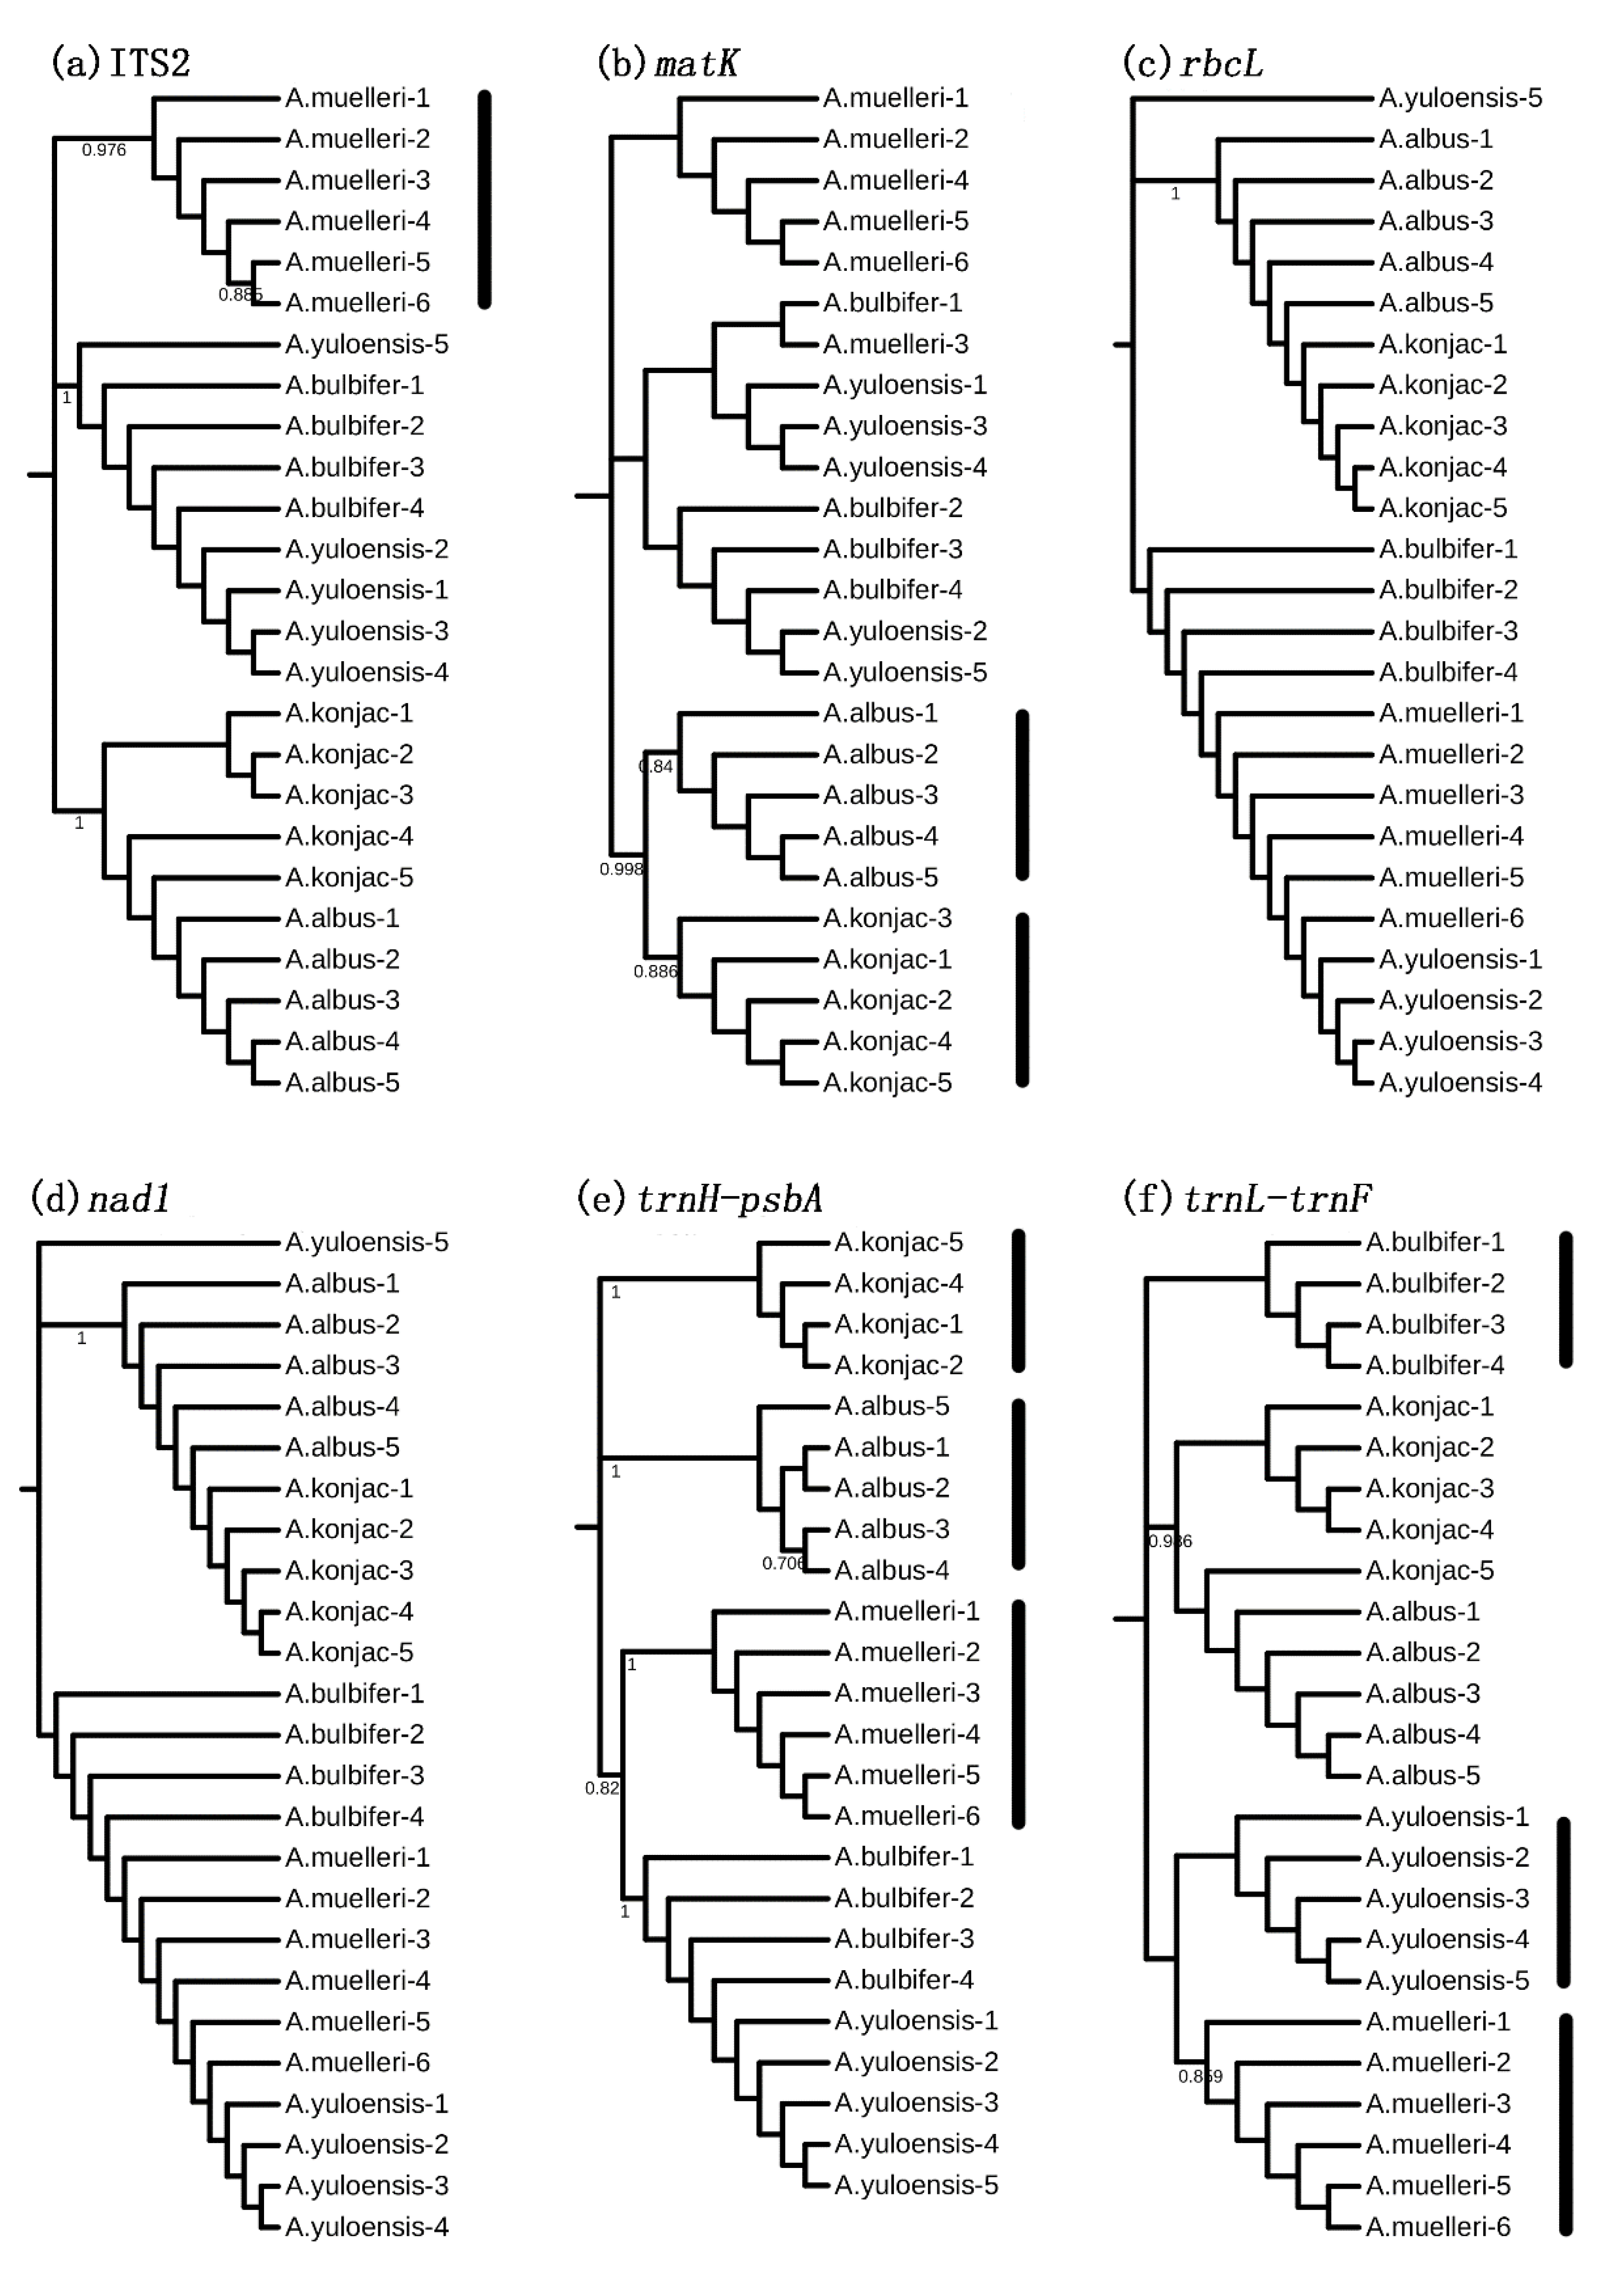
3.3. Species Discrimination Based on Different Analytical Methods

We used three methods to evaluate these barcodes’ identification ability and put our focus on the identification of the A. konjac, A. albus, and A. muelleri.
Similarity-based method [17,18]: In this method, we used the “Best match” (BM) and the “Best close match” (BCM) algorithm belongs to TaxonDNA software to evaluate the species identification efficiency of those barcodes. Before calculation, we had defined five Amorphophallus species into four groups: (1) A. konjac; (2) A. albus; (3) A. muelleri; (4) A. bulbifer, and A. yuloensis. The results showed that the correct recognition rates of ITS2, trnH-psbA, and trnL-trnF was 100% under both BM and BCM, respectively, followed by matK with 96% accuracy, and rbcL and nad1 with 0% accuracy (Table 3).
Distance-based method: In this method, we calculated the genetic distance between sequences to assess whether the barcode forms a “barcoding gap” within and between species, thereby determining the barcode’s ability to identify the species [21]. We calculated the pairwise distance between A. konjac, A. albus, and A. muelleri with four other kinds of Amorphophallus species. The maximum intraspecific distance and minimum interspecific distance of all pairs are listed in Table 4. The results showed that the maximum intraspecific distance of trnH-psbA, ITS2, and trnL-trnF was less than the minimum interspecific distance in all groups. Relative distribution of intraspecific and interspecific distances for the six DNA barcodes in four groups (A. konjac; A. albus; A. muelleri; A. bulbifer and A. yuloensis) was performed (Figure 1), the result showed that trnH-psbA and trnL-trnF can form a “barcoding gap” (Figure 1e,f), remaining barcodes can’t separate intra- and inter-specific distances. In order to verify the ability of different barcodes to identify species based on genetic distance. The Automatic Barcode Gap Discovery (ABGD) program [46] was employed (Figure 2); the result showed that in the initial partition process, the program consistently divided all trnH-psbA sequences into four groups: (1) A. konjac; (2) A. albus; (3) A. muelleri; (4) A. bulbifer and A. yuloensis (Figure 2e).
Tree-based method [48]: The results of constructed neighbor-joining (NJ) and maximum-likelihood (ML) trees based on Kimura 2-Parameter (K2P) distance were almost the same (Figure 3 and Figure 4). In both trees, trnH-psbA could divide A. konjac, A. albus, and A. muelleri into three independent clades (bootstrap value > 70%) (Figure 3e and Figure 4e), while matK could divide A. konjac and A. albus into two independent clades (Figure 3b and Figure 4b). In ML tree, although trnL-trnF could form three independent clades representing A. muelleri, A. bulbifer, and A. yuloensis, respectively, it could not distinguish A. konjac and A. albus (Figure 4f).

4. Discussion

The 100% PCR amplification rate showed that these six barcodes were not only found in other plants [19,21] but were also relatively conservative in Amorphophallus, which provides the possibility of testing those barcodes.
Among the six barcodes, trnH-psbA had the largest sequence length variation, ranging from 687 to 914 bp; the reason may be due to the existence of (AT) di-nucleotide repeat in trnH-psbA sequence which we have observed. This phenomenon was also found in Zhang’s study [17], were they found that the length of trnH-psbA in Lysimachia also had a large variation, ranging from 378 to 473 bp, due to the existence of poly A/T. trnH-psbA had the largest variable sites (25.61%) and parsimony-informative sites (25.61%) in Amorphophallus, which corresponded with the report of Azuma et al. and Hamilton et al. [49,50], they have found that the trnH-psbA had a high percentage of the variable site in Magnoliaceae and Lecythidaceae. Many other reports have also shown that trnH-psbA has a high variation in many plants, such as in the genus Rhododendron [21], Labiatae [19], and Myristicaceae [51]. We speculate that there may be two reasons for the high variation of trnH-psbA: (1) As mentioned above, the trnH-psbA sequence has been found to have an amount of di-nucleotide repeat in this and other studies. Due to the presence of the di-nucleotide repeat region, replication slippage is more likely to occur during DNA replication [52], which makes the sequence more prone to mutation; (2) Compared with other barcodes (rbcL, nad1, matK) in the coding region, trnH-psbA is subject to neutral selection and can tolerate more variations without being eliminated, so it accumulates more DNA variations in evolution. Correspondingly, trnH-psbA also has the largest interspecific divergence (0–22.74%). This result corresponds to Kress [53], whose group demonstrated that the trnH-psbA was highly variable in flowering plants, suggesting that trnH-psbA may be an ideal barcode to distinguish species because it has great genetic divergence among different species. Our study also had differences with other studies. Many researchers have found that ITS2 had a greater variation than trnH-psbA in many plants, such as in Lysimachia L [17], Parnassia [48], Apiaceae [54]. But in this genus, the trnH-psbA was more varied than ITS2, which may indicate that trnH-psbA has a faster evolution rate than ITS2 and the other four regions in the genus Amorphophallus. Our study found that the noncoding sequences (ITS2, trnH-psbA, trnL-trnF) have more variable sites than coding sequences (matK, nad1, rbcL). This was consistent with the classical hypothesis that DNA variation occurs more in noncoding regions than in coding regions, and the same phenomenon was also found by Zuo et al. [16].
We used three methods to evaluate the barcodes’ identity ability; no matter which method was used, trnH-psbA could always separate A. konjac, A. albus, and A. muelleri from each other. Previous studies have found that the trnH-psbA has a good identification effect in other plants, such as Sabia parviflora [55], Labiatae [19], Acacia [56], and Polygonaceae [27]. On the contrary, the core barcodes recommended by CBOL, matK, and rbcL did not have good identification ability in this genus and other plants [16,17,48,57,58], which may indicate that the coding sequence may not be suitable for general plant barcode. Therefore, more studies are needed in DNA barcoding to find more appropriate barcodes for plants in the future.
In this study, the classification of the three Amorphophallus, has two applications; one is used to identify the purity of raw materials of A. konjac and A. albus, which can not only ensure the interests of trade without loss, but also ensure the purity of Amorphophallus pharmaceutical products. On the other hand, A. muelleri can be quickly and accurately screened from its related species, which can be used for genetic improvement of A. konjac and A. albus.
Although DNA barcodes have been used in species classification and identification, there are still some problems: (1) in this study, although trnH-psbA could achieve our classification purpose, some difficulties arose during sequencing (one sample of trnH-psbA failed to be sequenced) and aligned due to containing amount poly (AT); (2) there is currently no standard method to detect the classification ability of DNA barcodes [59]. We often have to use a variety of methods to detect the classification ability of barcodes, and thus, the results may not be consistent. Therefore, in the future, we need to look for more suitable DNA barcodes and develop a standard method for screening DNA barcodes. In practical applications (such as authentification in the trade of medicinal materials), barcodes can also be combined with other molecular biology techniques to identify species faster, such as Amplification Refractory Mutation System (ARMS) technology [60].

Supplementary Materials

The following are available online at https://www.mdpi.com/2073-4395/10/9/1366/s1. Table S1: Genbank accession numbers of these six barcodes.

Author Contributions

Conceptualization, Z.H. and S.J.; data curation, C.Z. and X.S.; investigation, E.L.; methodology, T.C. and S.J.; resources, E.L. and N.H.; software, C.Z. and X.S.; supervision, N.H., Z.H., and Y.D.; visualization, X.S.; writing—original draft, C.Z. and T.C.; writing—review and editing, Z.H., S.J., and Y.D. All authors have read and agreed to the published version of the manuscript.

Funding

This research received no external funding.

Acknowledgments

Thanks for the support of the Hubei agricultural science and technology innovation action project.

Conflicts of Interest

The authors declare no conflict of interest.

References

  1. Liu, E.; Yang, C.; Liu, J.; Jin, S.; Harijati, N.; Hu, Z.; Diao, Y.; Zhao, L. Comparative analysis of complete chloroplast genome sequences of four major Amorphophallus species. Sci. Rep. 2019, 9, 809. [Google Scholar] [CrossRef] [PubMed]
  2. Devaraj, R.D.; Reddy, C.K.; Xu, B. Health-Promoting effects of konjac glucomannan and its practical applications: A critical review. Int. J. Biol. Macromol. 2019, 126, 273–281. [Google Scholar] [CrossRef] [PubMed]
  3. Chen, X.; Yuan, L.-Q.; Li, L.-J.; Lv, Y.; Chen, P.F.; Pan, L. Suppression of gastric cancer by extract from the tuber of amorphophallus konjac via induction of apoptosis and autophagy. Oncol. Rep. 2017, 38, 1051–1058. [Google Scholar] [CrossRef]
  4. Suwannaporn, P.; Thepwong, K.; Tester, R.; Al-Ghazzewi, F.; Piggott, J.; Shen, N.; Chen, Z.; Chen, F.; Yang, J.; Zhang, D.; et al. Tolerance and nutritional therapy of dietary fibre from konjac glucomannan hydrolysates for patients with inflammatory bowel disease (IBD). Bioact. Carbohydr. Diet. Fibre 2013, 2, 93–98. [Google Scholar] [CrossRef]
  5. Suwannaporn, P.; Tester, R.F.; Al-Ghazzewi, F.H.; Artitdit, P. Effect of short term administration of konjac glucomannan hydrolysates on adult blood lipid parameters and glucose concentrations. Nutr. Food Sci. 2015, 45, 616–624. [Google Scholar] [CrossRef]
  6. Arvill, A.; Bodin, L. Effect of short-term ingestion of konjac glucomannan on serum cholesterol in healthy men. Am. J. Clin. Nutr. 1995, 61, 585–589. [Google Scholar] [CrossRef]
  7. Onishi, N.; Kawamoto, S.; Suzuki, H.; Santo, H.; Aki, T.; Shigeta, S.; Hashimoto, K.; Hide, M.; Ono, K. Dietary Pulverized Konjac Glucomannan Suppresses Scratching Behavior and Skin Inflammatory Immune Responses in NC/Nga Mice. Int. Arch. Allergy Immunol. 2007, 144, 95–104. [Google Scholar] [CrossRef] [PubMed]
  8. Zalewski, B.M.; Chmielewska, A.; Szajewska, H. The effect of glucomannan on body weight in overweight or obese children and adults: A systematic review of randomized controlled trials. Nutrition 2015, 31, 437–442. [Google Scholar] [CrossRef]
  9. Al-Ghazzewi, F.H.; Khanna, S.; Tester, R.F.; Piggott, J.R. The potential use of hydrolysed konjac glucomannan as a prebiotic. J. Sci. Food Agric. 2007, 87, 1758–1766. [Google Scholar] [CrossRef]
  10. Connolly, M.L.; Lovegrove, J.A.; Tuohy, K.M. Konjac glucomannan hydrolysate beneficially modulates bacterial composition and activity within the faecal microbiota. J. Funct. Foods 2010, 2, 219–224. [Google Scholar] [CrossRef]
  11. Guo, C.; Li, L.; Zhou, H.; Lin, Y.S.; Wu, Y.R. Comparative study on physicochemical properties of konjac glucomannan of three kinds of Amorphophallus. Hunan Agric. Sci. 2012, 9, 95–98. [Google Scholar]
  12. Zhang, Y.; Zhang, X.; Liu, P.; Feng, C. RAPD Analysis of Amorphophallus Germplasm Resources. J. South Agric. Univ. 2001, 23, 418–421. [Google Scholar]
  13. Zhang, F.J.; Liu, H.L.; Zhang, J.; Liu, Y.; Zhang, S.L. Research progress of Amorphophallus bulbifera resources. South China Agric. 2013, 7, 64–67. [Google Scholar]
  14. Zhang, D.H.; Wang, Q.P.; He, Z.G. Amorphophallus muelleri—A New Promising Star from Low Yield Crop to Quality High Yield Crop. Resour. Dev. Mark. 2010, 26, 135–138. [Google Scholar]
  15. Hebert, P.D.N.; Cywinska, A.; Ball, S.L.; Dewaard, J.R. Biological identifications through DNA barcodes. Proc. R. Soc. B Biol. Sci. 2003, 270, 313–321. [Google Scholar] [CrossRef] [Green Version]
  16. Zuo, Y.J.; Chen, Z.J.; Kondo, K.; Funamoto, T.; Wen, J.; Zhou, S.L. DNA Barcoding of PanaxSpecies. Planta Med. 2010, 77, 182–187. [Google Scholar] [CrossRef]
  17. Zhang, C.-Y.; Wang, F.-Y.; Yan, H.-F.; Hao, G.; Hu, C.-M.; Ge, X.-J. Testing DNA barcoding in closely related groups of Lysimachia L. (Myrsinaceae). Mol. Ecol. Resour. 2012, 12, 98–108. [Google Scholar] [CrossRef]
  18. Alves, T.L.S.; Chauveau, O.; Eggers, L.; Souza-Chies, T.T.; Souza-Chies, T.T. Species discrimination inSisyrinchium(Iridaceae): Assessment of DNA barcodes in a taxonomically challenging genus. Mol. Ecol. Resour. 2013, 14, 324–335. [Google Scholar] [CrossRef]
  19. Theodoridis, S.; Stefanaki, A.; Tezcan, M.; Aki, C.; Kokkini, S.; Vlachonasios, K.E. DNA barcoding in native plants of the Labiatae (Lamiaceae) family from Chios Island (Greece) and the adjacent Cesme-Karaburun Peninsula (Turkey). Mol. Ecol. Resour. 2012, 12, 620–633. [Google Scholar] [CrossRef]
  20. Mishra, P.; Kumar, A.; Nagireddy, A.; Mani, D.N.; Shukla, A.K.; Tiwari, R.; Sundaresan, V. DNA barcoding: An efficient tool to overcome authentication challenges in the herbal market. Plant Biotechnol. J. 2016, 14, 8–21. [Google Scholar] [CrossRef]
  21. Yan, L.-J.; Liu, J.; Möller, M.; Zhang, L.; Zhang, X.-M.; Li, D.-Z.; Gao, L.-M. DNA barcoding ofRhododendron(Ericaceae), the largest Chinese plant genus in biodiversity hotspots of the Himalaya-Hengduan Mountains. Mol. Ecol. Resour. 2015, 15, 932–944. [Google Scholar] [CrossRef] [PubMed]
  22. Valentini, A.; Pompanon, F.; Taberlet, P. DNA barcoding for ecologists. Trends Ecol. Evol. 2009, 24, 110–117. [Google Scholar] [CrossRef] [PubMed]
  23. Lahaye, R.; Van Der Bank, M.; Bogarín, D.; Warner, J.; Pupulin, F.; Gigot, G.; Maurin, O.; Duthoit, S.; Barraclough, T.G.; Savolainen, V. DNA barcoding the floras of biodiversity hotspots. Proc. Natl. Acad. Sci. USA 2008, 105, 2923–2928. [Google Scholar] [CrossRef] [Green Version]
  24. Liu, J.; Möller, M.; Li, D.-Z.; Gao, L.-M.; Zhang, D.-Q. DNA barcoding for the discrimination of Eurasian yews (Taxus L., Taxaceae) and the discovery of cryptic species. Mol. Ecol. Resour. 2011, 11, 89–100. [Google Scholar] [CrossRef] [PubMed]
  25. Miwa, H.; Odrzykoski, I.J.; Matsui, A.; Hasegawa, M.; Akiyama, H.; Jia, Y.; Sabirov, R.; Takahashi, H.; Boufford, D.E.; Murakami, N. Adaptive evolution of rbcL in Conocephalum (Hepaticae, bryophytes). Gene 2009, 441, 169–175. [Google Scholar] [CrossRef]
  26. Wang, X.-R.; Tsumura, Y.; Yoshimaru, H.; Nagasaka, K.; Szmidt, A.E.; Szmidt, K.N.E. Phylogenetic Relationships of Eurasian Pines (Pinus, Pinaceae) Based on Chloroplast rbcL, matK, rpl20-rps18 Spacer, and trnV Intron Sequences. Am. J. Bot. 1999, 86, 1742. [Google Scholar] [CrossRef]
  27. Song, J.; Yao, H.; Li, Y.; Li, X.; Lin, Y.; Liu, C.; Han, J.; Xie, C.; Chen, S. Authentication of the family Polygonaceae in Chinese pharmacopoeia by DNA barcoding technique. J. Ethnopharmacol. 2009, 124, 434–439. [Google Scholar] [CrossRef]
  28. Kress, W.J.; Erickson, D.L. A Two-Locus Global DNA Barcode for Land Plants: The Coding rbcL Gene Complements the Non-Coding trnH-psbA Spacer Region. PLoS ONE 2007, 2, e508. [Google Scholar] [CrossRef] [Green Version]
  29. Chase, M.W.; Salamin, N.; Wilkinson, M.J.; Dunwell, J.M.; Kesanakurthi, R.P.; Haidar, N.; Savolainen, V. Land plants and DNA barcodes: Short-term and long-term goals. Philos. Trans. R. Soc. B Biol. Sci. 2005, 360, 1889–1895. [Google Scholar] [CrossRef] [Green Version]
  30. Chen, S.; Yao, H.; Han, J.; Liu, C.; Song, J.; Shi, L.; Zhu, Y.-J.; Ma, X.; Gao, T.; Pang, X.; et al. Validation of the ITS2 Region as a Novel DNA Barcode for Identifying Medicinal Plant Species. PLoS ONE 2010, 5, e8613. [Google Scholar] [CrossRef]
  31. Li, D.Z.; Gao, L.M.; Li, H.T.; Wang, H.; Ge, X.J.; Liu, J.Q.; Chen, Z.D.; Zhou, S.L.; Chen, S.L.; CPBOL Group; et al. Comparative analysis of a large dataset indicates that internal transcribed spacer (ITS) should be incorporated into the core barcode for seed plants. Proc. Natl. Acad. Sci. USA 2011, 108, 19641–19646. [Google Scholar] [CrossRef] [PubMed] [Green Version]
  32. Hollingsworth, P.M.; Forrest, L.L.; Spouge, J.L.; Hajibabaei, M.; Ratnasingham, S.; van der Bank, M.; Chase, M.W.; Cowan, R.S.; Erickson, D.L.; CBOL Plant Working Group; et al. A DNA barcode for land plants. Proc. Natl. Acad. Sci. USA 2009, 106, 12794–12797. [Google Scholar]
  33. Gholave, A.R.; Pawar, K.D.; Yadav, S.R.; Bapat, V.A.; Jadhav, J.P. Reconstruction of molecular phylogeny of closely related Amorphophallus species of India using plastid DNA marker and fingerprinting approaches. Physiol. Mol. Biol. Plants 2017, 23, 155–167. [Google Scholar] [CrossRef] [PubMed]
  34. Gao, Y.; Yin, S.; Yang, H.; Wu, L.; Yan, Y. Genetic diversity and phylogenetic relationships of seven Amorphophallus species in southwestern China revealed by chloroplast DNA sequences. Mitochondrial DNA Part A 2018, 29, 679–686. [Google Scholar] [CrossRef]
  35. Grob, G.B.J.; Gravendeel, B.; Eurlings, M.C.M. Potential phylogenetic utility of the nuclear FLORICAULA/LEAFY second intron: Comparison with three chloroplast DNA regions in Amorphophallus (Araceae). Mol. Phylogenet. Evol. 2004, 30, 13–23. [Google Scholar] [CrossRef]
  36. Cuénoud, P.; Savolainen, V.; Chatrou, L.W.; Powell, M.; Grayer, R.J.; Chase, M.W. Molecular phylogenetics of Caryophyllales based on nuclear 18S rDNA and plastid rbcL, atpB, and matK DNA sequences. Am. J. Bot. 2002, 89, 132–144. [Google Scholar] [CrossRef]
  37. Mendes-Rodrigues, C.; Marinho, R.C.; Balao, F.; Arista, M.; Ortiz, P.L.; Carmo-Oliveira, R.; Oliveira, P.E. Reproductive diversity, polyploidy, and geographical parthenogenesis in two Eriotheca (Malvaceae) species from Brazilian Cerrado. Perspect. Plant Ecol. Evol. Syst. 2019, 36, 1–12. [Google Scholar] [CrossRef]
  38. Sang, T.; Crawford, D.J.; Stuessy, T.F. Chloroplast DNA phylogeny, reticulate evolution, and biogeography of Paeonia (Paeoniaceae). Am. J. Bot. 1997, 84, 1120–1136. [Google Scholar] [CrossRef] [Green Version]
  39. Fay, M.F.; Swensen, S.M.; Chase, M.W. Taxonomic Affinities of Medusagyne oppositifolia (Medusagynaceae). Kew Bull. 1997, 52, 111. [Google Scholar] [CrossRef]
  40. Taberlet, P.; Gielly, L.; Pautou, G.; Bouvet, J. Universal primers for amplification of three non-coding regions of chloroplast DNA. Plant Mol. Biol. 1991, 17, 1105–1109. [Google Scholar] [CrossRef]
  41. Liu, Y.; Sun, W.; Liu, C.; Zhang, Y.; Chen, Y.; Song, M.; Fan, G.; Liu, X.; Xiang, L.; Zhang, Y. Identification of Hippophae species (Shaji) through DNA barcodes. Chin. Med. 2015, 10, 28. [Google Scholar] [CrossRef] [PubMed] [Green Version]
  42. Kumar, S.; Stecher, G.; Li, M.; Knyaz, C.; Tamura, K. MEGA X: Molecular Evolutionary Genetics Analysis across Computing Platforms. Mol. Biol. Evol. 2018, 35, 1547–1549. [Google Scholar] [CrossRef]
  43. Rozas, J.; Ferrer-Mata, A.; Sánchez-Del Barrio, J.C.; Guirao-Rico, S.; Librado, P.; Ramos-Onsins, S.E.; Sánchez-Gracia, A. DnaSP 6: DNA Sequence Polymorphism Analysis of Large Data Sets. Mol. Biol. Evol. 2017, 34, 3299–3302. [Google Scholar] [CrossRef] [PubMed]
  44. Meier, R.; Shiyang, K.; Vaidya, G.G.; Ng, P.K. DNA Barcoding and Taxonomy in Diptera: A Tale of High Intraspecific Variability and Low Identification Success. Syst. Biol. 2006, 55, 715–728. [Google Scholar] [CrossRef] [PubMed] [Green Version]
  45. Meyer, C.P.; Paulay, G. DNA Barcoding: Error Rates Based on Comprehensive Sampling. PLoS Biol. 2005, 3, e422. [Google Scholar] [CrossRef] [Green Version]
  46. Puillandre, N.; Lambert, A.; Brouillet, S.; Achaz, G. ABGD, Automatic Barcode Gap Discovery for primary species delimitation. Mol. Ecol. 2012, 21, 1864–1877. [Google Scholar] [CrossRef] [PubMed]
  47. Kimura, M. A simple method for estimating evolutionary rates of base substitutions through comparative studies of nucleotide sequences. J. Mol. Evol. 1980, 16, 111–120. [Google Scholar] [CrossRef] [PubMed]
  48. Yang, J.-B.; Wang, Y.P.; Möller, M.; Gao, L.-M.; Wu, D. Applying plant DNA barcodes to identify species of Parnassia (Parnassiaceae). Mol. Ecol. Resour. 2012, 12, 267–275. [Google Scholar] [CrossRef]
  49. Azuma, H.; García-Franco, J.G.; Rico-Gray, V.; Thien, L.B.; Thien, V.R.-G.B. Molecular phylogeny of the Magnoliaceae: The biogeography of tropical and temperate disjunctions. Am. J. Bot. 2001, 88, 2275–2285. [Google Scholar] [CrossRef]
  50. Hamilton, M.B. Patterns and Relative Rates of Nucleotide and Insertion/Deletion Evolution at Six Chloroplast Intergenic Regions in New World Species of the Lecythidaceae. Mol. Biol. Evol. 2003, 20, 1710–1721. [Google Scholar] [CrossRef]
  51. Newmaster, S.G.; Fazekas, A.J.; Steeves, R.A.D.; Janovec, J. Testing candidate plant barcode regions in the Myristicaceae. Mol. Ecol. Resour. 2008, 8, 480–490. [Google Scholar] [CrossRef] [PubMed]
  52. Lai, Y. The Relationship Between Microsatellite Slippage Mutation Rate and the Number of Repeat Units. Mol. Biol. Evol. 2003, 20, 2123–2131. [Google Scholar] [CrossRef] [PubMed]
  53. Kress, W.J.; Wurdack, K.J.; Zimmer, E.A.; Weigt, L.A.; Janzen, D.H. Use of DNA barcodes to identify flowering plants. Proc. Natl. Acad. Sci. USA 2005, 102, 8369–8374. [Google Scholar] [CrossRef] [PubMed] [Green Version]
  54. Liu, J.; Shi, L.; Han, J.; Li, G.; Lu, H.; Hou, J.; Zhou, X.; Meng, F.; Downie, S.R. Identification of species in the angiosperm family Apiaceae using DNA barcodes. Mol. Ecol. Resour. 2014, 14, 1231–1238. [Google Scholar] [CrossRef]
  55. Sui, X.-Y.; Huang, Y.; Tan, Y.; Guo, Y.; Long, C.L. Molecular Authentication of the Ethnomedicinal Plant Sabia parviflora and Its Adulterants by DNA Barcoding Technique. Planta Med. 2011, 77, 492–496. [Google Scholar] [CrossRef] [Green Version]
  56. Steven, G.N.; Subramanyam, R. Testing plant barcoding in a sister species complex of pantropical Acacia (Mimosoideae, Fabaceae). Mol. Ecol. Resour. 2009, 9 (Suppl. S1), 172–180. [Google Scholar] [CrossRef]
  57. Dong, L.-N.; Wortley, A.H.; Wang, H.; Li, D.-Z.; Lu, L. Efficiency of DNA barcodes for species delimitation: A case in Pterygiella Oliv. (Orobanchaceae). J. Syst. Evol. 2011, 49, 189–202. [Google Scholar] [CrossRef]
  58. Yan, H.-F.; Hao, G.; Hu, C.-M.; Ge, X.-J. DNA barcoding in closely related species: A case study of Primula L. sect. Proliferae Pax (Primulaceae) in China. J. Syst. Evol. 2011, 49, 225–236. [Google Scholar] [CrossRef]
  59. Casiraghi, M.; Labra, M.; Ferri, E.; Galimberti, A.; De Mattia, F. DNA barcoding: A six-question tour to improve users’ awareness about the method. Brief. Bioinform. 2010, 11, 440–453. [Google Scholar] [CrossRef]
  60. Newton, C.R.; Graham, A.; Heptinstall, L.E.; Powell, S.J.; Summers, C.; Kalsheker, N.; Smith, J.C.; Markham, A.F. Analysis of any point mutation in DNA. The amplification refractory mutation system (ARMS). Nucleic Acids Res. 1989, 17, 2503–2516. [Google Scholar] [CrossRef]
Figure 1. Relative distribution of intraspecific and interspecific distances for six barcodes among four groups. (a) ITS2, (b) matK, (c) rbcL, (d) nad1, (e) trnH-psbA, (f) trnL-trnF. The red bar represents the intraspecific distance, and the blue bar represents the interspecific distance. x-axes relate to Kimura 2-parameter distances arranged in intervals, and the y-axes correspond to the percentage of occurrences.
Agronomy 10 01366 g001
Figure 2. Automatic classification of barcode sequences by the ABGD program. (a) ITS2, (b) matK, (c) rbcL, (d) nad1, (e) trnH-psbA, (f) trnL-trnF. The red dots represent the recursive partition, and the blue dots represent the initial partition. x-axes relate to prior intraspecific divergence, and the y-axes correspond to the number of groups.
Agronomy 10 01366 g002
Figure 3. Neighbor-joining tree based on the six barcode sequences with the Kimura 2-parameter distance model. (a) ITS2, (b) matK, (c) rbcL, (d) nad1, (e) trnH-psbA, (f) trnL-trnF. Bootstrap values (>70%) are shown above the relevant branches.
Agronomy 10 01366 g003
Figure 4. Maximum-likelihood tree based on the six barcode sequences with the Kimura 2-parameter distance model. (a) ITS2, (b) matK, (c) rbcL, (d) nad1, (e) trnH-psbA, (f) trnL-trnF. Bootstrap values (>70%) are shown above the relevant branches.
Agronomy 10 01366 g004
Table 1. The primers and PCR amplification procedures used in this study.
RegionsPrimer PairsSequence 5′–3′CitedThermocycling Conditions
matK390fCGATCTATTCATTCAATATTTC[36]94 °C 4 min; (35 cycles: 94 °C 60 s; 53 °C 30 s; 72 °C 60 s); 72 °C 10 min
1326rTCTAGCACACGAAAGTCGAAGT
trnH-psbApsbAGTTATGCATGAACGTAATGCTC[37,38]94 °C 4 min; (34 cycles: 94 °C 60 s; 55 °C 60 s; 72 °C 60 s); 72 °C 10 min
trnH2CGCGCATGGTGGATTCACAATCC
rbcL1FATGTCACCACAAACAGAAACT[39]94 °C 4 min; (35 cycles: 94 °C 60 s; 55 °C 30 s; 72 °C 60 s); 72 °C 10 min
724RTCGCATGTACCTGCAGTAGC
trnL-trnFtrnL-eGGTTCAAGTCCCTCTATCCC[40]95 °C 4 min; (35 cycles: 94 °C 45 s; 52 °C 45 s; 72 °C 60 s); 72 °C 10 min
trnF-fATTTGAACTGGTGACACGAG
ITS2ITS2-FGCGATACTTGGTGTGAAT[41]94 °C 4 min; (35 cycles: 94 °C 45 s; 56 °C 30 s; 72 °C 45 s); 72 °C 10 min
ITS2-RGACGCTTCTCCAGACTACAAT
nad1F GATCGGCCATAAATGTACTCC 70 °C 4 min; 94 °C 4min; (36 cycles: 94 °C 20 s; 55 °C 20 s; 72 °C 90 s); 72 °C 5 min
RCCCCATATATTCCCGGAGC
Table 2. Characteristics of six single barcodes in five Amorphophallus species.
BarcodeNumber of SamplesAligned Length, bpNumber of Variable Sites, (%)Number of Parsimony Informative Sites, (%)Intraspecific Distances
(Average), %
Interspecific Distances
(Average), %
ITS22550135, (6.99)35, (6.99)0–0.58, (0.08) a0–6.23, (4.06) b
matK2583013, (1.68)13, (1.68)0–0.36, (0.08) ab0–1.58, (0.81) c
rbcL2568110, (1.47)8, (1.17)0–0.29, (0.02) b0–1.47, (0.73) d
nad12512559, (0.72)9, (0.72)0, (0) d0–0.72, (0.43) e
trnH-psbA24660169, (25.61)169, (25.61)0–0.15, (0.03) b0–22.74, (14.93) a
trnL-trnF254107, (1.71)7, (1.71)0, (0) d0–1.73, (0.92) c
Note: The lowercase letters a–e indicate a significant difference at the alpha = 0.05 level.
Table 3. Identification success rates for the six candidate barcodes based on analysis of the ‘Best march’ and ‘Best close match’ functions of TaxonDNA software.
Barcode RegionN
Groups
N
Sequences
Best Match, N (%)Best Close Match, N (%)No Match (%)Threshold, %
CorrectAmbiguousIncorrectCorrect AmbiguousIncorrect
ITS242525 (100.0%)0 (0.0%)0 (0.0%)25 (100.0%)0 (0.0%)0 (0.0%)0 (0.0%)0.57
matK42524 (96.0%)0 (0.0%)1 (4.0%)24 (96.0%)0 (0.0%)1 (4.0%)0 (0.0%)0.35
rbcL4250 (0.0%)25 (100.0%)0 (0.0%)0 (0.0%)25 (100.0%)0 (0.0%)0 (0.0%)0.58
nad14250 (0.0%)25 (100.0%)0 (0.0%)0 (0.0%)25 (100.0%)0 (0.0%)0 (0.0%)0.00
trnH-psbA42424 (100.0%)0 (0.0%)0 (0.0%)24 (100.0%)0 (0.0%)0 (0.0%)0 (0.0%)2.68
trnL-trnF42525 (100.0%)0 (0.0%)0 (0.0%)25 (100.0%)0 (0.0%)0 (0.0%)0 (0.0%)0.00
Table 4. The maximum intraspecific and minimum interspecific genetic distances between species.
ITS2matKrbcLnad1trnH-psbAtrnL-trnF
PairedMaxMinMaxMinMaxMinMaxMinMaxMinMaxMin
A.k-A.a00.39%0.12%0.36%0.29%0000.15%21.01%00.24%
A.k-A.m0.58%4.24%0.36%1.09%01.18%00.71%021.94%01.48%
A.k-A.b06.00%0.24%1.21%01.18%00.71%022.25%00.98%
A.k-A.y06.00%0.24%1.21%01.18%00.71%022.25%00.98%
A.a-A.m0.58%4.67%0.36%0.97%0.29%1.18%00.71%0.15%13.77%01.73%
A.a-A.b06.23%0.24%1.09%0.29%1.18%00.71%0.15%14.06%01.23%
A.a-A.y06.23%0.24%1.09%0.29%1.18%00.71%0.15%14.06%01.23%
A.m-A.b0.58%3.03%0.36%0.12%00000.12%11.03%00.49%
A.m-A.y0.58%3.03%0.36%0.12%0000011.03%00.49%
Note: A.a, Amorphophallus albus; A.k, Amorphophallus konjac; A.m, Amorphophallus muelleri; A.b, Amorphophallus bulbifer; A.y, Amorphophallus yuloensis. max, maximum intraspecific distance; min, minimum interspecific distance.

