Article

Evaluating Irrigation Efficiency with Performance Indicators: A Case Study of Citrus in the East of Spain

1
Instituto de Investigación para la Gestión Integrada de Zonas Costeras, Universitat Politècnica de València, 46730 Grao de Gandia, Valencia, Spain
2
Department of Engineering, Miguel Hernandez University, 03312 Orihuela, Alicante, Spain
*
Author to whom correspondence should be addressed.
Agronomy 2020, 10(9), 1359; https://doi.org/10.3390/agronomy10091359
Submission received: 10 August 2020 / Revised: 3 September 2020 / Accepted: 4 September 2020 / Published: 10 September 2020

Abstract

:
Improving water efficiency in farming systems is one of the major challenges of these decades. Water scarcity due to climate change, together with the increasing demand of food, is leading experts from around the world find appropriate indicators for water-use efficiency. In this paper we propose and test different indicators for service delivery performance, productive efficiency, and economic efficiency. Since the characteristics of the studied area and the citrus cropping system in the East of Spain are particular, we include in our analysis two other variables which are key to understanding the changes in the indicators: the obtained productivity, and the applied irrigation. The indicators and these two variables are tested with the information provided by farmers of citrus orchards belonging to an irrigation community from the East of Spain. The effect of different factors, such as cultivated varieties, type of farmer (professional or non-professional), or plantations’ size, are evaluated against the productivity and irrigation performance of the evaluated orchards. The effect of excess of irrigation on the indicators is also studied with the previous factors. Finally, an artificial intelligence system is used to predict productive efficiency of an orchard, based on the size and the water supply. Among the proposed indicators, the service delivery performance indicators came out to be the least useful and might provoke overirrigation due to the lack of accuracy of the data used for its calculation. The productive and economic efficiency indicators have been useful to illustrate the remarkable effect that excess of irrigation has on water efficiency, since a reduction of 66% of productive efficiency is found for some of the analysed varieties. On other cases, a reduction of 50% in economic efficiency is detected due to the excess of irrigation. Moreover, the excess of irrigation implied higher economic efficiency in only one of the evaluated varieties.

1. Introduction

Sustainable agriculture (SA) aims to produce long-term crops and livestock while minimising the effects on the environment [1]. Among the goals of this type of farming, conserving water and reducing the use of pesticides and fertilisers are at the top, but SA also focuses on helping farmers improve their techniques and maintain the economic viability of farms [2]. Since the Food and Agriculture Organization of the United Nations expects the world population to reach almost 10 billion by 2050, increasing the food supply in a sustainable manner has become a relevant issue [3]. Therefore, assessing sustainability indicators can be of great importance to help farmers increase their productivity while reducing economic investment.
Water management is a fundamental part of the agricultural sector, especially for water-stressed areas like Spain, since more profitable crops often have higher water requirements [4]. In the last decades, traditional irrigation schemes have experienced significant transformations via modernization projects. Nowadays more than half of the final agricultural production in Spain is obtained in irrigated lands [5]. However, the impact of climate change will likely reduce water resources with a decrease of rainwater and river discharges. Consequently, sound irrigation management is needed to tackle water scarcity while increasing productivity in an efficient manner.
Many irrigation technologies have been used to improve water management, though these techniques often result in irregular delivery rates, as well as low irrigation uniformity and efficiency [6]. The use of performance indicators and benchmarking [7] could help defining key issues and quantify the level of enhancement that different approaches may have in crop farming. Moreover, comparing agronomic practices, such as the use of ground covers and fertilisers, the application of biostimulants or pruning, as well as environmental factors, like temperature, rain, wind, or water source types, can help understanding crop responses and achieving more efficient and sustainable productions.
However, performance indicators can be complicated, and difficult to calculate and be understood by farmers. In addition, most of the well-known indicators to evaluate the water efficiency, like the ones proposed by United Nations in their Sustainable Development Goals (SDG), are aimed to evaluate the water efficiency of countries and regions and are too general to be calculated for a single plot. Furthermore, they are limited since they are based only on quantitative indicators [8]. Other indicators, such as the proposed by Azad and Ancev [9] evaluate the efficiency at enterprise scale. Nam et al. [10], presented an indicator used at the canal scale to evaluate the efficiency of water delivery in small areas, while Sabiha et al. [11] also applied another indicator which considers the environmental impact of agriculture at a district scale.
Finding appropriate performance indicators that can be applied at the parcel scale, requires the use of rather sensitive data that can be difficult to obtain. Moreover, due to the complexity of farming systems and their huge variability, it is necessary to integrate quantitative and qualitative data [12]. Nonetheless, for benchmarking purposes and to improve the global efficiency of an irrigation community based on the data of individual farmers, indicators applied at orchard scale are essential. Other authors such as Malano and Burton [13] or Knox et al. [14], have developed indicators which can be used at plantation scale with some adaptations. Nonetheless, the proposed indicators are based only in quantitative data, and as established in [10], it is necessary to include qualitative data.
In this paper, we propose five indicators in order to evaluate three key aspects of citrus farming: (1) the service delivery performance, (2) the productive efficiency, and (3) the economic efficiency. These proposed indicators are then applied to a set of data obtained from oranges and tangerines orchards of farmers belonging to an irrigation community in the East of Spain. The data included in this paper has been obtained from a database generated thanks to the collaboration of two associations. Both associations: an irrigation community and a cooperative of farmers, shared real data about productivity and applied irrigation, collected by them along five years. In addition, three variables are calculated based on the climatic data of the nearest meteorological station. Besides evaluating the indicators, and before its analysis, it is essential to describe in general terms the characteristics of the studied area (including number of orchards, number of professional (P) and non-professional (NP) farmers, variation on cropped varieties, etc.). In addition, to display and explain the changes on productivity and irrigation of the included plantations, in-depth analyses are performed with the two beforementioned variables obtained from the farmers, which are used for the calculation of indicators. These analyses are essential to understanding the particular characteristics of this type of farming practices, and their problematic, in the studied region. In this paper, we focus on a quantitative research approach, including qualitative and quantitative variables. Although the proposed indicators are based on quantitative data, we will test the effect of qualitative variables such as the type of farmer or the variety of cropped fruit on the indicators. Finally, the use of artificial intelligence is combined with one of the indicators to establish recommendations for farmers. All this will constitute an exploratory initial study about water management in the citrus farming system. It is important to note that no other study has shown this type of data or analyses for citrus farming systems.
The rest of the paper is structured as follows: Section 2 describes the experience of other researchers in developing and applying indicators; Section 3 details the material and methods employed, including the explanation of the proposed indicators; Section 4 presents and analyses the results obtained; Section 5 presents the discussion of the main findings of this study; finally, Section 6 summarizes the conclusions and future work.

2. Literature Review

In this section, we analyse the experience of other researchers in applying the indicators at different scales. We will first discuss the existing studies and, later, their shortcomings.
The terms enterprise and district are used following the terminology of consulted papers. Therefore, the original paper must be looked up in order to get more information about the extension of the studied area in each case.
In 2014, Azad et al. developed a modelling framework to measure the trade-offs between the economic gain of water usage in agriculture and its environmental impact in order to construct policy instruments to enhance water management [9]. Researchers used a new approach to derive environmental efficiency scores for several irrigation enterprises within Australia. They applied the Luenberger environmental indicator, an indicator that is constructed on directional distance functions aiming at estimating efficiency changes and productivity over a period of time. By adapting the Luenberger productivity indicator, they were able to compare the efficiency of irrigated enterprises across space to measure their environmental performance. Although the lack of adequate research in this area prevented them from developing generalised methods and tools, the analysis of the results showed that there is a substantial variation of environmental efficiencies across regions.
In [12], Pham et al. performed a review of the assessment of agricultural sustainability in developing countries that highlighted some of the critical weaknesses that can be considered as drivers rather than indicators. These drivers of agricultural sustainability comprise a range of natural, socio-economic, demographic, political, institutional and management factors that need to be addressed to combat adverse indicators trends. The researchers presented a conceptual framework to assess agricultural sustainability in developing countries that aims to capture underlying drivers and identify the dependencies among drivers and indicators. Therefore, they reviewed the principles of agricultural sustainability, together with the social and environmental indicators for assessing agricultural sustainability at a local state. Among the conclusions that were extracted from this work, they stated that understanding the influence of drivers would assist policymakers to shift towards a more sustainable assessment of resources. However, due to the complexity of agricultural systems, they highlighted that modelling tools need to integrate qualitative and quantitative variables that are often difficult to assess and collect.
In 2016, Nam et al. introduced a new approach to evaluate water delivery performance indicators of irrigation canals to identify the key issues of water management in South Korea [10]. By measuring the water delivery performance at nine irrigation canals, performance indicators were calculated to understand irrigation behaviours and trends. They identified possible improvement methods to develop better water management policies so as to improve temporal uniformity and equity in the water distribution. The selected indicators measured delivery performance in terms of adequacy, efficiency, dependability, and equity, among others. Although these indicators showed that water delivery systems were inadequate, the water-use efficiency turned to be relatively high, though the required irrigation was not supplied when necessary. However, the analysis of the results showed that problems were not only caused by irrigation management, but also by the physical structure itself.
In [11], Sabiha et al. developed a composite environmental impact index (CEII) to evaluate the environmental degradation in agriculture. To test the effectiveness of the proposed approach, the environmental impacts arising from high yielding varieties of rice production were measured. This tool was then applied to empirical measurements in three rice cultivation districts of Bangladesh for a single year to capture multidimensional aspects of environmental features at a farm level. To calculate the CEII, three categories of environmental impacts were included: means-based, effect-based, and perception-based. Moreover, a total of 17 environmental impacts were incorporated to quantify these groups and measure the extent of environmental degradation. Results showed that intensive agricultural practices caused environmental damage and major policies regarding this type of farming are needed in order to regulate these activities.
Santiago-Brown et al. presented a list of indicators proposed by 83 top-level executives from wine-grape growing organisations from New World wine-producing countries [15]. This list of indicators was grouped into three categories ranked by their importance for assessing sustainability in a representative and viable way to maintain comparability between farms and support management decision-making. Among the selected indicators, we encounter soil health and quality, as well as biodiversity, chemical inputs, water use, yield, productivity, and aesthetics. After analysing the results, the research highlighted that environmental components typically dominate the literature, instead of pursuing a balance between environmental, social, and economic components and trade-offs.
Todorovic et al. presented a methodological framework for the eco-efficiency assessment of water systems in Southern Italy [16]. In this case, the methodology was applied to a 28.17 ha irrigation scheme to evaluate both the economic and the environmental performance at different stages, and for the different stakeholders of the value chain. This approach aimed to achieve a quantitative assessment of the eco-efficiency level. Their analysis showed that the major burden was freshwater resource depletion, as well as climate change and the excessive application of fertilisers, highlighting that innovative technologies and management practices are needed to address the impact of such situations.
Saladini et al. presented a monitoring tool developed under the Partnership for Research and Innovation in the Mediterranean Area (PRIMA) based on food security and sustainable water management [17]. In this case, researchers used 12 indicators to monitor the Mediterranean area in terms of poverty index, population overweight, land use, cereal yield, fertiliser consumption, and crop water productivity, among others. International bodies collected datasets for these indicators with the aim of tracking the impact generated by PRIMA research and innovation projects. The data collected for each country was normalised to obtain a comprehensive value to indicate the sustainability value of the different regions within the Mediterranean area. This allowed researchers to have a better insight into food production and sustainability of these countries rather than comparing the performance of the established rankings.
After an in-depth analysis of the aforementioned experiences from other authors, we can conclude that the need for new indicators and the evaluation of qualitative variables is essential. Moreover, the development of indicators to identify the impact of farming practices on water efficiency and the sustainability of farming systems at orchard level, based on benchmarking principles, is required to improve cultural practices. Thus, we will be able to identify the best procedures, in terms of irrigation and plot management, and provide the appropriate tools to the farmers to increase the sustainability of farming systems are a regional scale.

3. Materials and Methods

In this section, we detail the proposed indicators, the origins of the information that forms our database, and the explanatory variables taken into account to assess the variability of the results obtained.

3.1. Proposed Indicators

Five indicators are proposed to evaluate three key aspects of citrus farming: (1) the service delivery performance, (2) the productive efficiency, and (3) the economic efficiency.
As for the service delivery performance, we followed Malano and Burton [14] definitions for the Annual Relative Water Supply (RWS) described in Equation (1), and the Annual Relative Irrigation Supply (RIS) described in Equation (2). Note that these indicators are dimensionless, thus they have no units (nu).
RWS   ( nu ) = Total   annual   volume   of   a   water   supply Total   annual   volume   of   Evapotranspiration   of   crop = I   ( L m 2 ) + P e ( L m 2 ) ET c   ( L m 2 )
RIS   ( nu ) = Total   annual   volume   of   irrigation   supply Total   annual   volume   of   crop   water   demand = I   ( L m 2 ) ET c   ( L m 2 ) P e ( L m 2 )
where:
I is the total annual volume of irrigation supplied to the crop, in L/m2,
Pe is the total annual volume of effective precipitation, in L/m2, and
ETc is the total annual volume of crop evapotranspiration, in L/m2.
Service delivery performance indicators are dimensionless numbers and have a minimum value of 0 and no maximum value. RWS is conceptually related to the crop’s productive potential. Values of RWS indicator equal or above 1 mean that the orchards are receiving enough or more than the required water, from all sources, to meet the crop’s evapotranspiration. Thus, no yield reductions are presumed, and the crop is expected to attain its full productive potential. Values below 1 indicate that orchards are receiving less water than required and some yield reductions are to be expected. RIS is more related to how well the irrigation supply matches the crop’s irrigation requirements. In this case, values slightly above 1 are expected since values below 1 indicate deficit irrigation.
The indicators related to the productive efficiency evaluate the crop’s performance in terms of produced fruit per applied irrigation. This indicator is a modification of the indicators proposed in [14] to allow a comparison between different varieties in terms of productivity. The indicators proposed in [14] are based on the economic benefit linked to productivity. Nonetheless, as in this study different species and varieties with different prices in the market are considered, the efficiency of productivity must be compared using the total productivity (TP) in (kg/m2). The TP is compared with the data of irrigation (m3/m2) in the overall efficiency of the irrigated crop (WUEOverall), see Equation (3). In addition, a second version, in which only the production of optimal grade (OGP) is considered, has been proposed in Equation (4). This indicator is named optimal quality efficiency of the irrigated crop (WUEQuality) and is equivalent to the indicator proposed by Knox et al. in [15] to evaluate the irrigation efficiency.
WUE Overall   ( kg / m 3 )   = Total   annual   mass   of   crop   production   Total   annual   volume   of   applied   irrigation   = TP   ( kg m 2 ) I   ( L m 2 ) ( m 3 10 3 L )
WUE Quality   ( kg / m 3 )   = Annual   mass   of   optimal   grade   crop   production   Total   annual   volume   of   applied   irrigation   = OGP   ( kg m 2 ) I   ( L m 2 ) ( m 3 10 3 L )
The last proposed indicator assesses the economic efficiency (EE) of the irrigation. It is also a modification of the indicators proposed in [14]. In this case, we compare the output per irrigation delivery cost. With this indicator, we evaluate the total annual gross income (TI) due to the fruit sales and the costs of irrigation water (IC). The resulting indicator is a dimensionless number. Thus, with this indicator, we can compare the economic impact of the differences in water management. It is important to note that this indicator is affected by the different prices of included varieties of fruits. The indicator is defined in the following Equation (5).
E E = Total   annual   gross   incomes Total   annual   cos t   of   irrigation   water   = TI   ( ) IC   ( )

3.2. Sources of Information

The data was obtained from a local irrigation community and a cooperative of farmers from a municipality of Valencia’s province, in the East of Spain. This area has a long tradition of growing several citrus species. The irrigation community water distribution network is an on-demand pressurized one, and all the orchards are drip irrigated, which allows a more precise irrigation dosing and timing. At harvest, the cooperative receives the fruits of each orchard, to sort and package the fruits for the wholesalers. The prices finally received by the farmers are an average and depend on the fruit grades obtained by the farmer and the final settlement at the wholesaler. The irrigation community shared data about annual water consumption of each orchard and the cooperative gave us information about the fruit grade and yield. The variables included in the database are detailed in the next section.
Agricultural know-how is a precious knowledge obtained with personal effort and after a years-long practice. Thus, farmers are not willing to easily share this sensitive information, which is why both associations allowed the use of shared information for research purposes but keeping the confidentiality of information. As confidentiality must be preserved, the exact location of the orchards is not included. Among all the included crops in the database, we have included only two types of citrus, the most common ones, oranges, and tangerines. Varieties cropped in only one or two orchards were included in the general description of the studied area but removed from the final analyses due to representativeness matters.
Since not all the farmers that belong to the irrigation community operate in the same cooperative, the number of orchards included in the study is lower than the number of orchards that belong to the irrigation community and the cooperative of farmers. Moreover, the total number of included orchards varies depending on the year, since farmers can join or leave the cooperative, but also due to changes in the crops, changes of crop types or even changes of tree status. In the database, tree status are identified as: young, mature, and grafted. Due to the different requirements in terms of irrigation and differences in productivity, the data of young and grafted trees is not included in the in-depth analyses. Both associations agreed to share the data belonging to the period from 2013 to 2017. Therefore, data of five years is used in this paper to compare the proposed indicators and to have a general overview of the evolution in water efficiency of the orchards included in the database.

3.3. Variables Included in the Database

As mentioned before, two sources of information provided data about irrigation and production of the orchards. Now, we are going to detail the included variables, see Table 1.
The irrigation community shared information about water use for irrigation, the price of water and the expenditure of each orchard. It is important to note that, although the water concession of the irrigation community exceeds their requirements in specific periods of the year, farmers have a limitation of water resources. If a farmer uses more water than the prescribed one, this is considered as extra irrigation, and the price of this water is increased. This is particularly critical in summer when the amount of available water is reduced, and the requirements in some of the orchards increase.
Regarding the cooperative, data about the orchards including the orchard size, type of farmer, cropped species and variety, and tree status is included. Some of those variables have no units (nu) since they are categorical variables. For example, the type of farmer can be professional (P) or non-professional (NP). Cooperative considers professional farmers those working full time or almost full time in their farms, and NP those working part-time and retirees. Nowadays, one of the main problems of the agricultural sector in the Valencia region is the progressive land abandonment that has brought an 11% decrease in the irrigated cropped area in the last 10 years. This tendency is due to former farmers, or sons or farmers, finding jobs in more profitable sectors while maintaining the agricultural production for sentimental or family reasons. Non-professional farmers correspond to people willing to keep a farming tradition but without a full-time dedication to farming activities, or the skills gained by professional farmers, and without the need to make real maximum profit of the orchards. The species included are tangerines and oranges, classified as specie 1 (tangerines) and species 2 (oranges) in the figures. The varieties are codified as numbers to simplify the graphics. The tree status can be young, adult or grafted. Information about the production of each orchard, such as total production, and the production of different grades, is included. Finally, some financial data, such as mean price and income, is provided for each orchard. In addition to the shared information, some secondary variables are calculated based on shared data. This secondary data is mainly used to allow the comparison between orchards regardless of their size.
Finally, according to the location of the orchards, the data of evapotranspiration of the crop (ETc), and the effective precipitation (Pe) corresponding to the analysed years was calculated with meteorological data of a nearby agrometeorological station. Citrus crop coefficients (Kc) were adjusted for canopy shaded area attending to the three tree developmental stages considered. Net Irrigation Requirement (IRn) was then calculated according to the following Equation (6):
IRn ( L m 2 ) = ET c ( L m 2 ) P e   ( L m 2 )
To do so, we used the CROPWAT 8.0 Bèta program (Land and Water Development Division of FAO, Roma (Italy)) [18], applying the procedures described by the Land and Water Development Division of FAO [19]. Climatic data was obtained from the “Sistema de Información Agroclimática para el Regadío (SIAR)” [20] database, using daily summaries from the closest weather station located within the cooperative district. The greatest distance between the meteorological station and study orchards was 15 km.
It is important to clarify that all the included data related to production and applied irrigation is based on real measurements performed by the cooperative of farmers and the irrigation community. The only data used in this paper that is calculated is the ETc, and Pe. Therefore, our analyses and results will be based on the real characteristics and the behaviour of farmers of the studied area. Since the collection of this sort data is onerous, the fact of including real data of these variables for their analyses and the calculation of indicators in one of the major strengths of this paper.
Finally, we need to consider that, although there will be an error in the calculation of ETc, Pe and IRn, due to the distance between the meteorological station and the location of the orchard, this error does not affect the irrigation practices. Moreover, this lack of accuracy is well-known, and it was pointed out by several authors [21,22,23]. In discussion section we will analyse the effect of this error in our indicators. Currently, the farmers are not using this type of calculations to adjust the irrigation. Therefore, the possible lack of accuracy in the calculation would only affect the results of indicators that include these variables, and not to the real data included in our study. The farmers are irrigating based on their experience. The irrigation system of the irrigation community allows them to carry out on-demand irrigation. The system is always ready for irrigation having enough water available and with the required pressure to operate. Therefore, the water consumption of each farmer has no effect on the water availability of other farmers. Only in specific periods of the year, the water demand increases and, in order to avoid that demand exceeds the availability, the price of water is increased to ensure a homogeneous and fair water availability.

3.4. Methodology for Data Analyses

In order to ensure that all the relevant qualitative aspects are included, and their effect on the most relevant variables (such as productivity or irrigation), as well as the indicators, are correctly studied we implemented the following methodology.
First of all, a general description of the studied area is performed, analysing summations, means, standard deviations, minimum, and maximum values. In this general analysis, the number of included orchards in the database per year is described. Furthermore, the number of orchards that fit with our requirements to be included in further analyses are identified. Since one of the objectives of this study is to evaluate the differences in water management of P farmers and NP farmers, the number of orchards managed by each type of farmer per year is included. Some critical variables such as ETc, Pe, and IRn are jointly analysed to evaluate their variation in the included years. Following, the productivity (kg/m2) and irrigation (l/m2) are compared to determine if there are general patterns which can be identified. To finish this general description, the evolution of selected varieties along the included period is carried out.
Then, the variance of irrigation and productivity of orchards are evaluated for the included quantitative and qualitative variables. For each variable, the following factors are considered: year, variety, type of farmer, and type of orchard (according to its size). To analyze the variance multifactorial ANOVAs are used. For those factors that affect the variance of the evaluated variable, Box Plots are be included.
Following, we deal with the proposed indicators from two different perspectives. First, a general description of the results of each indicator and its evolution is shown. Then multifactorial ANOVAs are presented, including the aforementioned factors and the type of extra irrigation. As in the previous case, box plots are used to interpret the data. Finally, for the factor with more relevant effects variance coefficient analyses are presented. The objective of this analysis is to evaluate the best indicator of the proposed ones attending to its capability to differentiate the orchards according to their irrigation efficiency.
To finish our study, an artificial neural network (ANN) is used to predict the expected values in the most relevant indicator with the most appropriate variables. In this case, we will present the used neural network, the percentage of correct classification and the classification graphic. For all the aforementioned analyses, the Statgraphics Centurion XVI software (Statgraphics Technologies, Inc., The Plains, VA, United States) is used [24].

4. Results

In this section, we analyze the results from the general analyses of the included orchards, the evaluation of indicators and the potential use of ANN with the indicators.

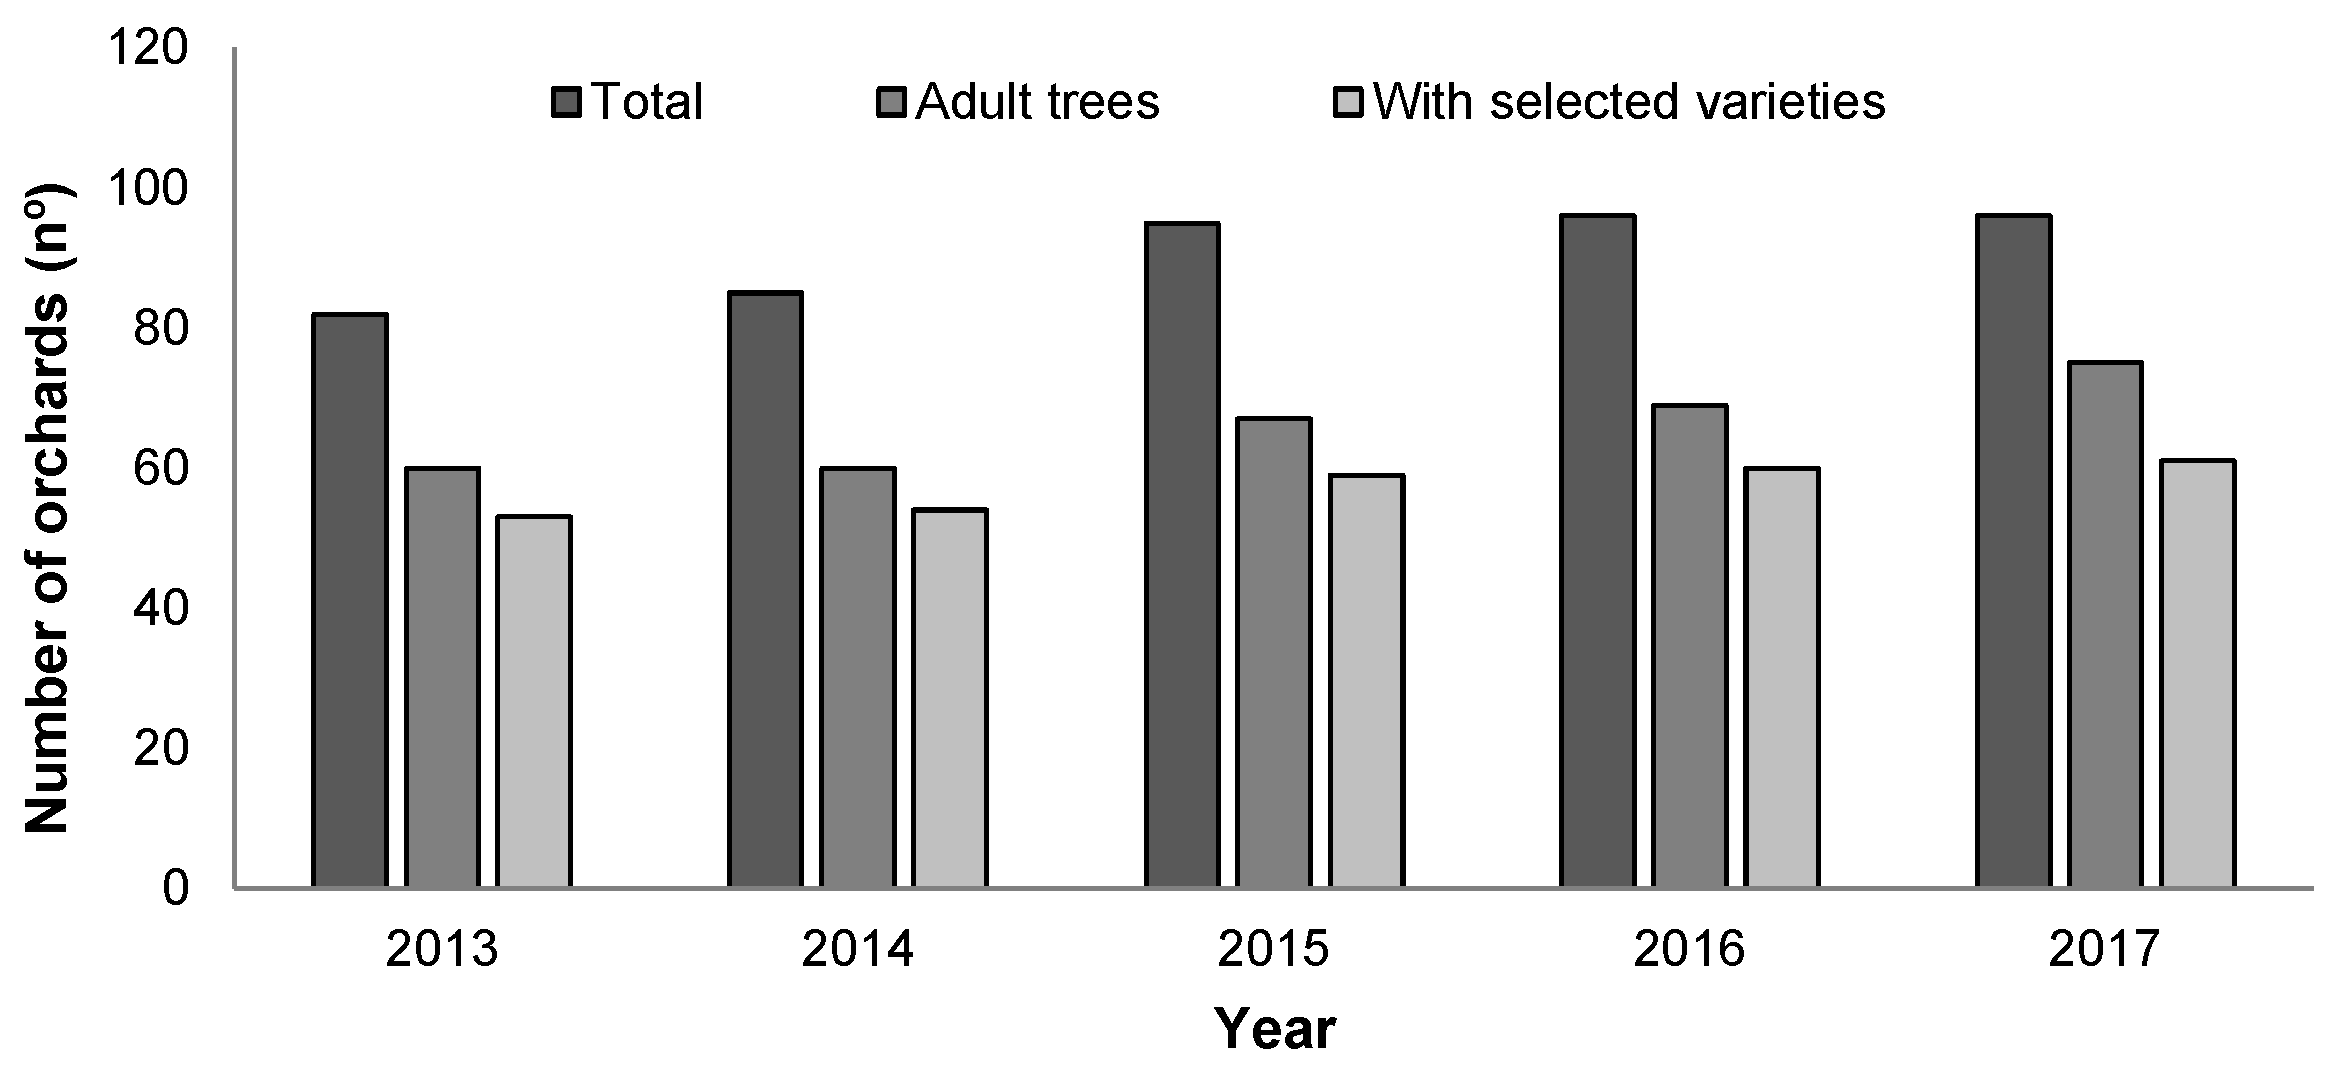
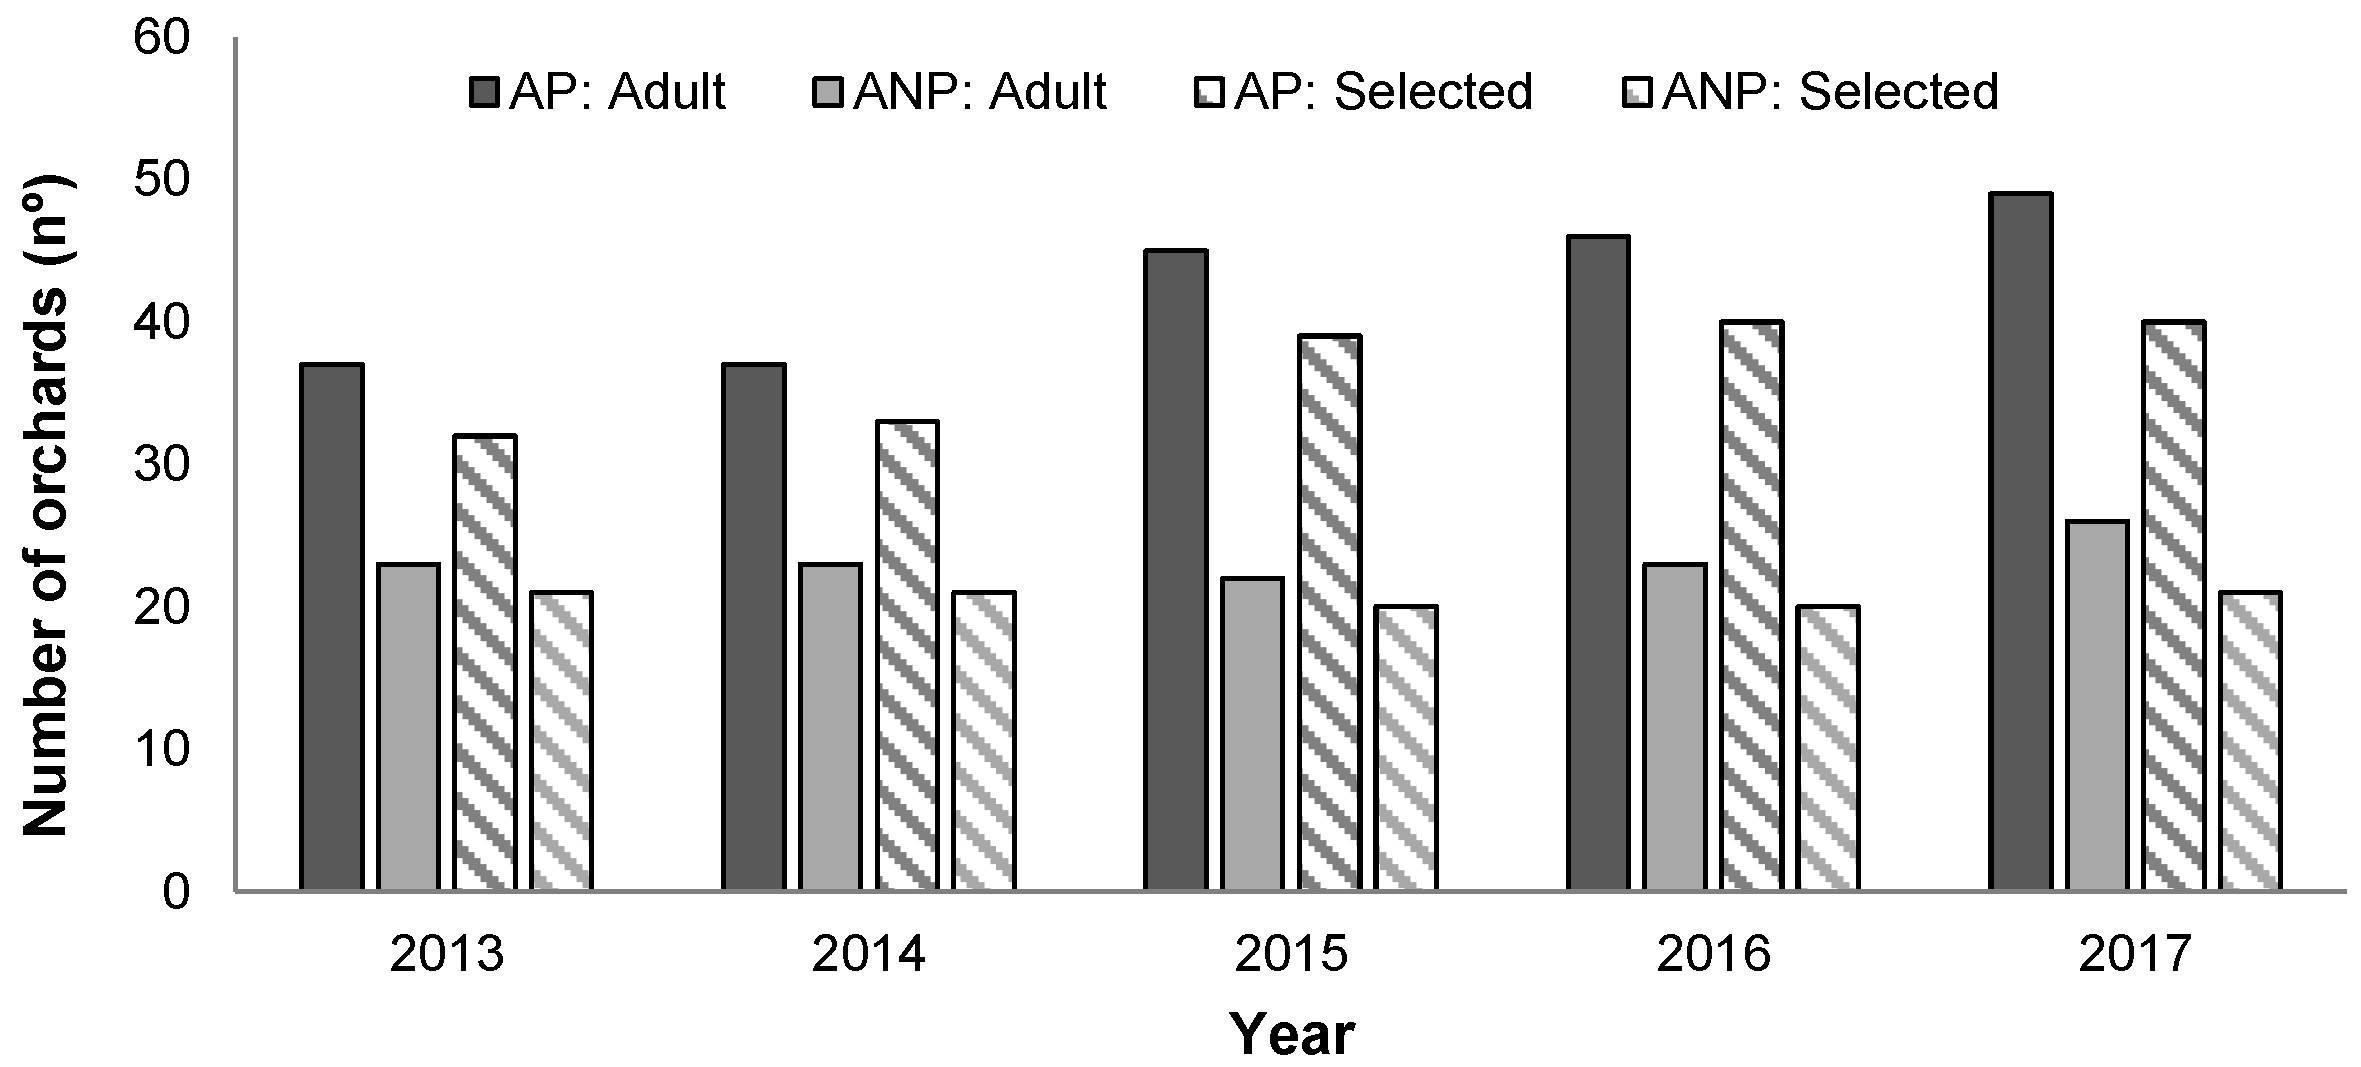
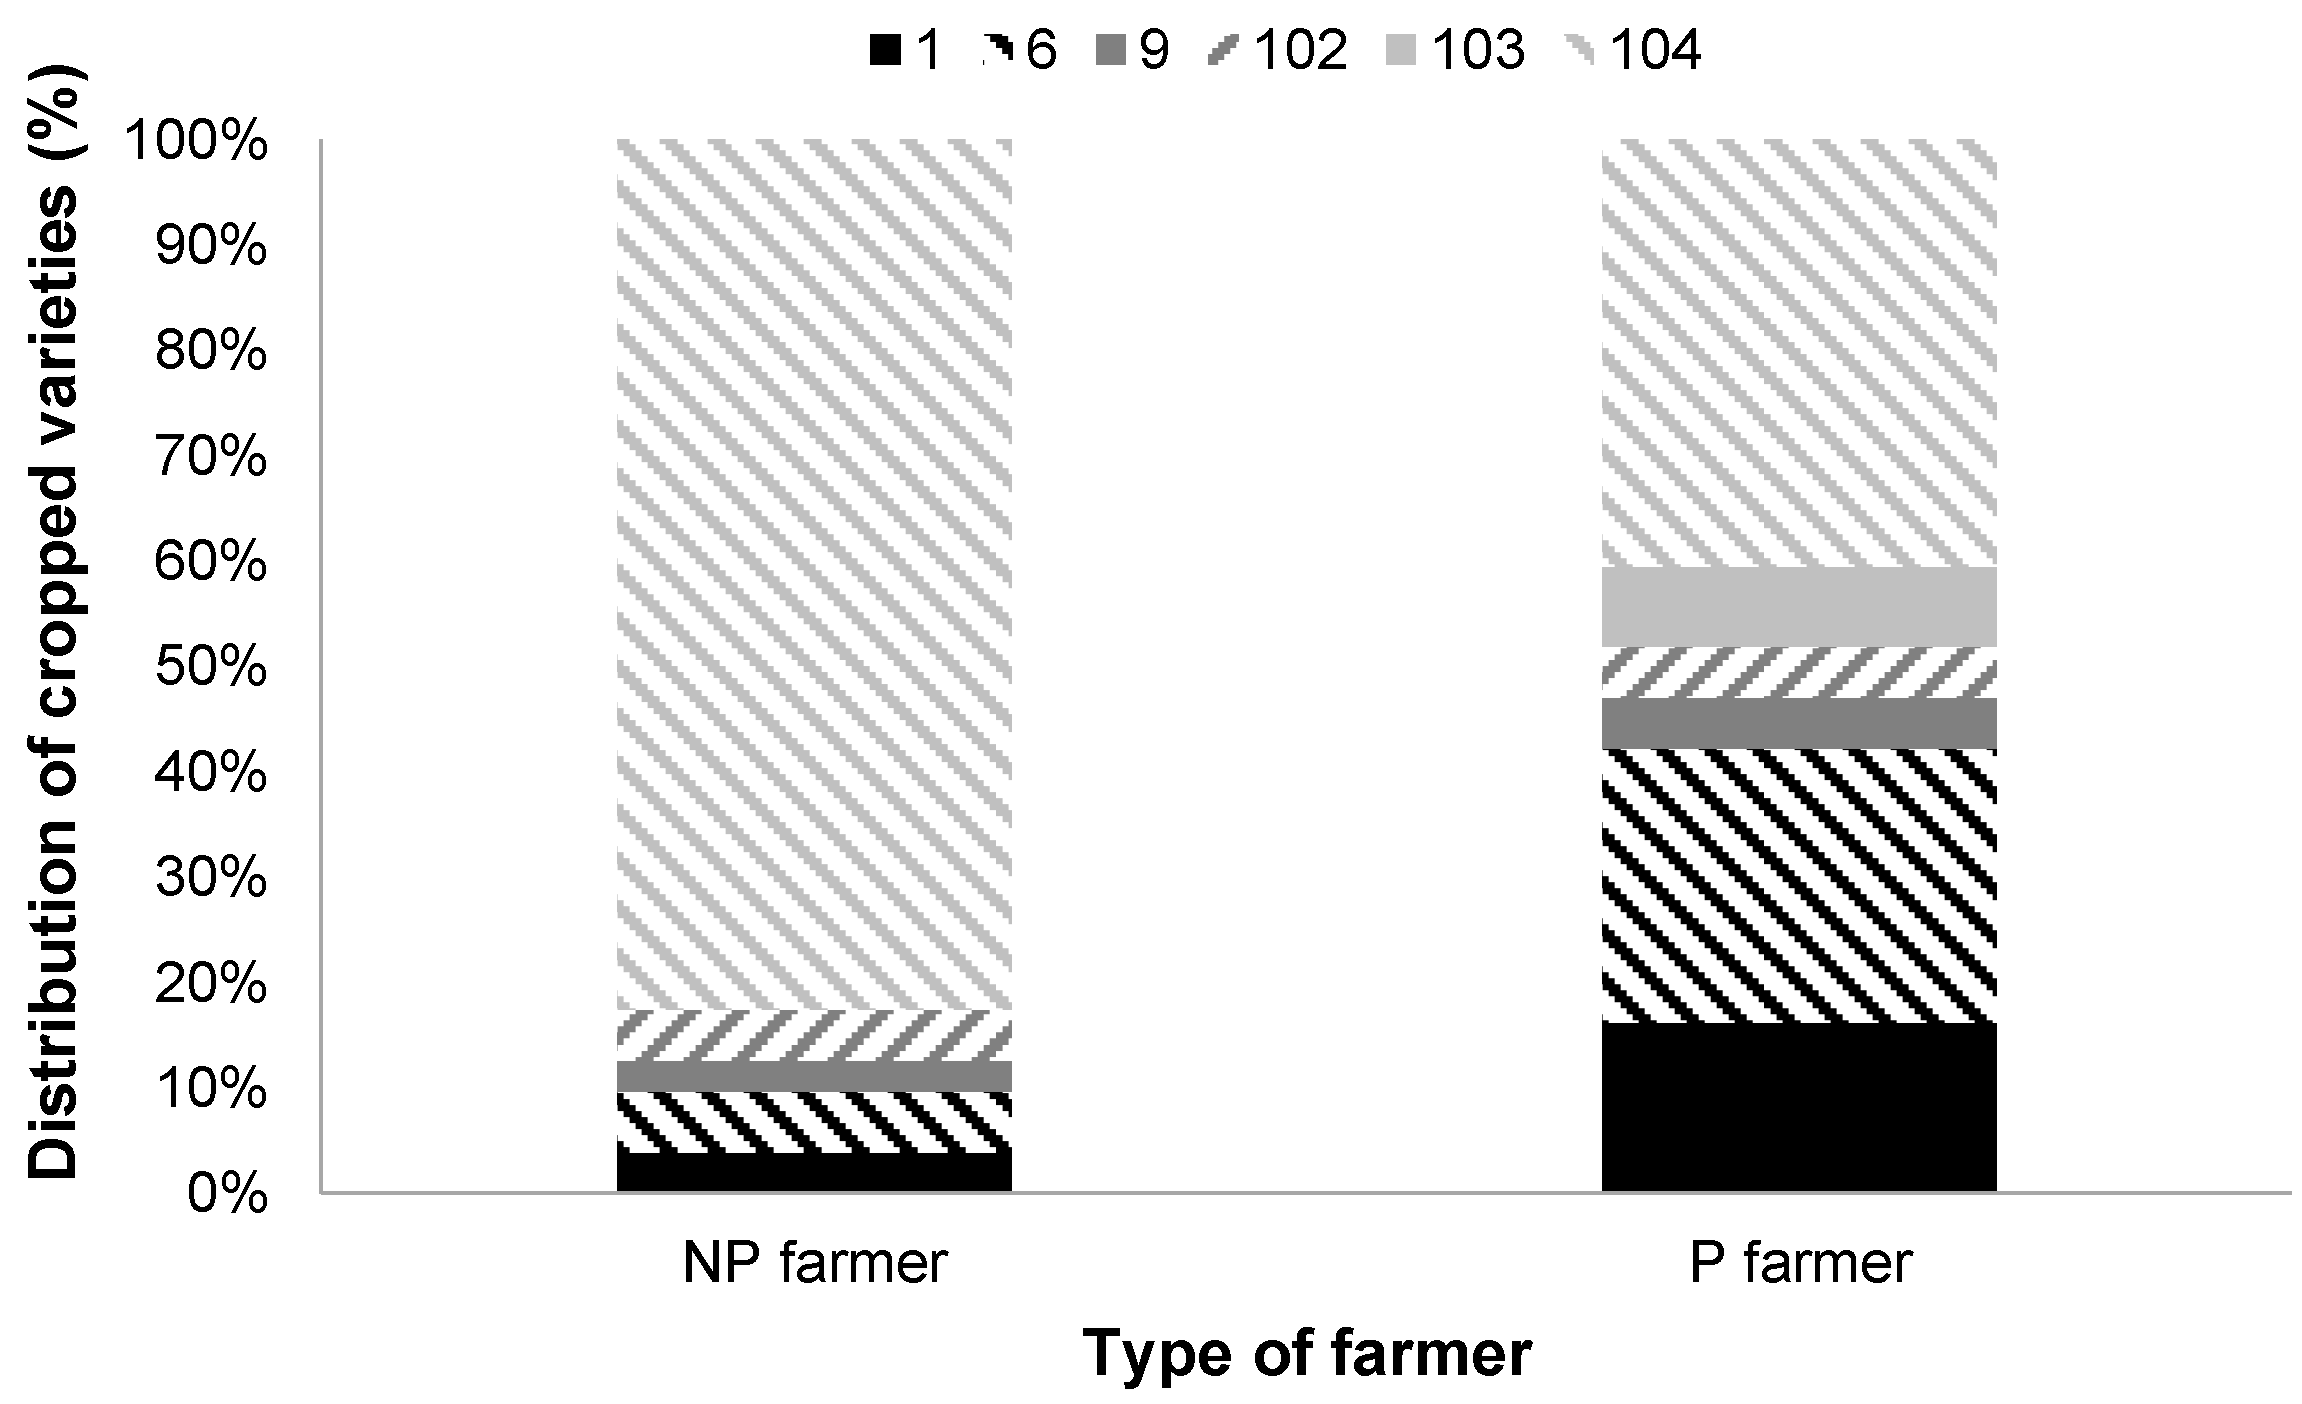
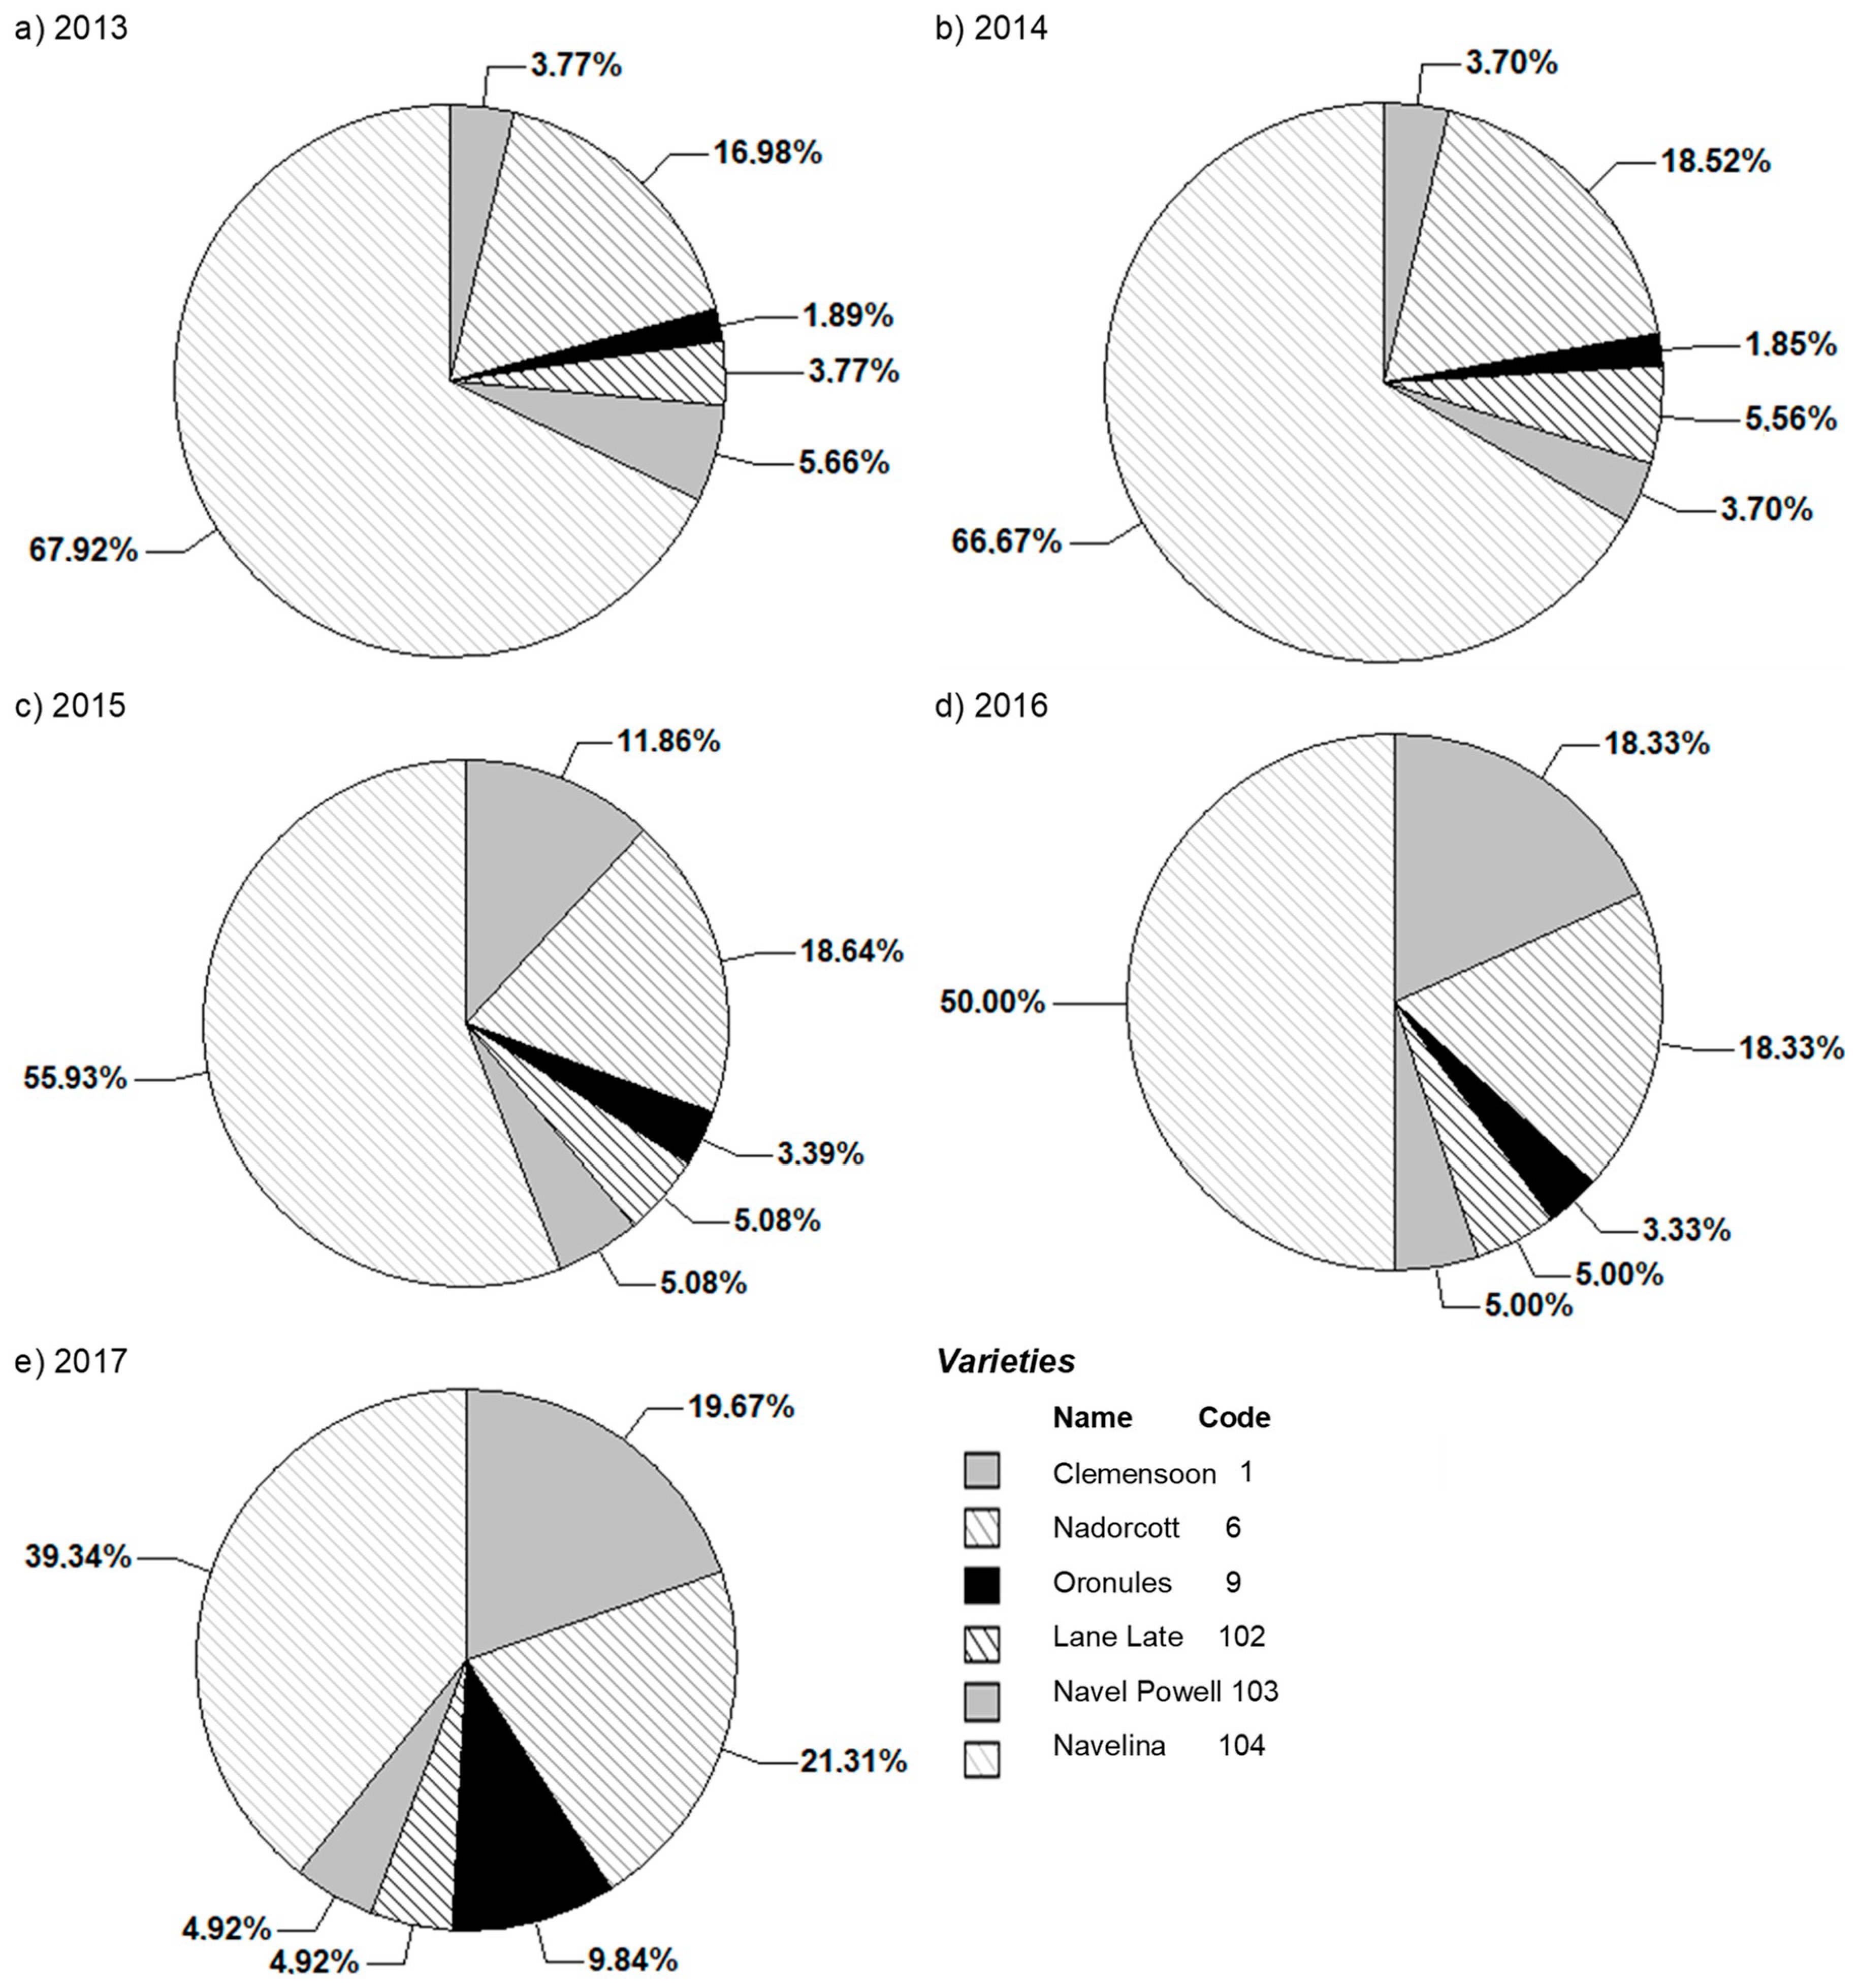
4.1. General Analysis of Characteristics of Included Orchards in the Database

In this subsection, we detail the general description of the most relevant variables of the database. The objective is to show the main characteristics of the studied area between 2013 and 2017.
First, the number of included orchards per each year is detailed in Figure 1. We can identify three group of orchards, the total number of orchards, the orchards with trees classified as mature, and the orchards with trees classified as mature and from the selected varieties. As established before, we are going to focus on the most extended varieties. The number of orchards in the database increases year by year along all the period. Starting in 2013 with 82 orchards (total) and 53 orchards with the selected varieties and mature trees. In 2017, the number of orchards increased to 96 (total) and 61 (with the selected varieties and mature trees). The total number of registered cases in our database is 454; however, in this study, only 287 orchards fulfil the required characteristics and are included in further analyses.
One of the variables that will be included in all our analyses is the type of farmer. Therefore, its evolution in critical. The number of P farmers increases from 33 to 40, while the number of NP farmers is almost constant along the study (see Figure 2). In 2013, 2014, and 2017 we have information about 21 NP farmers; while, in 2015 and 2016, we have information about 20 NP farmers. One of the objectives of this study is to evaluate whether there are differences in the water management of P and NP farmers due to the different farming practices of the cropped varieties.
The included orchards of this study have all a drip irrigation system, which is the most common system for citrus cultivation. Nonetheless, the fertigation, including fertiliser type and concentration, depends on each farmer and no information about it is included among the shared information. As specified in the previous section, the included orchards are a clear example of the citrus industry of the Valencia Region, and are characterized by their small size. With regard to the included orchards, we can find a wide distribution of extension, being the orchard mean size of 0.73 ha, the median of the included orchards is 0.60 ha. The biggest and smallest orchards have an extension of 1.75 ha and 0.19 ha. Therefore, we can consider that, in general terms, the orchards included in this study have a small size.
As described in Section 3.2, the ETc, Pe and IRn were calculated. The results can be seen in Figure 3. Along the studied period, we can identify that the IRn was higher in 2014 and 2017 (576 L/m2 and 625 L/m2) and smaller in 2015 (412 L/m2). In 2013 and 2016 the value of IRn was 508 L/m2 and 516 L/m2. Thus, we can identify differences in the irrigation requirements among the studied period. For this reason, the variable “year” must be evaluated as a factor of variance in further analyses. The changes in IRn are caused mainly by changes in the ETc. The Pe is maintained almost constant in all the period, except in 2015, in which it increases 27% with regards to the average value.
In this paragraph, we are going to deal with the production and the applied irrigation in the different years, see Table 2 and Table 3. The average productivity of the included orchards (mature trees and selected varieties), shown in Table 2, changes annually. The years with higher productivity are 2013, 2015, and 2017. The maximum productivity in a single orchard is 6.76 kg/m2 in 2013, while the minimum productivity was found in 2015 with 0.18 kg/m2. Thus, we can assert that significant differences can be found in the production of the included orchards. In further analyses, we will evaluate the factors that affect the variance of productivity. Although there are differences between the included years, no clear tendency can be observed with the available data. On the other hand, the data of applied irrigation (see Table 3) shows a clear pattern; the irrigation increases year by year. From 2013 to 2017, the amount of applied irrigation has increased in 87.27 L/m2, which represents a growth of 44.2% in only five years. The lowest individual irrigation is found in 2013 with 29 L/m2, whilst in 2016, one of the included orchards has an irrigation of 1041 L/m2.
Regarding productivity, the higher average value in kg/m2 was found in 2013 with 2.59 kg/m2; nonetheless, it must be remarked that 2013 was the year with lowest annual irrigation (197.50 L/m2). However, according to this general analysis, the observed tendency of constant increase of the applied irrigation does not have any effect on the production. The increase of water consumption is neither explained by a reduction of Pe nor an increase of ETc. With this general analysis, we can only affirm that the general increase of water use is not justified by an increase of productivity nor a change in the environmental conditions and, therefore, we deal with this fact in following sections.
Another factor that can explain the changes in the water use patterns is the change in the cropped species and varieties. Since different species, or even varieties, might have different irrigation requirements, it is essential to evaluate the changes in cropped varieties and study their requirements. To facilitate the graphical representation, we classified the two species of citrus as specie 1 (tangerines) and specie 2 (oranges) and coded the varieties as numbers. From each species, several varieties are cropped in the included orchards. For tangerines, a total of 11 different varieties are found. Nevertheless, only three of them have enough representation to be used in this study (classified as varieties 1, 6 and 9). Concerning oranges, only four varieties are cropped. In this case, the varieties are named as 101 to 104 to distinguish them from the varieties of tangerines. Only three varieties are included in this study (classified as 102, 103, and 104). The exact varieties included in this study, and their codification, are detailed in Figure 4a–e denote the data from different years.
In Figure 4, we can identify the changes in the number of orchards for each of the varieties considered in the study, expressed as a percentage of the total number of orchards. As previously stated in Section 3.1, the number of studied orchards varies along the years because only mature orchards are considered and in this time span some reached full production and were incorporated in the study while others were uprooted and discarded from the study. At the beginning of the data collection, in 2013 (Figure 4a), the major crop was the oranges, particularly the variety 104 (Navelina), representing up to 67% of the crops in the number of orchards. Oranges were cropped in up to ¾ of the orchards. In the following years, the cropped species and varieties varied. Oranges represent 75.93% (Figure 4b), 66.09% (Figure 4c), 60% (Figure 4d), and 49.18% (Figure 4e) in the following years. On the other side, the cropping of tangerines has been extended. At the end of the study (Figure 4e), the major crop was the tangerine, with similar percentages of varieties 1 (Clemensoon) and 6 (Navel Powell). Therefore, we observed a tendency in the changes of cropping species, which can be a feasible explanation of the increasing pattern in the applied irrigation.

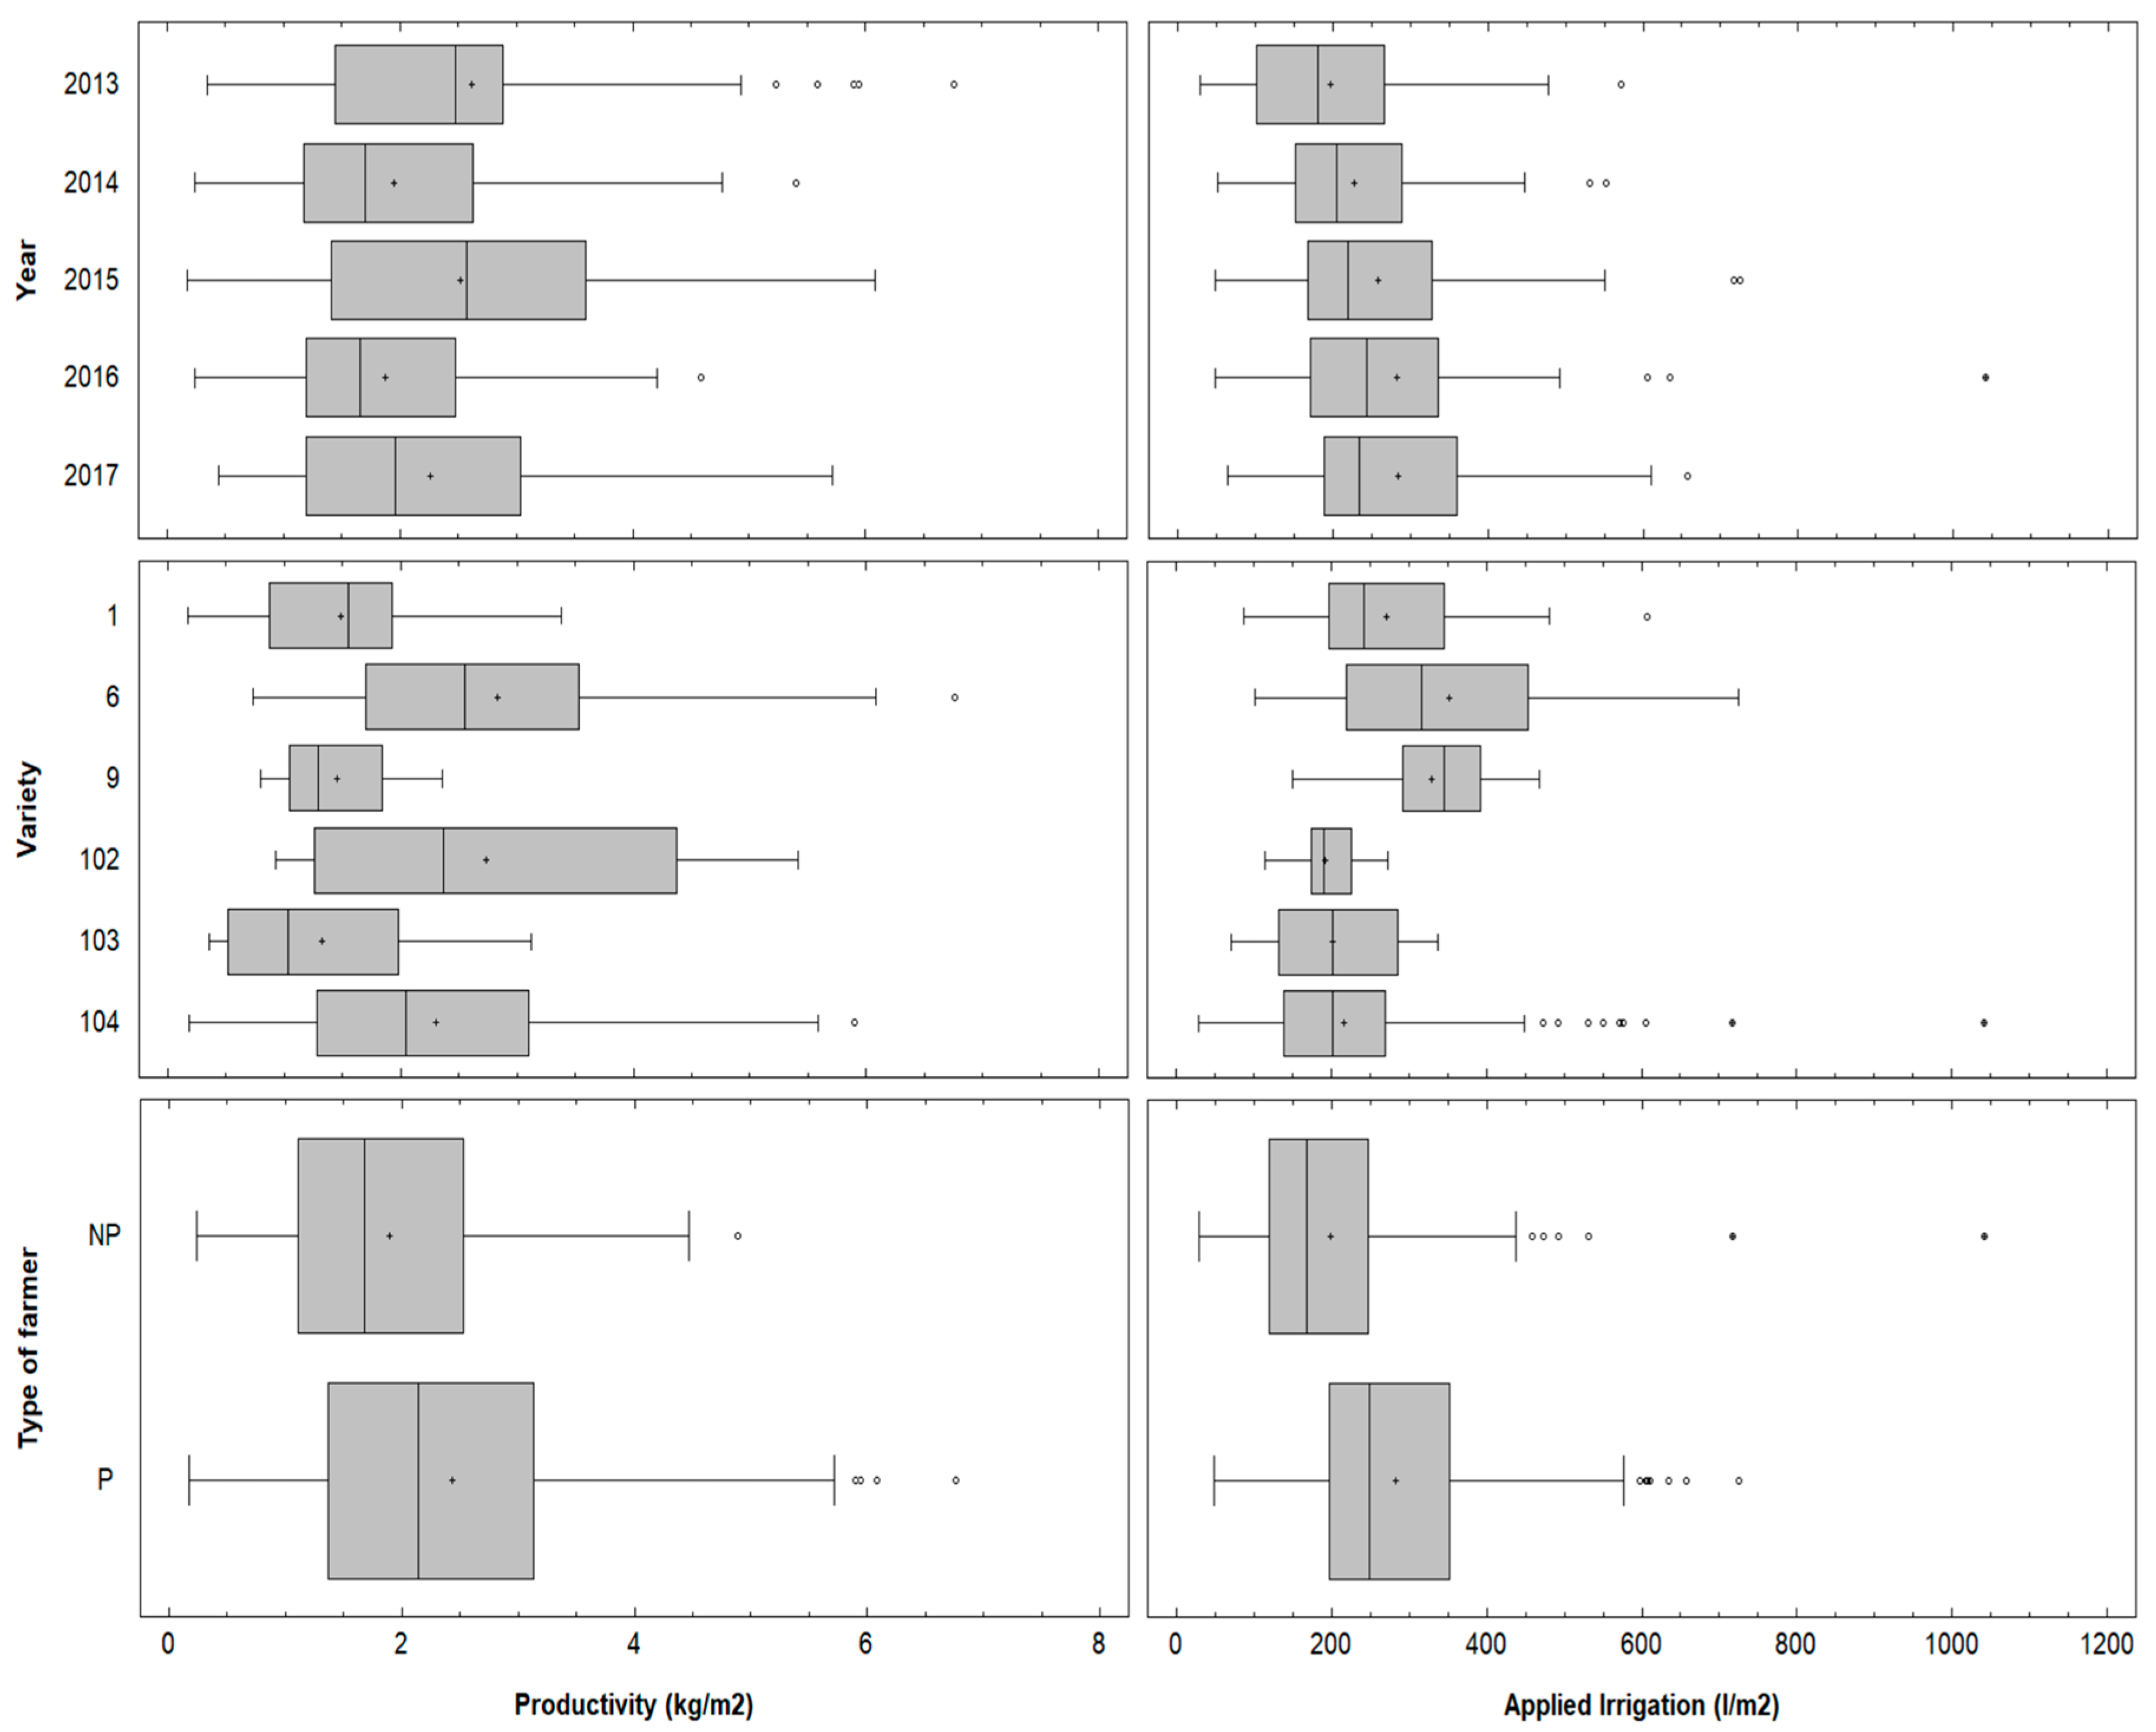
4.2. Analysis of Productivity and Applied Irrigation of Selected Varieties

In this section, we focus on the analysis of the productivity and applied irrigation of orchards and their variance. It is essential to analyze the trends on productivity and applied irrigation, as well as the effect of individual factors, before analyzing the indicators. The main reason to include these analyses is the need to characterize the processes, deficiencies, and interactions with the factors in the citrus cultivation. Otherwise, some of the effects which will be detected in the indicators can be difficult to interpret or understand. First, the results of the multifactorial ANOVA are presented. Next, the different factors are analyzed with box plots.
The results of multifactorial ANOVA in terms of the p-value for each included factor (year, variety, type of size of the orchard and type of farmer) and the obtained groups with the multiple range test are summarized in Table 4. To form the groups in the multiple range tests we selected the least significance difference (LSD). The factors that, according to the multifactorial ANOVA, have a statistical effect on the productivity of the orchards are year, variety and type of farmer. The type of size of the orchard was the only variable that does not affect productivity. In the case of applied irrigation, all the evaluated factors have a statistical effect on the irrigation of the orchards. However, since the groups created for the type of size of the orchard do not follow any trend, this factor is not analyzed. This effect can be caused by the presence of outlier or abnormal data in some of the groups due to the reduced number of orchards with big size. Box plots for the included factors and both variables are summarized in Figure 5. The variety and the type of farmer are the factors with higher significance according to their p-values.
Regarding Figure 5, the different years, which have different IRns, have shaped different productivity and a variable amount of applied irrigation. The productivities of 2014, 2016, and 2017 belong to the same group and are the years with lower productivity. On the other hand, 2013, 2015, and 2017 belong to the group with the highest productivity. It should be noted that, according to Figure 3, 2013 and 2016 have similar IRn values; but, according to the ANOVA, their productivity was different. Therefore, although the period (year) affects productivity, this effect is not linked to different IRn. Therefore, we can affirm that other environmental parameters, such as the temperature, must be considered to explain the productivity, including data from average temperature or growing degree days. Concerning the effect of the different years on the applied irrigation, we can see that the amount of irrigation applied to the orchards increases year by year. This effect was already pointed out in the analyses of Table 3, in which we consider only the mean, maximum and minimum values. According to the created groups, 2013 and 2014 are the groups classified with the lowest irrigation. The group with mean irrigation is formed by 2014 and 2015. Finally, 2015, 2016 and 2017 correspond to the group with the highest irrigation. We can claim that there is another factor which is affecting to the applied irrigation and it is causing this continuous increase. We are going to analyse the results of indicators along the studied period before drawing some possible explanations in the discussion section.
The effect of the different varieties (and species) can be seen in Figure 5. Differences in production and applied irrigation are found between varieties. Varieties 103, 1, and 9 have similar productivity and belong to the group with the lowest productivity. Average productivities of varieties are 0.85, 1.11, and 1.13 kg/m2 for varieties 103, 9, and 1. Varieties 104, 102, and 6 belong to the group with the highest productivity, with a mean value 2.26, 2.46, and 2.56 kg/m2. With regards to the applied irrigation, we can identify differences between both species: oranges are less irrigated than tangerines. However, among the different oranges, all the varieties have similar behaviours (all of them belong to the group with the lowest irrigation). The varieties of tangerine have different irrigation patterns. Varieties 6 and 9 are placed in the group with the highest irrigation. Varieties 102, 103 and 104 have received a mean irrigation value of 192.93, 202.07, and 217.66 L/m2, whereas varieties 1, 6, and 9 have received an average value of 272.21, 352.96, and 329.83 L/m2.
The last factor that affects productivity is the type of farmer, see Figure 5. The P farmers obtained higher productivity in their orchards, with an average productivity of 2.10 kg/m2. On the contrary, the average productivity of NP farmers is 1.35 kg/m2. Thus, in terms of productivity, P farmers obtain higher productivities than NP farmers, with P farmers obtaining 55% more production than NP farmers. Concerning the applied irrigation, P farmers are applying higher irrigation than NP farmers, and are classified as two different groups. In average, P farmers are using 543.76 L/m2 while NP farmers irrigate with 219 L/m2 in their orchards. Thus, according to the irrigation, P farmers are using a higher amount of water than NP farmers (147% of water). The comparison of P and NP farmers in terms of performance and efficacy in the studied area (citrus orchards in the East of Spain) is one of the major contributions of this paper. At this point, we cannot define which type of farmer is applying the most efficient irrigation since the increase of productivity is linked to an increase of irrigation. Nonetheless, to evaluate the water efficiency it is necessary to analyse the indicators, whose results are detailed in the following subsection. The fact of finding these extreme differences among P farmers and NP farmers will be analysed in the discussion section.

4.3. Analysis of Proposed Indicators

In this subsection, the proposed indicators are analysed to determine the best indicator of each type (service delivery performance, productive efficiency, and economic efficiency).

4.3.1. Evolution of Values for Each Indicator

As in previous subsections, a general overview of the included variables (indicators, in this case), is presented, see Table 5. First, we evaluate service delivery performance. In both versions, the indicator should have values close to 1 when the orchards are correctly irrigated (according to ETc and IRn). Nonetheless, we can identify that for both indicators, the mean values are below the expected value. According to the maximum and minimum values, we can identify some orchards, particularly in 2015 and 2016, that are applying excessive irrigation, reaching values of 1.8 or 2 in the RIS. In opposition to the irrigation case, see Table 3, no trend is observed in the included years for the indicator based on irrigation. This can be explained by the low IRn of 2015 and the high IRn of 2017, and more data will be necessary to achieve more accurate results. With the included data, it is clear that RIS can clearly identify the orchards that consume more water than the recommended one and has a higher range and standard deviation in the analysed data.
Regarding productive efficiency, again, no clear tendency is observed along the studied period. The year with the highest productivity is 2013. As detailed in the analyses of Table 2 and Table 3, it is remarkable that the year with the highest water productivity (for both indicators) is the year with the lowest values of the irrigation indicators. Comparing both versions, we can find higher differences in the WUEOverall. However, both indicators are complementary and can be used depending on the available data and the desired results.
Finally, EE is analyzed to evaluate the economic efficiency. In general terms, no significant behaviour can be identified. Nonetheless, when this indicator is compared with WUEOverall and WUEQuality, a trend can be identified. The first year, with a total production of 19 kg/m3, the economic indicator is 18 € per € of water expenditure. The relation between both indicators is almost 1-1 (WUEOverall – EE), being 2014 the year with the lowest relation between both indicators. Since the irrigation cost (denominator) is increasing, the most probable cause for the increase of income (numerator), when comparing both indicators and considering that the productivity is not increasing, is the change in the cropped varieties due to their higher economic value. For a single irrigation community, it is not so important to have a scale to classify the performance, but it is possibly better to have a benchmarking of its own indicators along time to tell if the overall management is improving or deteriorating.

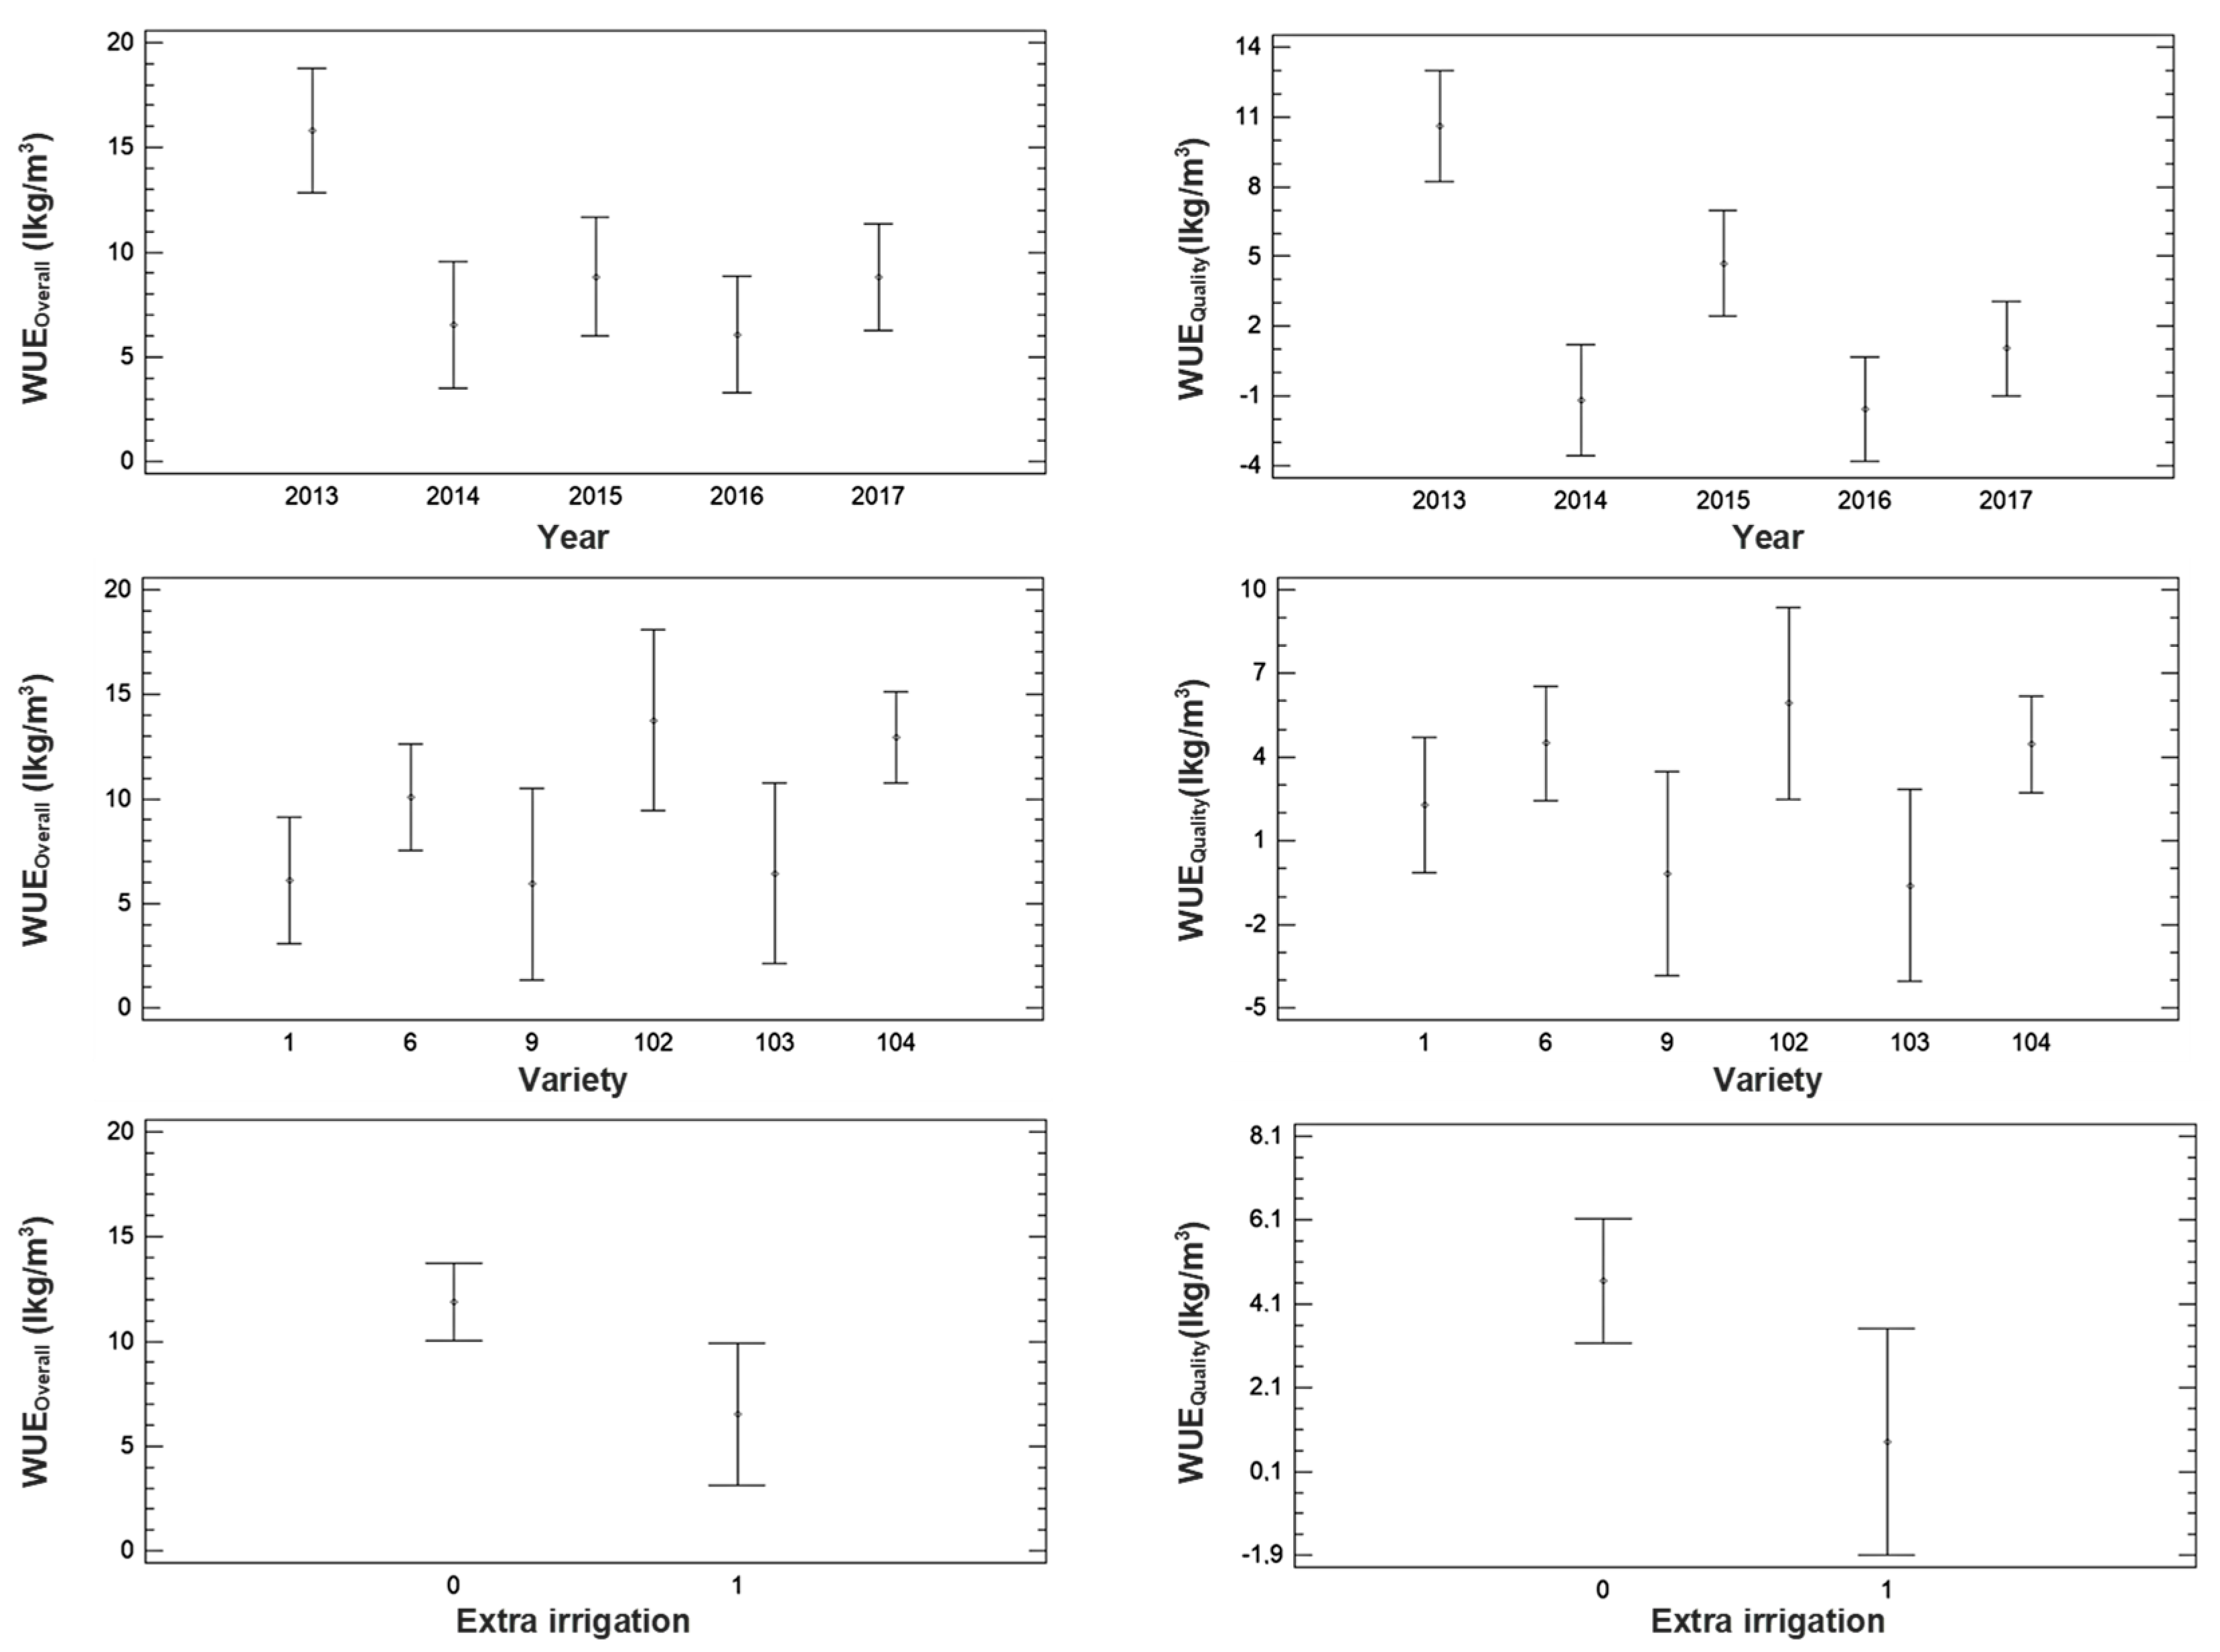
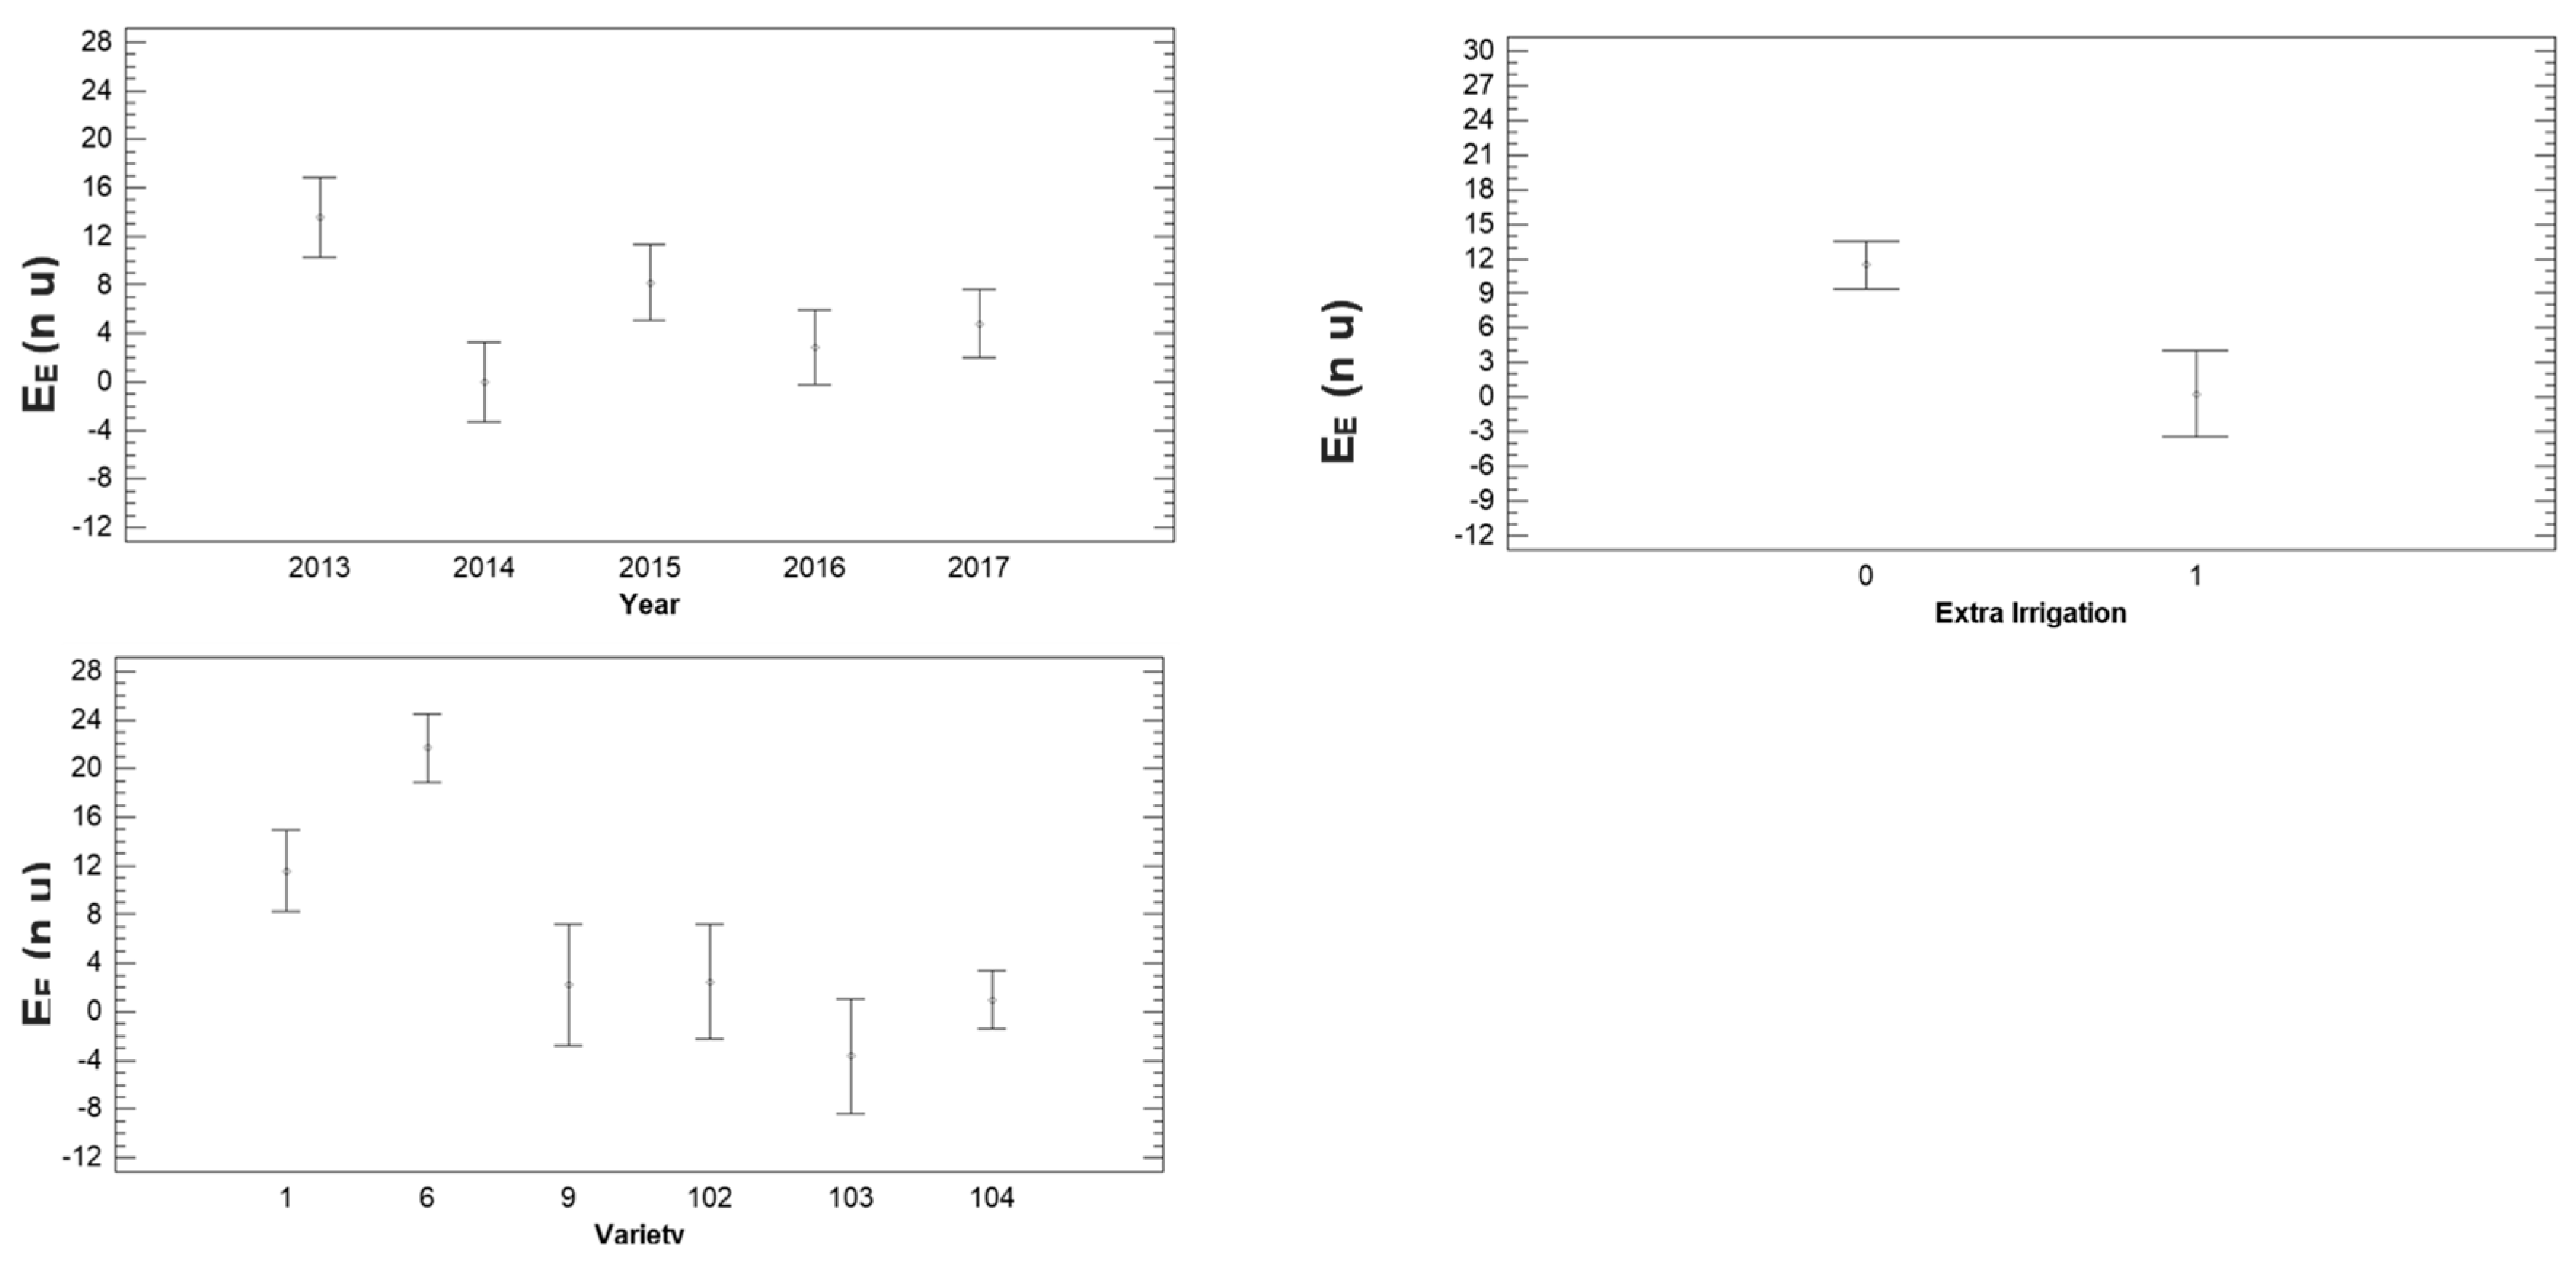
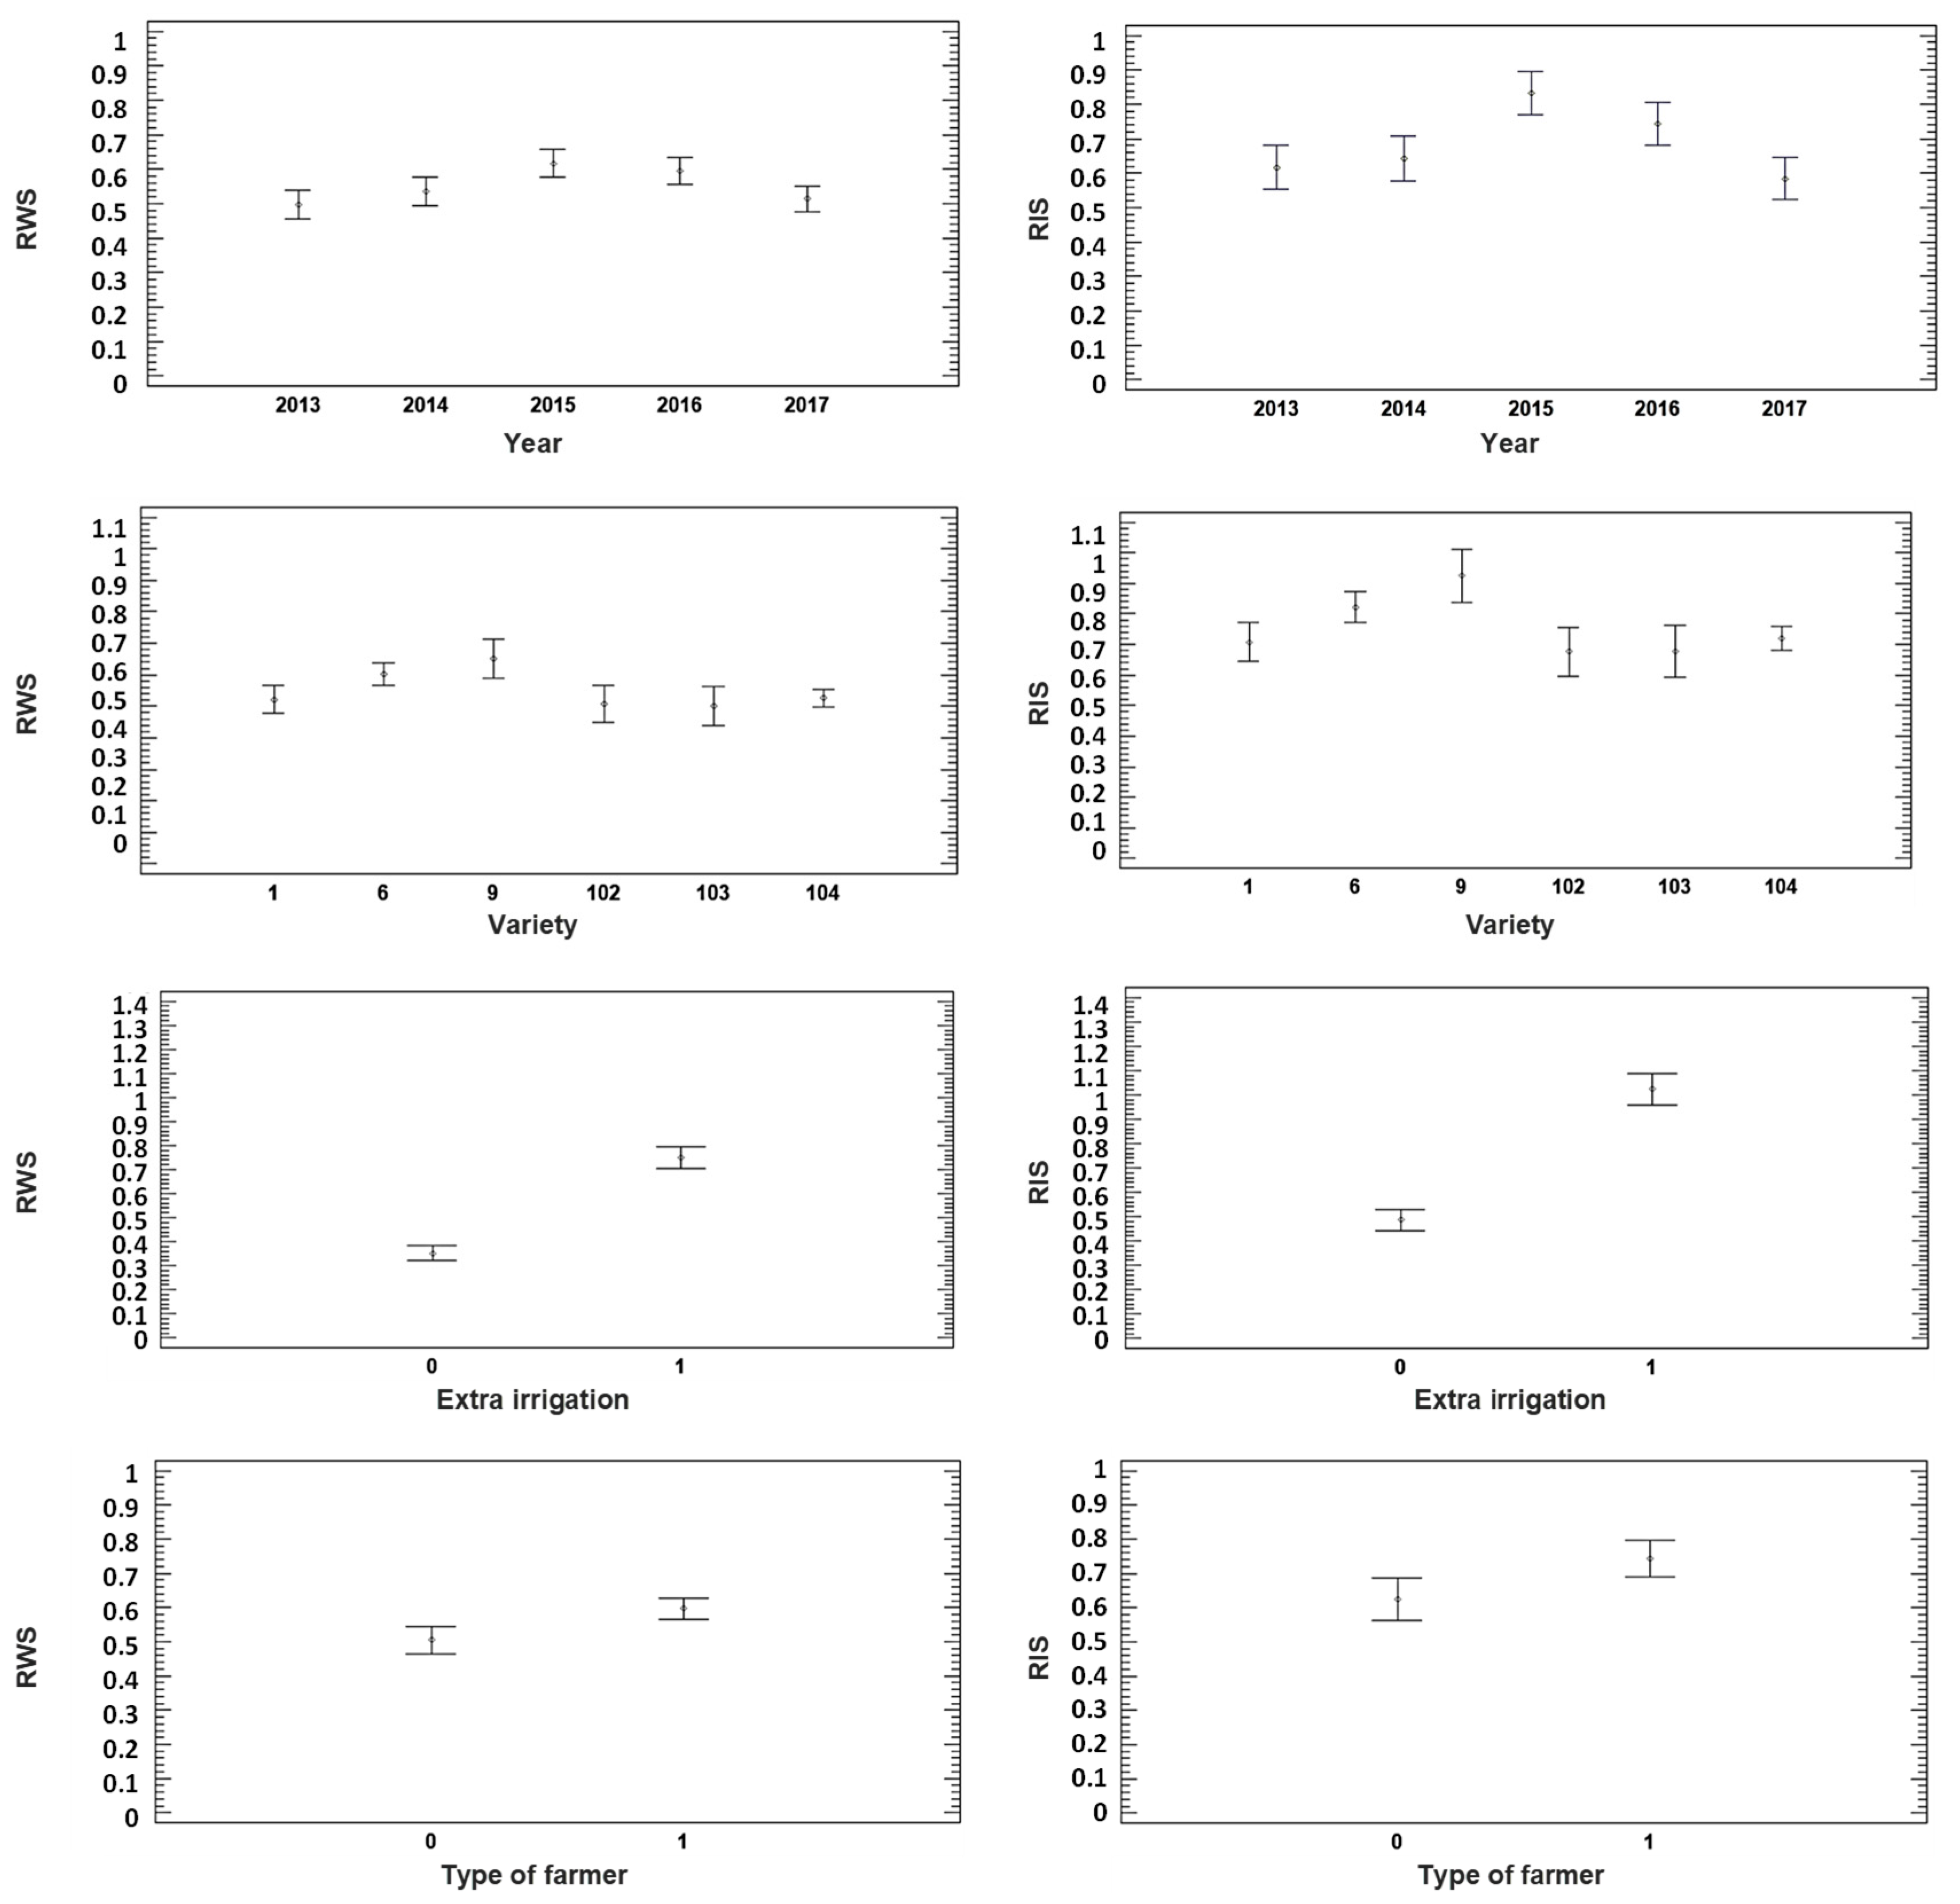
4.3.2. Effect of Different Factors on Indicators

After analysing the changes in the trends of indicators and their relationship, now we evaluate the effects of different factors on the indicators. In this case, we include five factors (year, variety, type of size of the orchard, extra irrigation, and type of farmer). Extra irrigation is a new factor related to the limitations imposed by the irrigation community to farmers. Due to the concession, a maximum amount of irrigation is allowed for each orchard. However, farmers can exceed this limitation and pay an extra price for this water. We include this factor in the analyses of indicators to appraise the effect of the productive efficiency indicators, and the extra cost in EE. The effects of the mentioned factors are summarised in Table 6 and Figure 6, Figure 7 and Figure 8.
For the first version of the service delivery performance indicator, all the evaluated parameters have a p-value lower than 0.05 and are statistically significant. However, as said in previous sections, the effect of the orchard size is not apparent in the graphics and is not included. The rest of the factors are included in Figure 6. For the second version of the first indicator, the orchard size and the type of farmer are not representative. Nonetheless, we are going to compare both indicators in Figure 6 even though the type of farmer does not affect one of the versions. The effect of different years is analyzed in the previous subsection according to the multiple range tests with LSD intervals, where two groups are found for RIS. The first group has the lower indicator values, and it is formed by 2013, 2014 and 2017; whereas, the second group, composed of 2015 and 2016, presents higher indicator values. RIS and the results of multiple range test are the same.
Regarding the effect of varieties, for RWS, two groups can be distinguished. The first group is composed of varieties 1, 102, 103, and 104, and have the lowest values. The second group is formed by varieties 6 and 9. Results for RIS are slightly different and three groups can be identified. Varieties 104 and 102 belong to the group with lower values. The second group is composed of varieties 1, 9, 102 and 103. Finally, the last group, with the higher values in RIS is formed by varieties 1, 6, 9, and 103. Concerning the extra irrigation, both indicators offer the same values and two groups can be set apart (being the group composed by extra irrigation, the one with best results). For the type of farmer, only the RWS produced two groups. The group composed of P farmers is the group with the lowest values of the service delivery performance indicators. Therefore, as identified before, the second version of the first indicator offers a more accurate separation of scenarios and has a higher potential to evaluate the service delivery performance.
Regarding the productive efficiency indicator, only three factors are statistically significant for WUEOverall (year, variety, and extra irrigation). The number of significant factors is reduced to two, year and variety, for the WUEQuality indicator. In Figure 7, we have included the three factors for both productive efficiency indicators to allow a comparison. For WUEOverall, two groups can be distinguished for the year factor. The group with higher productive efficiency is composed by only one year, 2013. The rest of the years have similar productivity. Yet, for WUEQuality the years are classified into three groups, being the best group (the one with the highest productive efficiency) the one formed by 2013. The second group, in terms of productive efficiency, is formed by 2015. The rest of the years are classified in the group with the lowest productive efficiency.
Concerning the varieties, the results for WUEOverall point out the creation of three groups. The group with the highest productive efficiency is composed of varieties 102, 104, and 6. Finally, for the extra irrigation, the results are the same for both versions of the indicator. There are two groups, and in the orchards with extra irrigation, the productive efficiency in terms of kg/m3 decreases. It is important to note that in the case of WUEQuality, in some cases, after applying the LSD intervals the lower part of interval might appear as a negative value due to the high variability of data and the fact that a considerable number of orchards have 0 kg of optimal grade.
Finally, the economic efficiency indicator, EE, is analysed (see Figure 8). In this case, the results of multifactorial ANOVA indicate that three factors have a significant effect on the indicator (year, variety, and extra irrigation). The effect of the different years was discussed in the previous subsection, and according to the multiple range test and the LSD intervals, five different groups are formed. Regarding the varieties, we can identify three different groups. The group with the lowest economic efficiency is composed of 9, 102, 103, and 104. To finish this analysis, the extra irrigation factor has formed two groups. The orchards that received extra irrigation are classified in the group with the lowest values for this indicator.

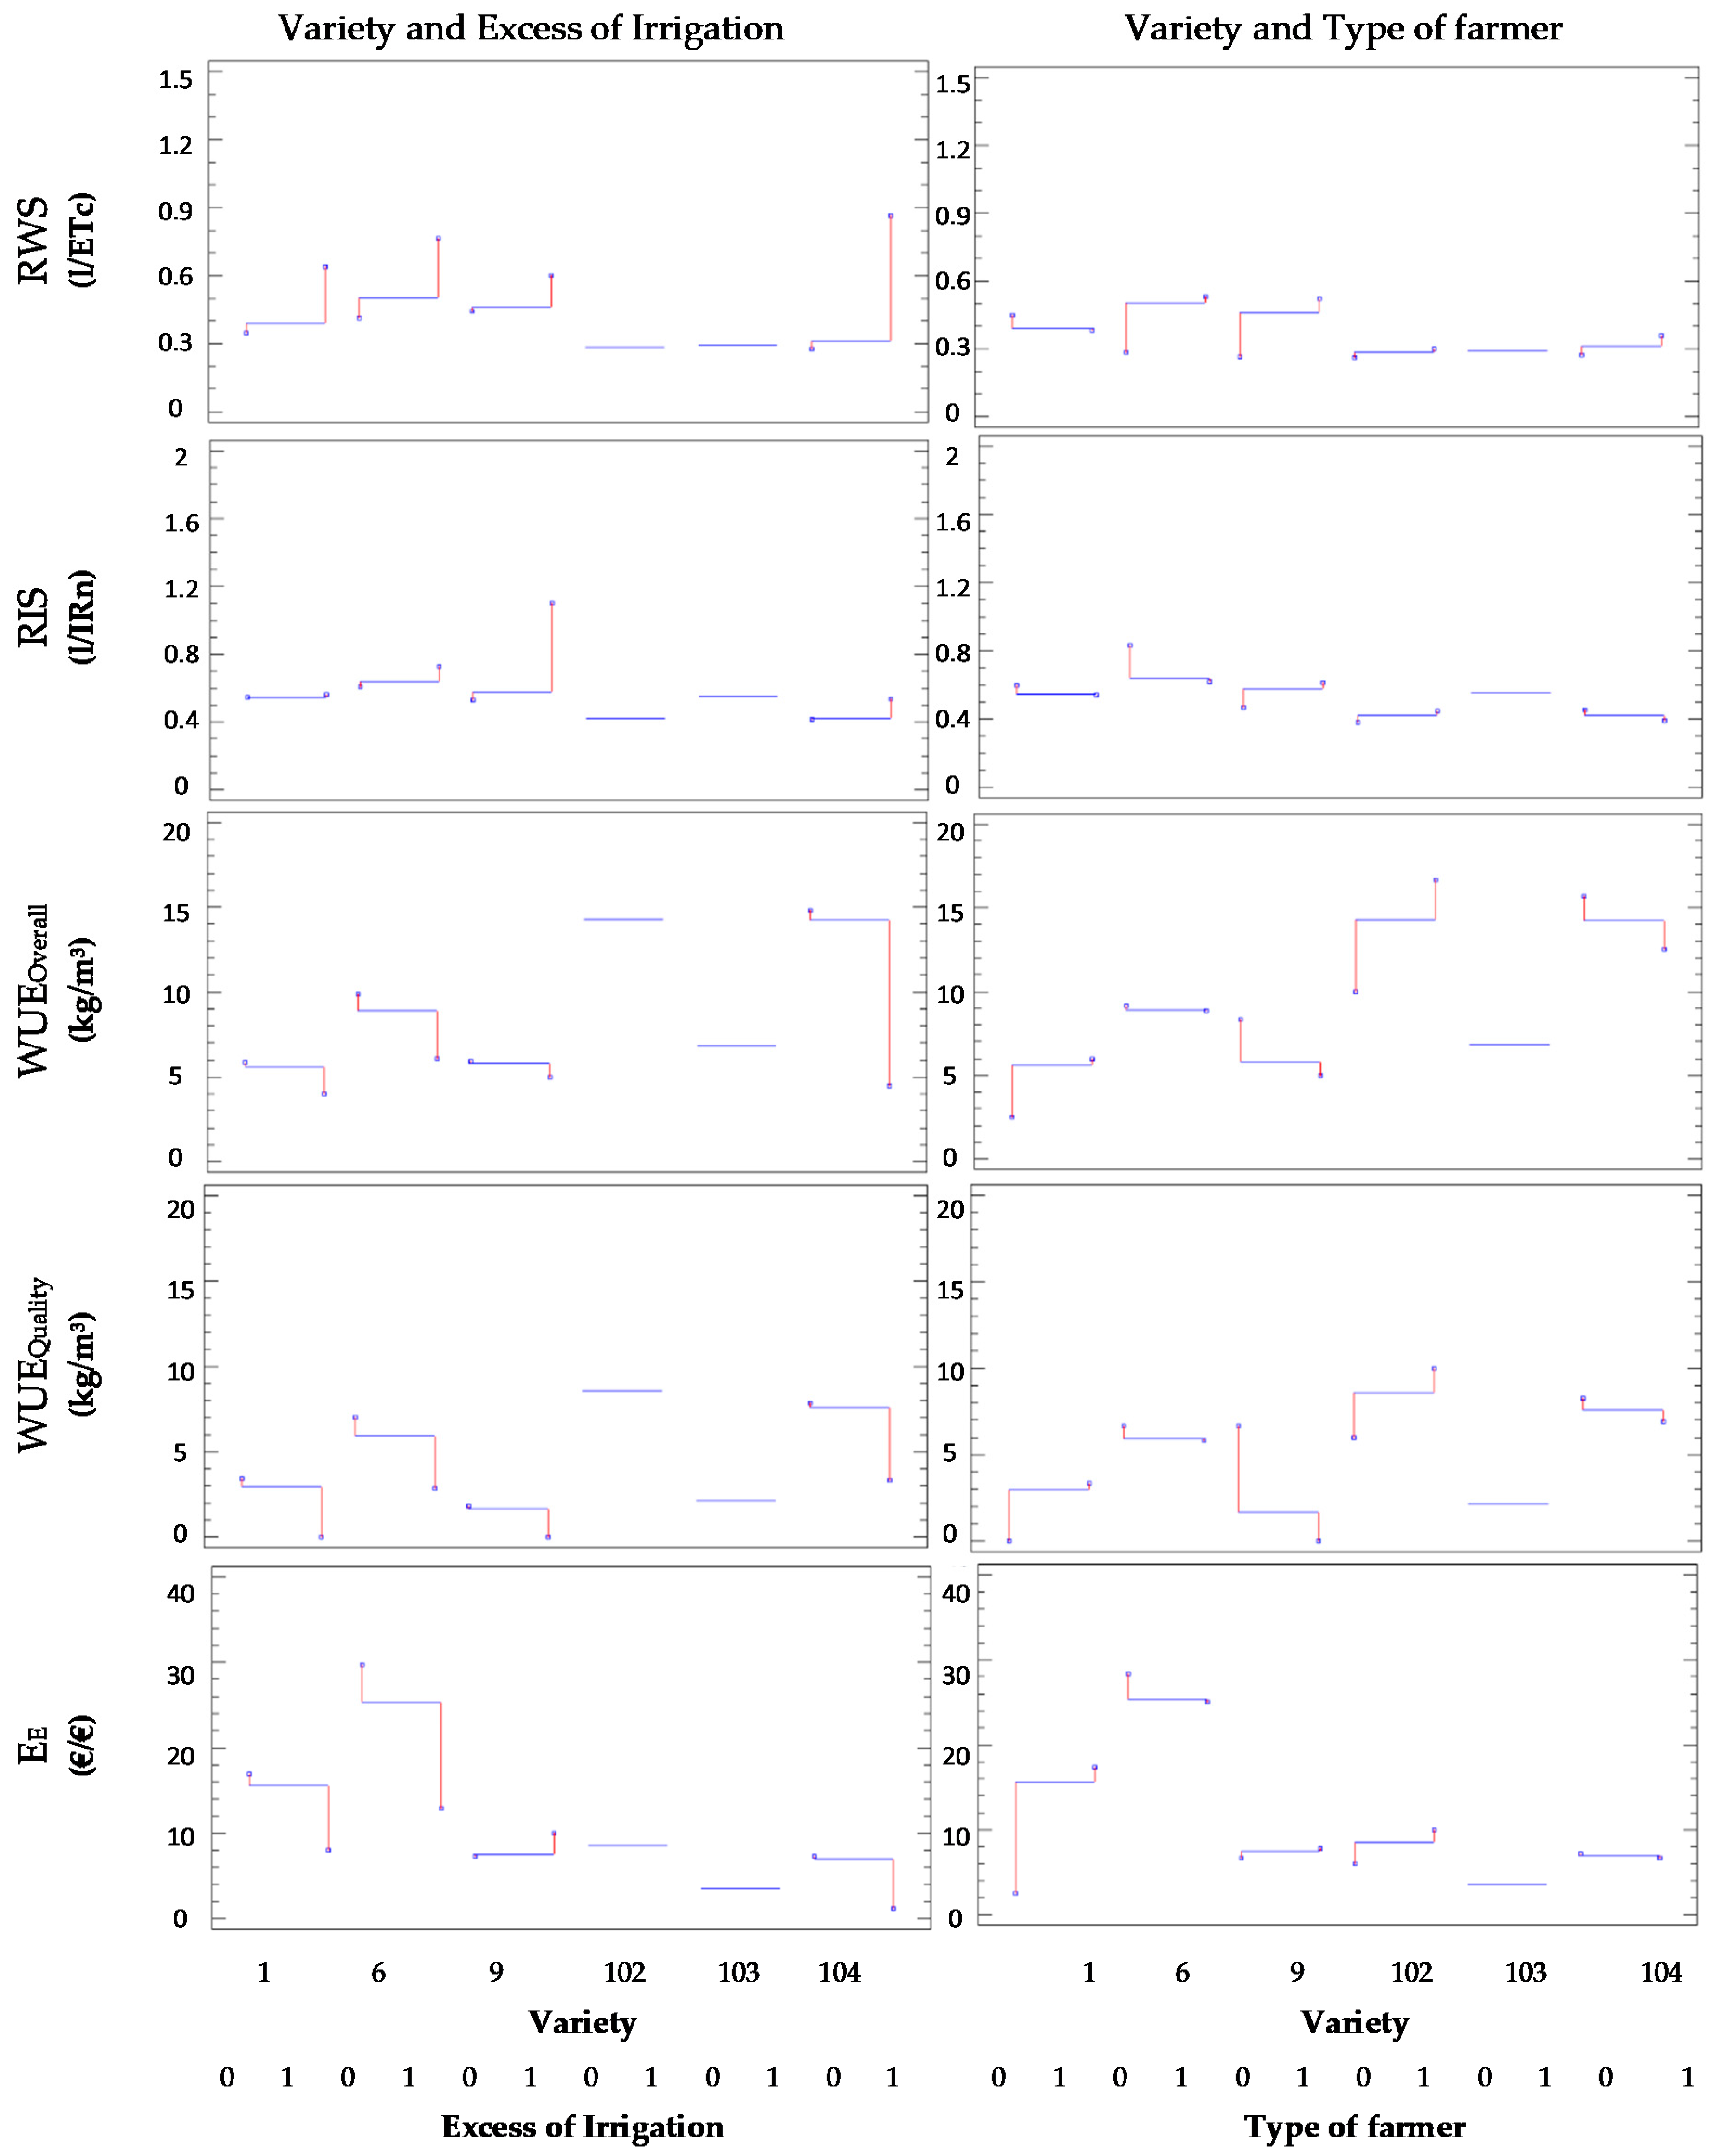
4.3.3. Effect of Combined Factors on Indicators

For this analysis, we have selected the following indicators RWS, WUEOverall, and EE. The reason for using these indicators is that, for those indicators, the effect of the selected factors is higher. The analysed factors are the variety, extra irrigation, and type of farmers. We have selected these variables since they are the ones for which the extracted information can be converted into recommendations to farmers.
In Figure 9, we can visualise the combined effect of variety and extra irrigation, on the left column, as well as the effect of variety and type of farmer, on the right column, for all five indicators. In each graph of Figure 9, the blue horizontal line specifies the average value of the indicator for each variety and the red vertical lines show the deviations of the average for applying or not excess irrigation, on the left column, and the deviations of the average for professional or non-professional farmers, as specified in the second X-axis. First, we are going to analyse the effect of extra irrigation. As stated before, the effect of extra irrigation increases the value of RWS. This effect can be seen in four out of six varieties (varieties 1, 6, 9, and 104). For varieties 102 and 103, this effect is not visible since no farmer that crops these varieties has performed extra irrigation. The positive effect over the service delivery efficiency indicator is more evident in Navelina (104) than in the tangerine’s varieties (1, 6, and 9). Nonetheless, when WUEOverall is analysed, as established before, the effect of extra irrigation has a negative effect on the value of the productive efficiency indicator. For the four varieties to which extra irrigation has been applied, the productivity in kg/m3 decreased when comparing the values of extra irrigated orchards with the rest. The decrease of water productivity is notorious in Navelina, being reduced from 15 kg/m3 to 5 kg/m3, approximately. The reduction is lower for varieties 1 and 6 and lowers down for Oronules variety (being reduced from 6 kg/m3 to 5 kg/m3, approximately). Finally, the economic impact of this reduction in productivity together with the increase of extra irrigation costs have a devastating effect on the economic efficiency indicator. Only one of the varieties increases the economic indicator when extra irrigation is received, the Oronules (with an increase of 3 € per invested € in water). For the other three varieties, the extra irrigation decreases this ratio. For variety Navelina the ratio decreases from 7 to 1, whereas for other varieties the decrease in the ratio is even higher, from 17 to 8 for Clemensoon and from 30 to 13 in Nadorcott.
When we analyze the effect of the type of farmer in the three indicators, no clear tendency is found. For some varieties, the effect is positive and in others is negative. P farmers obtain better results in productive efficiency and economic efficiency for Clemensoon and Lane Late than NP farmers. However, NP farmers reach higher productive efficiency for Nadorcott. Nonetheless, this increase in productive efficiency is not reflected in the economic efficiency.

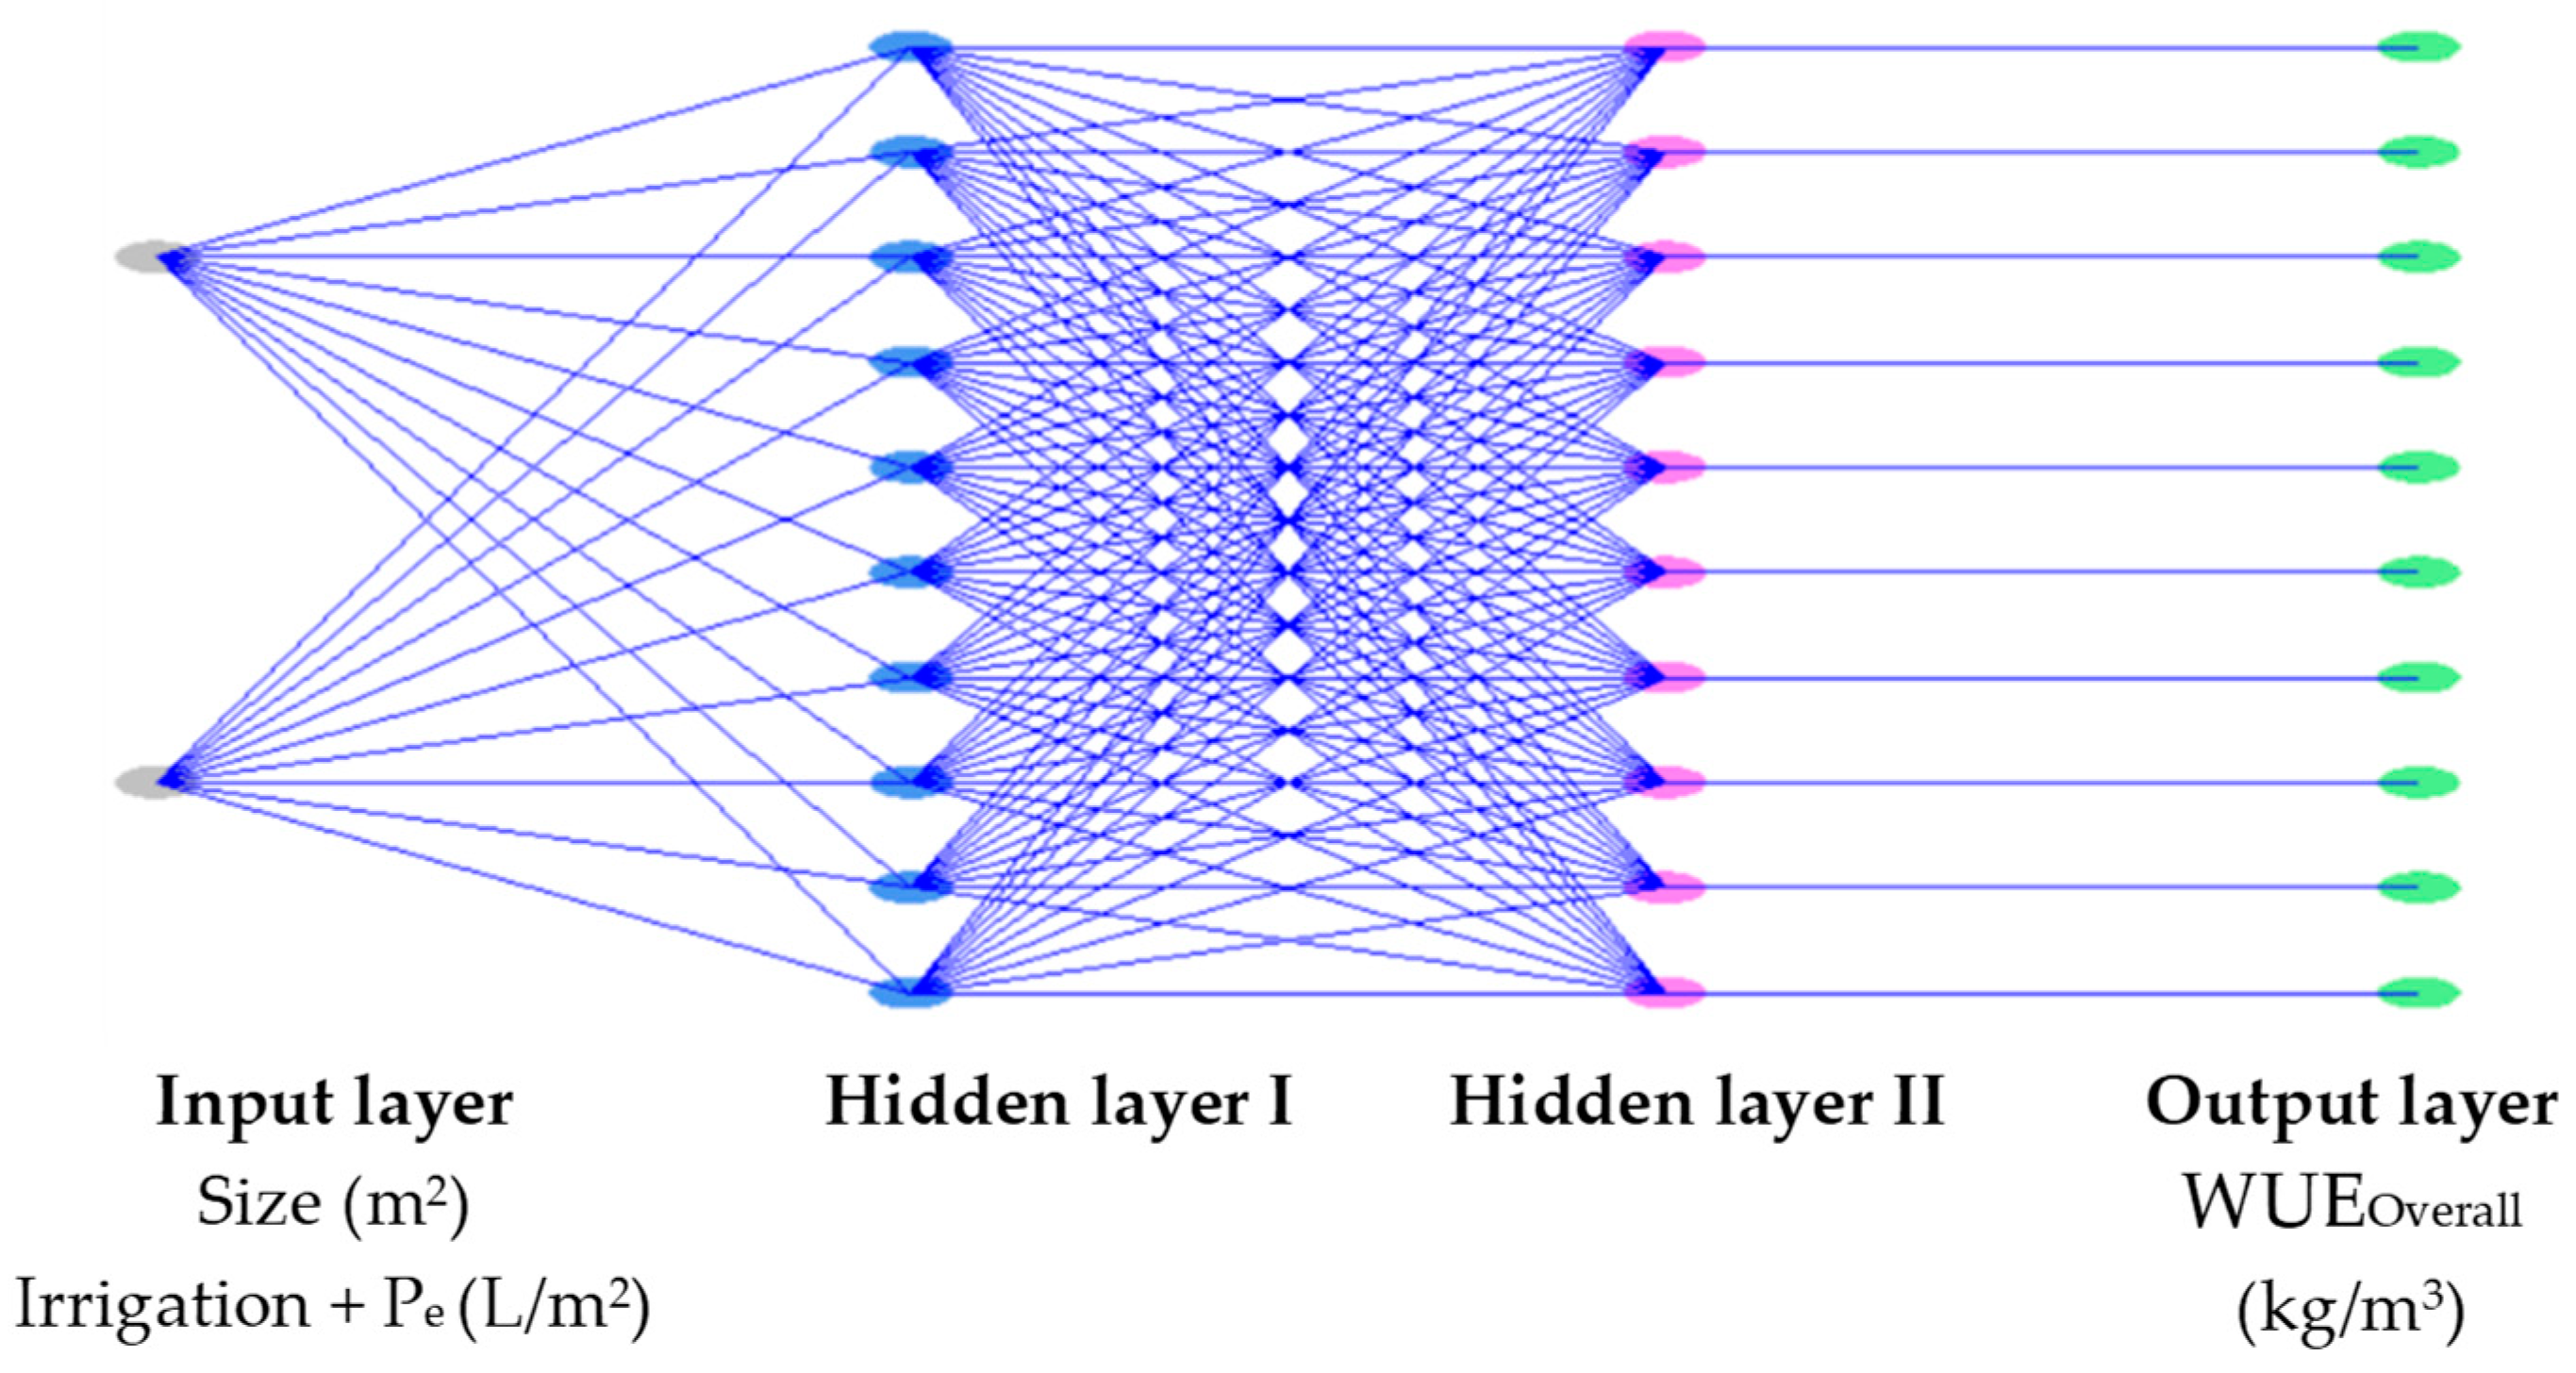
4.4. The Use of Indicators in ANN to Establish Recommendations

Finally, we are going to use the indicators in an artificial intelligence system based on ANN, to establish recommendations on irrigation limitations to avoid water misuse. Since one of the main objectives of this study was to evaluate the usefulness of different tools for water management in the agricultural agroecosystems, the AAN is included in this paper. In this section, we test the effectiveness of ANN to determine thresholds and identify abnormal patterns with the data of indicators. ANN are widely used in agriculture for yield prediction [25], irrigation management [26,27] and even for estimating the evapotranspiration [28].

4.4.1. Definition of Selected ANN

ANNs are based on the interconnection of different units (neurons) and are designed to recognize patterns and predict the expected behavior or output value (indicator) given a certain data or input values (irrigation data). Thus, we can use this tool to feed it with the data of the indicators obtained in this paper, to identify threshold values of irrigation to assess farmers.
The ANN used is represented in Figure 10. In this figure, we can see the aspect of the used ANN, including the number of layers and neurons. It is composed of 2 neurons in the input layer, two hidden layers and an output layer with ten neurons. The input layer takes as variables the size in m2 and the received water in L/m2. This is the information provided to the system, which will be used to estimate the output variable. Since not all the varieties have the same number of observations, the number of neurons in the hidden layers is detailed below. The hidden neurons perform the operations that the system uses to estimate the output value, as weighting and summation. As for the output layer, we selected a performance efficiency indicator, the WUEOverall (kg/m3). We selected as the probability, proportional to the observed one, an equal cost of error for all the groups, and the use of jack-knifing to create the influence spheres due to its capability for correcting estimation bias. Those are the parameters which must be defined to obtain the results of the ANN. Since the WUEOverall has very different values, we have classified this indicator rounding its value to the closest multiple of two to optimise the performance of the ANN.

4.4.2. Results of Selected Artificial Neural Network

In this subsection, we detail the results of the ANN. First, the number of neurons on the hidden layers, the jack-knifing value, and the % of correct classification are summarized in Table 7. We focus on Nadorcott for the tangerines and Navelina for oranges, and their overall results (considering the data of all varieties). The results of the rest of varieties are not presented since the number of observations in theses varieties are too low to allow the creation of an ANN and a proper analysis of the results. The % of correct classification was higher in oranges than in tangerines. The lowest values are related to cases with fewer observations.
The results of the ANN for WUEOverall can be seen in Figure 11. For each case, we can identify the expected indicator for a combination of orchard size and total received water (left) and the details for small orchards, which are not visible in the general graphic (right). The color scale is based on the classification of WUEOverall mentioned before, being the best productivities in terms of water efficiency the dark green colors.
Comparing the general results with the results of both varieties (Figure 11a), we can ascertain that the overall result is highly influenced by the dominant Navelina results. This general result can be used just for generalization in the scenario of the included orchards and farming practices form the database.
With regards to (Figure 11b), results for Nadorcott, we identify that only in a small area of the graphic (orchard size from 0 to 8000 m2 with little irrigation, almost 0 L/m2) the maximum productive efficiency, higher than 20 kg/m3, is reached. Nonetheless, this area might represent the influence of an abnormal case and should not be considered as a general trend.
We will perform a comparison for the view where only two orchards can be found with a productive efficiency higher than 20 kg/m3. The orchards have 6000 m2 and 7000 m2 and are managed by a professional farmer. These extreme values of productive efficiency are not reached for two consecutive years nor orchards. The changes in the irrigation do not explain the observed changes in productivity since irrigation amounts are similar. Therefore, the most plausible explanation to these sharp changes in the productive efficiency is the alternate fruit bearing, which has been described in Nadorcott [29]. Alternate bearing is a tree response to physiological factors that results in cycles of high yield one year and low yield the following year. In citrus it is caused by lack of flowering induced by a precedent high-crop year. This way, a lower productivity in alternate years for these two Nadorcott orchards can be attributed to a lack of flowering and subsequent fruit set and fruit yield, rather than to the effect of irrigation on crop yield.
Regardless of this, productive efficiency does not increase from 14 kg/m3. These productive efficiencies are also found in small orchards and low irrigation. Remarkably, no area with very low or null productivity is found in small orchards and high irrigation. According to the data included in the database, similar productive efficiencies of Nadorcott can be obtained in small orchards with extremely different irrigation doses (200 to 4600 L/m2). This would explain the excess of irrigation since farmers realize that this extra water impacts on the productivity in kg/m2. However, as seen before, this practice has no positive impact on economic indicators.
Concerning the Naveline (Figure 11c) unlike with Nadorcott, a clear tendency is observed. There is a threshold of irrigation according to the size of the orchard. In addition, significant areas with high productive efficiency are identified. The highest productive efficiency (>20 kg/m3) is linked to big orchards with low irrigation. However, as established before, more information about the farming practices is needed to better understand this phenomenon in the case of Nadorcott variety. The primary trend indicates that productive efficiency is higher in orchards of big size and a variable amount of irrigation. In contrast to Nadorcott, in the case of Naveline the high irrigation in small orchards has a detrimental effect on productive efficiency. In the smallest orchards, when irrigation exceeds 80 L/m2 the productive efficiency is reduced to 14 kg/m3, and when it exceeds 200 L/m2 it is reduced to <6 kg/m3. Finally, with irrigation doses of 500–750 L/m3, the productive efficiency is almost null in kg/m3. However, in terms of kg/m2, productivity increases.

5. Discussion

With the purpose of discriminate between the obtained results and the analysis of main findings we have separate the content in two sections. In line with the exploratory study aiming at describing the main drivers that lie behind the obtained irrigation performance indicators, in this section we are going to summarize the main findings and their implications in the water efficiency of the evaluated area and identify the bests indicators based on the available data.

5.1. The Confusing Effect of ETc and IRn on the Service Delivery Performance Indicator

One of the first issues we can find when the indicators are analyzed is the sharp difference between the results in service delivery performance and the rest of indicators. According to the service delivery performance indicators, it seems that almost all the orchards, even the ones that consume more water than the prescribed quantity needed to increase the irrigation. In Figure 6, we can identify that those orchards that have consumed more water than prescribed reach higher values in RWS. This effect is also found in RIS, although this effect is not so notorious. According to service delivery performance indicators, we would expect that those orchards that consume a higher amount of water have higher water productivity and obtain better scores in the productive efficiency indicators (WUEOverall and WUEQuality). Nonetheless, for those indicators that consider the quantity of production per applied water, the orchards that use extra water have the worst values. This means that those orchards require higher amount of water to produce the same quantity of fruits. Indeed, those orchards that consume more water have the worst economic efficiency since a higher amount of water productivity does not compensate for the cost of this excess of water.
Therefore, we must find the reason why almost all the orchards are irrigating with less quantity of water than the IRn or ETc point out. The most probable reason is that those indexes are calculated based on the gathered data by the closest meteorological station, which might not be representative of the climatic conditions of the area where the orchards are located (especially when it comes to the estimations of effective rainfall since rainfall has a high spatial variability and the FAO method of calculation is only a sensible estimation). The fact of using data that might not be representative of the region can generate doubts in farmers, and even push them to irrigate in a wrong way, which could explain the increase of irrigation. Thus, climatic data for the proper calculation of ETc and IRn must be obtained from the exact region in which the crops are placed. The problematic of proper ETc calculation based on FAO indications, due to lack of accurate information, is pointed out by Todorovic et al. [21], Awal et al. [22] or Tomas-Burguera et al. [23], among others.
In this frame, it is necessary to encourage farmers to locate a meteorological station in the orchards to gather more accurate data. In addition, the identification of local differences and the deployment of meteorological stations in specific points will increase the performance of the first indicator. In this context, the use of new technologies like Wireless Sensor Networks (WSNs), soil moisture sensors [30], or meteorological stations could help farmers make a more sustainable use of water resources. Furthermore, remote sensing indexes like RGB indexes or NDVI [31], whose use for efficient water management is extended, can be useful to ensure proper irrigation management. If remote sensing is going to be used, the spatial resolution of the selected satellite should be considered. Based on recommendations of Cammalleri et al. [32] the remote sensing data might not be useful in the smallest orchards.

5.2. The Motivations behind the Orchards with Extra Irrigation and the General Tendency of Increasing the Applied Irrigation

The second aspect that must be analyzed is the reason that pushes some farmers to exceed the prescribed irrigation, the so-called extra irrigation. First, we need to analyze if those orchards are the same every year. The answer is not; there is only one orchard that was extra irrigated every year included in this study. The average production of orchards in which we found extra irrigation is higher (2.92 kg/m2) than the ones that do not (2.16 kg/m2). Nonetheless, as explained in previous sections, the economic efficiency is not favorable for extra irrigated orchards. The decrease of the productive efficiency due to an increase in irrigation is also pointed out by Chai et al. [33] in case of cotton. Similar results were observed in wheat production by Yu et al. [34]. Al-Roussan et al. [35] conclude that a reduction of 25% on irrigation does not have an impact on the yield of Navel oranges.
Since no effect on productive efficiency, economic efficiency, or annual variations is found, we are going to evaluate the average irrigation. Two differentiated tendencies can explain the extra irrigation. The first one, an excess in water consumption due to a temporal event (period of drought), which will have a small effect on the average water consumption. The second options are due to a constant excess in water use, in which case the water consumption will be different that orchards without extra irrigation. The average irrigation of orchards that respect the prescribed quantity of water is much lower (219 L/m2) than the orchards that applied extra irrigation (543 L/m2). Finally, we want to determine if the extra irrigation is increasing. Along the five years included in this study we find orchards with extra irrigation. Nevertheless, the percentage of orchards that extra irrigate is different. It was minimum in 2014 (1.85%). However, 2014 was not the year with lowest IRn; in fact, it was one of the years with higher IRn. The percentage of the orchards that extra irrigate in 2015, the year with lowers IRn, is 8.47% (a higher percentage than in 2013 and 2014). The number of orchards with extra irrigation in 2016 and 2017 reached 10% and 23%. Therefore, it seems that there is a phenomenon that is increasing the extra irrigation and is not linked to the IRn. The last variable that can affect the increase of extra irrigating orchards is the changes in the copped varieties. According to the specie, tangerines are extra irrigated in the 20% of orchards included in the database. On the other hand, orchards with oranges receive extra irrigation only in 5.3% of cases.
About the varieties, varieties with a higher percentage of orchards with extra irrigation are Nadorcott and Oronules with 26% and 31% of orchards. Whereas Clemensoon and Navelina varieties only receive extra irrigation in 3.3% and 5.6% of cases. Lane Late and Navel Powell do not receive extra irrigation in any case. Considering the information represented in Figure 4, Nadorcott and Oronules varieties are being cropped in more orchards during the last years. Nonetheless, we consider that this increase is not enough to justify the observed tendency. After discarding all the possible causes based on the collected data, the most probable reason for this fact is a change in the irrigation pattern of the farmers. This change in irrigation patterns has probably been caused by the increase of land productivity when compared in kg/m2 and in the total incomes in orchards with extra irrigation as €/m2. Since the new cropped varieties have a higher price in the market the farmers are willing to increase the applied irrigation, notwithstanding the increase in the costs, to maximize the land productivity, which will report higher benefits. Yet, we have proved that this increase has a negative impact in the productive effectivity and on economic effectivity, unlike for Oronules. Therefore, it will be necessary to evaluate other indicators study in detail this trade-off between water efficiency and the economic benefits of farmers.

5.3. Are the Profesional Farmers More Efficient in Water Management Than Non-Profesional Farmers?

We want to evaluate if the different type of farmers (P and NP) have an impact on the efficiency in water management. The results of this study pointed out that for some indicators, such as RWS, professional farmers have a higher score than non-professional farmers. According to Figure 5, P farmers tend to consume more water and have a higher harvest than NP farmers. Nevertheless, this different behavior does not have any effect on productive efficiency indicators, WUEOverall and WUEQuality, nor the economic efficiency, EE. The most probable reason for this increased water use is the cropped varieties by the P farmers in comparison with the cropped varieties by NP farmers, see Figure 12. P farmers use to grow the varieties that receive higher irrigation doses, like Nadorcott and Oronules. According to Figure 12, Nadorcott represents the 26% of orchards in the P farmers and only 6% of NP farmers. Similar values, but with lower differences, can be found for Oronules, 3% and 5% for P farmers and NP farmers, respectively. Due to this variety’s distribution, the P farmers have a higher consumption of water. Besides, Nadorcott is the one related to the extra irrigation.

5.4. The Changes in the Varieties and Their Efficiency in the Water Use

As it was analyzed in previous subsections, it has been detected an increase of some varieties. The varieties with the higher increase, in terms of the number of cropped orchards, are the Clemensoon (with an increase of 16%), Oronules (8%), and Nadorcott (4%). This increment is based on the reduction of Navelina, which was the predominant crop in 2013. The observed tendency is since new varieties have a higher price in the market, and apparently, they report major benefits to the farmers. Nonetheless, it has been observed in the ANOVA for irrigation that farmers are irrigating the orchards of tangerines with a higher amount of water than the water used in Navelina. As far as we are concerned, no other paper has published results of water efficiency for different varieties of oranges and tangerines. The findings of this paper are linked to the practices of farmers included in the database and the cropped varieties.
When the farmers of orchards with varieties of tangerine follow the limitations in water used prescribed by the irrigation community, the EE improves compared with other varieties of oranges such as Lane Late and Navelina. However, in terms of water efficiency in food production, WUEOverall, the varieties of orange have better performance than the ones of tangerina.
Besides the water management found in this paper, it is necessary to develop a determination of crop coefficients for the new varieties to obtain better evaluations of crop efficiency in terms of water use. In addition, due to the differences in the blossoming, fruit set, development, and maturation, it will be necessary to have more detailed information about irrigation in specific periods for each variety.

5.5. The Benefits of Including More Information

The analyses were performed based on the information available in the database of two organizations, the irrigation community and the cooperative of farmers. However, many data from the orchards (such as type of soil, solar exposure, slope, and wind exposure) and the farming practices (such as fertigation information, density or number of trees per orchard, use of biostimulants, the existence of grass coverage, and agricultural work among others) are needed if we want to have more in-depth analyses. In this study, we found several outliers which could be explained by specific characteristics of the orchard as the aforementioned ones. Since the objective of benchmarking is to use the indicators to find the most efficient orchards and share the agricultural practices of these orchards with the rest to improve the efficiency at the community level, we need to include more variables in our database.
Some of those variables can be obtained by means of technology, implementing WSN for PA as described in [36] and remote sensing. Besides the implementation of PA to gather more data, the collaboration of farmers in sharing data will be needed. Thus, it is essential to involve farmers in the data gathering process by questionnaires and interviews, to ensure the collection of required information for future work.

5.6. The Selected Indicators

As established at the begging of Section 4.3, we have presented five indicators, and we expect to reduce the number of them. According to the analyses presented in this paper and based on the available information, we can affirm that service delivery performance indicators are not useful since they can push farmers to over irrigate. Until farmers have more accurate information about IRn based on their meteorological stations, and crop coefficients for new varieties are obtained, it is better to avoid the use of those indicators. Once they count with accurate information, it is preferred RIS than RWS since it is more sensible to extra irrigation.
With regards to the productive efficiency indicator, WUEOverall has offered better results than WUEQuality. This is because the WUEQuality only considers the optimal grade and the production of optimal grade has sharp fluctuations. It is greatly affected by the irrigation in specific periods of the year. Therefore, with the current data, WUEOverall is preferred. Nonetheless, if data about the irrigation amount per month and the growing degree days was available, WUEQuality could be useful to identify the farmer practices that increase the production of optimal grade and the optimal environmental parameters.
Finally, EE has proved its usefulness in identifying the adverse effects of extra irrigation in 5 out of 6 varieties. Consequently, this indicator must be implemented in future systems to control the economic efficiency of water in the farming systems.

6. Conclusions

To conclude, in this paper, we have analyzed the performance of three type of indicators, some of them with two versions, to evaluate the irrigation efficiency in individual orchards of citrus. Those indicators are tested with a database of orchards.
The main conclusions in terms of the indicators are that the indicators that consider the service delivery performance are not recommended due to the problems in obtaining accurate data from ETc and IRn. The WUEOverall, which evaluates the water efficiency in terms of productive efficiency, and EE for economic efficiency has been very useful for identifying differences in water efficiency between the analyzed orchards.
Concerning the evaluated orchards several issues have been discussed. The main ones are linked to the changes on varieties and the effects on water consumption of new varieties, about the negative impact of extra irrigation in the economic efficiency, and the increasing irrigation patterns. Apparently, all these changes, which lead to an increase of irrigation, are linked to the high price of new varieties of citrus and the efforts of farmers to increase the land productivity in kg/m2. Nonetheless, the increase in irrigation required to reach these productivities, has a devastating effect on the water efficiency indicators.
Finally, the WUEOverall has been predicted using ANN in Nadorcott and Naveline given a orchard size and the water available. The results are promising and can help farmers identify the most appropriate irrigation for their orchards.
As future work, we need to include more information in our database to adjust some of the outlier values detected and improve the accuracy of the ANN. Since this is an exploratory initial study, we plan perform an in-depth analysis of the differences on performance of farmers and identify the best practices. In addition, we are going to evaluate the proposed indicators using a method based on relative weights and priority ranking of indicators according to the expert opinions.

Author Contributions

Conceptualization, H.P.; methodology, B.R.-M.; field measures and sampling, H.P. and B.R.-M.; data curation, B.R.-M.; writing—original draft preparation, L.P. and M.B.-C.; writing—review and editing, J.L.; supervision, H.P.; validation, B.R.-M. and J.L., project administration, B.R.-M. and H.P. All authors have read and agreed to the published version of the manuscript.

Funding

This work was partially funded by the European Union through ERANETMED (Euromediterranean Cooperation through ERANET joint activities and beyond) project ERANETMED3-227 SMARTWATIR and by Conselleria de Educación, Cultura y Deporte through “Subvenciones para la contratación de personal investigador en fase postdoctoral”, grant number APOSTD/2019/04.

Acknowledgments

The authors thank Aitor Cardona-Mateu in Agrifood and Environmental Economy at the Universitat Politècnica de València, for his helpful collaboration in the data collection. This paper shows a preliminary application of the methodology and definition of indicators for further use in the “Project 2019ES06RDEI7346 Improving the use of water and energy in modernized irrigation of fruit trees (GO InnoWater)”, founded by the Spanish Rural Development Program (2014–2020): EAFRD and MAPA. Finally, we would like to express our deep gratitude to the anonymous reviewers for their efforts and their valuable comments.

Conflicts of Interest

The authors declare no conflict of interest.

References

  1. Spiegal, S.; Bestelmeyer, B.T.; Archer, D.W.; Augustine, D.J.; Boughton, E.H.; Boughton, R.K.; Hapeman, C.J. Evaluating strategies for sustainable intensification of US agriculture through the Long-Term Agroecosystem Research network. Environ. Res. Lett. 2018, 13, 34031. [Google Scholar] [CrossRef]
  2. Gold, M.V. Sustainable agriculture: The basics. Sustain. Agric. Food Supply Sci. Econ. Policy Enhanc. 2016, 1, 3–17. [Google Scholar]
  3. FAO. The Future of Food and Agriculture–Trends and Challenges; Annual Report; FAO: Rome, Italy, 2017. [Google Scholar]
  4. Cazcarro, I.; Duarte, R.; Martín-Retortillo, M.; Pinilla, V.; Serrano, A. How sustainable is the increase in the water footprint of the Spanish agricultural sector? A Provincial Analysis between 1955 and 2005–2010. Sustainability 2015, 7, 5094–5119. [Google Scholar] [CrossRef] [Green Version]
  5. Cazcarro, I.; Duarte, R.; Martín-Retortillo, M.; Pinilla, V.; Serrano, A. Water scarcity and agricultural growth in Spain: From curse to blessing. Nat. Resour. Econ. Growth Learn. Hist. 2015, 339–361. [Google Scholar] [CrossRef]
  6. Levidow, L.; Zaccaria, D.; Maia, R.; Vivas, E.; Todorovic, M.; Scardigno, A. Improving water-efficient irrigation: Prospects and difficulties of innovative practices. Agric. Water Manag. 2014, 146, 84–94. [Google Scholar] [CrossRef] [Green Version]
  7. Van Grinsven, H.J.; van Eerdt, M.M.; Westhoek, H.; Kruitwagen, S. Benchmarking eco-efficiency and footprints of Dutch agriculture in European context and implications for policies for climate and environment. Front. Sustain. Food Syst. 2019, 3, 13. [Google Scholar] [CrossRef] [Green Version]
  8. Weststrate, J.; Dijkstra, G.; Eshuis, J.; Gianoli, A.; Rusca, M. The sustainable development goal on water and sanitation: Learning from the millennium development goals. Soc. Indic. Res. 2019, 143, 795–810. [Google Scholar] [CrossRef] [Green Version]
  9. Azad, M.A.; Ancev, T. Measuring environmental efficiency of agricultural water use: A Luenberger environmental indicator. J. Environ. Manag. 2014, 145, 314–320. [Google Scholar] [CrossRef]
  10. Nam, W.H.; Hong, E.M.; Choi, J.Y. Assessment of water delivery efficiency in irrigation canals using performance indicators. Irrig. Sci. 2016, 34, 129–143. [Google Scholar] [CrossRef]
  11. Sabiha, N.E.; Salim, R.; Rahman, S.; Rola-Rubzen, M.F. Measuring environmental sustainability in agriculture: A composite environmental impact index approach. J. Environ. Manag. 2016, 166, 84–93. [Google Scholar] [CrossRef] [Green Version]
  12. Van Pham, L.; Smith, C. Drivers of agricultural sustainability in developing countries: A review. Environ. Syst. Decis. 2014, 34, 326–341. [Google Scholar] [CrossRef]
  13. Malano, H.; Burton, M. Guidelines for Benchmarking Performance in the Irrigation and Drainage Sector; International Programme for Technology and Research in Irrigation and Drainage; FAO: Rome, Italy, 2001; p. 43. [Google Scholar]
  14. Knox, J.W.; Daccache, A.; Hess, T.M.; Else, M.; Kay, M.; Burton, M.; Malano, H. Benchmarking agricultural water use and productivity in key commodity crops. In WU0122–Final Report for Defra; Cranfield University: Bedford, UK, 2013; p. 66. [Google Scholar]
  15. Santiago-Brown, I.; Metcalfe, A.; Jerram, C.; Collins, C. Sustainability assessment in wine-grape growing in the new world: Economic, environmental, and social indicators for agricultural businesses. Sustainability 2015, 7, 8178–8204. [Google Scholar] [CrossRef] [Green Version]
  16. Todorovic, M.; Mehmeti, A.; Scardigno, A. Eco-efficiency of agricultural water systems: Methodological approach and assessment at meso-level scale. J. Environ. Manag. 2016, 165, 62–71. [Google Scholar] [CrossRef] [PubMed]
  17. Saladini, F.; Betti, G.; Ferragina, E.; Bouraoui, F.; Cupertino, S.; Canitano, G.; Bidoglio, G. Linking the water-energy-food nexus and sustainable development indicators for the Mediterranean region. Ecol. Indic. 2018, 91, 689–697. [Google Scholar] [CrossRef]
  18. CROPWAT 8.0 Bèta Software. Available online: https://cropwat.informer.com/ (accessed on 9 August 2020).
  19. Land and Water Development Division of FAO, Recommendations for CROPWAT Use. Available online: http://www.fao.org/land-water/databases-and-software/cropwat/en/ (accessed on 9 August 2020).
  20. SIAR Database for CLimati Data. Available online: www.siar.es (accessed on 9 August 2020).
  21. Todorovic, M.; Karic, B.; Pereira, L.S. Reference evapotranspiration estimate with limited weather data across a range of Mediterranean climates. J. Hydrol. 2013, 481, 166–176. [Google Scholar] [CrossRef] [Green Version]
  22. Awal, R.; Habibi, H.; Fares, A.; Deb, S. Estimating reference crop evapotranspiration under limited climate data in West Texas. J. Hydrol. Reg. Stud. 2020, 28, 100677. [Google Scholar] [CrossRef]
  23. Tomas-Burguera, M.; Vicente-Serrano, S.M.; Grimalt, M.; Beguería, S. Accuracy of reference evapotranspiration (ETo) estimates under data scarcity scenarios in the Iberian Peninsula. Agric. Water Manag. 2017, 182, 103–116. [Google Scholar] [CrossRef] [Green Version]
  24. Stagraphics Centurion XVI software. Available online: https://www.statgraphics.com (accessed on 8 August 2020).
  25. Dahikar, S.S.; Rode, S.V. Agricultural crop yield prediction using artificial neural network approach. Int. J. Innov. Res. Electr. Electron. Instrum. Control Eng. 2014, 2, 683–686. [Google Scholar]
  26. Umair, S.M.; Usman, R. Automation of irrigation system using ANN based controller. Int. J. Electr. Comput. Sci. IJECS-IJENS 2010, 10, 41–47. [Google Scholar]
  27. Karasekreter, N.; Başçiftçi, F.; Fidan, U. A new suggestion for an irrigation schedule with an artificial neural network. J. Exp. Theor. Artif. Intell. 2013, 25, 93–104. [Google Scholar] [CrossRef]
  28. Kelley, J.; Pardyjak, E.R. Using neural networks to estimate site-specific crop evapotranspiration with low-cost sensors. Agronomy 2019, 9, 108. [Google Scholar] [CrossRef] [Green Version]
  29. Mesejo, C.; Martínez-Fuentes, A.; Reig, C.; Balasch, S.; Primo-Millo, E.; Agustí, M. Mechanical pruning attenuates alternate bearing in ‘Nadorcott’mandarin. Sci. Hortic. 2020, 261, 108993. [Google Scholar] [CrossRef]
  30. Parra, M.; Parra, L.; Rocher, J.; Lloret, J.; Mauri, P.V.; Llinares, J.V. A Novel Low-Cost Conductivity Based Soil Moisture Sensor. In Proceedings of the International Conference on Advanced Intelligent Systems for Sustainable Development 2019, Marrakech, Morocco, 8–11 July 2019; Springer: Cham, Switzerland, 2019; pp. 27–35. [Google Scholar]
  31. Marín, J.; Yousfi, S.; Mauri, P.V.; Parra, L.; Lloret, J.; Masaguer, A. RGB Vegetation Indices, NDVI, and Biomass as Indicators to Evaluate C3 and C4 Turfgrass under Different Water Conditions. Sustainability 2020, 12, 2160. [Google Scholar] [CrossRef] [Green Version]
  32. Cammalleri, C.; Anderson, M.C.; Gao, F.; Hain, C.R.; Kustas, W.P. Mapping daily evapotranspiration at field scales over rainfed and irrigated agricultural areas using remote sensing data fusion. Agric. For. Meteorol. 2014, 186, 1–11. [Google Scholar] [CrossRef] [Green Version]
  33. Chai, Q.; Gan, Y.; Zhao, C.; Xu, H.L.; Waskom, R.M.; Niu, Y.; Siddique, K.H. Regulated deficit irrigation for crop production under drought stress. A review. Agron. Sustain. Dev. 2016, 36, 3. [Google Scholar] [CrossRef] [Green Version]
  34. Yu, L.; Zhao, X.; Gao, X.; Siddique, K.H. Improving/maintaining water-use efficiency and yield of wheat by deficit irrigation: A global meta-analysis. Agric. Water Manag. 2020, 228, 105906. [Google Scholar] [CrossRef]
  35. Al-Rousan, W.M.; Ajo, R.Y.; Angor, M.M.; Osaili, T.; Bani-Hani, N.M. Impact of different irrigation levels and harvesting periods on the quantity and quality of Navel oranges (Citrus sinensis) and fruit juice. J. Food Agric. Environ. 2012, 10, 115–119. [Google Scholar]
  36. García, L.; Parra, L.; Jimenez, J.M.; Lloret, J.; Lorenz, P. IoT-Based Smart Irrigation Systems: An Overview on the Recent Trends on Sensors and IoT Systems for Irrigation in Precision Agriculture. Sensors 2020, 20, 1042. [Google Scholar] [CrossRef] [Green Version]
Figure 1. Evolution of the number of orchards included in the database.
Agronomy 10 01359 g001
Figure 2. Evolution of the number of P and NP farmer included in the database.
Agronomy 10 01359 g002
Figure 3. Changes on ETc, Pe and IRn along the studied period in the area.
Agronomy 10 01359 g003
Figure 4. Distribution of selected varieties along the studied period. Percentages express the number of orchards in each year of this study. Data correspond to the following periods (a) 2013, (b) 2014, (c) 2015, (d) 2016, and (e) 2017.
Agronomy 10 01359 g004
Figure 5. Box plots for productivity and irrigation for the analyzed factors.
Agronomy 10 01359 g005
Figure 6. Mean values for the multifactorial ANOVA of evaluated factors for indicator 1. In Extra Irrigation 0: No and 1: Yes. In type of farmer 0: NP Farmer and 1: P farmer.
Agronomy 10 01359 g006
Figure 7. Mean values for the Multifactorial ANOVA of evaluated factors indicator 2. In Extra Irrigation 0: No and 1: Yes.
Agronomy 10 01359 g007
Figure 8. Mean values for the multifactorial ANOVA of evaluated factors indicator 3. In Extra Irrigation 0: No and 1: Yes.
Agronomy 10 01359 g008
Figure 9. The combined effect of different factors on three indicators. In Extra irrigation 0: No and 1: Yes. In Type of farmer 0: P Farmer and 1: NP farmer.
Agronomy 10 01359 g009
Figure 10. Proposed ANN.
Agronomy 10 01359 g010
Figure 11. Results of ANN for WUEOverall for the following varieties: (a) all the varieties, (b) Nadorcott, and (c) Naveline.
Agronomy 10 01359 g011
Figure 12. Distribution of cropped varieties (in %) between NP and P farmers.
Agronomy 10 01359 g012
Table 1. Included variables.
VariableUnits/CategoriesSource
Type of farmerP/NPCooperative of farmers
Type of speciesTangerines/OrangesCooperative of farmers
Type of varietyClemensoon (1)
Nadorcott (6)
Oronules (9)
Lane Late (102)
Navel Powell (103)
Navelina (104)
Cooperative of farmers
Type of tree statusYoung/Graphted/AdultCooperative of farmers
Type of size of the orchardSmall/Medum/LargeCooperative of farmers
Size of orchard(m2)Cooperative of farmers
Total production(kg)Cooperative of farmers
Production: big grade(kg)Cooperative of farmers
Production: optimal grade(kg)Cooperative of farmers
Production: small grade(kg)Cooperative of farmers
Production: low grade(kg)Cooperative of farmers
Mean price(€/kg)Cooperative of farmers
Income(€)Cooperative of farmers
Total production(kg/m2)Cooperative of farmers
Irrigation(m3/year)Irrigation community
Expenditure in regular irrigation(€/m3 by year)Irrigation community
Expenditure on extra irrigation(€/m3 by year)Irrigation community
Expenditure in total irrigation(€/m3 by year)Irrigation community
Irrigation(l/m2 and year)Irrigation community
Type of extra irrigationYes/NoIrrigation community
Effective Precipitation (Pe)(mm/year)Obtained from SIAR
Net Irrigation Requirement (IRn)(mm/year)Obtained from SIAR
Evapotranspiration of the crop (ETc)(mm/year)Obtained from SIAR
Table 2. Summary of production in kg/m2 of the orchards with the selected varieties.
Year20132014201520162017
Mean2.591.952.531.872.27
Standard deviation1.531.131.481.031.32
Minimum0.350.240.180.240.44
Maximum6.765.406.084.595.72
Range6.415.165.904.355.28
Table 3. Summary of consumed water for irrigation (L/m2) of the orchards with the selected varieties.
Year20132014201520162017
Mean197.50228.13259.10282.99284.77
Standard deviation120.24110.58142.69456.76148.72
Minimum2952494965
Maximum5715527251041658
Range542500676992593
Table 4. Summary of variance in the productivity and applied irrigation of the studied orchards.
ProductivityApplied Irrigation
Factorp-ValueNumber of Groups 1p-ValueNumber of Groups 1
Year0.00182 (2013 b, 2014 a, 2015 b, 2016 a, and 2017 ab)0.00283 (2013 a, 2014 ab, 2015 bc, 2016 c, and 2017 c)
Variety0.00002 (103 a, 9 a,1 a, 104 b, 102 b, 6 b)0.00004 (102 ab, 103 ab,104 a, 1 bc, 9 cd, and 6 d)
Orchard size0.7981-0.00242 (0 b, 1 a, and 2 b)
Type of farmer0.00002 (NP a and P b)0.00002 (NP a and P b)
1 Means followed by a different letter are significantly different at an alpha level of 0.05 according to an LSD test.
Table 5. Summary of consumed water for irrigation (L/m2) of the orchards with the selected varieties.
IndicatorYear20132014201520162017
RWS
(n u)
Mean0.280.310.420.400.39
Standard deviation0.180.150.230.230.20
Minimum00.10.10.10.1
Maximum0.80.71.21.50.9
Range0.80.61.11.40.8
RIS
(n u)
Mean0.380.400.620.550.48
Standard deviation0.230.200.350.310.25
Minimum0.10.10.10.10.1
Maximum1.111.821.1
Range10.91.71.90.1
WUEOverall
(kg/m3)
Mean191011810
Standard deviation1881067
Minimum0.20.20.10.60.4
Maximum9040503535
Range9040503535
WUEQuality
(kg/m3)
Mean153824
Standard deviation135946
Minimum00000
Maximum7020502030
Range7020502030
EE
(n u)
Mean18514910
Standard deviation20715148
Minimum00000
Maximum9020808030
Range9020808030
Table 6. Summary of p-values of variance analyses in the productivity of the studied area.
FactorRWSRISWUEOverallWUEQualityEE
Year0.00000.00000.00000.00000.0000
Variety0.00020.00010.00370.07470.0000
Orchard size0.01640.82110.17830.26450.8484
Extra irrigation0.00000.04420.01070.02210.0000
Type of farmer0.00040.08800.25140.25690.5906
Table 7. Summary of ANN outputs for WUEOverall.
Parameters of ANNVariety
OverallNadorcottNavelina
Number of neurons in hidden layer I28854159
Number of neurons in hidden layer II 101010
Jack-knifing value (optimized during training)0.30.490.5
% of correct classification39.2437.1849.62

