Article

Early Response of Soil Microbial Biomass and Activity to Biofertilizer Application in Degraded Brunic Arenosol and Abruptic Luvisol of Contrasting Textures

by
Anna Walkiewicz
1,*,
Małgorzata Brzezińska
1,
Andrzej Bieganowski
1,
Lidia Sas-Paszt
2 and
Magdalena Frąc
1
1
Institute of Agrophysics, Polish Academy of Sciences, Doświadczalna 4, 20-290 Lublin, Poland
2
Institute of Horticulture in Skierniewice, 96-100 Skierniewice, Poland
*
Author to whom correspondence should be addressed.
Agronomy 2020, 10(9), 1347; https://doi.org/10.3390/agronomy10091347
Submission received: 3 August 2020 / Revised: 1 September 2020 / Accepted: 4 September 2020 / Published: 7 September 2020

Abstract

:
We tested agriculturally and chemically degraded Brunic Arenosol and Abruptic Luvisol of contrasting textures to establish the early response of soil quality to two different mineral fertilizers (Polifoska and urea) amended with microbes applied in optimal and reduced doses. The soil samples were collected from two fields under maize: one week (Ist sampling time) and six months (IInd sampling time) after fertilization. The laboratory experiment included determination of: catalase activity, dehydrogenase activity, microbial biomass, and basal respiration; pH and dissolved organic carbon (DOC) were also measured. The silty Luvisol was characterized by higher biological activity than the sandy Arenosol. Biofertilizer addition to degraded soils increased the biological activity, even in reduced doses of additives used; however the responses of the tested microbiological indicators were different. Soil texture affected the positive biomass response to biofertilizers which was observed in samples from Ist sampling time in silty soil, while from IInd sampling time in sandy soil. Based on our results, we propose that Polifoska with microorganisms (used in full dose) may be optimal for silty soil. Polifoska (in reduced dose) and urea (both in full and reduced dose) may be recommended for sandy soils. Increasing pH was a stronger driver of soil biological activity than DOC. Long-term field testing is suggested for validating our results.

1. Introduction

The declining state of the environment makes it necessary to use non-traditional fertilization methods to reduce soil pollution and have a positive impact on biological functionality. Special attention should be placed on degraded soils. In the southern and central southeastern areas of Europe ~25% of the total area are lands with high and very high sensitivity to degradation [1].
Biofertilizers are described as fertilizers that contain living soil microorganisms (useful bacteria and fungi) applied to increase the availability of mineral nutrients for plants [2,3,4]. Unlike conventional chemical fertilizers, they are more ecofriendly [3,5]. Their application can improve soil health and increase crop growth through different mechanisms connected with microbial activity, for example, biological N fixation, phosphorous solubilizing, and phosphate mobilizing [3,6]. The positive effect of biofertilizers has been observed on different crops: maize [7,8], wheat [8,9], potatoes [10], rice [11,12], Panax ginseng [13], and apples [14]. It has also been confirmed that biofertilizers have the potential for biological reclamation of degraded lands, including after mining activity [15,16]. Biofertilizers may not only improve soil microbial balance and crop productivity, but may also be helpful in producing vigorous plants that can survive and thrive in stressed soils. It has been shown by study on pomegranate (Punica granatum L.) as bioinoculants helped in better establishment under the harsh field conditions of the Indian Thar Desert [17].
One of the biological indicators of soil health is microbial biomass and their enzymatic activity. Soil dehydrogenases (EC 1.1.1.) exist as an essential part of soil microbial life [18] and are strongly linked with microbial oxidoreduction processes [19,20]. Dehydrogenase activity is used as an indicator of overall soil microbial activity [21,22], since these enzymes do not accumulate extracellularly [23] but they are only active intracellularly [20,24]. Catalase (H2O2:H2O2—oxidoreductase, EC 1.11.1.6.) is very stable in soil and is considered an indicator of aerobic microbial activity. Catalase uses a two-electron transfer mechanism to split hydrogen peroxide (toxic H2O2 formed in the course of aerobic respiratory metabolism) into molecular oxygen (O2) and water and, therefore, protects living cells from the damage caused by this reactive oxygen species [25]. Catalase activity has been shown to correlate with the number of aerobic soil microorganisms, microbial biomass, respiration, the activity of other enzymes, organic carbon content, aeration status, and soil fertility [26,27].
Microbial communities in soil ecosystems are key for soil functionality due to their role in organic matter transformation and nutrient cycling [28]. Therefore, soil microbial biomass (Cmic), taken as a whole reflects the metabolic activities of all species within a community, is an important ecological parameter. It consists mainly of fungi and bacteria, with several thousand species present in 1 g of soil [29,30]. Soil respiration, as an important process in the C cycle, is one of the oldest and most frequently used parameters for quantifying the total activity of soil microflora and mineralization of soil organic matter (SOM) [31,32]. Based on the amount of CO2 released by soil without organic substrate supplements, the basal respiration rate (BR) is measured, that allows the overall rate of the entire metabolic processes in the tested soil to be determined [33]. The metabolic quotient (qCO2), called the specific respiratory rate, is an eco-physiological quotient calculated as the basal respiration rate per unit microbial biomass [34]. The qCO2 is regarded as an indicator of changes in the metabolism of soil microbiota in response to several soil disturbances. Therefore, qCO2 can provide an understanding of the biological and chemical changes occurring in soil including under different agricultural practices [34]. The qCO2 also indicates how efficiently the microbial biomass is utilizing soil carbon for biosynthesis and thus is considered a sensitive indicator of soil biological activity and soil substrate quality [34,35].
Araújo et al. [36] observed an increase in soil microbial biomass, respiration, and dehydrogenase activity in Fluvisol soil after application of three biofertilizers as compared to the control soil (not treated, as well as fertilized with NPK). In contrast, Schenck zu Schweinsberg-Mickan and Müller [37] reported suppressive effects of biofertilizers on soil microbial biomass and reduced CO2 evolution as compared to soil treated with water. In a field experiment performed on sandy clay loam soil, Singh et al. [38] tested the effect of organic amendments such as farmyard manure and vermicompost (with and without crop residues and biofertilizers) on several soil microbial characteristics. The highest microbial biomass occurred in the treatment receiving vermicompost, crop residues, and biofertilizers. In turn, qCO2 was highest in plots treated with farmyard manure combined with crop residues and biofertilizers, reflecting an increase in the ratio of active to dormant microorganisms [38]. Piotrowska et al. [39] observed a significant increase in soil microbial biomass, but no clear effect in the case of dehydrogenase activity and a reduction of cellulase activity in arable soil (Luvisol) treated with commercial biofertilizer (UGmax).
We hypothesized that application of mineral fertilizers amended with microorganisms (biofertilizers) regenerates microbiological activity in agriculturally and chemically degraded soils to an extent that depends on applied dosage. We also hypothesized that soil texture also impacts the outcome due to the creation of different conditions for living soil microbiota.
The objective of this laboratory-based study was to test the short-term responses of biological soil health indicators (microbial biomass and their enzymatic activities) of two soil types (Brunic Arenosol and Abruptic Luvisol) under maize cultivation to two different mineral fertilizers amended with microbial biofertilizers (bacteria or fungi) applied in two dosages (optimal and reduced) at two points (one week and six months after application).

2. Materials and Methods

2.1. Field Study Site and Soil Description

The research was carried out on degraded soils taken from two sites in south-eastern Poland, namely,: from Biszcza (50°39′ N; 22°65′ E)—Brunic Arenosol and ii) from Basznia (50°15′ N; 23°26′ E)—Abruptic Luvisol. The Arenosol was degraded due to inappropriate cultivation and fertilization, which had resulted in soil acidification and low nutrient content. Chemical degradation of the Luvisol (characterized by acidification) was the effect of the past activity of a nearby former sulfur mine. The maize was sown in May 2018 at both sites.
The experimental plots (in three repetitions) were prepared in both sites with the following dimensions 15 m × 10 m with a 2-m interval between variants. This experiment comprised of seven treatments, namely, controls without fertilization (C), urea (PULREA PUŁAWSKI MOCZNIK 46N, Grupa Azoty, Puławy, Poland) and Polifoska (POLIFOSKA KRZEM—NPK(S) 6-12-34-(10), Grupa Azoty, Puławy, Poland) fertilizers not supplemented by microbial consortia (UC/PC), and combinations of microbial consortia mixed with fertilizers: urea in optimal dose (UA 100) and dose reduced by 40% (UA 60), or Polifoska in optimal dose (PA 100) and dose reduced by 40% (PA 60) Polifoska. Compositions of the microbial inocula were determined by the Institute of Horticulture in Skierniewice (Poland) to develop formulations of microorganisms suitable for being combined with particular mineral fertilizers—urea and Polifoska. The microbial consortium for the urea fertilizer contained the following beneficial fungal strains: Paecilomyces lilacinus WT15A and Aspergillus niger G119AA, mixed before application in the proportion of 15:1, respectively. Fungal strains were applied 7 days after urea fertilization. The bacterial strains for the Polifoska fertilizer included the Paenibacillus polymyxa strain CHT114AB, Bacillus amyloliquefaciens strain AF75BB, and Bacillus sp. strain CZP4/4. The Polifoska fertilizer granules were coated with a mixture of bacterial strains in equal proportions [40]. The bacterial and fungal strains were selected by the Institute of Horticulture (Skierniewice, Poland) from its SYMBIOBANK Collection. Mineral fertilizers were produced and provided by GRUPA AZOTY Zakłady Azotowe Puławy S.A. (Puławy, Poland). The biofertilizers were prepared and provided by the Łukasiewicz Research Network—New Chemical Syntheses Institute (Puławy, Poland), while microbial strains were prepared and delivered by the Institute of Horticulture (Skierniewice, Poland). The doses on (bio)fertilizers were calculated, based on the soil nutrient requirements for maize growth, by the Institute of Soil Science and Plant Cultivation (Puławy, Poland). In the field test, the fertilizers were applied on the soil surface on the following dates in 2018: in April (pre-sowing bio- and fertilizer application in the doses of 420 and 500 kg Polifoska per ha in Biszcza and Basznia, respectively), during maize vegetation: in May (in the doses of 200 and 185 kg urea per ha in Biszcza and Basznia, respectively), and in June (in the dose of 110 kg urea per ha in both Biszcza and Basznia sites). Soil samples (0–25 cm) were collected at five randomly selected sites in each subplot, and thoroughly homogenized. After drying, the collected soils were sieved through a 2 mm mesh and stored in the dark. Basic soil parameters are presented in Table 1.
Particle size distribution was determined by laser diffractometer Mastersizer 2000 with Hydro G dispersion unit (Malvern Ltd, Malvern, UK). The sets for measurements were as follows: two light sources, laser (633 nm) and diode (466 nm); stirrer speed 700 rpm and pump speed 1750 rpm [41]. Disintegration of soil aggregates was carried out by an ultrasound probe (35 W for 3 min). For calculation, Mie theory with refractive index 1.52 and absorption coefficient 0.1 was used [42]. The following methods were used to determine the plant nutrient content: spectrophotometric for phosphorus (P2O5), flame atomic emission spectrometry (FAES) for potassium (K2O), and flame atomic absorption spectroscopy (FAAS) for magnesium (Mg). In order to determine mineral N content (NH4+; NO3) the continuous-flow analysis (CFA) method with spectrophotometric detection was used.

2.2. Laboratory Experiment Design

The soil samples were collected for laboratory testing from all plots on two dates. The Ist sampling time (in June 2018) was one week after the application of the first dose of bio- and fertilizers—to recognize the rapid response of enzymatic activity and microbial biomass. The IInd sampling time (in October 2018) was about six months after addition of the bio- and fertilizers (after maize harvesting, and before plowing) to recognize the short-term response of enzymatic activity and microbial biomass.
The laboratory experiment included determination of soil quality indicators: catalase activity (CAT), dehydrogenase activity (DHA), microbial biomass (Cmic), and basal respiration (BR); pH and dissolved organic carbon (DOC) were also measured. In total, 252 samples were tested for each sampling time.
To avoid the influence of soil aeration/water content at the moment of sampling (which was dependent on field weather conditions), the collected samples were dried. To establish the same conditions in all tested samples and stimulate microorganism activity directly before the experiment, the tested material was preincubated, in other words, 5 g of air dry soils was placed in 60 cm3 glass vessels, moistened to 70% WHC (water holding capacity; 1 cm3 and 1.44 cm3 per 5 g soil for Brunic Arenosol and Abruptic Luvisol, respectively) and incubated in the dark at 25 °C for 3 days to allow initial sampling and sieving effects to subside [43].

2.3. Methods

Catalase activity (CAT) was determined according to the method proposed by Trevors [44] to measure evolved O2 by gas chromatography after 10 min of static incubation of soil samples at 30 °C with 3% H2O2, with sterile soil samples as controls (autoclaved at 126 °C and 140 kPa for 22 min; Prestige Classic 210001). Next, the gas sample was injected (200 µL) into a gas chromatograph (Shimadzu GC-14A) equipped with a Molecular Sieve 5A to determine the O2 concentration. The temperature of the detector and the column was 40 °C and helium (40 cm3/min) was used as a carrier gas [45]. The pressure in the vessel was measured before each injection with an Infield 7 meter (UMS GmbH, München, Germany) and included in the O2 concentration calculation. The results were expressed as µmol O2 per gram of oven-dry soil per minute.
Soil dehydrogenases activity (DHA) was determined according to Casida et al. [46] with the use of the triphenyl tetrazolium chloride (TTC), and was based on the amount of triphenyl formazan (TPF) produced after a 20 h incubation of the soil samples at 30 °C. The obtained results were reduced by the activity of the blank control without TTC addition. Dehydrogenase activity (mg TPF/g/20 h) was determined spectrophotometrically and absorbance was taken at 485 nm.
Soil microbial biomass (Cmic) was determined with the substrate induced respiration (SIR) method, based on the initial respiratory response of the microbial population to the amendment of glucose, an easily available source of carbon and energy [47]. Preincubated soil samples were amended with a glucose solution (10 mg per gram of soil) and incubated with shaking at 25 °C in a water bath. After 2 h, the CO2 produced was measured chromatographically. Microbial biomass content was calculated using the formula [48]:
C mic   ( mg / g )   =   50.4   ×   cm 3   ( CO 2 / g / h )
Basal respiration (BR, µg CO2-C/g/h) was measured after a 2-h incubation at 25 °C of non-enriched soil samples. The metabolic quotient (qCO2) was calculated as the ratio of basal soil respiration rate to microbial biomass C. The qCO2 results were expressed as µg CO2–C/mg/Cmic h.
Concentrations of CO2 in the headspace was measured with a gas chromatograph Shimadzu GC-14A (Shimadzu Corp., Kyoto, Japan) equipped with a thermal conductivity detector (TCD) and with the use of a 2-m column (3.2 mm diameter) packed with Porapak Q (Shimadzu Corp., Kyoto, Japan), with He as the carrier gas flowing at a rate of 40 cm3/min. The temperature of the column and detector were 40 °C and 60 °C, respectively [18]. The detector response was calibrated using a certified gas standard (Air Products, Warsaw, Poland) containing 1% CO2 in He. The CO2 concentration was corrected for solubility in water by using published values of the Bunsen absorption coefficient [49].
Dissolved organic carbon (DOC) was determined by shaking 5 g of each dry soil in 50 cm3 of deionized water for 1 h. After shaking, the slurries were filtered through filter paper into glass vials. The samples were analyzed for DOC contents using a Shimadzu (Japan) TOC analyzer [50]. Water holding capacity (WHC) was determined according to Wang et al. [51]. All measurements were done in triplicate, and results were expressed on an oven-dry weight basis (105 °C, 24 h). The soil pH was determined potentiometrically in H2O (the ratio 1:2.5 w/w) at room temperature.

2.4. Statistical Analysis

The results were statistically processed with Statistica 13 software (StatSoft Inc., Tulsa, OK, USA). A one-way ANOVA (Tukey HSD post hoc test) was used to test the significance of the differences in the measured indicators between the controls and bio- and fertilized treatments (separately for each soil and for each sampling time). Principal component analysis (PCA) was carried out to determine the relationships between microbial indicators (CAT, DHA, BR, Cmic, qCO2) and soil parameters (pH, DOC) for two soils of different textures incubated with and without biofertilizer amendment.

3. Results and Discussion

3.1. Physical and Chemical Properties of Soils without Fertilization

Tested soils were degraded by different land use: inappropriate cultivation and fertilization (Brunic Arenosol) as well as chemical degradation (Abruptic Luvisol, sulfur mine surroundings). An important soil parameter differentiating the tested samples was also the texture (Table 1), which created various conditions for living soil microorganisms since soil particle size fractions also harbor distinct microbial communities [52].
Texture affects the creation of anoxic zones in soil, the distribution of micropores, and macropores and in consequence, determines the availability of water, nutrients, and O2 for microorganisms [53,54,55]. Sandy Brunic Arenosol can be better aerated and more permeable than silty Abruptic Luvisol, which opposingly can create anoxia or hypoxia. Finer textured soils have a greater ability to store soil nutrients due to the difference in specific surface properties [56,57], and therefore clay Abruptic Luvisol could create better conditions for microbiota than sandy soil. The tested soils were characterized by low Mg and K content, but Arenosol was distinguished by high P content (Table 1). The soils also differed in nitrogen content since NH4+ and Nmin was about 3.5 times higher in Abruptic Luvisol than in Brunic Arenosol which may be connected with the susceptibility of sandy soils to leaching [58] and a higher cation exchange capacity (CEC) as well as high water and nutrient retention capacity in clay-rich soils [54].

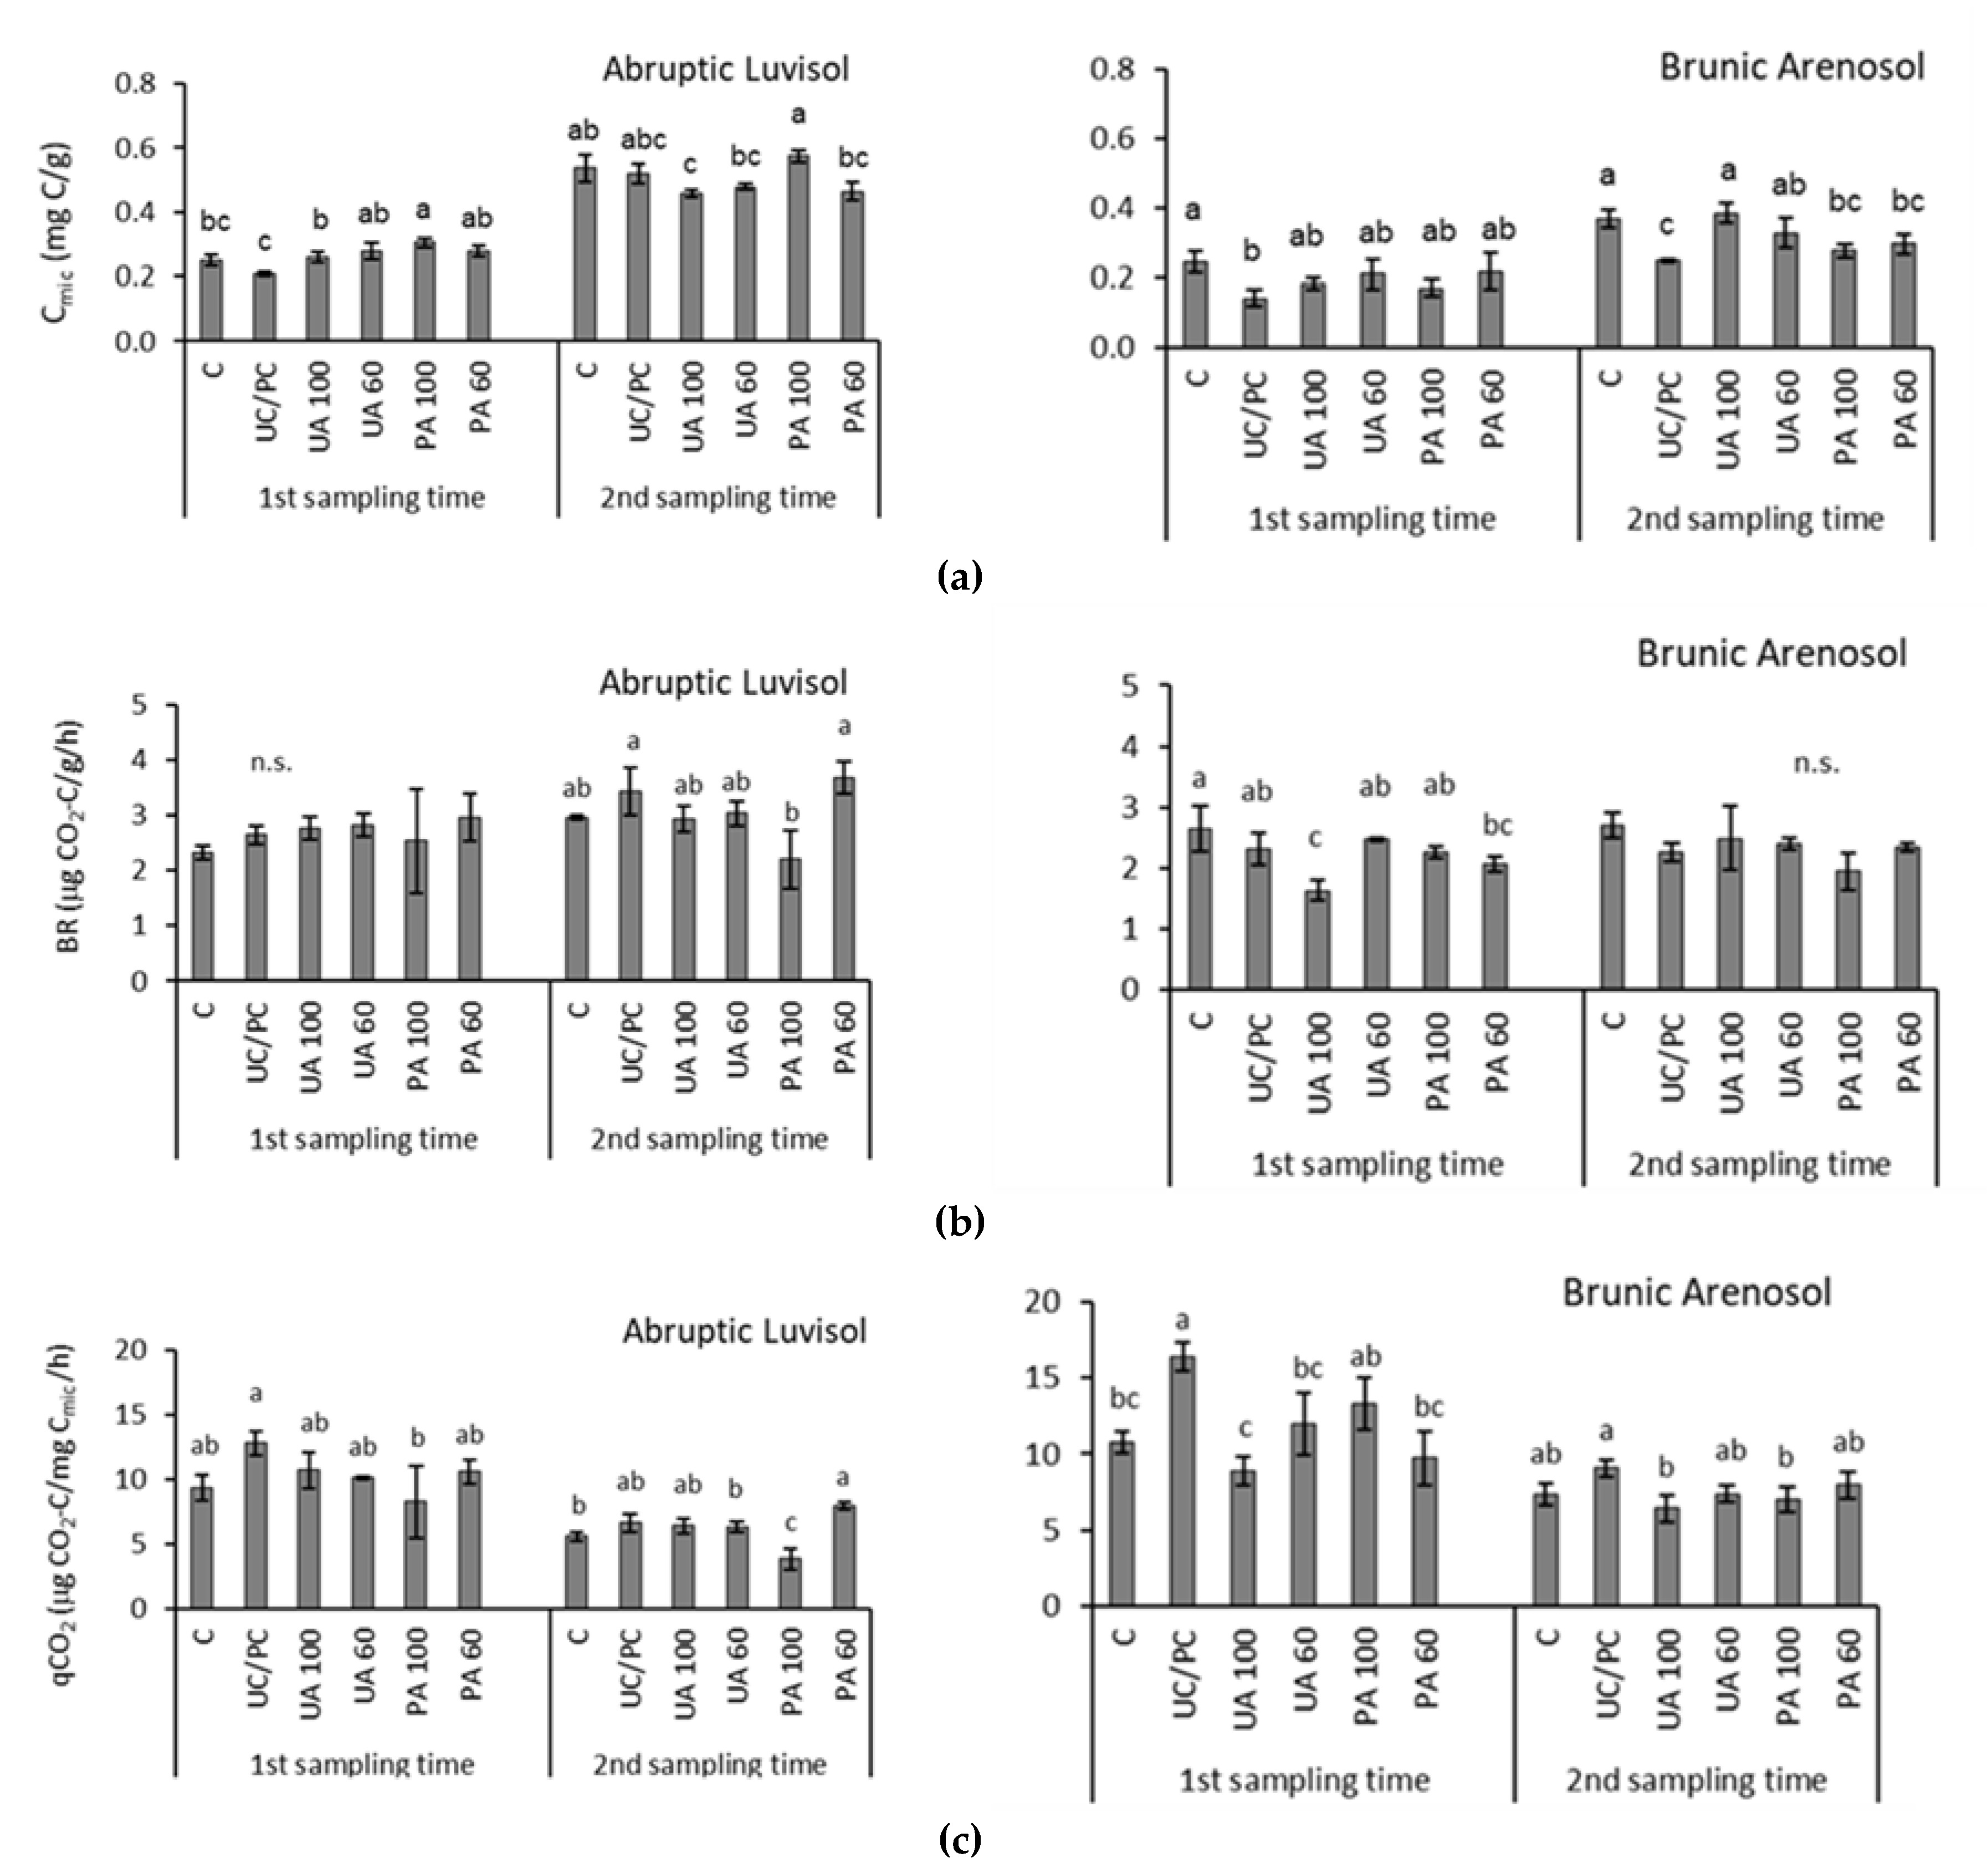
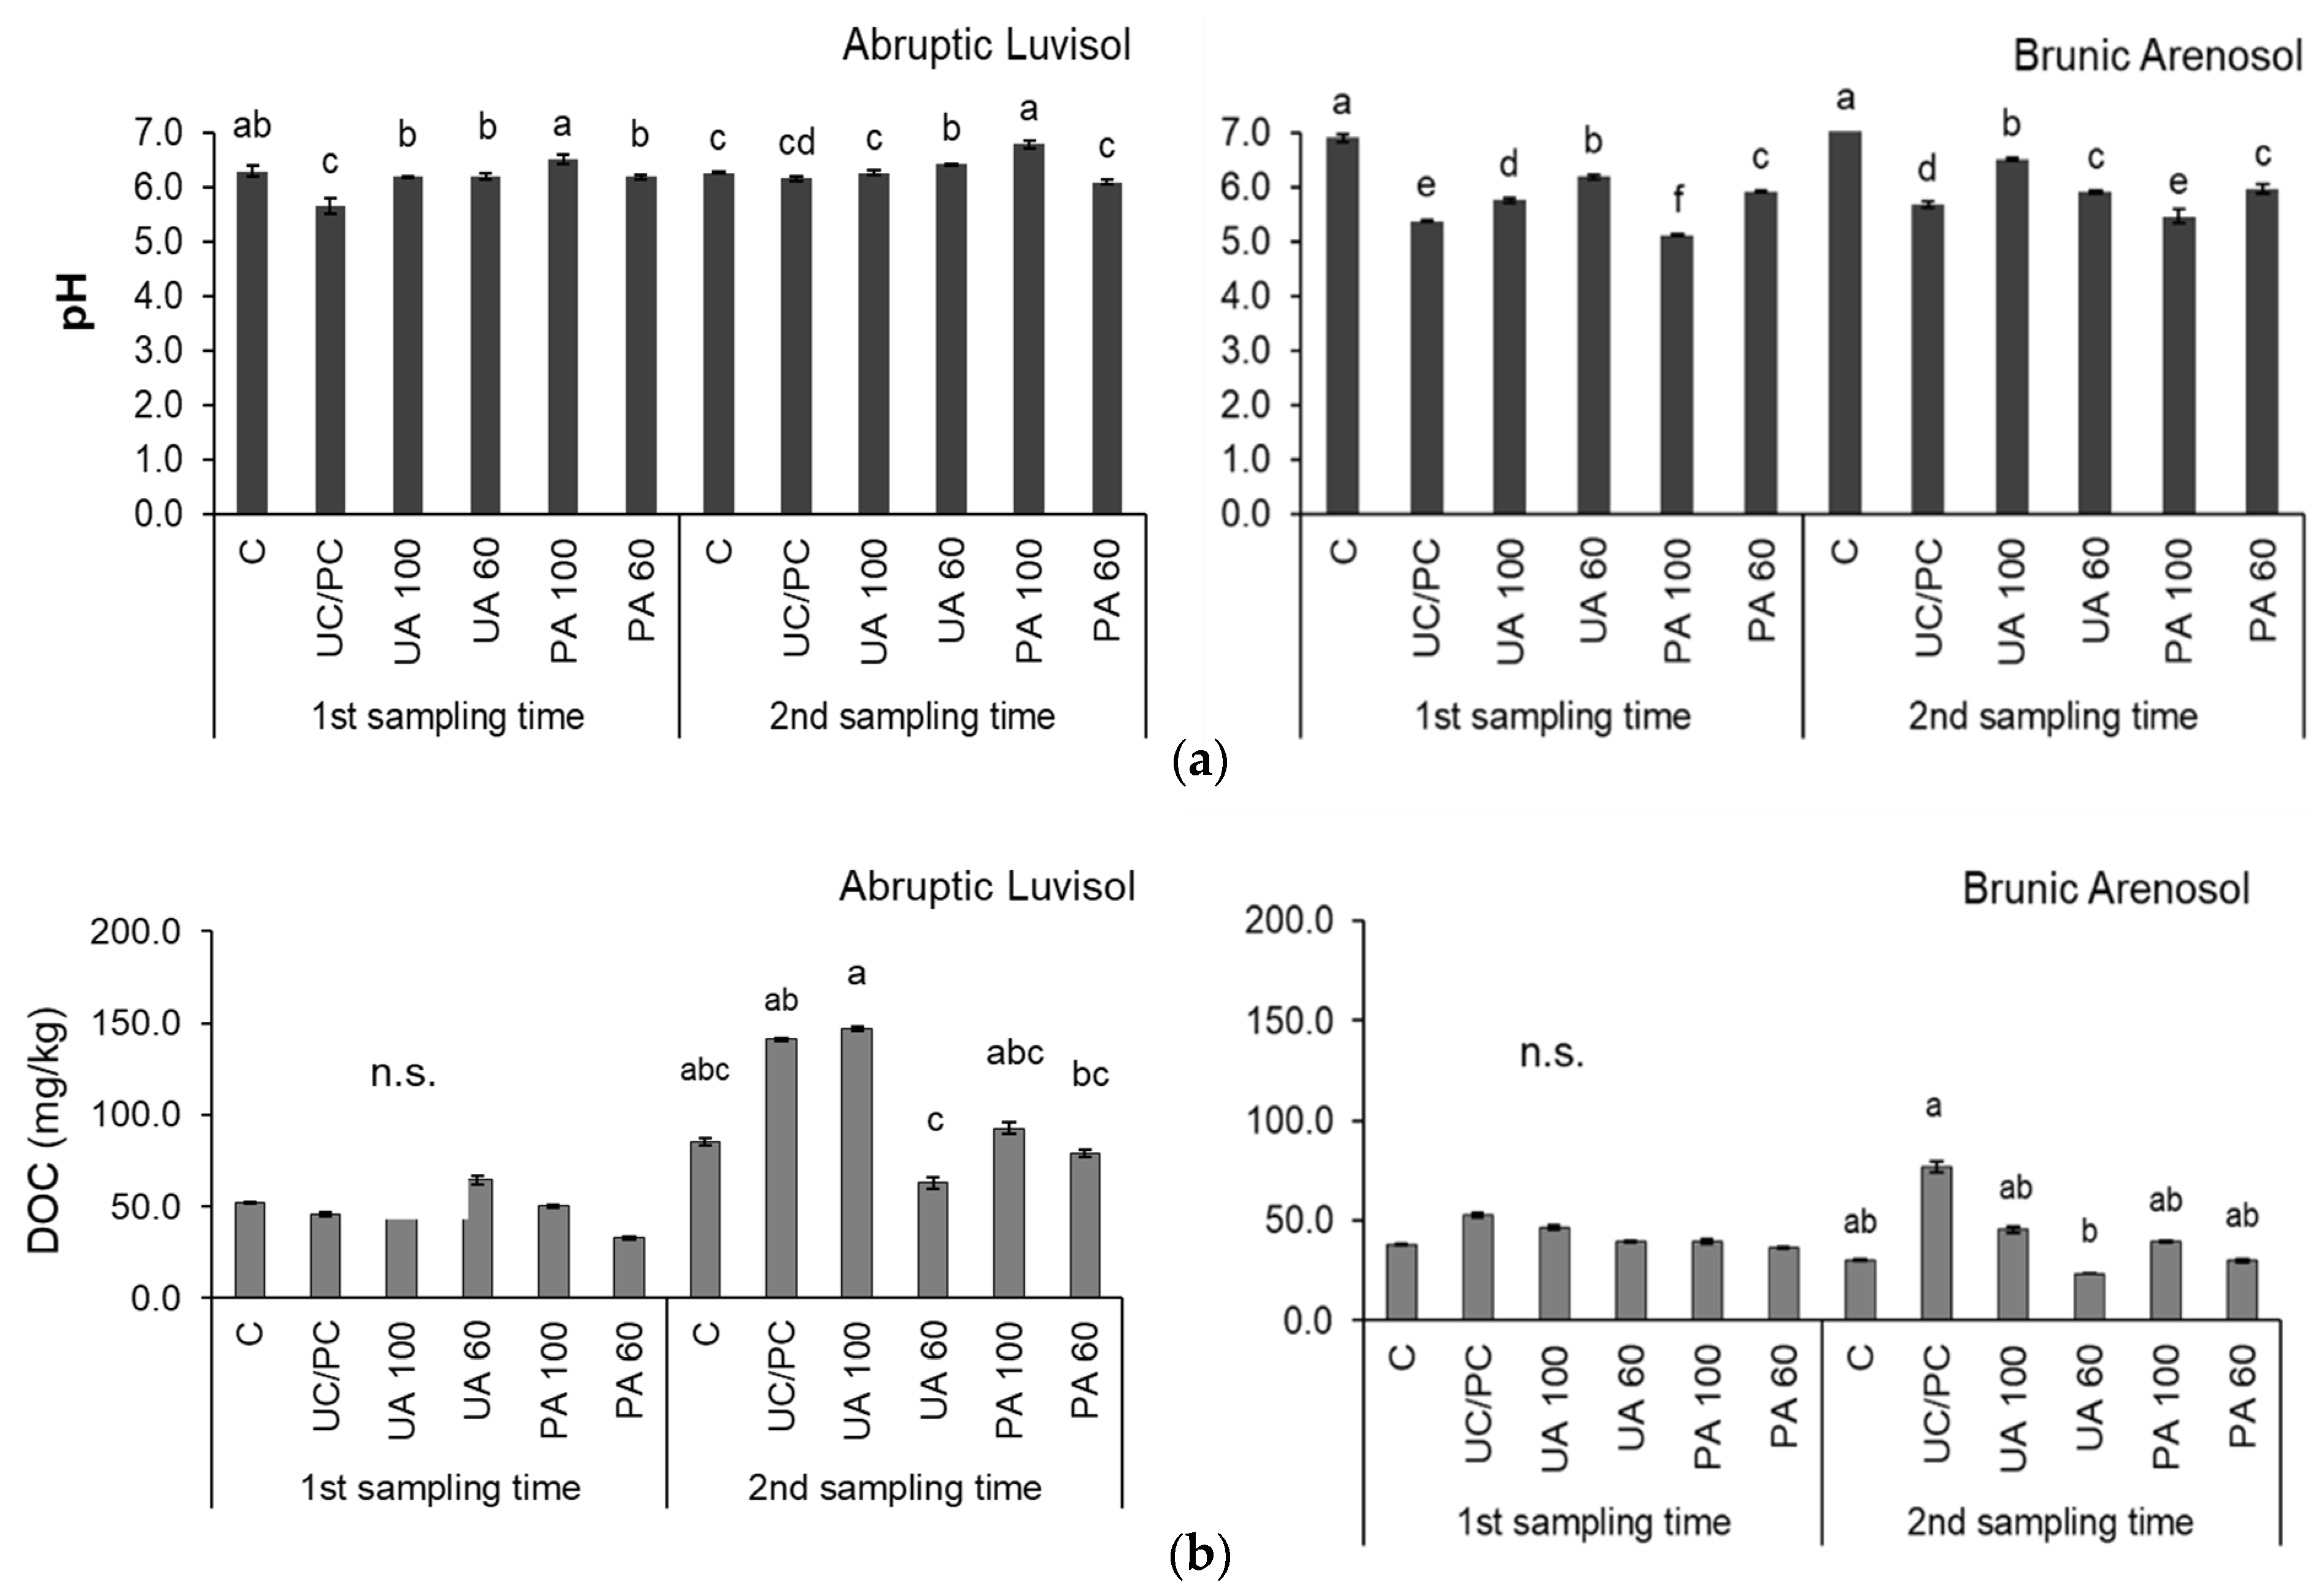
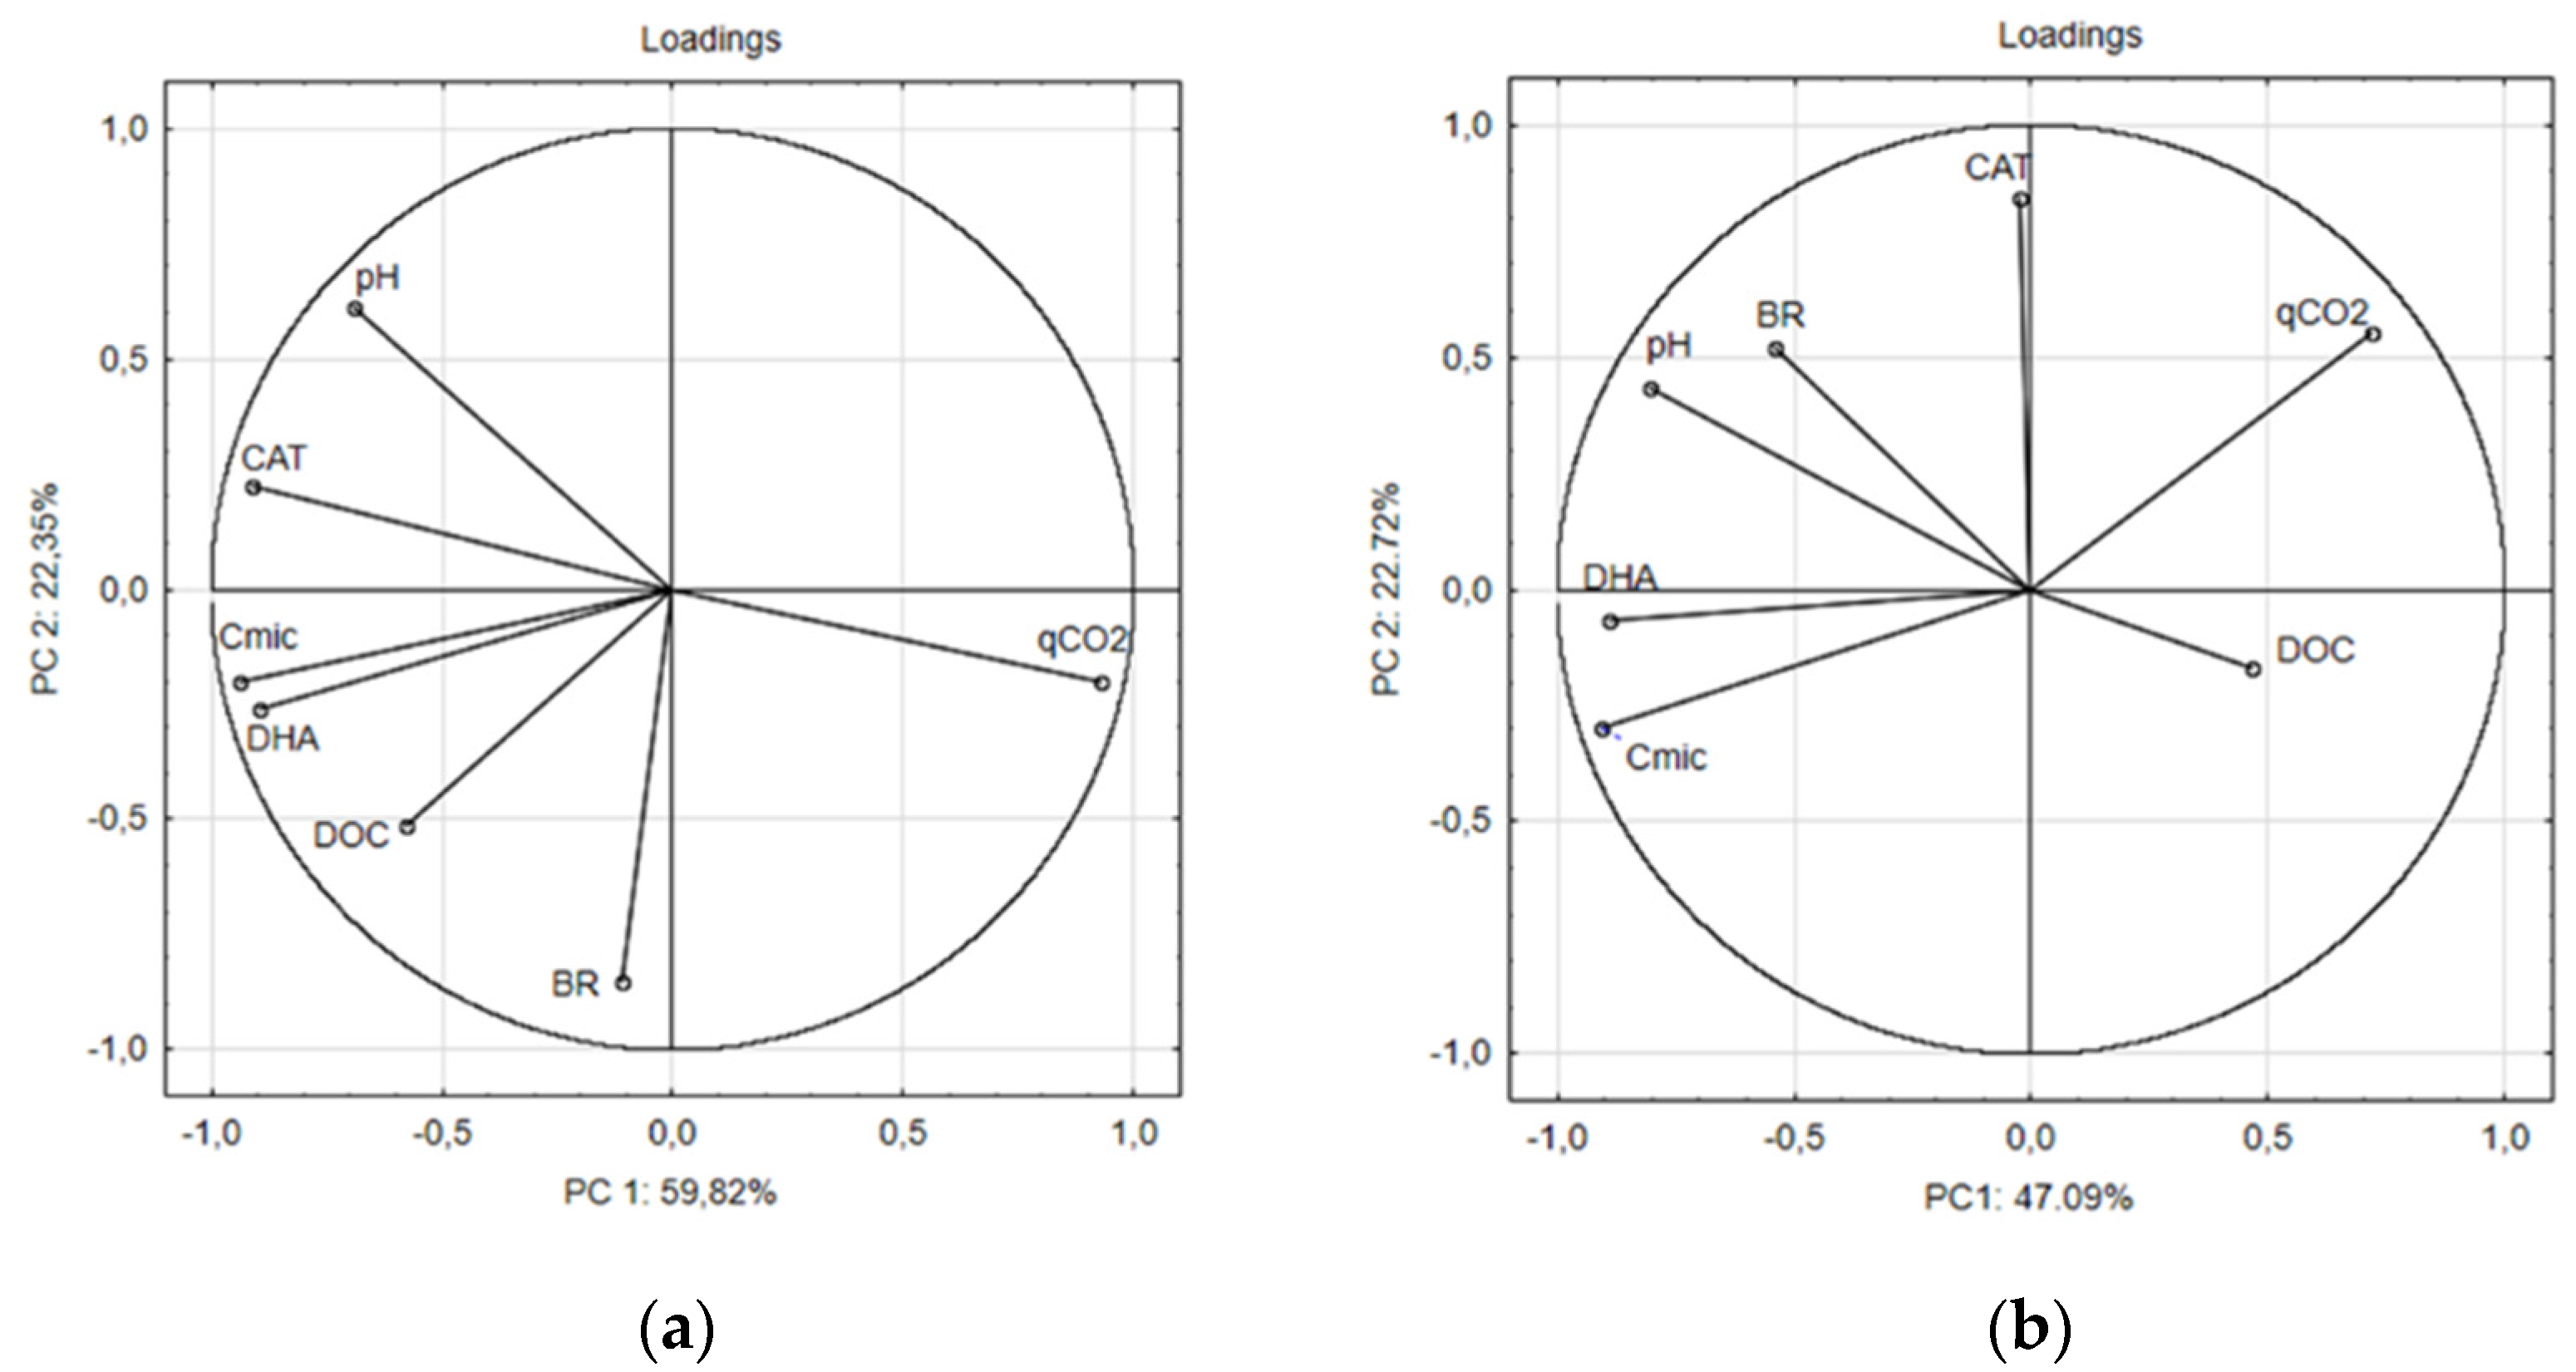
3.2. Microbial Indicators of Soils with Fertilizer and with Biofertilizers

The presented soil properties strongly determined the values of their microbiological parameters. Comparing the two enzymes studied, it was noticed that DHA and CAT activities were lower in sandy Brunic Arenosol than in silty Abruptic Luvisol (Figure 1). This is consistent with other studies on these enzymes in soils with contrasting textures [59].
The tested silty Luvisol, with higher enzymatic activity, had a higher NH4 content (Table 1), and such positive correlation has been also observed previously in a fertilized field [60]. It was previously reported that decomposition of soil organic C and N are factors which explained the influence of texture on soil enzyme activity [61]. In our study, DHA showed greater variability compared to CAT (Figure 1). Generally, CAT reached values above 10 µmol/g/min in silty soil, while below 10 µmol/g/min in sandy soil (Figure 1a). In sterilized controls, CAT was at the level of 8.89 ± 0.02 µmol/g/min of soil and 8.95 ± 0.05 µmol/g/min in Abruptic Luvisol and Brunic Arenosol (p < 0.05), respectively. In spite of the lower variation than DHA, significant differences in CAT were observed in selected variants. Rapid response (Ist sampling time) to addition of fertilizers without microbial enrichment (UC/PC) resulted in lowering of CAT in both soils. Urea enriched with microorganisms resulted in a significantly higher CAT, both in silty (UA 100 and UA 60) and sandy (UA 60) soils. Similarly, soils fertilized with Polifoska enriched with microorganisms, also resulted in significantly higher CAT, even in the PA 60 variant in silty Abruptic Luvisol. Catalase activity was higher in sandy Brunic Arenosol collected in IInd sampling time in all variants. After UC/PC application, CAT was higher than in soils from Ist sampling time. Considering the aspect of time, it has also been previously reported that enzymatic activity (including CAT) in arable fields (cucumber) varied greatly in different seasons, and higher activity was in the vigorous growth stage of the cultivated vegetable but showed lower activity during the early and late growth stages [60]. Biofertilizer addition to silty Abruptic Luvisol caused the highest (p < 0.05) activity in the variant with an optimal dose of Polifoska (PA 100), which was not observed in samples after application of a reduced fertilizer dose (PA 60). In sandy Brunic Arenosol, the differences between soil with fertilizers with and without microorganisms were not so visible.
As with CAT, DHA also reached higher values in silty Abruptic Luvisol (Figure 1b). Moreover, higher values of DHA were found in soils from the IInd sampling time than were one week after bio- and fertilizer application, just as with CAT. The study by Dinesh et al. [62] on other sandy loamy soil treated with biofertilizers showed changes in DHA activity during different stages of maize growth—vegetation, flowering, and post-harvest stage. That study found that DHA activity was gradually decreased with advancement of crop growth which is not consistent with our results. In our study DHA was more sensitive to fertilization than CAT, as greater variety and large standard deviations occurred in both soils. Despite the lack of statistical significance, greater variation in the dehydrogenase activity occurred in silty Luvisol collected one week after fertilization, and the highest values were observed in microbiologically enriched samples (especially full dose). The response after a few months (IInd sampling time) showed less DHA variation than a rapid reaction to fertilization.
In agriculturally degraded sandy Brunic Arenosol, DHA measured in the samples collected in the Ist sampling time was significantly lower in UC/PC treatment than in the control (C) without fertilizers (p < 0.05) (Figure 1b). Microorganism addition resulted in higher activity compared to not enriched UC/PC treatment, especially in samples with 40% reduced dose of Polifoska (PA 60). Samples from IInd sampling time also showed lowering of DHA after UC/PC addition in comparison with control without fertilization. In contrast, microorganism enrichment caused an increase of DHA, especially after addition of optimal dose of urea and reduced dose of Polifoska (p < 0.05). Addition of biofertilizers may provide substrates for DHA and enhanced microbial growth.
Our DHA results are partly comparable with results obtained by Singh et al. [38] since after addition of biofertilizers to sandy clay loam soil increased DHA in the rice-wheat-mung bean system, while decreased DHA activity in the rice-wheat system was observed. Different mechanisms of DHA increase are reported in the literature. In their experiment, Araújo et al. [36] observed that DHA reached the highest values after the application of biofertilizer with the highest content of readily available C and nutrients. DHA increased significantly after UGmax application (composition of yeasts, lactic acid bacteria, photosynthetic bacteria, Azotobacter, Pseudomonas and Actinobacteria, and potassium) in a dose of 1/L/ha, increasing by up to 157% which may be the result of additional microorganisms as well as macro- and microelements introduced with biofertilizer [10]. In the study on pomegranate, the rhizosphere DHA increased from 8.06 ± 0.06 to 9.05 p kat/g soil depending on the inoculum which may be explained by an increase in the rhizosphere microbial population due to biofertilizer application [17]. The higher DHA activity in clay loam soil amended with biofertilizers suggested the availability of a higher quantity of biodegradable substrates and hence, an improvement in the activity of soil microbiota [63].
Generally, soil microbial biomass was lower in sandy Brunic Arenosol than in silty Abruptic Luvisol. This is probably due to the low water holding capacity, low capacity for nutrient retention, and low organic carbon, which is characteristic for sandy soils [57]. Soil microbial biomass (Cmic) was higher in samples collected in the IInd sampling time than those taken one week after fertilization in both of the tested soils. However, the increase was higher in silty Abruptic Luvisol (Figure 2a).
The addition of fertilizer without microorganisms decreased Cmic values in both soils collected in both periods (Figure 2a). Microorganism enrichment resulted in significantly higher Cmic, however it was dependent upon the sampling time. In silty soil, a positive effect of biofertilizers was observed particularly in Ist sampling time, whilst in IInd sampling time in the sandy soil. Among the fertilizers enriched with microorganisms used in Abruptic Luvisol, the following variants were increasing Cmic values in the following order: PA 100 > PA 60 = UA 60 > UA 100 (in Ist sampling time), while only Polifoska in optimal dose enriched with microorganisms (PA 100) significantly increased Cmic in IInd sampling time. In Brunic Arenosol, the order was as follows, in IInd sampling time: UA 100 > UA 60 > PA 100 = PA 60, while no statistical differentiation between fertilized samples was observed in rapid response (in Ist sampling time). Basal respiration (BR) values responded differently to the added bio- and fertilizers depending on the sampling date and soil type (Figure 2b). In silty Luvisol, the changes were significant only in IInd sampling time, fertilization without microorganisms (UC/PC) generally increased BR but enrichment with urea and microorganisms resulted in BR at a level observed in the control without fertilization. In IInd sampling time, Polifoska with microorganisms added in full dose caused a decrease, while in the reduced dose an increase in BR values (p < 0.05) as observed. In sandy Arenosol, the changes in BR value were significantly different only in samples from Ist sampling time, however biofertilizer application decreased BR (p < 0.05) in UA 100 and PA 60 variant in IInd sampling time.
Enhanced soil respiration is a result of the higher metabolic activity of microorganisms. Input of organic nutrient sources significantly improved microbial biomass and respiration in sandy clay soil with biofertilizers applied in combination with crop residues, farmyard manure, and vermicompost [38]. Araújo et al. [36] showed that the application of tested biofertilizers also increased the microbial indicators; however the response depended on the composition of biofertilizers. The highest values of microbial parameters were observed after application of biofertilizer with readily available C and nutrients which stimulated Cmic [64]. The authors reported that a particular increase of Cmic occurred on days 40 and 70 after the addition of biofertilizers. The study on clay loam indicated that in the soil amended with biofertilizers the organic substrates are mineralized more rapidly and that the greater microbial biomass would have been able to degrade a greater quantity of substrates [63,65]. Metabolic quotient (qCO2) that reflects the maintenance energy requirement of soil microbiota [30] was elevated in Ist sampling time compared to IInd sampling time (Figure 2c). Additionally, higher standard deviations in both soils in Ist sampling time suggest initial imbalance after fertilization. The highest qCO2 value was obtained after application of fertilizers without microorganisms (UC/PC), and generally, in Ist sampling time remained on the level characteristic for non-fertilized soil control treatment. In both sampling dates in silty Abruptic Luvisol, the lowest qCO2 values were detected in full dose of Polifoska enriched with microorganisms (PA 100). Moreover, the metabolic quotient was the highest (p < 0.05) in IInd sampling time only after the addition of Polifoska with microorganisms in a reduced dose (PA 60). In sandy Brunic Arenosol, the addition of non-enriched fertilizers resulted in a significant qCO2 increase (compared to control) without fertilization which decreased after the application of biofertilizers in both sampling times. After addition of fertilizers with microorganisms the levels of qCO2 in soils collected in Ist sampling time were similar to that achieved in non-fertilized soil, only after the addition of a full dose of urea with microorganisms (UA 100) was the indicator the lowest (p < 0.05). A similar situation in Brunic Arenosol, occurred in soil from IInd sampling time, however qCO2 was significantly the lowest in samples amended with both biofertilizers in full dose, indicating an increase of microbial metabolic efficiency [66].
The research on silty loam soil has shown the importance of soil organic matter and pH in stimulating microbial biomass growth [67]. Soil pH strongly affects the quality and function of cultivated soils due to it determining adsorption, mobility, and bioavailability of nutrients in the soil solution. It has been confirmed that soil pH, besides mean annual precipitation, is the major environmental factor that shapes soil bacterial communities in maize soils [68]. Maize can grow in soils with a pH ranging from 5.7 to 8.0 [69] with an optimal value 5.5–7.0 [70]. Incubation of soils with biofertilizers resulted in an increase in the pH values compared to soils without microorganisms to a range which is proper for maize growth (Figure 3a).
Therefore, the increase in pH value after the addition of biofertilizers is a positive aspect of their use in degraded, acidic soils. PCA analysis showed that in both soils, pH is a stronger controller of soil biological activity than DOC content (Figure 4) in which significant changes were observed only in samples collected in IInd sampling time (Figure 3b).
The significance of the time aspect on carbon balance in soil has also been confirmed in longer studies. A long-term experiment on orchard soil with biofertilizers (Azotobacter, PSM, and Trichoderma harzianum) showed that the soil organic carbon (SOC) content improved significantly over the years of research with microorganisms playing a significant role [71]. Significant increase in SOM was observed after four years of organic addition to a horticultural soil [72]. We observed a positive correlation between pH, enzymatic activity (CAT, DHA) and microbial biomass (Cmic) in both soils of contrasting textures. The exception was CAT in sandy samples.
A summary of the effect of microorganism enrichment is presented in Table 2, which shows significant changes in the microbiological indicators after the application of biofertilizers compared to soils fertilized without microorganisms.
The rapid and short-term responses of soil to biofertilizers depended on the texture of tested soils. In silty Abruptic Luvisol both added biofertilizers in reduced and full dose resulted in an increase in CAT and Cmic in early response. This effect was maintained in the IInd sampling time only after the addition of an optimal dose of Polifoska. In sandy Brunic Arenosol with UA 100, we observed an increase in DHA and Cmic in IInd sampling time, while BR decreased in Ist sampling time. A positive effect was detected after the application of reduced dose of urea since CAT (in Ist sampling time) and Cmic (in IInd sampling time) were significantly higher than in the soils without microorganisms. DHA in sandy Arenosol was higher in both sampling terms after the addition of a reduced dose of Polifoska. Application of all tested biofertilizers (exception for PA 100, 60) resulted in soil pH increasing. Given the importance of positive impact, not only temporarily but also in the long term, we may try to propose the biofertilizer type optimal for coarse and fine textured soils. Based on the presented tests, we may suppose that from the tested biofertilizers Polifoska with microorganisms used in full dose may be optimal for silty soils, while Polifoska in reduced dose and urea both in full and reduced dose may act positively in sandy soils.

4. Conclusions

We concluded that biofertilizer application to chemically and agriculturally degraded soils increased its biological activity even in reduced doses of additives used. However, the response of the examined microbiological indicators was different in both soils. Generally, analysis of the tested microbial indicators showed that silty soil recognized as Abruptic Luvisol was characterized by higher biological activity than sandy soil recognized as Brunic Arenosol. Soil texture affected the impact of biofertilizers on soil biomass which was positive in rapid response (7 days after application) in silty soil, while short-term response (6 months after application) in sandy soil. We may suppose that from the tested biofertilizers, Polifoska with microorganisms used in full dose may be optimal for silty soil, while Polifoska in reduced dose and urea both in full and reduced dose may increase soil microbial activity in sandy soils. Level of pH was a stronger controller of soil biological activity than DOC. Therefore, the increase in pH value after the addition of biofertilizers is a positive aspect of their use in degraded soils. Although we didn’t recognize the microbial communities in tested soils, we suppose that biofertilizer application changed their compositions and diversity, however this would need to be confirmed by microbial tests. Long-term field and laboratory tests could confirm these recommendations.

Author Contributions

Conceptualization, A.W., M.F., M.B., A.B., and L.S.-P.; methodology, M.B. and A.W.; software, A.W. and M.B.; validation, A.B. and M.F.; formal analysis, A.W. and M.B.; investigation, A.W. and M.B.; resources, M.B., A.B., and A.W.; writing—original draft preparation, A.W. and M.B.; writing—review and editing, M.B., M.F., A.W., and A.B.; visualization, A.W. and M.B.; supervision, M.F.; project administration, L.S.-P., M.F., and A.B.; funding acquisition, L.S.-P., M.F., and A.B. All authors have read and agreed to the published version of the manuscript.

Funding

The work was financed by the National Centre for Research and Development under the program BIOSTRATEG3, contract number BIOSTRATEG3/347464/5/NCBR/2017 “BIO FERTIL”.

Acknowledgments

Agnieszka Rutkowska from the Institute of Soil Science and Plant Cultivation in Puławy, Poland is gratefully acknowledged for calculating doses of mineral fertilizers and biofertilizers used in this study.

Conflicts of Interest

The authors declare no conflict of interest.

References

  1. Prăvălie, R.; Patriche, C.V.; Bandoc, G. Quantification of land degradation sensitivity areas in Southern and Central Southeastern Europe. New results based on improving DISMED methodology with new climate data. Catena 2017, 158, 309–320. [Google Scholar] [CrossRef]
  2. Mącik, M.; Gryta, A.; Frąc, M. Biofertilizers in agriculture: An overview on concepts, strategies and effects on soil microorganisms. Adv. Agron. 2020, 162, 31–87. [Google Scholar] [CrossRef]
  3. Suhag, M. Potential of biofertilizers to replace chemical fertilizers. Int. Adv. Res. J. Sci. Eng. Technol. 2016, 3, 163–167. [Google Scholar] [CrossRef]
  4. Vessey, J.K. Plant growth promoting rhizobacteria as biofertilizers. Plant Soil 2003, 255, 571–586. [Google Scholar] [CrossRef]
  5. Itelima, J.U.; Bang, W.J.; Sila, M.D.; Onyimba, I.A.; Egbere, O.J. A review: Biofertilizer—A key player in enhancing soil fertility and crop productivity. J. Microbiol. Biotechnol. Rep. 2018, 2, 22–28. [Google Scholar]
  6. Ellafi, A.M.; Gadalla, A.; Galal, Y.G.M. Biofertilizers in action: Contributions of BNF in sustainable agricultural ecosystems. E-Int. Sci. Res. J. 2011, 3, 108–116. [Google Scholar]
  7. Faujdar, R.S.; Sharma, M. Effect of FYM, biofertilizers and Zinc on yield of maize and their residual effect on wheat. J. Soils Crops 2013, 23, 41–52. [Google Scholar]
  8. Mosaad, I.S.M. Effect of Mineral and Bio-Nitrogen Fertilization on Maize (Zea mays L.), some Soil Properties and Subsequent Wheat (Triticum aestivum, L.) Yield. Alex. Sci. Exch. J. 2016, 37, 550–560. [Google Scholar] [CrossRef]
  9. Nain, L.; Rana, A.; Joshi, M.; Jadhav, S.D.; Kumar, D.; Shivay, Y.S.; Paul, S.; Prasanna, R. Evaluation of synergistic effects of bacterial and cyanobacterial strains as biofertilizers for wheat. Plant Soil 2009, 331, 217–230. [Google Scholar] [CrossRef]
  10. Kowalska, J.; Niewiadomska, A.; Głuchowska, K.; Kaczmarek, D. Impact of fertilizers on soil properties in the case of Solanum Tuberosum, L. during conversion to organic farming. Appl. Ecol. Environ. Res. 2017, 15, 369–383. [Google Scholar] [CrossRef]
  11. Khan, H.I. Appraisal of Biofertilizers in Rice: To Supplement Inorganic Chemical Fertilizer. Rice Sci. 2018, 25, 357–362. [Google Scholar] [CrossRef]
  12. Simarmata, T.; Hersanti; Turmuktini, T.; Fitriatin, B.N.; Setiawati, M.R. Purwanto Application of Bioameliorant and Biofertilizers to Increase the Soil Health and Rice Productivity. HAYATI J. Biosci. 2016, 23, 181–184. [Google Scholar] [CrossRef]
  13. Dong, L.; Li, Y.; Xu, J.; Yang, J.; Wei, G.; Shen, L.; Ding, W.; Chen, S. Biofertilizers regulate the soil microbial community and enhance Panax ginseng yields. Chin. Med. 2019, 14, 20. [Google Scholar] [CrossRef] [PubMed] [Green Version]
  14. Mosa, W.F.A.E.-G.; Paszt, L.S.; Frąc, M.; Trzciński, P. The Role of Biofertilization in Improving Apple Productivity―A Review. Adv. Microbiol. 2015, 5, 21–27. [Google Scholar] [CrossRef] [Green Version]
  15. Babajide, P.A.; Akanbi, W.B.; Alamu, L.O.; Ewetola, E.A.; Olatunji, O.O. Growth, nodulation and biomass yield of soybean (Glycine max L.) as influenced by bio-fertilizers under simulated eroded soil condition. Res. J. Agron. 2008, 2, 96–100. [Google Scholar]
  16. Mukhopadhyay, S.; Maiti, S.K. Biofertilizer: VAM fungi–A future prospect for biological reclamation of mine degraded lands. Indian J. Environ. Prot. 2009, 29, 801–808. [Google Scholar]
  17. Aseri, G.; Jain, N.; Panwar, J.; Rao, A.; Meghwal, P. Biofertilizers improve plant growth, fruit yield, nutrition, metabolism and rhizosphere enzyme activities of Pomegranate (Punica granatum L.) in Indian Thar Desert. Sci. Hortic. 2008, 117, 130–135. [Google Scholar] [CrossRef]
  18. Włodarczyk, T.; Stepniewski, W.; Brzezińska, M. Dehydrogenase activity, redox potential, and emissions of carbon dioxide and nitrous oxide from Cambisols under flooding conditions. Boil. Fertil. Soils 2002, 36, 200–206. [Google Scholar] [CrossRef]
  19. Gianfreda, L.; Rao, M.; Piotrowska-Długosz, A.; Palumbo, G.; Colombo, C. Soil enzyme activities as affected by anthropogenic alterations: Intensive agricultural practices and organic pollution. Sci. Total. Environ. 2005, 341, 265–279. [Google Scholar] [CrossRef]
  20. Moeskops, B.; Sukristiyonubowo; Buchan, D.; Sleutel, S.; Herawaty, L.; Husen, E.; Saraswati, R.; Setyorini, D.; De Neve, S. Soil microbial communities and activities under intensive organic and conventional vegetable farming in West Java, Indonesia. Appl. Soil Ecol. 2010, 45, 112–120. [Google Scholar] [CrossRef]
  21. Gu, Y.; Wang, P.; Kong, C. Urease, invertase, dehydrogenase and polyphenoloxidase activities in paddy soils influenced by allelophatic rice variety. Eur. J. Soil Biol. 2009, 45, 436–444. [Google Scholar] [CrossRef]
  22. Salazar, S.; Sanchez, L.; Alvarez, J.; Valverde, A.; Galindo-Villardón, M.P.; Igual, J.M.; Peix, Á.; Santa-Regina, I. Correlation among soil enzyme activities under different forest system management practices. Ecol. Eng. 2011, 37, 1123–1131. [Google Scholar] [CrossRef]
  23. Wolińska, A.; Stepniewsk, Z. Dehydrogenase Activity in the Soil Environment. Dehydrogenases 2012, 10, 183–210. [Google Scholar] [CrossRef] [Green Version]
  24. Zhao, B.; Chen, J.; Zhang, J.; Qin, S. Soil microbial biomass and activity response to repeated drying–rewetting cycles along a soil fertility gradient modified by long-term fertilization management practices. Geoderma 2010, 160, 218–224. [Google Scholar] [CrossRef]
  25. Guwy, A.; Martin, S.; Hawkes, F.; Hawkes, D. Catalase activity measurements in suspended aerobic biomass and soil samples. Enzym. Microb. Technol. 1999, 25, 669–676. [Google Scholar] [CrossRef]
  26. Alef, K.; Nannipieri, P. Catalase activity. In Methods in applied soil microbiology and biochemistry; Alef, K., Nannipieri, P., Eds.; Academic Press: London, UK, 1995; pp. 362–363. [Google Scholar]
  27. Trasar-Cepeda, C.; Camiña, F.; Leirós, M.; Gil-Sotres, F. An improved method to measure catalase activity in soils. Soil Boil. Biochem. 1999, 31, 483–485. [Google Scholar] [CrossRef]
  28. Garcıa-Gil, J.C.; Kobza, J.; Soler-Rovira, P.; Javoreková, S.; García-Gil, J.C. Soil Microbial and Enzyme Activities Response to Pollution Near an Aluminium Smelter. CLEAN—Soil Air Water 2013, 41, 485–492. [Google Scholar] [CrossRef] [Green Version]
  29. Anderson, T.-H. Microbial eco-physiological indicators to asses soil quality. Agric. Ecosyst. Environ. 2003, 98, 285–293. [Google Scholar] [CrossRef]
  30. Dilly, O. Microbial energetics in soils. In Microorganisms in Soils: Roles in Genesis and Functions; Buscot, F., Varma, A., Eds.; Soil Biology Series; Springer: Berlin/Heidelberg, Germany, 2005; Volume 3, pp. 123–138. [Google Scholar]
  31. Araújo, A.S.F.; Santos, V.; Monteiro, R. Responses of soil microbial biomass and activity for practices of organic and conventional farming systems in Piauí state, Brazil. Eur. J. Soil Boil. 2008, 44, 225–230. [Google Scholar] [CrossRef]
  32. Zhao, F.; Wang, J.; Zhang, L.; Ren, C.; Han, X.; Yang, G.; Doughty, R.; Deng, J. Understory Plants Regulate Soil Respiration through Changes in Soil Enzyme Activity and Microbial C, N, and P Stoichiometry Following Afforestation. Forests 2018, 9, 436. [Google Scholar] [CrossRef] [Green Version]
  33. Nannipieri, P.; Ascher-Jenull, J.; Ceccherini, M.T.; Landi, L.; Pietramellara, G.; Renella, G. Microbial diversity and soil functions. Eur. J. Soil Sci. 2003, 54, 655–670. [Google Scholar] [CrossRef]
  34. Anderson, T.-H.; Domsch, K.H. Soil microbial biomass: The eco-physiological approach. Soil Boil. Biochem. 2010, 42, 2039–2043. [Google Scholar] [CrossRef]
  35. Wardle, D.A.; Ghani, A. A critique of the microbial metabolic quotient (qCO2) as a bioindicator of disturbance and ecosystem development. Soil Biol. Biochem. 1995, 27, 1601–1610. [Google Scholar] [CrossRef]
  36. Araújo, A.S.F.; Oliveira, J.; Araújo, R.; Gomes, R. Biofertilizers on soil microbial biomass and activity. Rev. Bras. Ciênc. Agrár. —Braz. J. Agric. Sci. 2014, 9, 545–549. [Google Scholar] [CrossRef]
  37. Zu Schweinsberg-Mickan, M.S.; Müller, T. Impact of effective microorganisms and other biofertilizers on soil microbial characteristics, organic-matter decomposition, and plant growth. J. Plant Nutr. Soil Sci. 2009, 172, 704–712. [Google Scholar] [CrossRef]
  38. Singh, G.; Kumar, D.; Sharma, P.; Krakauer, N. Effect of organics, biofertilizers and crop residue application on soil microbial activity in rice – wheat and rice-wheat mungbean cropping systems in the Indo-Gangetic plains. Cogent Geosci. 2015, 1, 1085296. [Google Scholar] [CrossRef]
  39. Piotrowska, A.; Długosz, J.; Zamorski, R.; Bogdanowicz, P. Changes in some biological and chemical properties of an arable soil treated with the microbial biofertilizer UGmax. Pol. J. Environ. Stud. 2012, 21, 455–463. [Google Scholar]
  40. Borowik, K.; Rusek, P.; Schab, S.; Rusek, Ł. Biofertilizer and Method of Its Production (Bionawóz i sposób jego wytwarzania). Patent Application No. 431350, 10 March 2019. [Google Scholar]
  41. Bieganowski, A.; Chojecki, T.; Ryżak, M.; Sochan, A.; Lamorski, K. Methodological Aspects of Fractal Dimension Estimation on the Basis of Particle Size Distribution. Vadose Zone J. 2013, 12. [Google Scholar] [CrossRef]
  42. Bieganowski, A.; Ryżak, M.; Sochan, A.; Barna, G.; Hernádi, H.; Beczek, M.; Polakowski, C.; Makó, A. Laser Diffractometry in the Measurements of Soil and Sediment Particle Size Distribution. Adv. Agron. 2018, 151, 215–279. [Google Scholar] [CrossRef]
  43. Yu, Z.; Chen, L.; Pan, S.; Li, Y.; Kuzyakov, Y.; Xu, J.; Brookes, P.; Luo, Y. Feedstock determines biochar-induced soil priming effects by stimulating the activity of specific microorganisms. Eur. J. Soil Sci. 2018, 69, 521–534. [Google Scholar] [CrossRef]
  44. Trevors, J. Rapid gas chromatographic method to measure H2O2 oxidoreductase (catalase) activity in soil. Soil Boil. Biochem. 1984, 16, 525–526. [Google Scholar] [CrossRef]
  45. Walkiewicz, A.; Brzezińska, M. Interactive effects of nitrate and oxygen on methane oxidation in three different soils. Soil Boil. Biochem. 2019, 133, 116–118. [Google Scholar] [CrossRef]
  46. Casida, L.E.; Klein, D.A.; Santoro, T. Soil Dehydrogenase Activity. Soil Sci. 1964, 98, 371–376. [Google Scholar] [CrossRef]
  47. Anderson, J.; Domsch, K. A physiological method for the quantitative measurement of microbial biomass in soils. Soil Boil. Biochem. 1978, 10, 215–221. [Google Scholar] [CrossRef]
  48. Šimek, M.; Kalčík, J. Carbon and nitrate utilization in soils: The effect of long-term fertilization on potential denitrification. Geoderma 1998, 83, 269–280. [Google Scholar] [CrossRef]
  49. Gliński, J.; Stępniewski, W. Soil Aeration and Its Role for Plants; CRC Press: Boca Raton, FL, USA, 1985. [Google Scholar]
  50. Ullah, S.; Frasier, R.; King, L.; Picotte-Anderson, N.; Moore, T.R. Potential fluxes of N2O and CH4 from soils of three forest types in Eastern Canada. Soil Boil. Biochem. 2008, 40, 986–994. [Google Scholar] [CrossRef]
  51. Wang, W.; Dalal, R.C.; Moody, P.; Smith, C.J. Relationships of soil respiration to microbial biomass, substrate availability and clay content. Soil Boil. Biochem. 2003, 35, 273–284. [Google Scholar] [CrossRef]
  52. Hemkemeyer, M.; Christensen, B.T.; Martens, R.; Tebbe, C.C. Soil particle size fractions harbour distinct microbial communities and differ in potential for microbial mineralisation of organic pollutants. Soil Boil. Biochem. 2015, 90, 255–265. [Google Scholar] [CrossRef]
  53. Bollmann, A.; Conrad, R. Influence of O2availability on NO and N2O release by nitrification and denitrification in soils. Glob. Chang. Boil. 1998, 4, 387–396. [Google Scholar] [CrossRef]
  54. Hamarashid, N.H.; Othman, M.A.; Hussain, M.A.H. Effect of soil texture on chemical compositions, microbial populations and carbon mineralization in soil. Egypt. J. Exp. Biol. 2010, 6, 59–64. [Google Scholar]
  55. Walkiewicz, A.; Brzezińska, M.; Wnuk, E.; Jabłoński, B. Soil properties and not high CO2 affect CH4 production and uptake in periodically waterlogged arable soils. J. Soils Sediments 2019, 20, 1231–1240. [Google Scholar] [CrossRef]
  56. Helmi, H.; Hechmi, S.; Khelil, M.N.; Zoghlami, I.R.; Benzarti, S.; Mokni-Tlili, S.; Hassen, A.; Jedidi, N. Repetitive land application of urban sewage sludge: Effect of amendment rates and soil texture on fertility and degradation parameters. Catena 2019, 172, 11–20. [Google Scholar] [CrossRef]
  57. Tahir, S.; Marschner, B. Clay addition to sandy soil: Effect of clay concentration and ped size on microbial biomass and nutrient dynamics after addition of low C/N ratio residue. J. soil Sci. Plant Nutr. 2016, 16, 864–875. [Google Scholar] [CrossRef] [Green Version]
  58. Wolf, J.; Broeke, M.H.-T.; Rötter, R.P. Simulation of nitrogen leaching in sandy soils in The Netherlands with the ANIMO model and the integrated modelling system STONE. Agric. Ecosyst. Environ. 2005, 105, 523–540. [Google Scholar] [CrossRef]
  59. Khadem, A.; Raiesi, F. Influence of biochar on potential enzyme activities in two calcareous soils of contrasting texture. Geoderma 2017, 308, 149–158. [Google Scholar] [CrossRef]
  60. Yang, L.; Li, T.; Li, F.; Lemcoff, J.H.; Cohen, S. Fertilization regulates soil enzymatic activity and fertility dynamics in a cucumber field. Sci. Hortic. 2008, 116, 21–26. [Google Scholar] [CrossRef]
  61. Monreal, C.; Bergstrom, D.W. Soil enzymatic factors expressing the influence of land use, tillage system and texture on soil biochemical quality. Can. J. Soil Sci. 2000, 80, 419–428. [Google Scholar] [CrossRef]
  62. Dinesh, D.; Chithra, L.; Baskar, M.; Rajan, K.; Senthilraja, K.; Sankar, M.; Kumar, R.; Sivakumar, K. Variation of Soil Microbial Growth and Enzyme Activities by Application of Treated Distillery Effluent in Maize Crop Grown Under Sandy Loam Soils. Int. J. Curr. Microbiol. Appl. Sci. 2017, 6, 1334–1348. [Google Scholar] [CrossRef]
  63. Dinesh, R.; Srinivasan, V.; Hamza, S.; Manjusha, A. Short-term incorporation of organic manures and biofertilizers influences biochemical and microbial characteristics of soils under an annual crop [Turmeric (Curcuma longa L.)]. Bioresour. Technol. 2010, 101, 4697–4702. [Google Scholar] [CrossRef]
  64. Santos, V.B.; Araújo, A.S.F.; Leite, L.F.; Nunes, L.A.P.L.; De Melo, W.J. Soil microbial biomass and organic matter fractions during transition from conventional to organic farming systems. Geoderma 2012, 170, 227–231. [Google Scholar] [CrossRef]
  65. Tejada, M.; Garcia, C.; González, J.; Hernandez, T. Use of organic amendment as a strategy for saline soil remediation: Influence on the physical, chemical and biological properties of soil. Soil Boil. Biochem. 2006, 38, 1413–1421. [Google Scholar] [CrossRef]
  66. Hungria, M.; Franchini, J.C.; Brandão-Junior, O.; Kaschuk, G.; Souza, R.A. Soil microbial activity and crop sustainability in a long-term experiment with three soil-tillage and two crop-rotation systems. Appl. Soil Ecol. 2009, 42, 288–296. [Google Scholar] [CrossRef]
  67. Pietri, J.A.; Brookes, P. Relationships between soil pH and microbial properties in a UK arable soil. Soil Boil. Biochem. 2008, 40, 1856–1861. [Google Scholar] [CrossRef]
  68. Tan, W.; Wang, J.; Bai, W.; Qi, J.; Chen, W. Soil bacterial diversity correlates with precipitation and soil pH in long-term maize cropping systems. Sci. Rep. 2020, 10, 6012. [Google Scholar] [CrossRef] [Green Version]
  69. Peiffer, J.A.; Spor, A.; Koren, O.; Jin, Z.; Tringe, S.G.; Dangl, J.L.; Buckler, E.; Ley, R. Diversity and heritability of the maize rhizosphere microbiome under field conditions. Proc. Natl. Acad. Sci. USA 2013, 110, 6548–6553. [Google Scholar] [CrossRef] [Green Version]
  70. Havlin, J.L.; Beaton, J.D.; Tisdale, S.L.; Nelson, W.L. Soil Fertility and Fertilizers, 6th ed.; Prentice-Hall, Inc.: Upper Saddle River, NJ, USA, 1999; p. 499. [Google Scholar]
  71. Adak, T.; Singha, A.; Kumar, K.; Shukla, S.K.; Singh, A.; Singh, V.K. Soil organic carbon, dehydrogenase activity, nutrient availability and leaf nutrient content as affected by organic and inorganic source of nutrient in mango orchard soil. J. soil Sci. Plant Nutr. 2014, 14, 394–406. [Google Scholar] [CrossRef] [Green Version]
  72. Albiach, R.; Canet, R.; Pomares, F.; Ingelmo, F. Organic matter components and aggregate stability after the application of different amendments to a horticultural soil. Bioresour. Technol. 2001, 76, 125–129. [Google Scholar] [CrossRef]
Figure 1. Enzymatic activity of (a) catalase (CAT) and (b) dehydrogenases (DHA) in Abruptic Luvisol and Brunic Arenosol collected on two dates after fertilization: Ist sampling time (one week after the application of bio- and fertilizers), and IInd sampling time (six months after fertilization). Tested variants: C—control without fertilization, UC/PC—Polifoska and urea, UA 100—urea in full dose enriched with microorganisms, UA 60—urea in reduced dose enriched with microorganisms, PA 100—Polifoska in full dose enriched with microorganisms, PA 60—Polifoska in reduced dose enriched with microorganisms (average values ± standard deviation; n = 3). Different letters indicate significant differences; n.s.—not significant; ANOVA, Tukey HSD test, separately for each soil and for each sampling time, p < 0.05.
Agronomy 10 01347 g001
Figure 2. Microbial indicators of (a) soil microbial biomass (Cmic), (b) basal respiration (BR), and (c) metabolic quotient (qCO2) in Abruptic Luvisol and Brunic Arenosol collected on two dates after fertilization: Ist sampling time (one week after the application of bio- and fertilizers), and IInd sampling time (six months after fertilization). Tested variants: C—control without fertilization, UC/PC—Polifoska and urea, UA 100—urea in full dose enriched with microorganisms, UA 60—urea in reduced dose enriched with microorganisms, PA 100—Polifoska in full dose enriched with microorganisms, PA 60—Polifoska in reduced dose enriched with microorganisms (average values ± standard deviation; n = 3). Different letters indicate significant differences; ANOVA, Tukey HSD test, separately for each soil and for each sampling time, p < 0.05.
Agronomy 10 01347 g002
Figure 3. pH (a) and dissolved organic carbon content (DOC) (b) in Abruptic Luvisol and Brunic Arenosol collected in two terms after fertilization: Ist sampling time (one week after the application of bio- and fertilizers), and IInd sampling time (six months after fertilization). Tested variants: C—control without fertilization, UC/PC—Polifoska and urea, UA 100—urea in full dose enriched with microorganisms, UA 60—urea in reduced dose enriched with microorganisms, PA 100—Polifoska in full dose enriched with microorganisms, PA 60—Polifoska in reduced dose enriched with microorganisms (average values ± standard deviation; n = 3). Different letters indicate significant differences; ANOVA, Tukey HSD test, separately for each soil and for each sampling time, p < 0.05.
Agronomy 10 01347 g003
Figure 4. Principal component analysis (PCA loadings) for variables’ parameters tested: (a) silty loam Abruptic Luvisol, and (b) sandy Brunic Arenosol.
Agronomy 10 01347 g004
Table 1. Basic characteristic of tested soils.
Soil TypeClaySiltSandTextureP2O5K2OMgN-NO3N-NH4NminDOCCorgpHH2O
(%) (mg/kg)(kg/ha)(mg/kg)(%)
Brunic Arenosol0.9312.486.6sandy1742912<1.392.1422.037.931.546.29
Abruptic Luvisol5.460.334.3silt loam4853362.916.5775.652.303.766.90
Table 2. Determining the impact of biofertilizers on microbiological parameters (CAT—catalase activity, DHA—dehydrogenase activity, Cmic—soil microbial biomass, BR—basic respiration, DOC—dissolved organic carbon content, pH of Abruptic Luvisol and Brunic Arenosol collected one week (Ist sampling time) and six months (IInd sampling time) after fertilization with optimal (100%) and reduced (60%) dose of UA—urea, and PA—Polifoska.
CATDHACmicBRDOCpH
Sampling TimeIstIIndIstIIndIstIIndIstIIndIstIIndIstIInd
Abruptic Luvisol
UA 100+n.s.n.s.n.s.+n.s.n.s.n.s.n.s.n.s.+n.s.
UA 60+n.s.n.s.n.s.+n.s.n.s.n.s.n.s.-++
PA 100++n.s.n.s.++n.s.-n.s.n.s.++
PA 60+n.s.n.s.n.s.+n.s.n.s.n.s.n.s.n.s.+n.s.
Brunic Arenosol
UA 100n.s.n.s.n.s.+n.s.+-n.s.n.s.n.s.++
UA 60+n.s.n.s.n.s.n.s.+n.s.n.s.n.s.n.s.++
PA 100n.s.n.s.n.s.n.s.n.s.n.s.n.s.n.s.n.s.n.s.--
PA 60n.s.n.s.++n.s.n.s.n.s.n.s.n.s.n.s.++
“+“—significant increase; “-“—significant decrease; n.s.—not significant; compared to soils with fertilization without microorganisms addition.

