Article

Trade-Offs between Sustainability Indicators in Response to the Production Choices of Different Farm Household Types in Drylands

1
CIHEAM-IAMM, Univ. Montpellier, 34000 Montpellier, France
2
Social, Economic and Policy Research Program (SEPRP), International Center for Agricultural Research in the Dry Areas (ICARDA), Cairo 11711, Egypt
3
ABSys, Univ. Montpellier, CIHEAM-IAMM, CIRAD, INRAE, Institut Agro, 34000 Montpellier, France
*
Author to whom correspondence should be addressed.
Agronomy 2020, 10(7), 998; https://doi.org/10.3390/agronomy10070998
Submission received: 14 May 2020 / Revised: 30 June 2020 / Accepted: 7 July 2020 / Published: 11 July 2020
(This article belongs to the Section Farming Sustainability)

Abstract

:
A lot of national and international effort has been made to promote sustainable agricultural production systems in drylands. However, success has been seriously limited due to lack of thorough characterization of the impact of the diversity of farm household types on productivity, resource-use efficiency and economic and nutritional status. This study applied hierarchical ascendant classification to a random sample of 286 cereal-producing farm households in Morocco and identified distinct household typologies. It also carried out an analysis of trade-offs between economic, nutritional and environmental factors induced by the production decisions of the different farm household typologies. Our analysis identified three dominant farm household typologies in the production system, namely: (i) intensive predominantly-vegetable farming households with high input intensities, (ii) semi-intensive cereal mono-crop farming households with moderate input intensities and (iii) extensive mixed cereal-legume farming households with low input intensities. Extensive mixed cereal-legume farming households exhibited the highest resource-use efficiency and high biodiversity. These benefits, however, came at the expense of a much lower farm income and limited food supplies relative to the other two systems. These results show that, as is the case for many dryland regions, all three farm types showed precarious conditions for one or more of the sustainability-related indicators.

1. Introduction

Historically, agriculture in drylands has always been dominated by farms with diversified cropping systems involving cereals, legumes and horticulture with low input intensities [1,2]. Such farming systems generate income which, while low when compared to the national average, constitutes a substantial part of the cash income and food consumption for large numbers of farm households [3]. With globalization and the increasing cost of living, extensive and diversified production systems are failing to meet the income, food needs and expectations of higher standards of living among farming communities. As a result, governments face the challenges of ensuring food security and reducing food import bills as well as increasing the income of farm households [4].
Since the 1980s, several countries in drylands have undertaken agricultural reforms to intensify their agriculture, which has brought about gradual changes in farming systems [3,5]. In response to these new policies, farm households, depending on their endowments and production goals, have followed different trajectories in terms of their production systems, some of them engaging in highly intensive input-use.
Agricultural intensification has led to at least four major changes in agro-ecological zones that are typical in dryland areas, namely: (i) a general increase in the income of farm households which, however, came with increased inequality caused by unequal access to resources [6]; (ii) a degradation of natural resources and a deterioration of the environment [7]. In the Saïss plain in the north of Morocco for example, with more than nine thousand wells dug, intensification led to a rapid depletion of ground water aquifers, which dropped by about 90 m over a period of 32 years [8]; (iii) specialization and market orientation of agricultural systems which, in some cases, led to mono-cropping—thereby threatening the provision of ecosystem services resulting from biodiversity. Specialization also reduced the diversity of farm households’ food intake as most or all of the production is marketed as opposed to being used for family consumption. While one can argue that a higher income from specialization can be used to purchase more food, problems related to access, transaction costs, and marketing risks compromise the ability of farm households to sustain balanced diets [9,10]; and (iv) high variation among farms in the efficiency of input-use (water, fertilizer, pesticides, labour) caused by unequal access to biophysical and financial resources and at times due to the lack of know-how concerning intensive production techniques [7,11].
Nowadays, the conservation of natural resources, the improvement of farm household income and balanced and sustainable food supplies are increasingly becoming a subject of public policy debate. A good study case is Morocco, where these objectives are the targets of Pillar II of the Green Morocco Plan [12]. Nevertheless, there are still a lot of unanswered questions about the options and measures to be promoted, as most public policies consider the establishment of specialized production systems dominated by cash crops (such as vegetables and orchards) to be a priority. The policies for the revitalization of agriculture in Tunisia [13], Lebanon [14], Egypt [15] and in Pillar I of the Green Morocco Plan [16] are good examples.
Most studies that categorize and analyse the performance of agricultural production systems in drylands have at least two important limits: i) they are often qualitative (or semi-qualitative), mainly trying to understand the trajectory of these farms and draw conclusions about the factors that contributed to their evolution [17,18]. This type of analysis is not very useful when it comes to proposing technical or socio-economic levers to improve the future sustainability of these farming systems, ii) they are quantitative but often only consider structural and economic criteria (farm size, total farm production, etc.) [5,19]. Economic, environmental and household food consumption criteria were often considered to be part of an emerging sustainable intensification framework [20,21,22], but always separately, or not in a fully integrated way as suggested by [23]. It is therefore indispensable to characterize, analyse and understand the performance of all dominant production systems in dryland areas with due attention to the diversity within and across and the complementarities and trade-offs involved before deciding on agricultural development measures with a view to sustainable intensification.
Therefore, an analysis of these categories via a system of indicators of various natures (agro-environmental, economic and consumption) would make it possible to evaluate their sustainability.
This evaluation could then serve as a basis and a key first step to i) extrapolate/upscale individual farm-scale analyses to a larger spatial scale (region, landscape, watershed) to help stakeholders define new systems of which the performance has to take into account trade-offs between production and environmental issues [19,24], ii) identify and test using a modelling approach with adapted levers (scenarios) for promoting sustainable farming systems [9,25] and iii) use the results of the typology as a basis to discuss the possible trajectories of the selected farming systems with stakeholders [26].
By using a Moroccan case study, the objective of this paper is to characterize the diversity of farm household typologies using structural and functional criteria (including environmental). In contrast to typologies built only on the basis of land-holding size and input quantities, this typology also includes the consumption component of farm households to analyse the potential and limitations of farm households when it comes to adopting new sustainable practices [27].
Moreover, this paper seeks to measure and compare, through a trade-off indicator analysis, the effects of production decisions made by each farm household typology on sustainability-related indicators including economic, biodiversity, resource-use efficiency and food consumption.

2. Materials and Methods

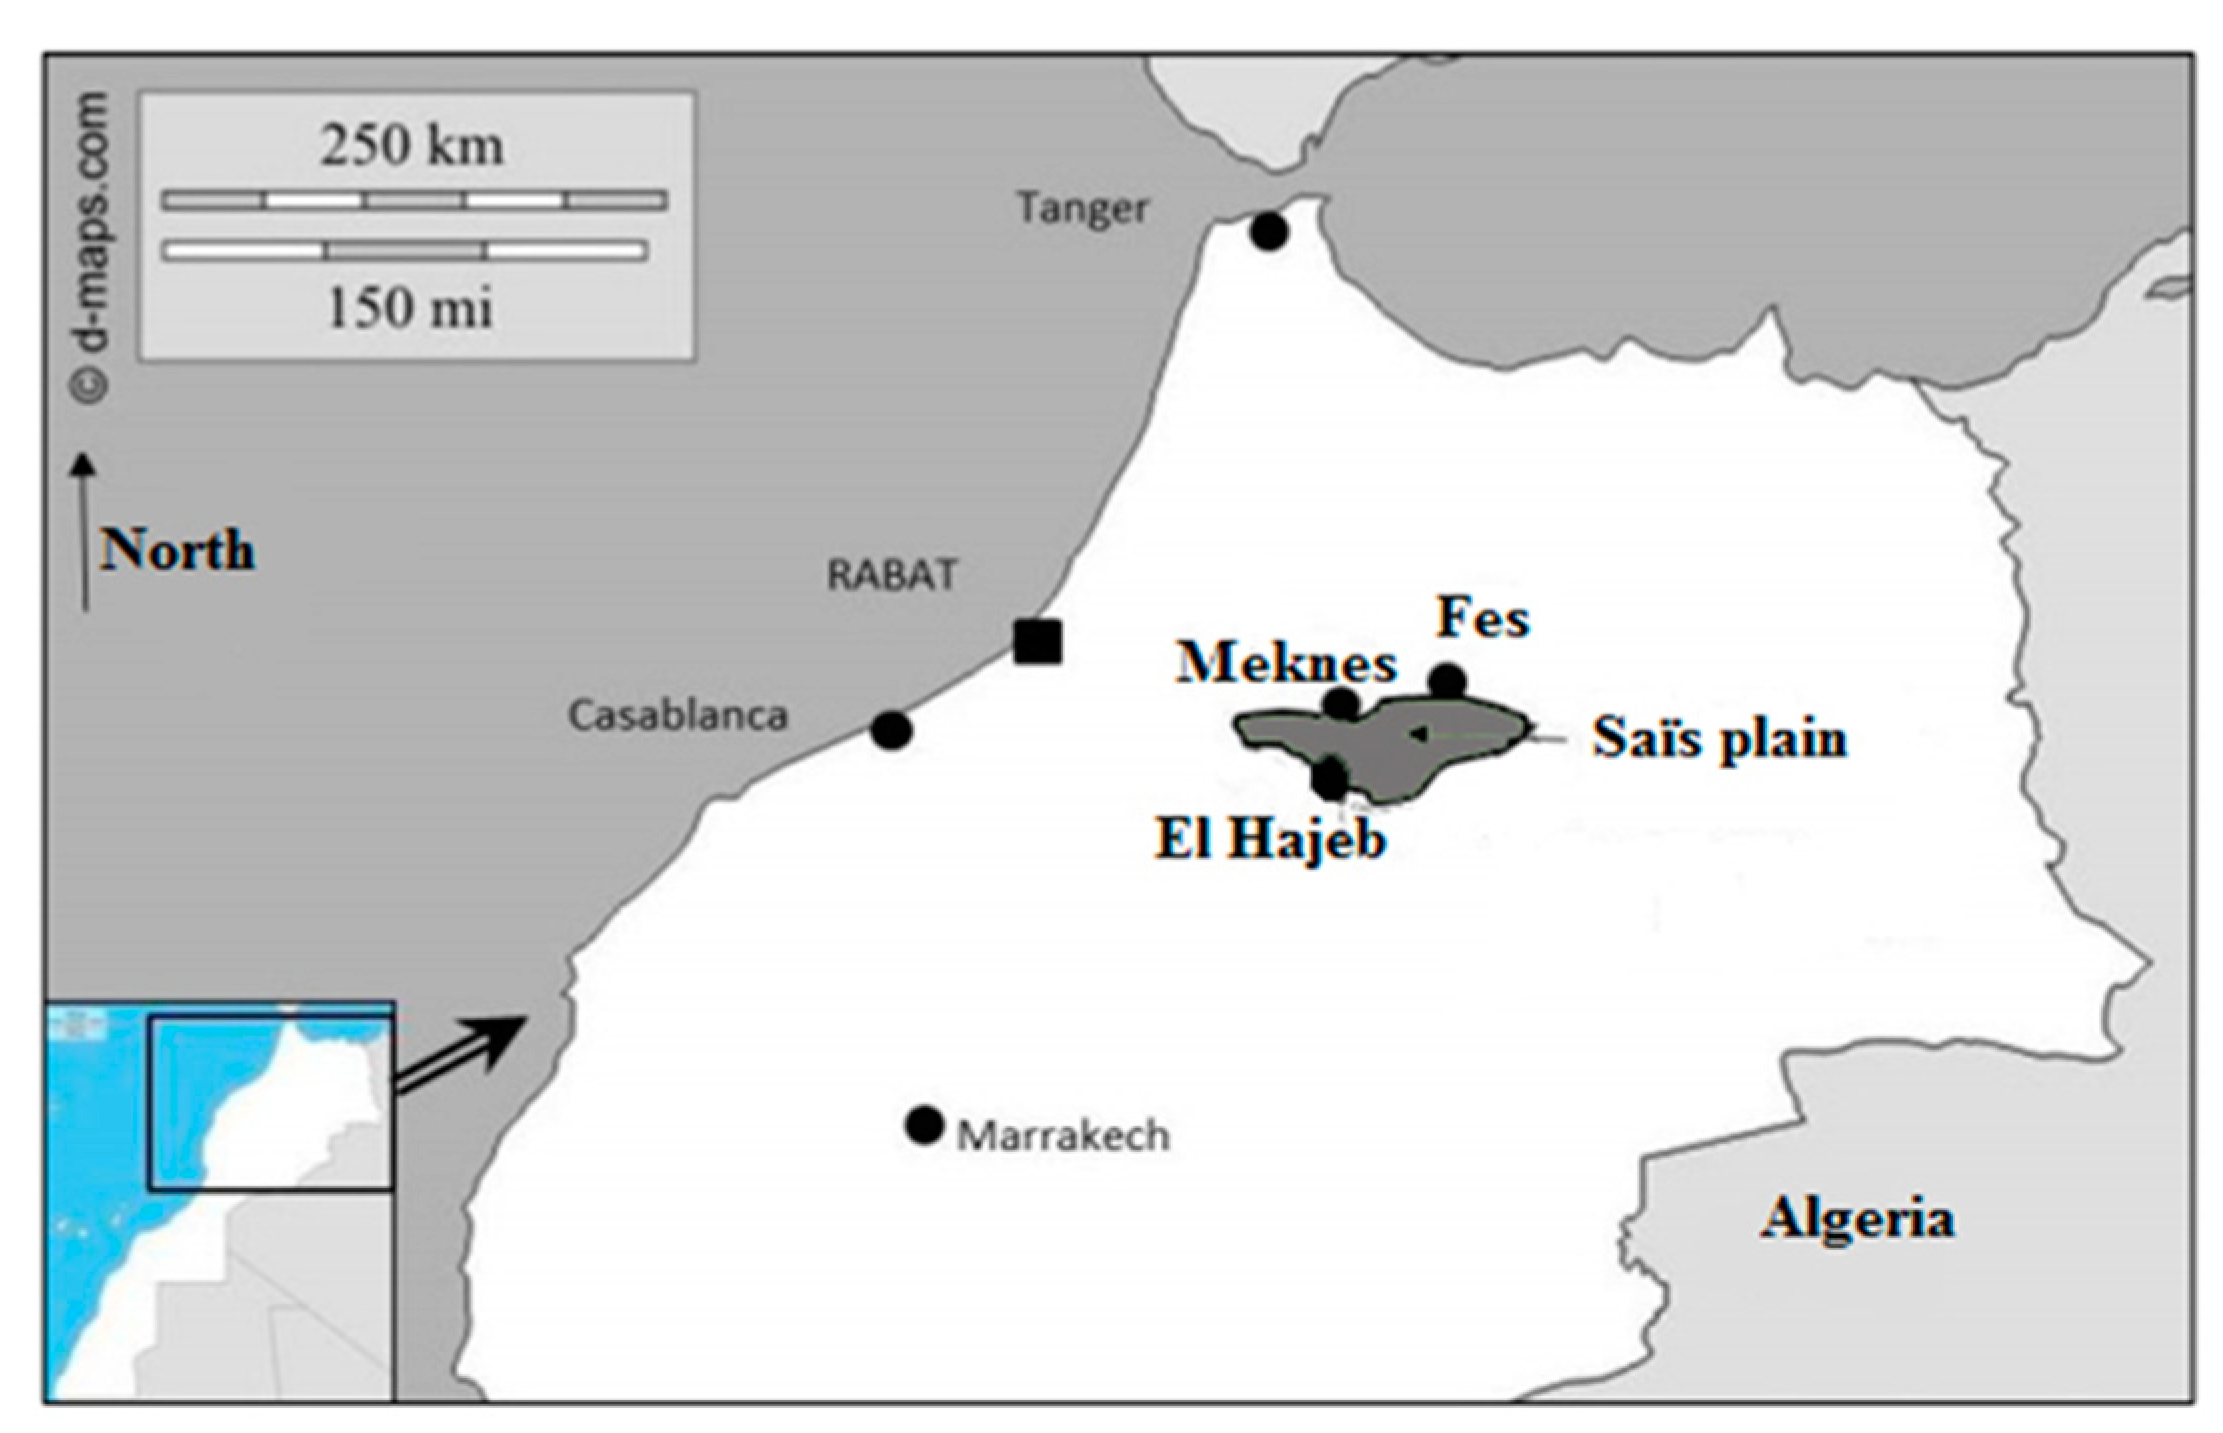
2.1. Description of the Study Area

This study was carried out in the Saïss plain, which covers a surface area of about 2200 km² in northern Morocco (Figure 1). It is one of the major agricultural areas in Morocco with 88% of the total land dedicated to agriculture [28]. An arid climate (the aridity index for the vast majority of the study area is between 0.35 and 0.5 [29], which is suitable for cereals, predominates in the area. The mean annual rainfall is about 500 mm; nevertheless, risk of drought remains high, particularly in the early part and the middle of the growing season. The precipitation pattern is typically winter rainfall, distributed over one long season with the peak occurring between November and April.
A large majority of the farms in the Saïss plain combine non-irrigated cereal crops with legume, vegetable and fodder crops. Cereals account for 50% of the total arable land. The irrigated surface area accounts, on average, for 14% of the arable land [30]. The study area is dominated by small farms: about 70% of them cultivate less than five hectares of land [8]. The production of cereals and vegetables is mainly market-oriented but with a sizeable amount used for self-consumption. Crop yields vary greatly from farm to farm, but also from year to year [31]. Livestock also plays an important role in the economy of the study area with some farms engaging in semi-intensive livestock rearing. The total livestock population in 2012 was 480,176 head, among which sheep predominated (82%), followed by cattle (10%) and goats (8%) [32].
The mean annual farm income in the area is about 28,000 Moroccan Dirhams (dh), which is 58% less than the national average [33]. Sales of cereals (straw and grain) and vegetables (onion and potato) production are the major sources of cash income for farm households [8].
Since the launch of the Green Morocco Plan in 2008, the Saïss plain has been subjected to a gradual intensification of agricultural production systems, marked by ever-increasing irrigation and hence the exploitation of ground water aquifers. This intensification is also accompanied by specialization mainly based on onion and potato production, leading to an increase of about 15% in the area share of marketable vegetable crops in less than 10 years [8].

2.2. Analytical Method Used to Characterize the Diversity and Performance of Farm Households

2.2.1. Farm Household Data

The primary data used in this study was obtained from a survey (for more details see Appendix B) of 286 mainly cereal-producing farm households conducted in 2014 by the International Center for Agricultural Research (ICARDA), the Institut National de la Recherche Agronomique (INRA)-Morocco and the CIHEAM-IAMM Montpellier.
Interviews with the heads of the sample households were conducted using a set of three structured questionnaires. The first questionnaire investigated the socio-economic and nutritional characteristics of the household (gender and age composition, farming activities, sources of income, consumption of different products from their personal production, etc.). The second questionnaire looked in more detail at each household’s farming activities. It aimed at 1) understanding the impact of farming decisions on the amount and quality of ecosystem services and 2) identifying the main tasks involved in growing crops as well as the division of labour (for men and women) for specific farm activities.
The third questionnaire sought structural data to describe the surveyed farm households including available arable land area, actual land use, the amount of time spent on agricultural activities, the proportion of each task performed per labour type (family vs. hired) and yield differences across farms per soil type and quantities of inputs.

2.2.2. Typology of Farm Households

In order to characterize the household farming systems in the Saïss plain of Morocco, this paper started by classifying the sample farm households into distinct types. In order to develop the typology, the following three important groups of classification criteria (Table 1) were considered [34].
  • Criteria that account for resource endowment
While resource endowment can include a vast array of resources and assets, only two of the most important endowments were captured in this study, namely production potential and financial resources. The rationale for considering only these two endowments is that they are the ones which are likely to have the highest influence on production decisions and on the productivity of the farms. Particularly in a dry area, production potential is often associated with the level of access to biophysical resources such as land and water. In our study, the land holding (i.e., size of farm owned by the household) and the surface area that has access to irrigation water were considered.
This study used the presence or lack of cash crops (e.g., vegetables, cereals, etc.) or animals as a proxy for capturing the financial potential of farm households. The availability/lack of a certain minimum level of financial resources determines the household’s ability to purchase and use different productivity-enhancing factors of production (e.g., certified seeds of improved varieties, chemical fertilizers or labour).
  • Criteria that account for production goals
These factors include the household’s choice of activity (crops vs. livestock) and portfolio (e.g., among crops, choice of cereals, and/or legumes and/or vegetables). Another important factor in this category is the orientation of agricultural production (market vs. subsistence). Farm households in drylands may produce either to meet their subsistence consumption needs or for the market to raise the much needed cash income. The market orientation of farm households often depends on the quantity and type of products that they need for their consumption, which in turn depends on several factors including household size and food habits [34].
  • Criteria that account for levels of production intensification
The first two structural criteria can have a considerable impact on farm household decisions concerning the types and quantities of factors of production, which may be environmentally friendly (such as labour, manure, zero-tillage, etc.) or environmentally detrimental such as high doses of chemical fertilizers, irrigation water and repeated tillage [35].
A total of 23 variables (see Table 1) that fall into one or more of the above three criteria were used for characterizing the farm households in the study area. Two multivariate statistical techniques, namely principal component analysis (PCA) and hierarchical ascendant classification (HAC) [34,36], were used to establish a household typology. The first step in this effort was to follow [37] and apply PCA to linearly transform the original set of variables into a substantially smaller set of uncorrelated variables that represent most of the information in the original set. As suggested by Alvarez et al. [38] and Hammond et al. [39], variables were dropped from further analysis if they were strongly correlated with another variable on all principle components or if they showed little correlation with any principle components. Two correlation axes were established using the Kaiser criterion, which involves the choice of axes (the Eigen values which are higher than 1) and accounts for a substantial proportion of the total variation. This means that the sum of the inertia (variation) explained by each of the axes should account for a significant part of the total inertia. The number of clusters (number of farm household types) retained is set to a fixed number, as suggested by using the K-means clustering method [40], which partitioned farms into the clusters with the nearest mean.
Once distinct household farm types were established, the impact of the production decisions made in each type on the sustainability of the system in terms of productivity, resource-use efficiency, agro-biodiversity and household consumption were analysed.

2.3. Assessment of Sustainability-Related Indicators

The main objective here is to define and compare sustainability-related indicators for different domains and farm types. The selected indicators are intended to identify as many dimensions of sustainable farm analysis as possible in dryland areas as suggested by Robinson et al. [7].

2.3.1. Farm Income as an Economic Indicator

The indicator retained was the gross margin per farm. It was calculated as the value of total production sold minus production costs. In the total production we did not take into account the quantities kept for self-consumption, nor off-farm income. The production costs included family and hired labour (dh/day), the costs of nitrogen fertilization (dh/ha) and phytosanitary use (dh/ha), the cost of mechanization (dh/ha, this includes the cost of renting machines and fuel cost) and the cost of seeds (dh/ha).

2.3.2. Self-Consumption as a Nutritional Indicator

For each household, the production quantities consumed per household and per capita were specified using the farm survey. These quantities are specified for each product in terms of quantity and calories. The number of calories per product is extracted from United States Department of Agriculture (USDA) [41], Calories [42] and Fatsecret [43].

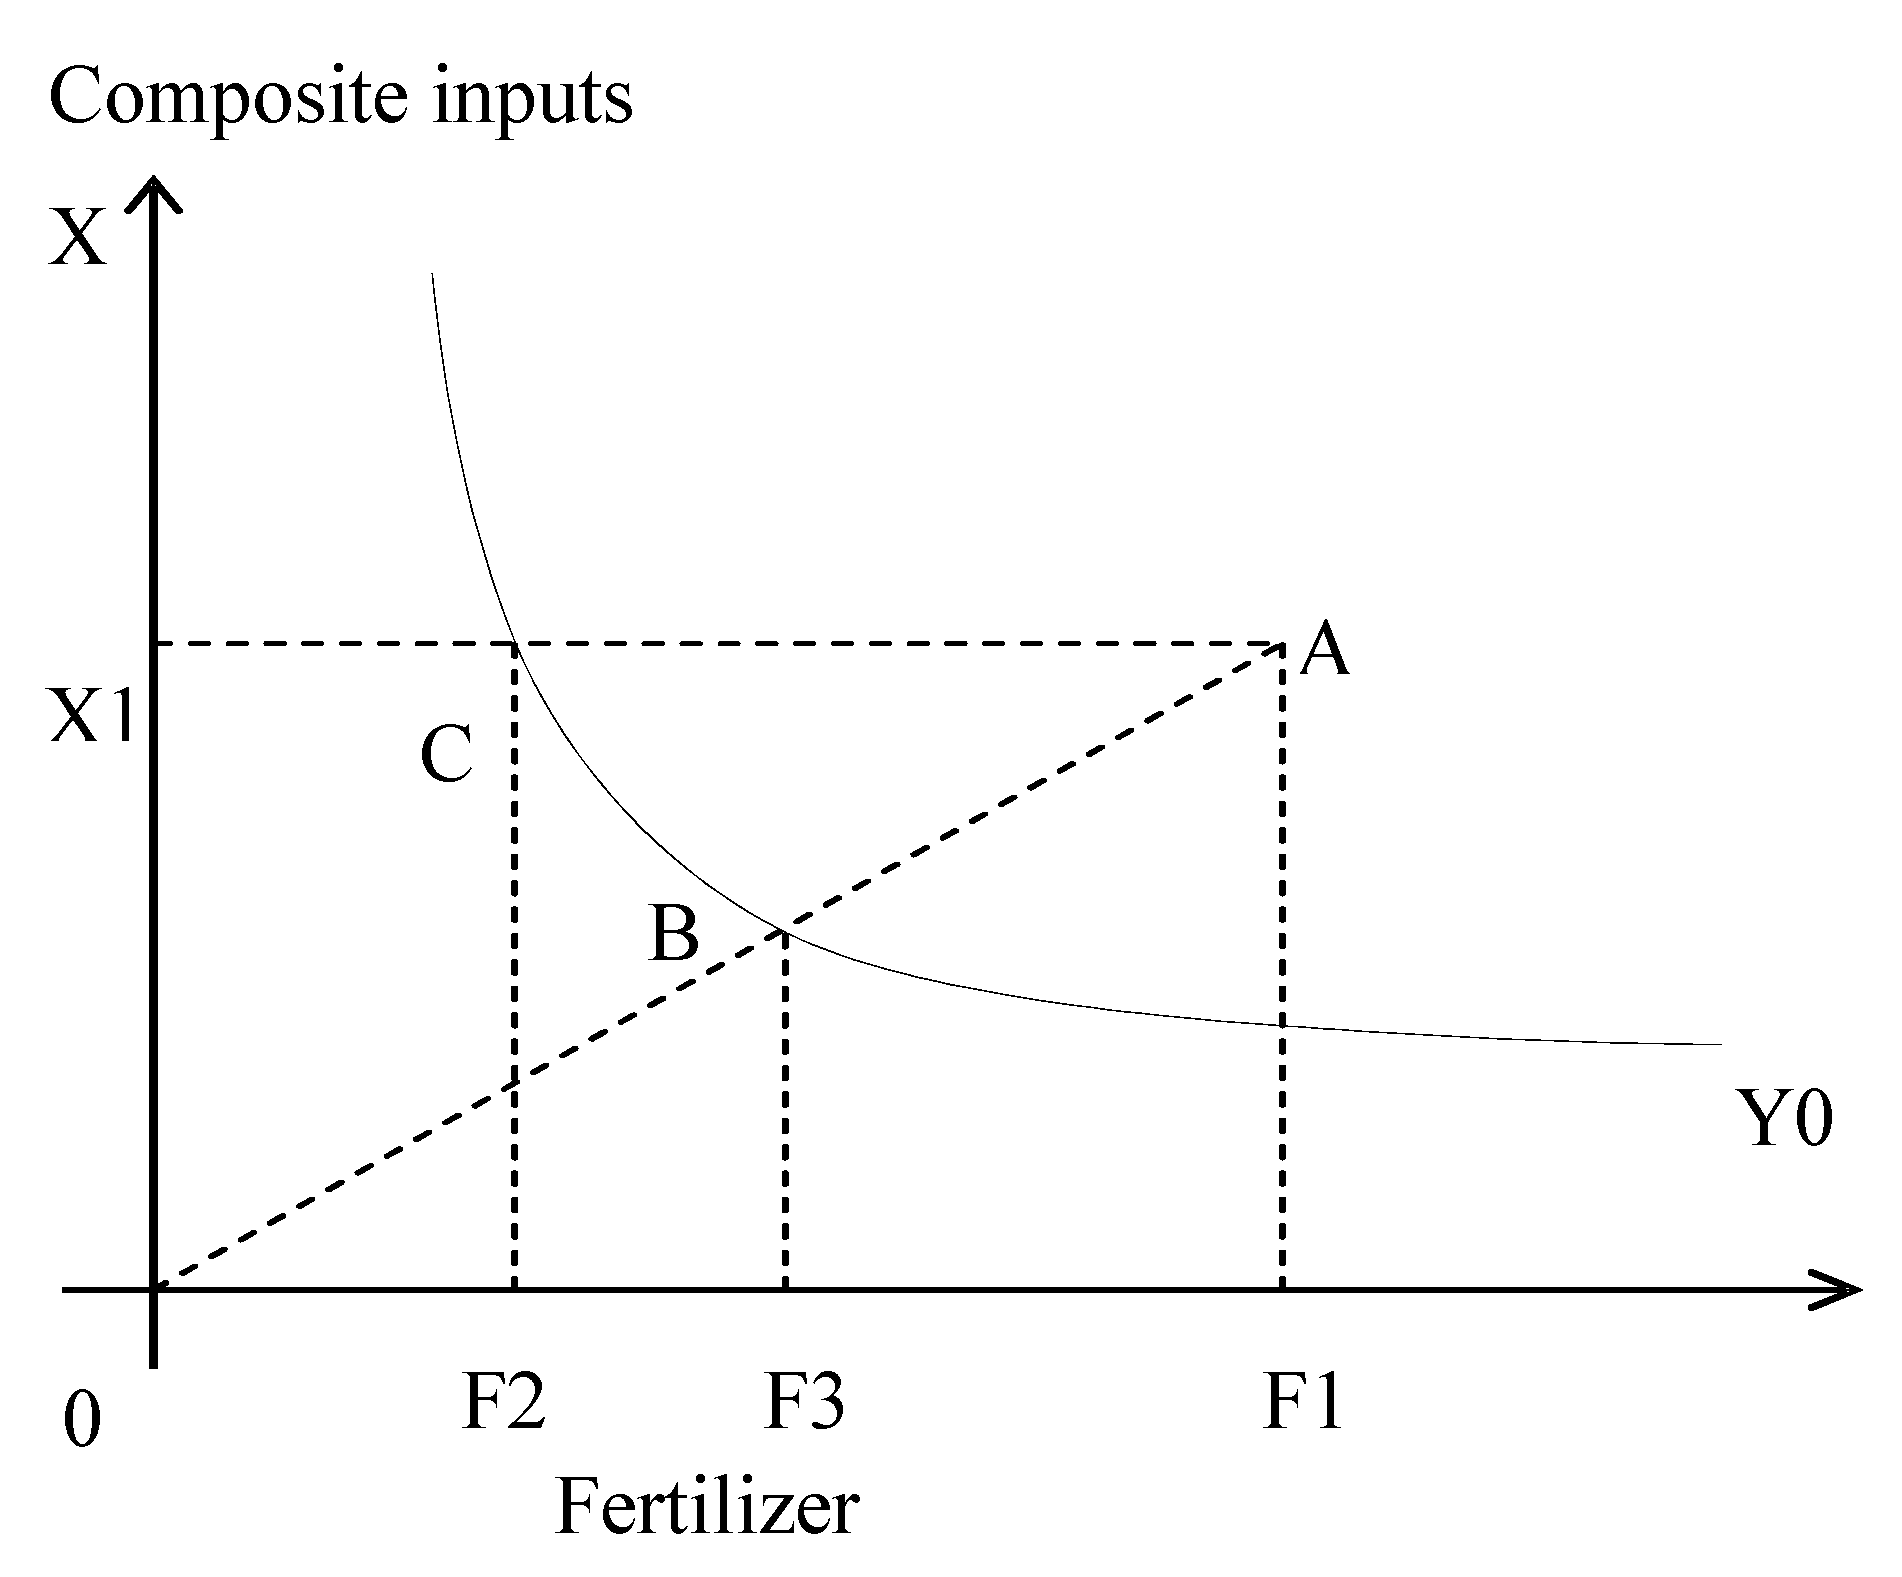
2.3.3. Technical Efficiency as an Input-Use Performance Indicator

Technical efficiency (TE) is defined as the performance of a given farm relative to similar farms operating on the isoquant curve or on the production-possibility frontier (PPF) by using existing technology [44]. Farms on the isoquant curve are those which produce the highest output from the same amount of inputs or conversely farms producing the same quantity of output using the least amount of inputs [45]. TE indices take values between 0 and 1 where the most efficient farms that produce on the PPF take a value of 1 and the most inefficient farms take values close to 0 [46]. Depending on the objective, TE can be assessed either at plot or farm level; it can consider specific inputs or all the inputs as a whole [47]. It is more revealing to have a measure of input-specific technical efficiency if the objective is to characterize a production system for the purpose of introducing mitigation measures. Therefore, following Yigezu et al. [47], this study has computed technical efficiency (composite technical efficiency) and input specific technical efficiency in terms of their use of irrigation water (water technical efficiency), nitrogen fertilizers (nitrogen technical efficiency) and labour (labour technical efficiency) (see Appendix A for technical details).

2.3.4. Agro-Biodiversity as an Environmental Indicator

The Shannon-Wiener index [48] was used to quantify agro-biodiversity. This index provides a measure of the extent of agro-biodiversity which depends on the number and distribution of biological elements contained in an ecosystem. The Shannon-Wiener index determines the wealth of species by their relative abundance and thus provides a measure not only of the variety but also of the uniformity of distribution of species. Following Torres [48], the Shannon-Wiener index indicator can be calculated as
H = i = 1 S p i l o g 2 p ( i )
with
p   ( i ) = n i S
  • H: Shannon-Winner agro-biodiversity index,
  • i: subscript for number of species,
  • ni: number of occurrences of cultivated crop i on the farm,
  • S: total number of occurrences of all crops found on the farm (also known as the specific wealth),
  • Pi: proportion of crop i on the farm in relation to S.

3. Results and Discussion

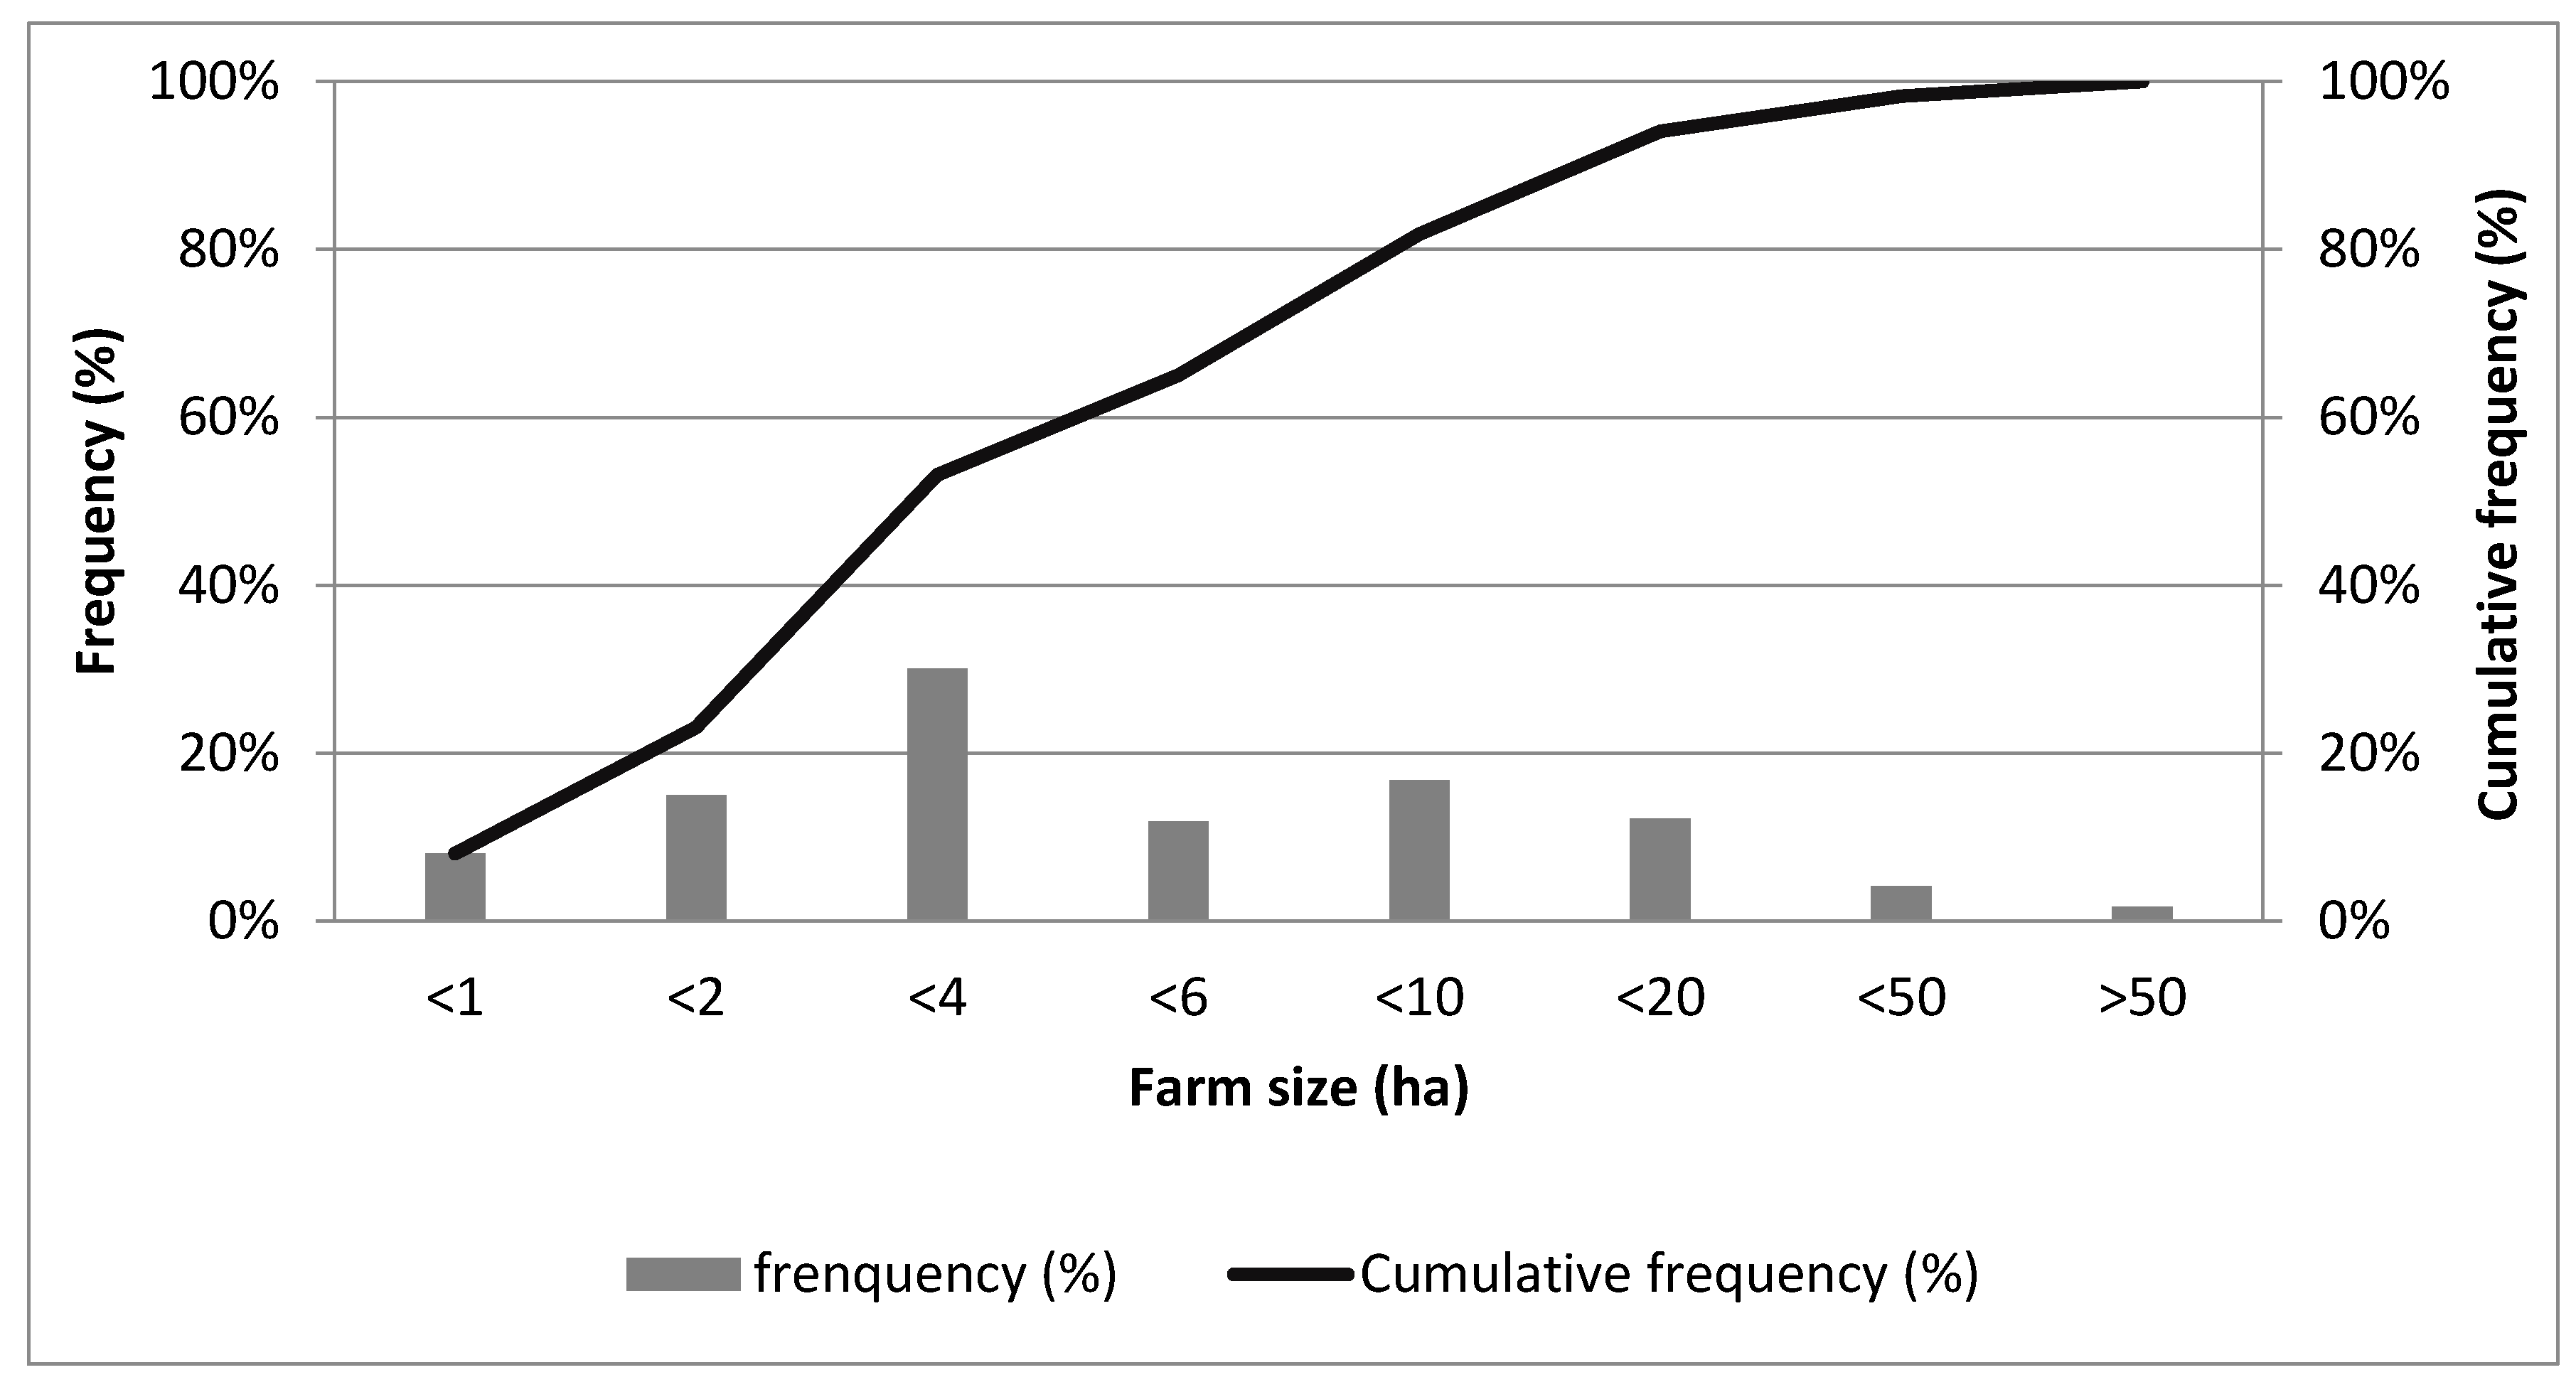
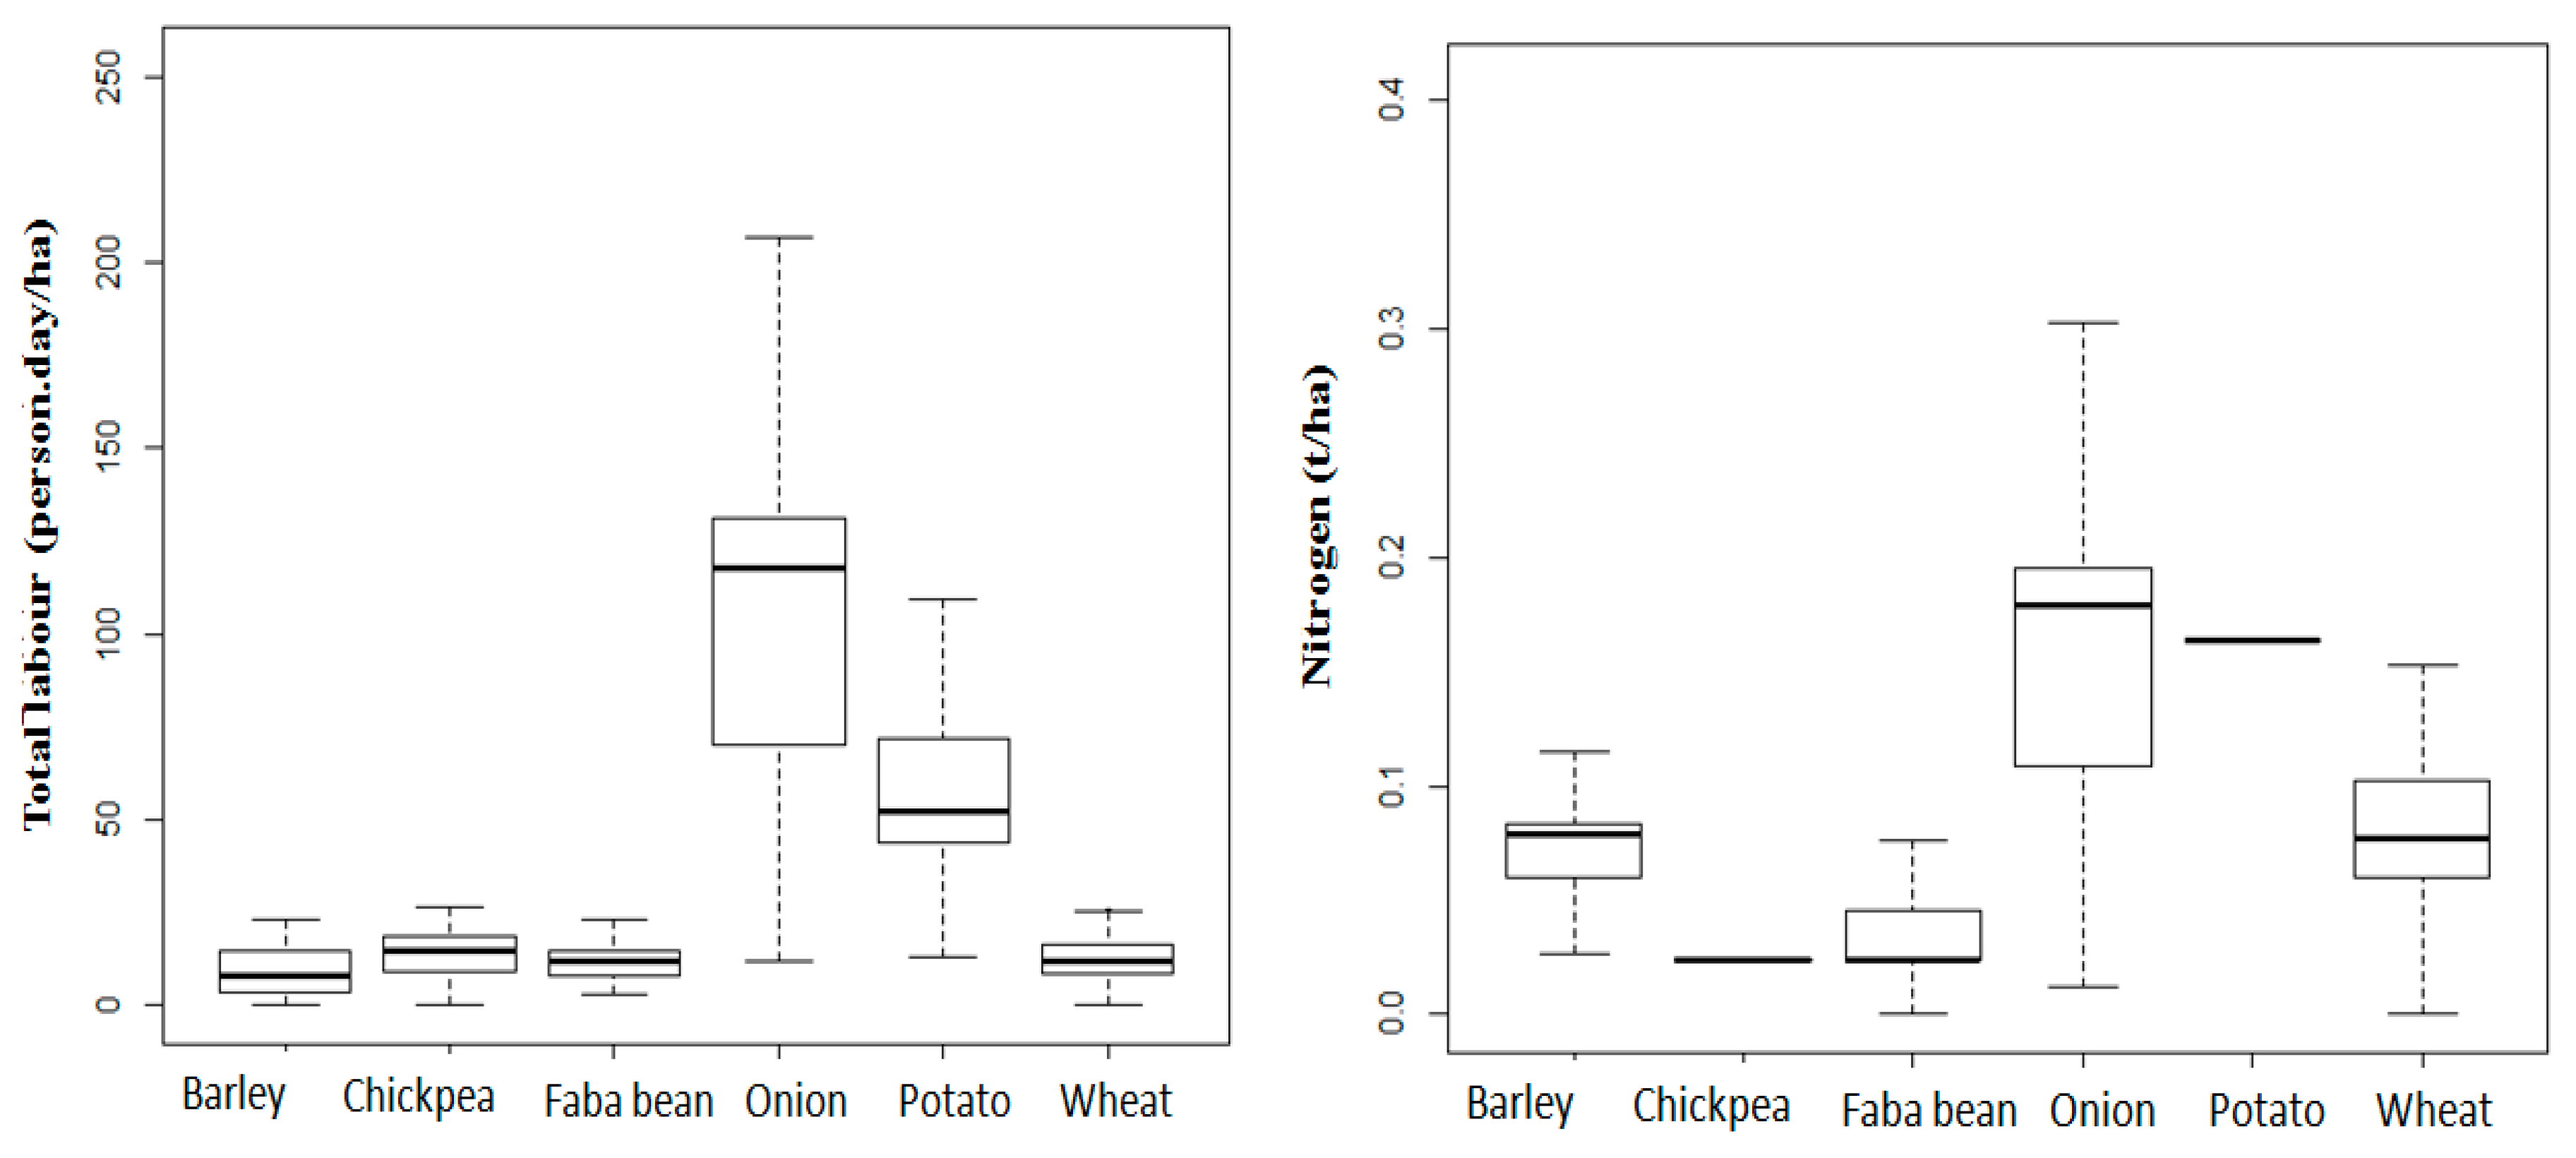
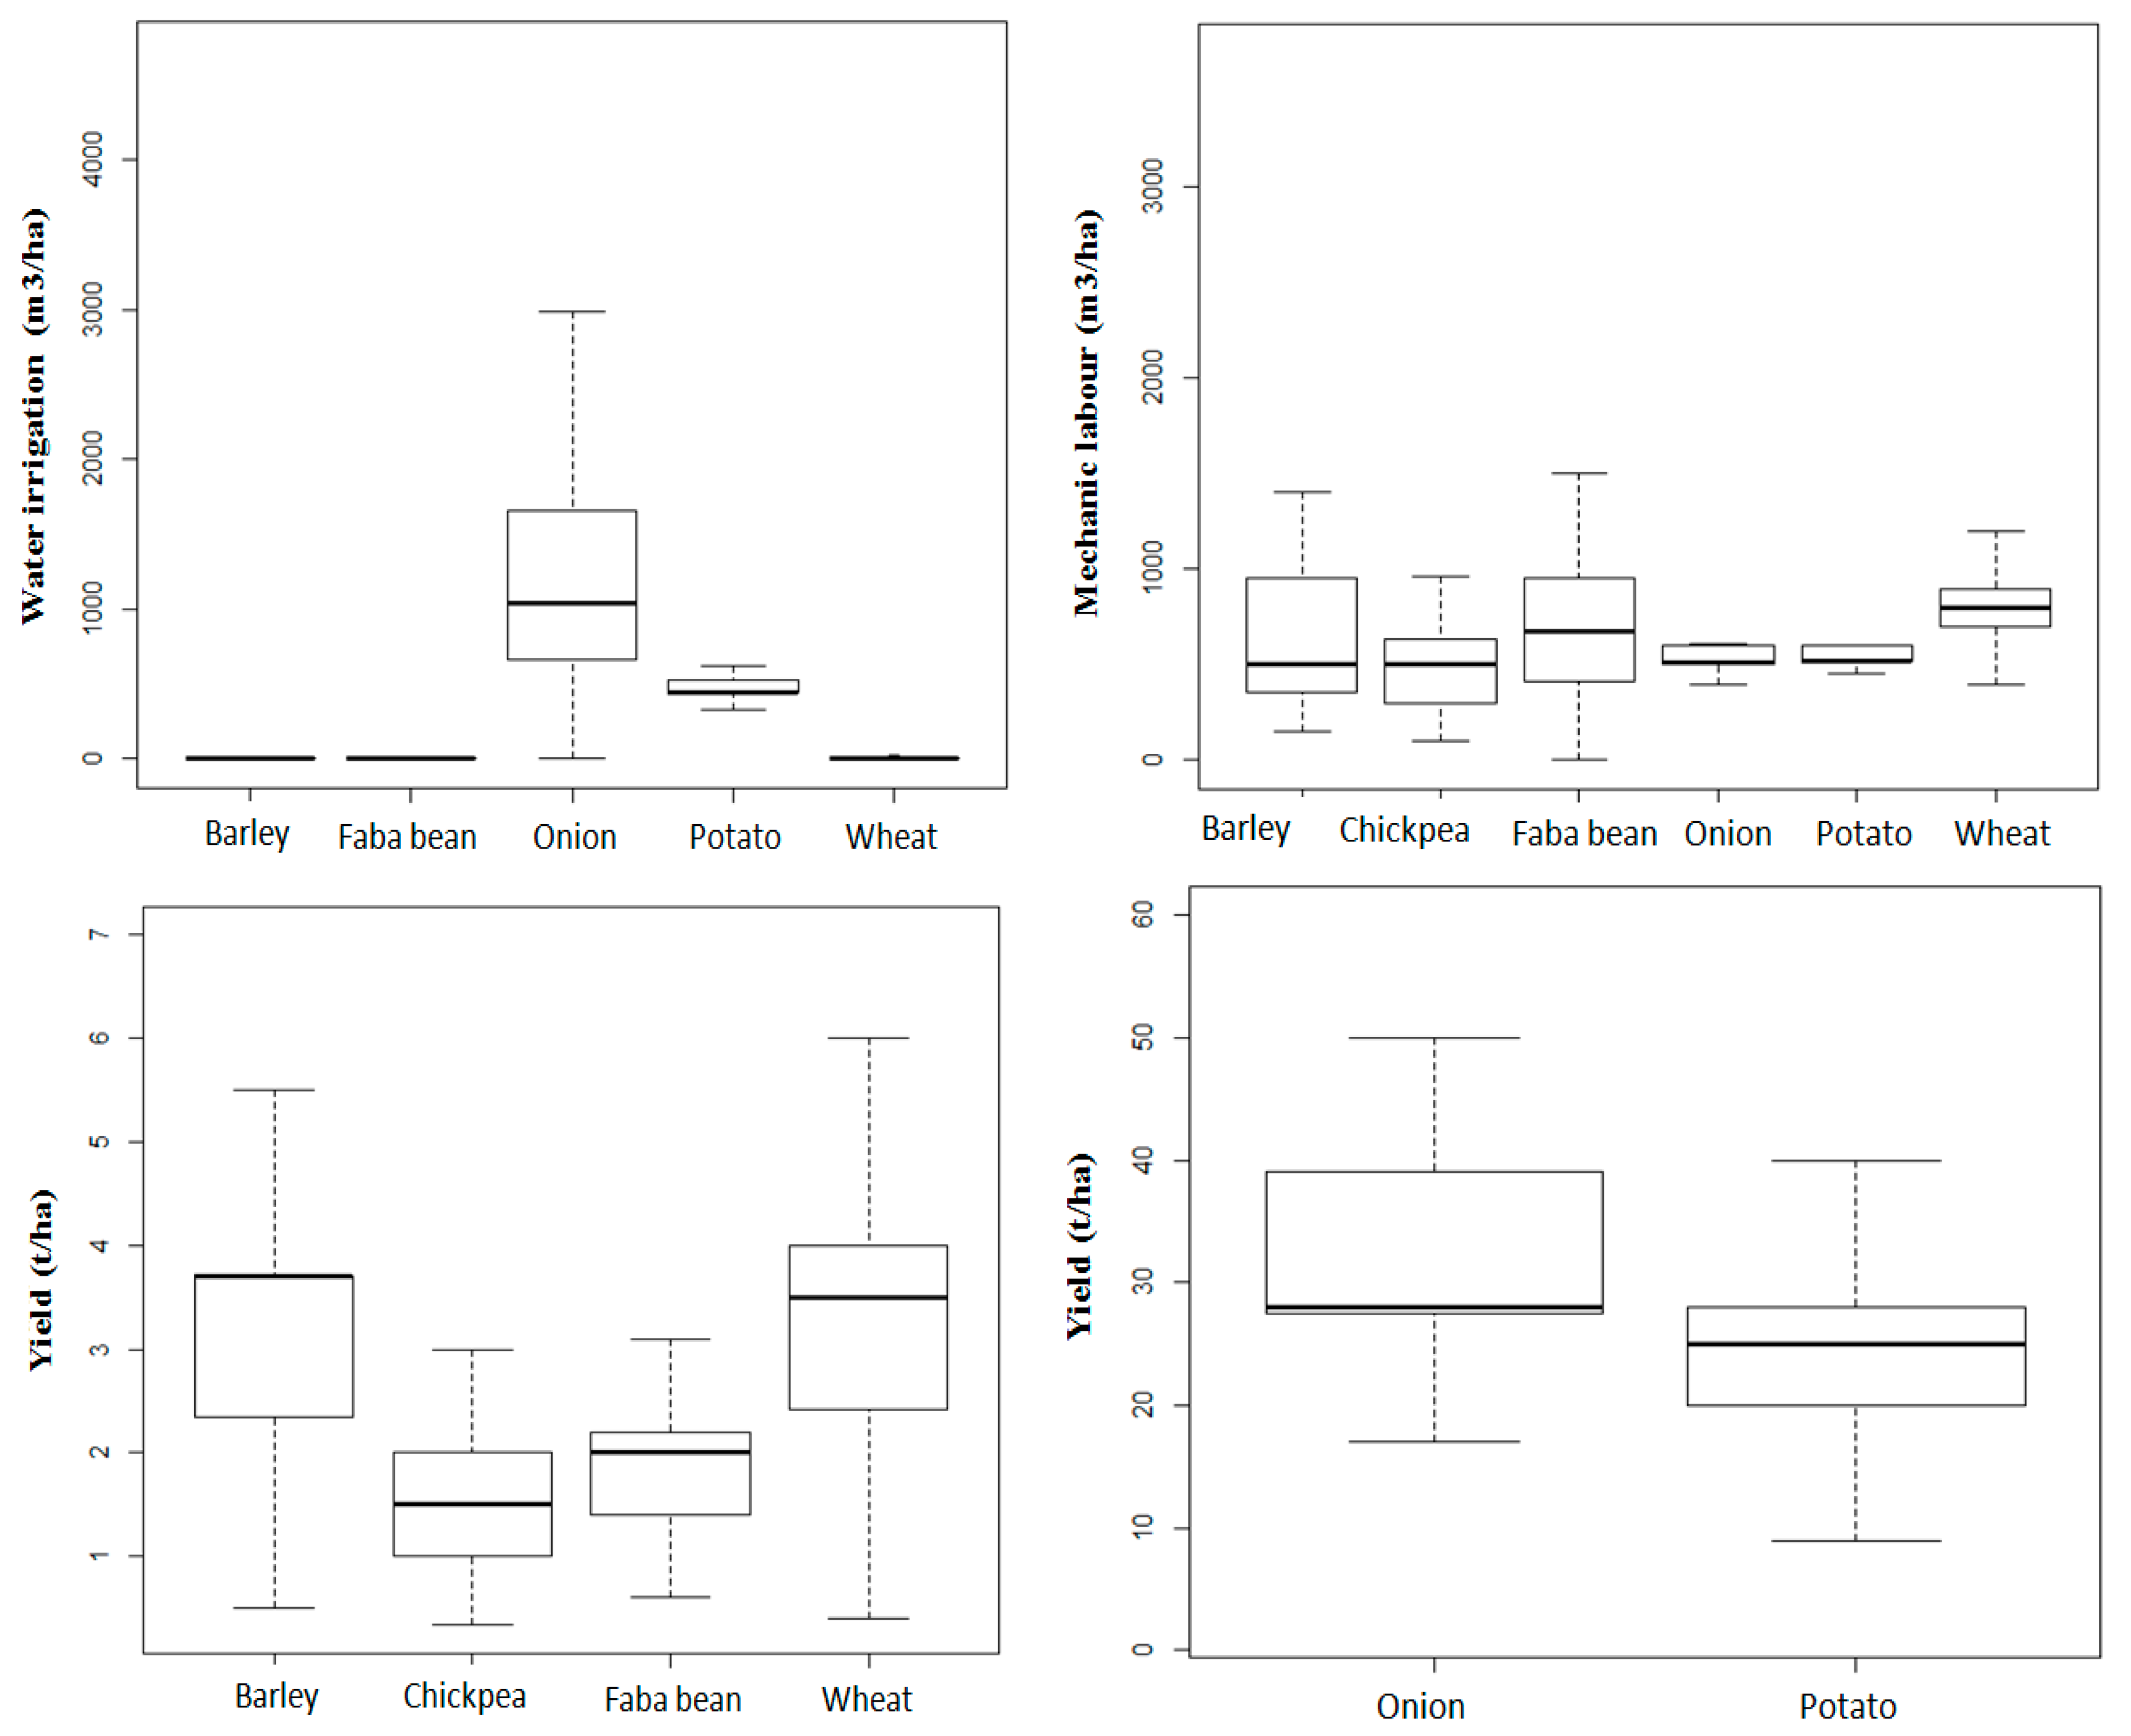
3.1. Description of the Farming and Cropping Systems in the Study Area

By analyzing the data from the surveyed 286 cereal-producing farm households as described in Section 2.1, the average land holding in the study area was 6.7 ha per household but presented high variability (Figure 2). The frequency analysis showed that more than 80% of the farms had a surface area of less than 10 ha, with 53% having less than 4 ha (Figure 2). Furthermore, only about 2% of farm households (except rangelands) had large holdings of more than 50 ha—a common pattern in dryland countries such as Tunisia [49], Algeria [50] and Egypt [51]. Similar variability was also observed in household size, which varied greatly, ranging between 1 and 27 members per family.
There were also substantial differences in farm income across the different farm households. For some farm households, gross margin from crop production was well over 43,767 dh/ha, while it was as low as 44 dh/ha for others (Table 2).
Comparison of per-capita self-consumption per product type shows that some farms were completely market-oriented (with no consumption from their own production), whereas most of them consumed at least a part of their production.
There was also considerable variability for each crop and among crops in both the average and median values of the quantities of labour, irrigation water and nitrogen fertilizer used and yields observed (Figure 3). This demonstrates the wide diversity of crop production practices in the Saïss plain. The highest amounts of nitrogen and irrigation water applications were observed for vegetables. For example, the median amounts of irrigation water, nitrogen and labour applied to grow onion were 1037 m3/ha, 180 kg/ha and 117 person-days/ha, respectively. The corresponding figures for wheat were only 0 m3/ha, 77 kg/ha and 13 person-days/h, respectively. Similar variabilities were observed for the yields of cereals and vegetables. For example, the median yields for wheat and onions were 3.5 t/ha and 28 t/ha with standard deviations of 1.4 t/ha and 13.6 t/ha, respectively (Figure 3).

3.2. Description of Distinctly Dominant Farm Households

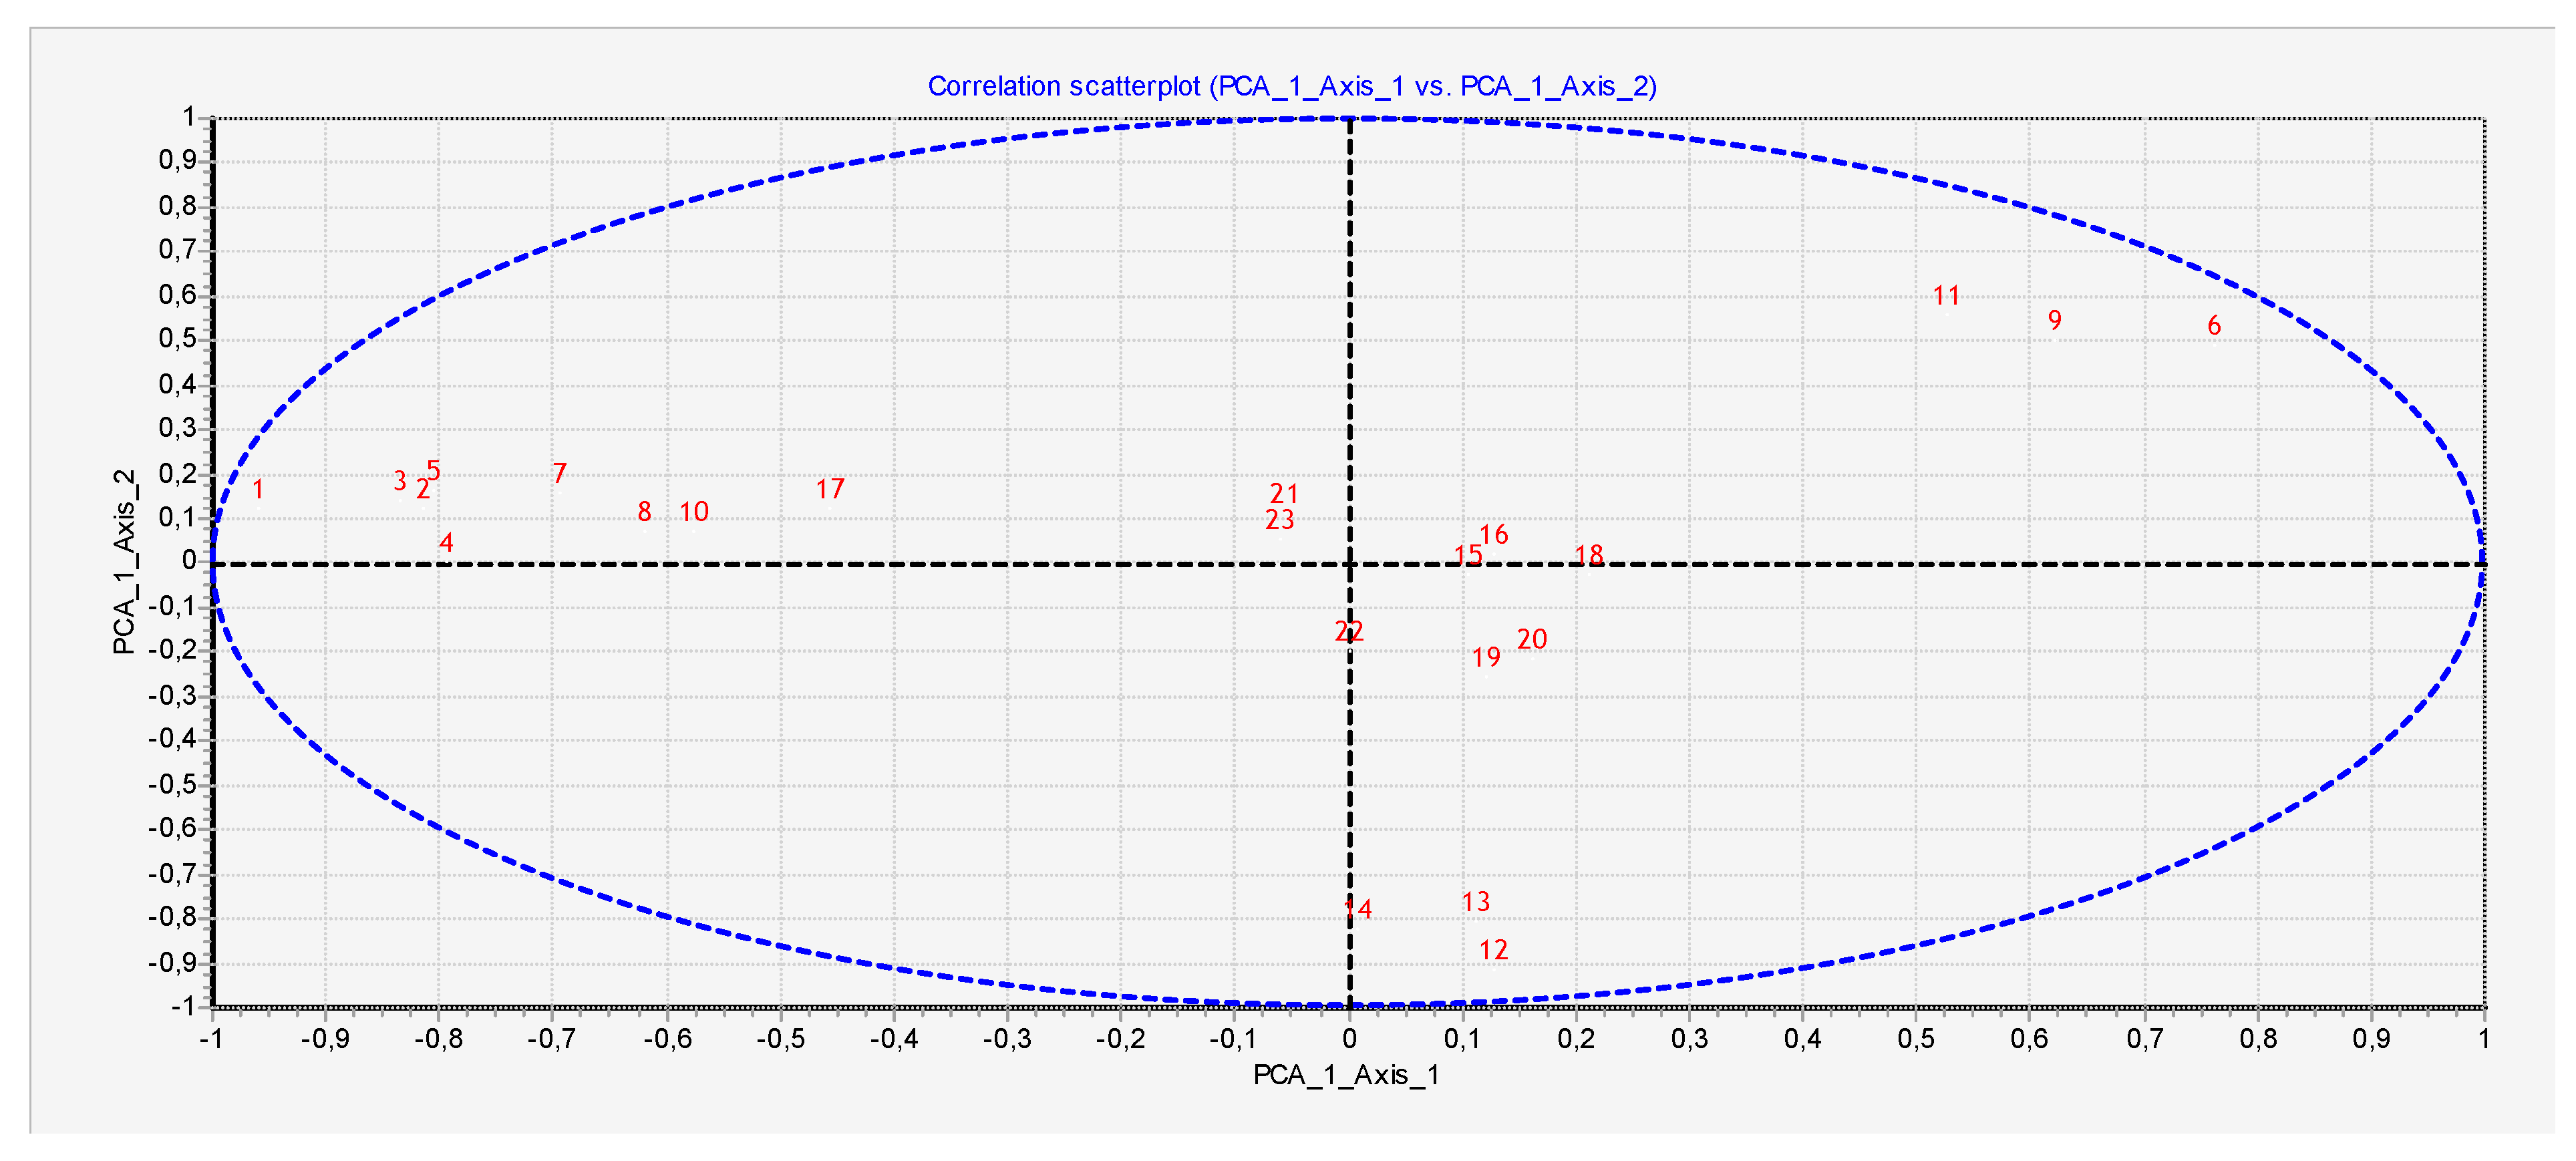
3.2.1. Farm Household Typology

The results of the PCA and the HAC revealed that the distribution of farm household classes as a function of the selected criteria (also called discriminant variables) represented by two correlation axes accounted for 42.01% of the total variability (Figure 4 and Table 3). Axis 1 (27.9%) was associated with vegetable production, the irrigated area and the amount of inputs supplied (labour, nitrogen fertilizer, irrigation water). This correlation confirms that market-oriented vegetable farms are the ones that use the most inputs. Axis 2 (14.10%) was associated with legumes, the sowing density and their share in the total amount of crops consumed from their own production.

3.2.2. Identification of Distinct Farm Household Types

Based on the statistical analyses conducted using PCA and HAC, three distinct farm household types were identified. They were established in such a way that they may be homogeneous within the classes which have the same characteristics with respect to the variables (criteria) selected for establishing typology as described in Section 2.2. Accordingly, the farm household types identified were (1) intensive predominantly-vegetable farming households, (2) semi-intensive cereal mono-crop farming households and (3) extensive mixed cereal and legume farming households (Table 4). Description of each of the farm household types is provided below.
  • Intensive predominantly-vegetable farming households
Intensive predominantly-vegetable farming households (farm household type 1) included farms which predominantly produced onions and potatoes with high input intensities (Table 4). These households applied 143 kg/ha of nitrogen fertilizer, 577 m³/ha of irrigation water and 55.6 days of labour per hectare on average, which led to average potato and onion yields of 25.4t and 33.2t per ha, respectively (Table 4 and Table 5). This category included farms with higher gross margins averaging 19,343 dh/ha and an average non-farming income of 3,996 dh/month (Table 4). These households produced mainly for the market as 91% of total production was marketed, while the remaining 9% was used for self-consumption (data not shown). Among this class of farm households, vegetables accounted for 70% of total food energy intake derived from their own production. Even though cereals took up only 11% of the total arable land area of the farm, 26% of the total energy intake from self-consumption came from cereals (Table 4).
  • Semi-intensive cereal mono-crop farming households
Semi-intensive cereal mono-crop farming households (Farm type 2) included farm households which mainly cultivated cereal crops (soft wheat and barley). These households were characterized by a medium intensity of application of nitrogen fertilizer and labour at 83 kg and 15.09 person-days per hectare respectively, with a low (41 m³ per hectare) application of irrigation water leading to average soft wheat and barley yields of 3.4t and 2.9t per ha and gross margins of 7,378 dh/ha (Table 4 and Table 5). These households produced mainly for the market where 86% of total production was marketed, while the remaining 14% was used for own consumption (data not shown). For type 2 households, consumption from their own production of cereals constituted about 61% of the total energy provided from self-consumption (Table 4).
  • Extensive mixed cereal-legume farming households
Extensive mixed cereal-legume farming households (Farm household typology 3) mostly cultivated cereal crops (barley and soft wheat) combined with legume crops (chickpea and broad bean), with minimum inputs of 60 kg of nitrogen, 6 m³ of irrigation water and 11 days of manual labour per ha leading to average soft wheat and barley yields of 3.3t and 3.4t per ha and gross margins of about 6,491 dh/ha (Table 4 and Table 5). These households produced mainly for the market where 79% of total production was marketed, while the remaining 21% was consumed at home (data not shown). The cereals and legumes consumed from their own production constituted about 73% and 25% of the total household energy intake from self-consumption respectively (Table 4).

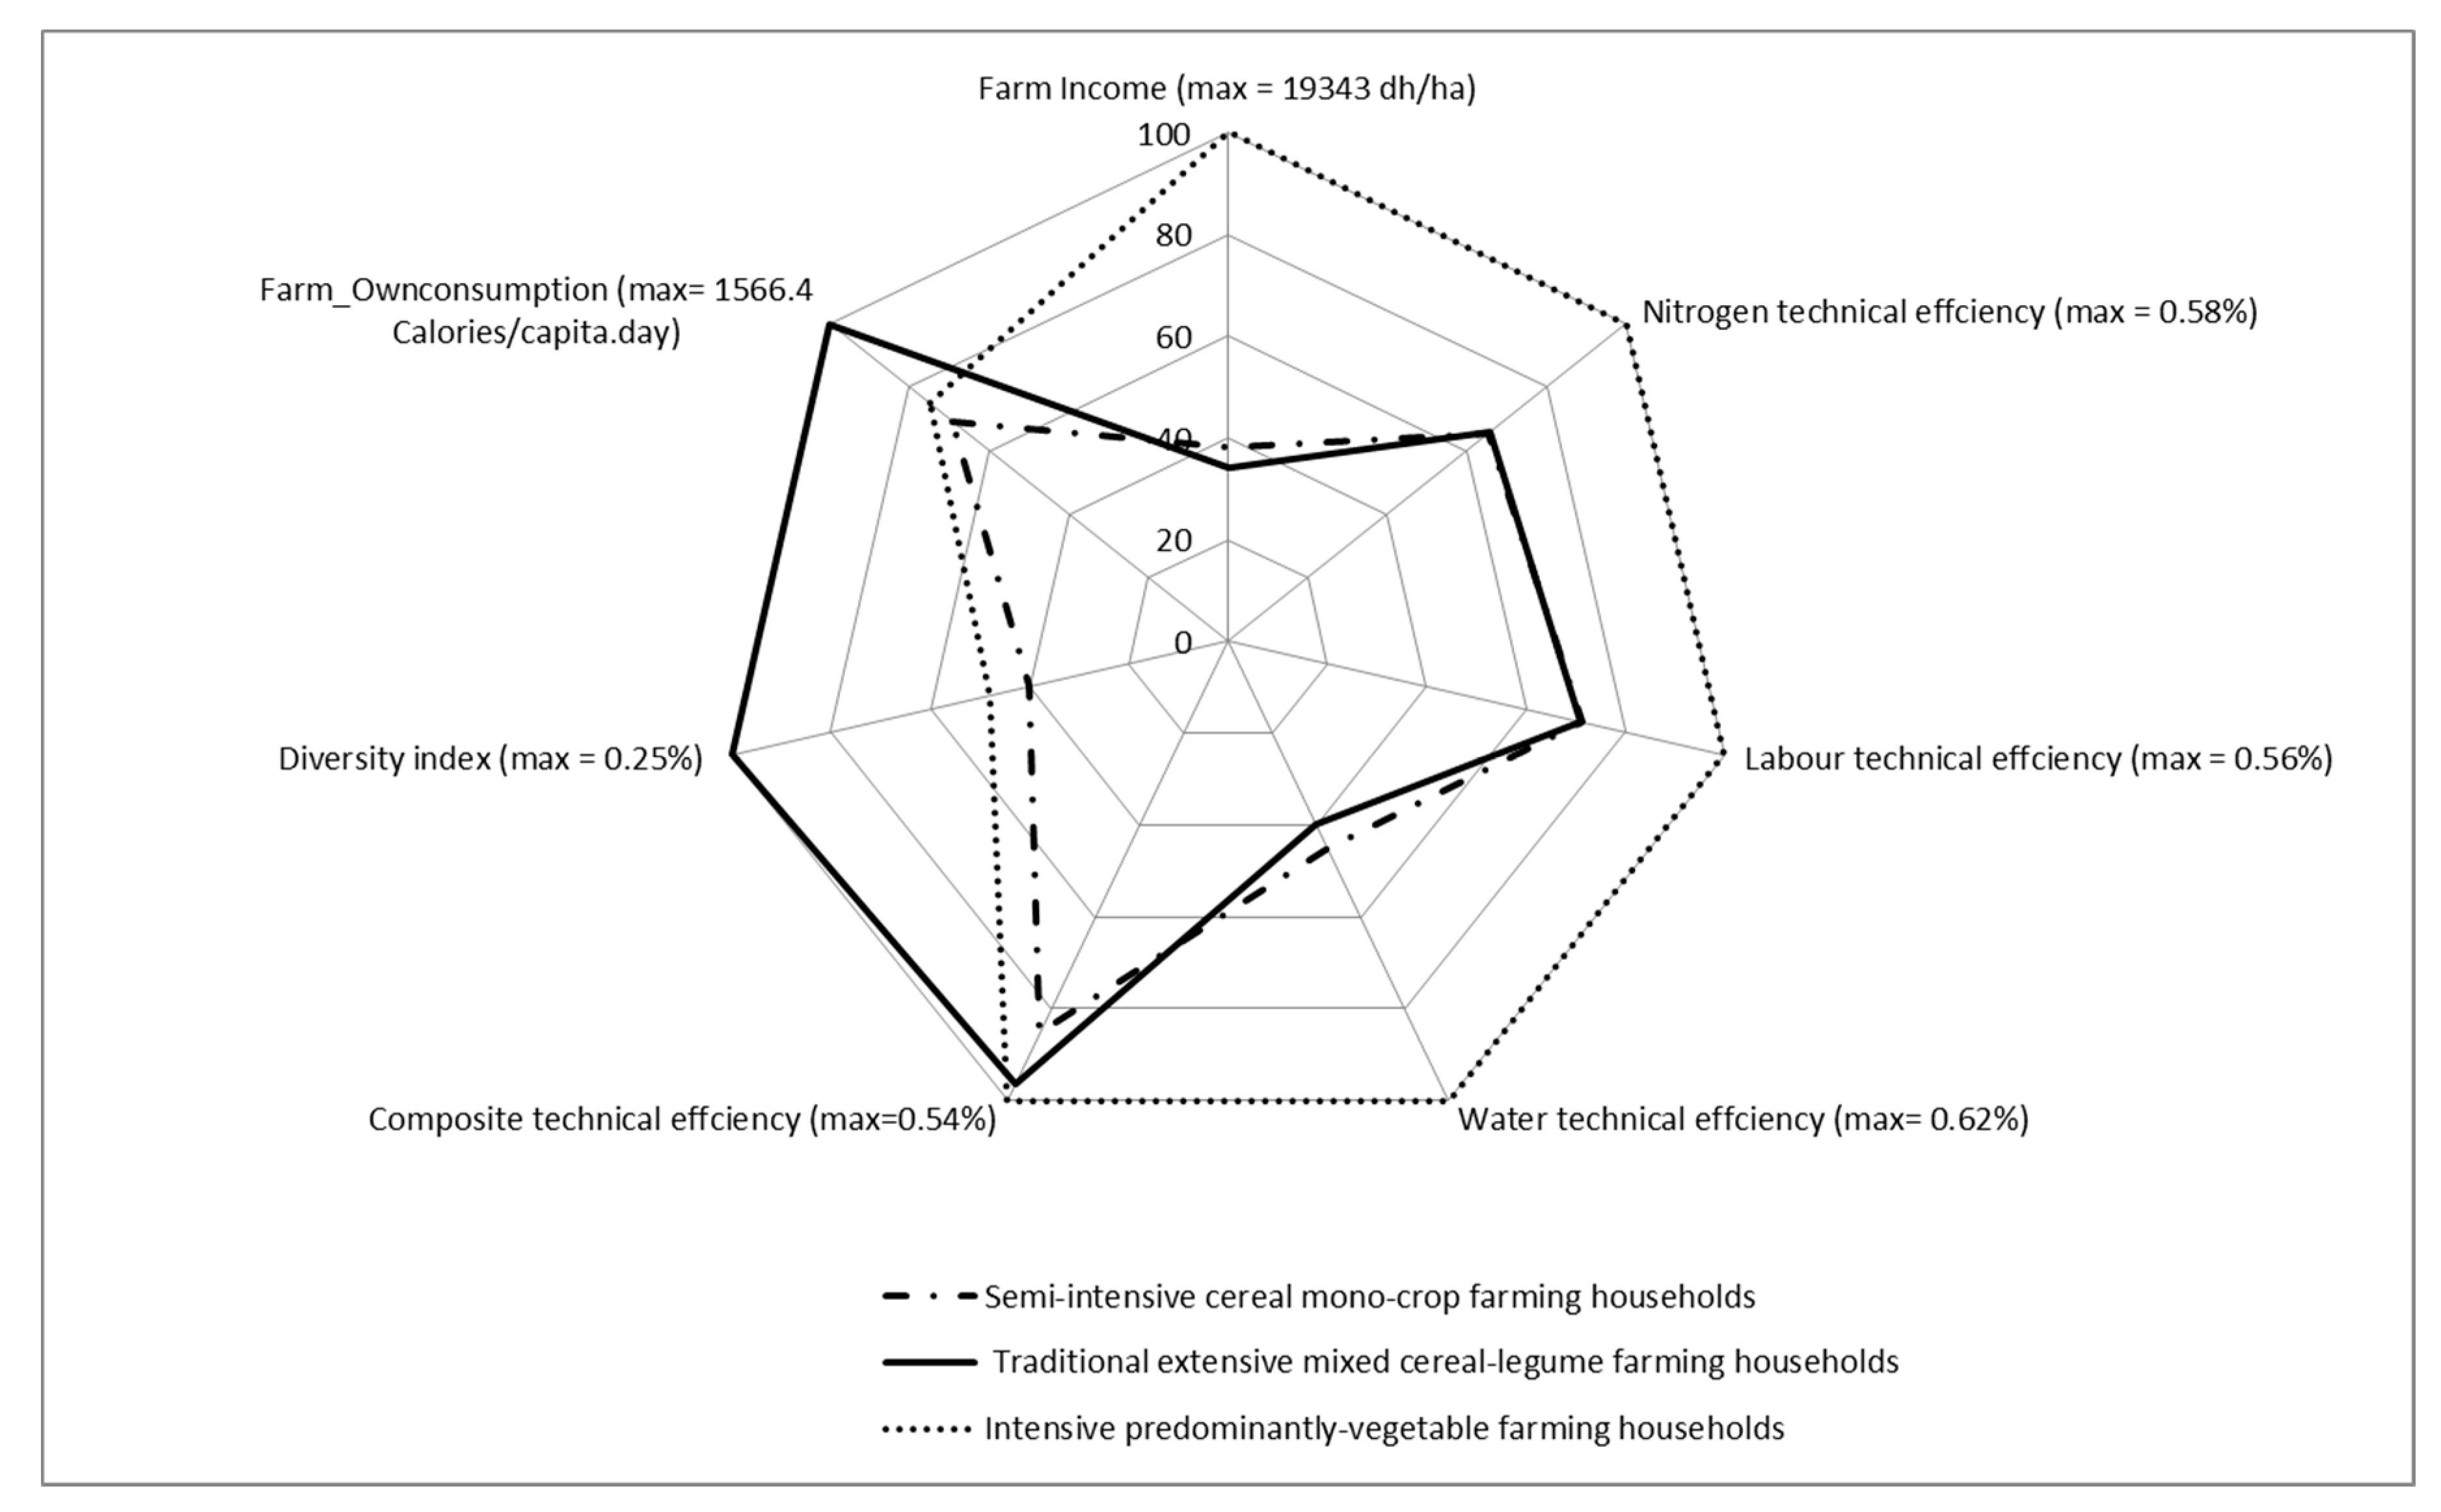
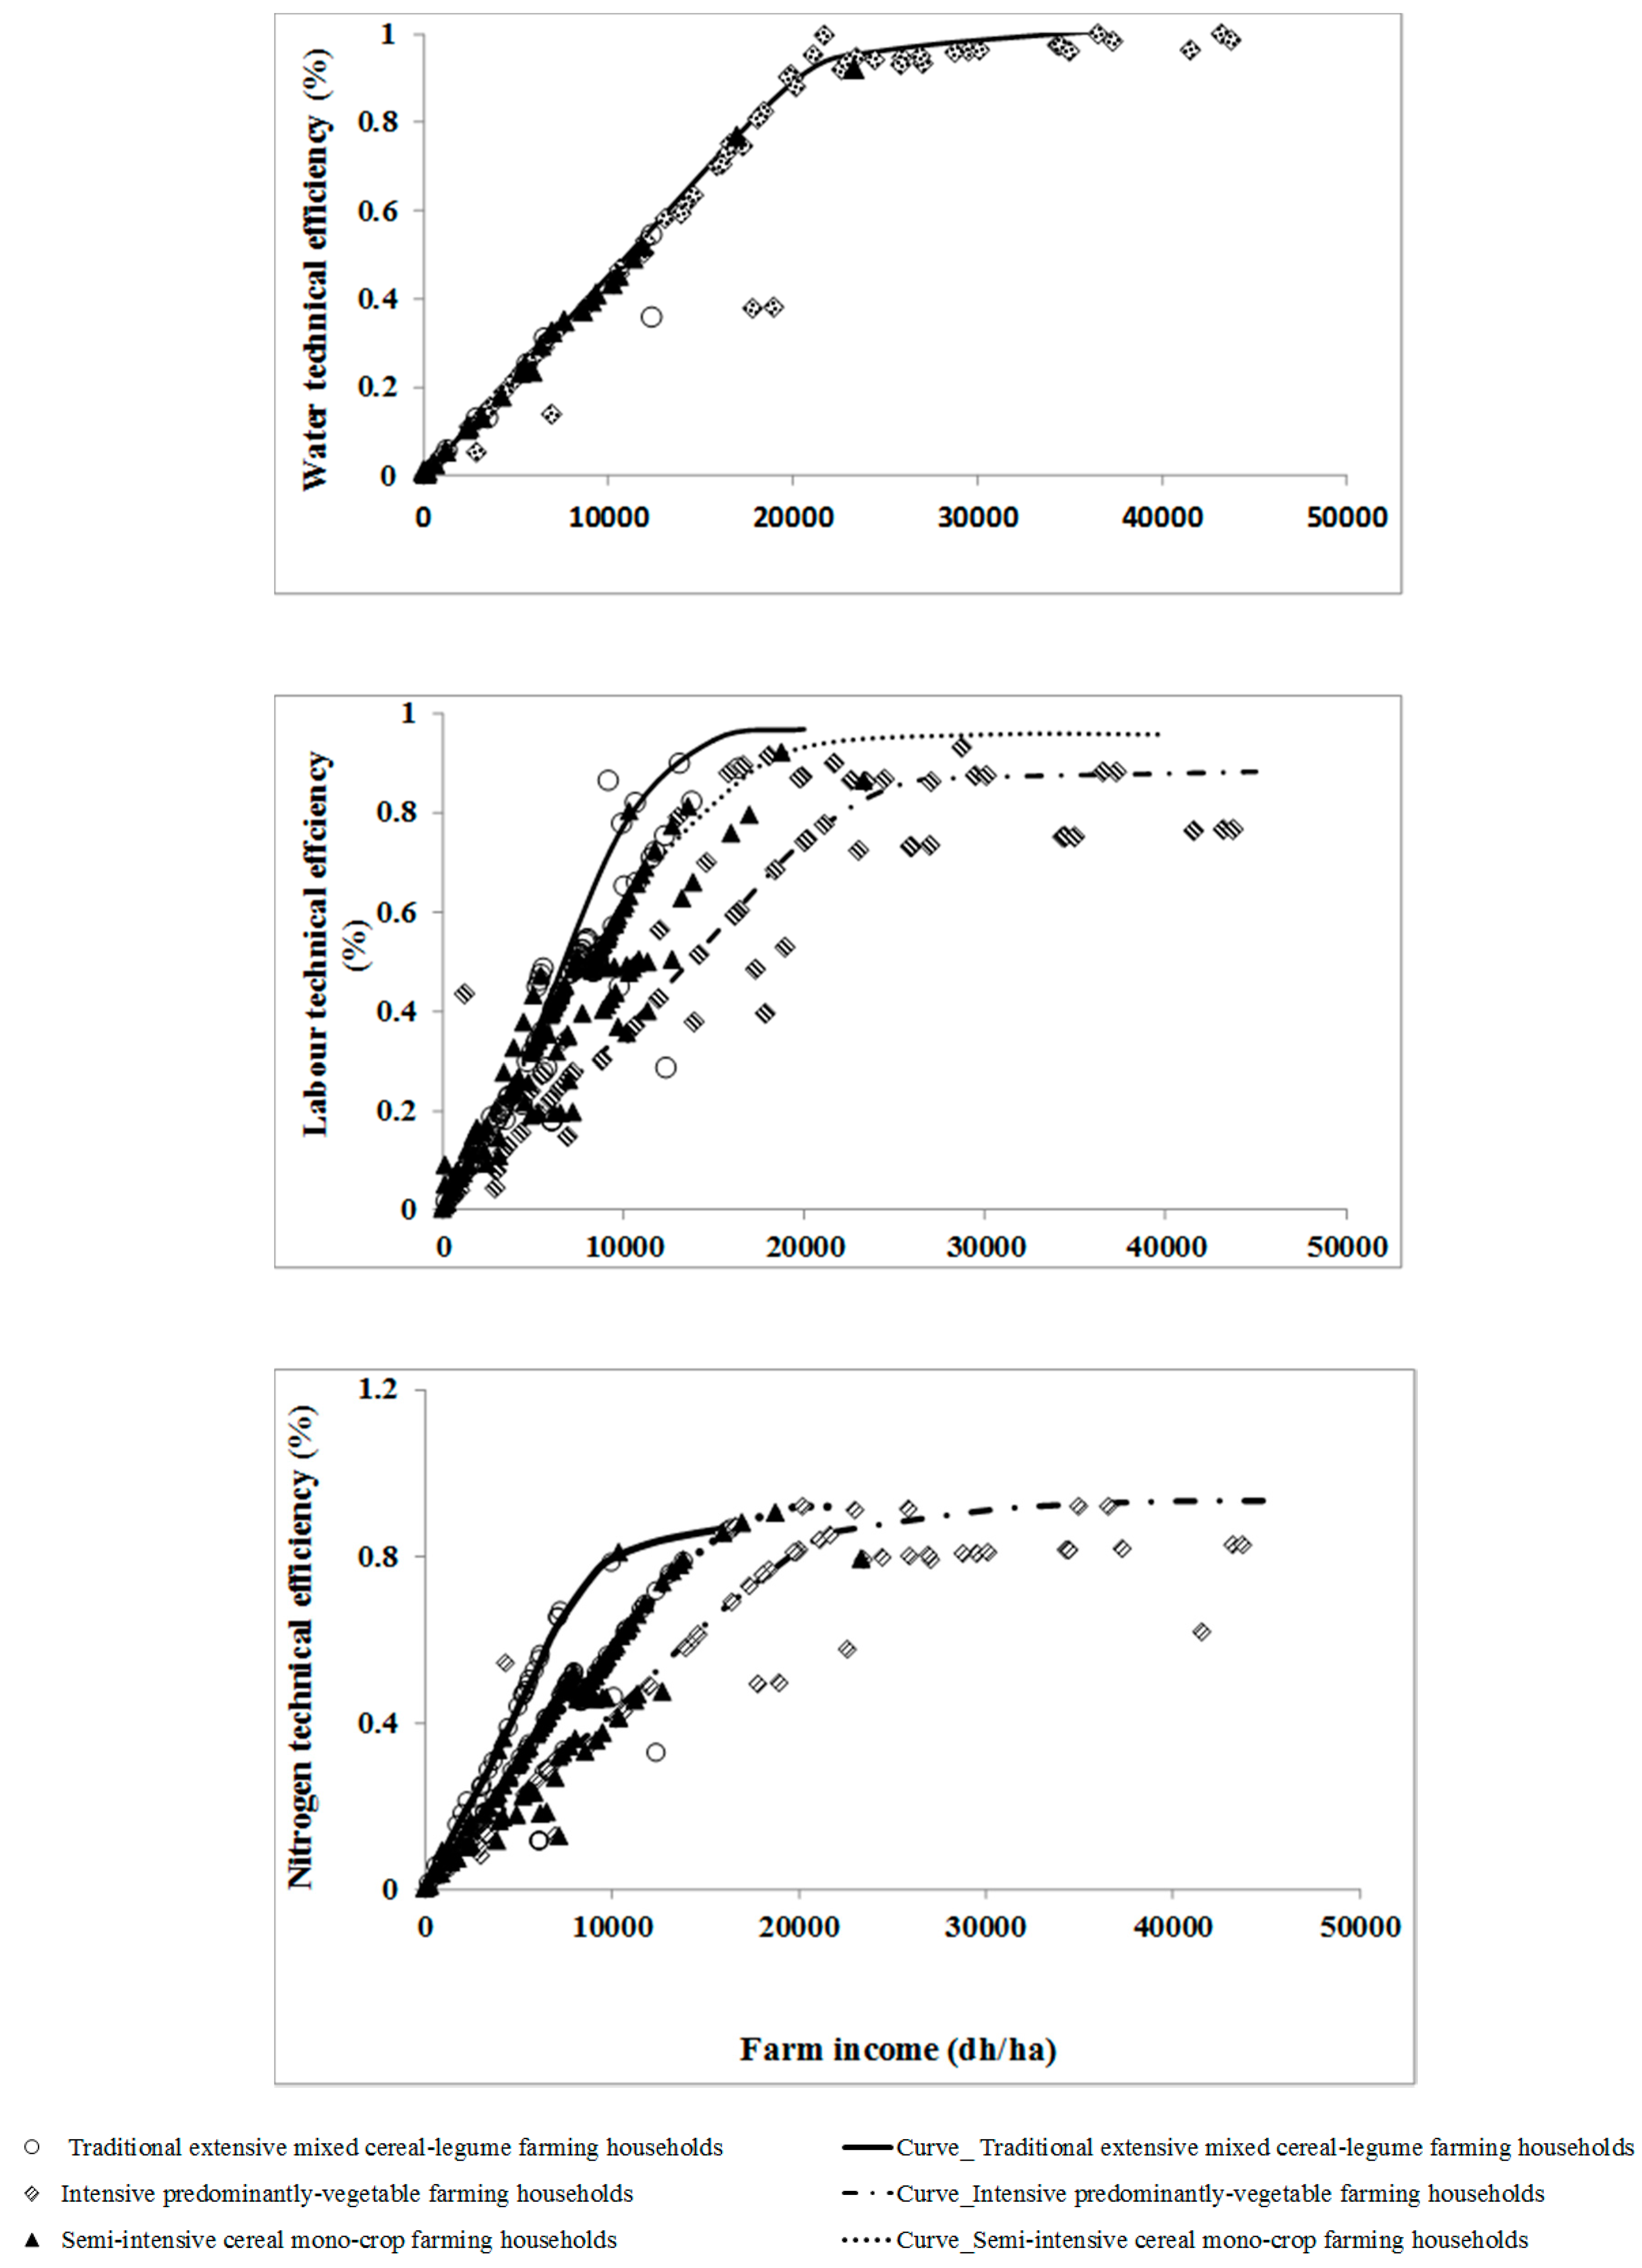
3.3. Sustainability-Related Indicator Trade-Off Analysis

On average, intensive predominantly-vegetable farming households that mainly cultivate vegetables for the market (type 1) were the most profitable, obtaining 19,343 dh/ha as a gross margin farm income (Figure 5). However, these high profits came at the cost of high input intensities, which altogether cost 9,415 dh/ha on average (data not shown). Moreover, these type of farm households exhibited a low crop diversity index of 0.12. Their composite technical efficiency was 0.54, while specific technical efficiencies for irrigation water, fertilizer and labour were 0.62, 0.58 and 0.56, respectively (Figure 5).
Semi-intensive cereal farming households which cultivate only cereals (type 2) had an average farm income of 7378 dh/ha, which was much lower than type 1., and were also characterized by much lower input intensities as measured by the total cost of inputs of 3000 dh/ha (data not shown). They had a diversity index of 0.1, which was less than that of type 1 households. The composite technical efficiency of type 2 was 0.46, which was lower than type 1 farm households. The input specific technical efficiencies for irrigation water, fertilizer and labour for type 2 were 0.28, 0.38 and 0.4, respectively (Figure 5).
Extensive cereal-legume farming households producing both cereals and legumes (type 3) had an average income and intensity of inputs of 6491 dh/ha (Figure 5) and 2344 dh/ha (data not shown), respectively, both of which were the lowest among all types. However, type 3 farm households had an average composite technical efficiency of 0.52 and diversity index of 0.25, which were both the highest among all household types (Figure 5).
Intensive predominantly-vegetable farming households that are engaged in intensive vegetable farming (type 1) are highly encouraged by public authorities today in Morocco, but also in several other regions in dryland areas [16]. It is true that these systems are more profitable, but the present analysis also shows that they are by far the highest water, labour and fertilizer resource users per unit area. In Morocco, a country in which resources such as irrigation water are fairly fragile and where the effects of climate change are expected to be high, these farm households may not be sustainable and resilient to possible climatic shocks and extreme weather conditions in the long run [5].
Intensive predominantly-vegetable farming households have two other important limits. The high cost of inputs is an important obstacle since most of the farmers in dryland areas generally have lower incomes than the national average. For example, in Morocco, the mean farming income is only a third of the national average income [33]. Therefore, resources from external agriculture are often needed to invest in intensive cropping systems and to overcome all of the limiting factors. Without government aid (for easier access to water or for purchasing inputs, particularly water, nitrogen fertilizer and pesticides), intensification can only be partial, which might explain why these systems are not very efficient (Figure 5). Likewise, as shown in Figure 5, production by intensive predominantly-vegetable farming households (type 1) and by cereal mono-crop semi-intensive farming households (type 2) is not highly diversified. In addition to environmental risks, this represents a threat to the diet of farm households, whose consumption from their own production is a non-negligible part of their total consumption. In fact, if we consider 2500 as a reference for calorie requirements per day and per person [52], the calories needing to be purchased for intensive predominantly-vegetable farming households and semi-intensive cereal farming households are 1125 and 1217 respectively. The purchased calorie needs for extensive cereal-legume farming households are only 738 calories per person/day.
Several experiments have shown that while the intensification of farming systems often increases farm income, it often leads to a deterioration in the diversity of food consumption. For example, Chenoune et al. [34], Komarek et al. [53] and Ferchiou [54] argue that with an increase in income due to intensification, farmers prefer, to a certain extent, to spend surplus farming cash to satisfy needs other than food.
Cereal monoculture systems (like cereal mono-cropping semi-intensive farming systems in type 2) have been promoted by various agricultural policies in Morocco (and more generally in dryland areas). While the rationale for their production is to reduce cereal food imports, such policies have often led to only a slight increase in intensification with little improvement in productivity. Cereal mono-cropping semi-intensive farming systems have evolved from extensive cereal-legume systems, leading to a slight increase in profitability and a 6% reduction in efficiency (Figure 5) as well as a reduction in agro-biodiversity. Many authors believe this is mainly due to a desire for intensified farming, which usually results in a specialization of cropping systems as compared to extensive mixed cereal-legume production systems, but without a corresponding increase in inputs (in particular water and nitrogen fertilizer) due to lack of resources [55]. In fact, the average production costs for semi-intensive cereal systems (type 2) and extensive mixed cereal-legume farming households (type 3) were comparable (3000 dh/ha and 2344 dh/ha respectively) (data not shown).
Figure 6 shows the variation of water, nitrogen and labour technical efficiencies in relation to the increase in farm income. This figure shows that up to gross margins of 20,000 dirhams/ha, the extensive mixed cereal-legume system (type 3) is more water-, nitrogen- and labour-efficient, followed by the cereal mono-cropping system (type 2) and then intensive predominantly-vegetable farming households (type 1). Therefore, for farms with an average revenue of less than the 20,000 dirham threshold, irrigation water, nitrogen use and labour efficiency considerations dictate that they should be primarily dedicated to the production of cereals and legumes, followed by vegetable crops, whereas farms with net margins above the threshold should be orientated towards the cultivation of vegetables.
This result is very important in relation to the current debate regarding the options to be promoted to both improve farmer income and preserve the environment. Indeed, two main intensification pathways are now being confronted: the return to more diversified systems with more legumes [56] and intensification with the simplification of rotations with a limited number of crops [57].
The present analysis shows that both strategies are to be considered simultaneously but are conditional on the current circumstances governing farms. Indeed, it is clear that up to a certain income, it is preferable to cultivate diversified systems (such as extensive mixed cereal-legume systems) that will, for the same income, be more efficient than current intensive predominantly-vegetable farming households (type 1). Beyond these thresholds and for high incomes, it is necessary not only to have systems based on vegetable crops, but also for the latter to be very efficient. These systems, unfortunately, remain in relatively small numbers (at least in the context of small farms in drylands), as they require significant amounts of knowledge and investment to be both cost-effective and efficient.

4. Conclusion

In the context of drylands, the present study made it possible to distinguish, as expected from the literature [3,5], three dominant types of farm households, depending on the amounts of inputs (labour, water, nitrogen), the resource endowments available for each household and the production goal (market vs. consumption).
Intensive predominantly-vegetable farming households whose dominant crops are onions and potatoes represent the first household type. These farm households are characterized by a high income and high input intensities. The second household type is that of semi-intensive cereal mono-crop farming households which mainly cultivate cereal crops (soft wheat and barley) with average intensities of nitrogen, water and labour. The third type is extensive cereal-legume farming households which cultivate cereal crops combined with legumes (chickpea and broad bean) with low input intensities.
These three farm household types coexist in most dryland regions today because of the tension between two forces, namely agricultural policies that encourage intensification [58] and the low resource endowments of farm households to make the most of policies and niche markets [7]. This situation reflects almost the same trajectory for most traditional cereal systems in arid and semi-arid areas (for example Saïss in Morocco, Medjerda in Tunisia, Metijda in Algeria, etc.), where the mobilization of more resources, particularly water in some areas, provoked this type of diversity [59].
The evaluation of the farm households’ technical efficiency shows that, in accordance with the literature [7,11], the intensification of production systems by mobilizing more inputs (water, nitrogen fertilizer, labour) is accompanied by an increase in farm income on the one hand and a drop in technical efficiency on the other. Our results show that the extensive mixed cereal-legume extensive farming system is the most efficient and diversified system in the region, but with lower net margins relative to intensive predominantly-vegetable farming households and semi-intensive cereal mono-crop farming systems.
In light of these results, it seems at present that it would be difficult to achieve high income levels with extensive mixed cereal-legume farming even if resources were to become more available. This limit is more likely to be related to the low yields of legumes. Moreover, extensive mixed cereal-legume farming remains very efficient in the use of inputs but also very adapted to farmers with low investable financial resources. From the point of view of production cost, conservation of natural resources and consumption, our results show that it would be more appropriate for these types of farm households to maintain their mixed cereal-legume farming than to evolve into intensive farming. This is due to the fact that achieving high income and efficiency requires the availability of substantial amounts of resources, which is unrealistic for the majority of households in drylands.
The results of the present study may serve as a basis for discussions with policy makers and local stakeholders in order to define production systems whose performance would take into account the trade-offs between production, consumption and the environment. In this context, the goal should be to design production systems that involve compromises that lead to increased farm income but also to the preservation of agro-biodiversity. The compromises can be made according to the availability of biophysical and monetary resources and the current income levels of each household type.
Apart from the valuable information this paper will make available for use by policy makers, government and non-government development organizations and extension personnel, the results will be used as a basis for ongoing bio-economic modelling work that was initiated under the auspices of the former CGIAR research program on drylands (CRP-DS) analysing the production system in the Saïss region of Morocco [60].

Author Contributions

L.E.A. and R.C. analyzed the data base and performed the statistical analysis. L.E.A. surveyed farmers; L.E.A., R.C., H.B. and Y.A.Y. analyzed and discussed the results; L.E.A. wrote the paper and H.B., C.G. and Y.A.Y. revised the paper. All authors have read and agreed to the published version of the manuscript.

Funding

This research received funding from the Mediterranean Agronomic Institute of Montpellier CIHEAM-IAMM, the International Center for Agricultural Research in the Dry Areas (ICARDA) and the SemiArid (ERANET ArimNet, 2017–2020) project.

Acknowledgments

The authors of this paper wish to express sincere appreciation to the CRP-DS program led by the International Center for Agricultural Research in Dry Areas (ICARDA) and CRP-WHEAT, CIHEAM-IAMM and UMR System for giving full sponsorship to the publication of the paper in this journal.

Conflicts of Interest

The authors declare no conflicts of interest.

Appendix A

In this paper, the input-oriented technical efficiency is computed where TE is expressed as the ratio of the minimum possible use of resources (inputs) used to reach a determined output level (converted into monetary units to provide farm income) and the level of inputs used by the farm under the assumption that the production technology is the same for both contrasting farms. To avoid the confusing effects of prices in the process of converting all outputs into a single monetary unit, average national prices are used for each crop. For example, the average national price of wheat is used for all farmers producing wheat and the national average faba bean price is used for all farmers producing faba beans, and the sum of the products of the average price and quantity of each crop produced by a given farm is used to generate the total value of farm-level production.
Suppose that i = 1, 2,…, i represents farmers (in our case the 286 individual farms), each of which uses a vector of inputs x (irrigation water, nitrogen and labour) to obtain a vector of outputs y   (farm income), by using available technology where each class of farm type is assumed to represent specific technology.
A measure of input-oriented technical efficiency TE ( x   i   , y   i   ) can be defined as the capacity of a given farm i to achieve an established output (farm income) using minimum inputs (quantity of irrigation water, amount of nitrogen and amount of labour). In other words, as each farm’s vector of outputs is considered to be given, the aim is to determine the extent to which the vector of inputs may be minimized for each of them. While efficiency implies that reducing the quantities of these inputs is impossible, inefficiency would imply more possibilities of minimizing them.
Let the following translog specification approximate the unknown stochastic frontier production and inefficiency model for a typical farm household:
ln y i = α 0 + j = 1 j α j ln x ji + 1 2 ( j = 1 l k = 1 j α jk ln x ji ln x ki ) +   α w ln w i +   1 2 ( α ww ( ln w i ) 2 + j = 1 j α jw ln x ji ln w i ) + v i   u i
where w is the amount of irrigation water (m3/ha); x is a vector consisting of the amounts of all other inputs used (kg/ha); ϑ i is a random error term independently and identically distributed as N(0,   σ v 2 ) that captures factors which are beyond the control of farmers; and u i is a non-negative random error term distributed independently and identically as N + ( μ , σ u 2 ) . u i captures technical inefficiency in production, which, following Battese and Coelli [61], is defined as:
u i = z i δ +   ω i
where z i   is a vector of variables which explain efficiency differentials among farmers, while δ is a vector of the associated parameters to be estimated, and ω i is a random variable defined by the truncation of the normal distribution with mean zero and variance σ 2 , where the point of truncation is - z i δ such that w i z i δ .
Rewriting (A1) as y i = f ( x ij , w ij ; a ij , v i , u i ) where u i = 0 for the technically efficient farmer who is producing on the stochastic production frontier, output oriented technical efficiency is given by
TE i = f ( x ij , w ij ; α ij , v i , u i ) f ( x ij , w ij ; α ij , v i )
Applying this to the translog specification (A1) yields
TE i = exp ( u i )
As it is impossible to obtain estimates for ui and vi for each individual farm i, the efficiency estimator TEi is obtained as the conditional expectation of exp(−ui) given the composite error term e i = v i u i , i.e.,
TE i = E ( exp ( u i ) e i )  
Following Reinhard et al. [62] for the derivation of input specific efficiency (or environmental efficiency as they call it), irrigation water efficiency ( IWE i ) is given by
I W E i = exp { [ ( α w + α w w l n   w i + j α j w l n   x i j ) +   { ( α w + α w w l n   w i + j α j w l n   x i j ) 2 2 α w w * u i } 0.5 ] α w w }
where wi represents the irrigation water variable input 0 < IWE i   1 , with values close to 0 showing very high inefficiency, while values close to 1 indicate high levels of efficiency where those farms operating on the production frontier will have an IWE i value of 1. Though it has an input-conserving interpretation, the non-radial measure of input specific (irrigation water) efficiency given above does not provide information for inferring the cost savings due to a more efficient use of the input under consideration. This calls for the use of the single-factor technical cost efficiency measure, which makes it possible to directly evaluate the potential cost savings from the improved management of a single input while keeping all other inputs at their observed levels [63]. Following the formulation of Akridge [64], farm-specific irrigation water technical cost efficiency (ITCEi) can be computed as
I T C E i = S w i I W E i + j = 1 J S j i   ,   j w
where Swi is the observed cost share of irrigation water (w) in the total input cost (c) of the ith wheat farm and Sji is the corresponding cost share of the jth input. By definition, cost shares of all inputs must add up to 1 (i.e., Swi + ∑Jj=1 Sj,i = 1 for all i ), and as discussed above, IWTEi takes values between zero and one. This implies 0 < ITCEi ≤ 1. Cost savings depend on factor prices and very low irrigation water price can lead to cost efficiency even in the face of inefficient water use in a physical sense, and vice versa [63]. In this study, farm-specific cost shares have been used to calculate irrigation water technical cost efficiency (ITCEi).
Figure A1. Explaining the concept of fertilizer technical efficiency (FTE).
Agronomy 10 00998 g0a1

Appendix B

The global structure of the database with an example of variables mobilized for the farm typology.
Agronomy 10 00998 i001

References

  1. García-Palacios, P.; Alarcón, M.R.; Tenorio, J.L.; Moreno, S.S. Ecological intensification of agriculture in drylands. J. Arid. Environ. 2019, 167, 101–105. [Google Scholar] [CrossRef]
  2. Mrabet, R.; Moussadek, R.; Fadlaoui, A.; van Ranst, E. Conservation agriculture in dry areas of Morocco. Field Crop. Res. 2012, 132, 84–94. [Google Scholar] [CrossRef]
  3. Shalander, K.; Amare, H.; Ramilan, T.; Suhas, P.W. Assessing different systems for enhancing farm income and resilience in extreme dry region of India. In Proceedings of the 58th AARES Annual Conference, Port Macquarie, Australia, 4–7 February 2014; p. 22. [Google Scholar]
  4. Hervieu, B.; Abis, S.; Blanc, P.; de Jouvenel, H. Mediterra 2008: The Future of Agriculture and Food in Mediterranean Countries; Presses de Sciences Po: Paris, France, 2008; p. 356. [Google Scholar]
  5. Souissi, I.; Boisson, J.M.; Mekki, I.; Therond, O.; Flichman, G.; Wery, J.; Belhouchette, H. Impact assessment of climate change on farming systems in the South Mediterranean area: A Tunisian case study. Reg. Environ. Chang. 2018, 18, 637–650. [Google Scholar] [CrossRef]
  6. Aït Kadi, M.; Benoit, G.; Lazaref, G. L’Union pour la Méditerranée face aux crises alimentaires, de l’eau et du climat. Les Notes d’analyse du CIHEAM 2008, 42, 1–25. (In French) [Google Scholar]
  7. Robinson, L.W.; Ericksen, P.J.; Chesterman, S.; Worden, J.S. Sustainable intensification in drylands: What resilience and vulnerability can tell us. Agric. Syst. 2015, 135, 133–140. [Google Scholar] [CrossRef]
  8. Fadlaoui, A.; Allali, K.; Yjjou, M.; Ezzahouani, A.; Zahri, A. Rapport d’activités sur l’état d’avancement du Projet CRP D.S dans la Province d’El Hajeb; INRA-Maroc: Rabat, Morocco, 2013; p. 30. (In French) [Google Scholar]
  9. Chenoune, R.; Allen, T.; Komarek, A.M.; Paloma, S.G.Y.; Flichman, G.; Capillon, A.; Belhouchette, H. Assessing consumption-production-resources nexus decisions for rice-focused agricultural households in Sierra Leone. Land Use Policy 2017, 67, 597–607. [Google Scholar] [CrossRef]
  10. FAO. Profil Nutritionnel de Pays: Royaume du Maroc; FAO: Rome, Italy, 2011; p. 60. (In French) [Google Scholar]
  11. Tilman, D.; Cassman, K.G.; Matson, P.A.; Naylor, R.; Polasky, S. Agricultural sustainability and intensive production practices. Nature 2002, 418, 671–677. [Google Scholar] [CrossRef]
  12. Human Rights Council. Promotion and protection of all human rights, civil, political, economic, social and cultural rights, including the right to development. In Report of The Special Rapporteur on the Right to Food, Jean Ziegler; Human Rights Council: Genève, Switzerland, 2008; p. 27. [Google Scholar]
  13. CEA-AN. La sécurité Alimentaire en Afrique du Nord: Analyse de Situation et réactions des états Face à l’instabilité des marchés Agricoles; Commission économique pour l’Afrique, Bureau pour l’Afrique du Nord, Nations Unies: Rabat, Morocco, 2012; p. 48. (In French) [Google Scholar]
  14. Hadi, M.M.; Heinrich, M.D. Plan stratégique de Pays–Liban (2018–2020); Programme Alimentaire Mondial: Rome, Italy, 2017; p. 32. (In French) [Google Scholar]
  15. Medany, M.A. Climate change: Impacts and responses for sustainable agriculture in Egypt. CIHEAM Watch Lett. 2016, 37, 69–74. [Google Scholar]
  16. Saoud, B. Le plan maroc vert: Stratégie, objectifs et gouvernance de mise en œuvre. Comptes Rendus de l’Académie d’agriculture de France 2011, 97, 27–28. (In French) [Google Scholar]
  17. Baccar, M.; Bouaziz, A.; Dugue, P.; Le Gal, P.Y. Shared environment, diversity of pathways: Dynamics of family farming in the Sais Plain (Morocco). Reg. Environ. Chang. 2017, 17, 739–751. [Google Scholar] [CrossRef]
  18. Sohrabi, M.; Heidari, G.; Mohammadi, S.; Yazdanseta, S. Evaluation of quantitative and qualitative characteristics of yield in dryland wheat cultivars under supplemental irrigation conditions. J. Food Agric. Environ. 2010, 8, 400–403. [Google Scholar]
  19. Belhouchette, H.; Louhichi, K.; Therond, O.; Mouratiadou, I.; Wery, J.; van Ittersum, M.; Flichman, G. Assessing the impact of the nitrate directive on farming systems using a bio-economic modelling chain. Agric. Syst. 2011, 104, 135–145. [Google Scholar] [CrossRef]
  20. Blazy, J.M.; Tixier, P.; Thomas, A.; Ozier-Lafontaine, H.; Salmon, F.; Wery, J. BANAD: A farm model for ex ante assessment of agro-ecological innovations and its application to banana farms in Guadeloupe. Agric. Syst. 2010, 103, 221–232. [Google Scholar] [CrossRef]
  21. Lopez-Ridaura, S.; Frelat, R.; van Wijk, M.T.; Valbuena, D.; Krupnik, T.J.; Jat, M.L. Climate smart agriculture, farm household typologies and food security: An ex-ante assessment from Eastern India. Agric. Syst. 2018, 159, 57–68. [Google Scholar] [CrossRef]
  22. Peano, C.; Migliorini, P.; Sottile, F. A methodology for the sustainability assessment of agri-food systems: An application to the Slow Food Presidia project. Ecol. Soc. 2014, 19. [Google Scholar] [CrossRef] [Green Version]
  23. Smith, A.; Snapp, S.; Chikowo, R.; Thorne, P.; Bekunda, M.; Glover, J. Measuring sustainable intensification in smallholder agroecosystems: A review. Glob. Food Secur. 2017, 12, 127–138. [Google Scholar] [CrossRef] [Green Version]
  24. Delmotte, S.; Barbier, J.M.; Mouret, J.C.; Le Page, C.; Wery, J.; Chauvelon, P.; Sandoz, A.; Ridaura, S.L. Participatory integrated assessment of scenarios for organic farming at different scales in Camargue, France. Agric. Syst. 2016, 143, 147–158. [Google Scholar] [CrossRef]
  25. Mandryk, M.; Reidsma, P.; van Ittersum, M.K. Crop and farm level adaptation under future climate challenges: An exploratory study considering multiple objectives for Flevoland, the Netherlands. Agric. Syst. 2017, 152, 154–164. [Google Scholar] [CrossRef]
  26. Reidsma, P.; Janssen, S.; Jansen, J.; van Ittersum, M.K. On the development and use of farm models for policy impact assessment in the European Union: A review. Agric. Syst. 2018, 159, 111–125. [Google Scholar] [CrossRef]
  27. Haileslassie, A.; Craufurd, P.; Thiagarajah, R.; Kumar, S.; Whitbread, A.; Rathor, A.; Blummel, M.; Ericsson, P.; Kakumanu, K.R. Empirical evaluation of sustainability of divergent farms in the dryland farming systems of India. Ecol. Indic. 2016, 60, 710–723. [Google Scholar] [CrossRef] [Green Version]
  28. Belhadj Hamlili, C. Impact de la pollution nitrique sur les ressources en eaux souterraines dans la plaine de Saïss (Maroc). In Mémoire (Master 2 GAT); CIHEAM-IAMM: Montpellier, France, 2012. (In French) [Google Scholar]
  29. Kmoch, L.; Pagella, T.; Palm, M.; Sinclair, F. Using local agroecological knowledge in climate change adaptation: A study of tree-based options in Northern Morocco. Sustainability 2018, 10, 3719. [Google Scholar] [CrossRef] [Green Version]
  30. ABHS. Etude de la faisabilité de Transfert du Haut Sebou Vers la Plaine du Saiss: Rapport de synthèse; Agence du Bassin Hydraulique du Sebou: Fès, Morocco, 2006; p. 27. (In French) [Google Scholar]
  31. Zraibi, L. Comportement Agronomique, Biochimique et Physiologique d’accessions de CARTHAME (Carthamustinctorius L.) vis-à-vis de Contraintes Environnementales Thèse de Doctorat; Faculté des Sciences: Oujda, Algeria, 2013. (In French) [Google Scholar]
  32. Mrabet, R.; Fadlaoui, A.; Moussadak, R. Caractérisation des sites: Meknès-El Hajeb. In Proceedings of the Atelier de Lancement CRP-DS, Meknès, Morocco, 7–8 November 2013. [Google Scholar]
  33. Dugué, P.; Benouniche, M.; Ameur, F.; El Amrani, M.; Kuper, M. Lorsque les agriculteurs familiaux innovent: Cas des systèmes de production irrigués de la plaine du Saïs (Maroc). Agron. Environ. Sociétés 2015, 5, 87–95. [Google Scholar]
  34. Chenoune, R.; Belhouchette, H.; Paloma, S.G.Y.; Capillon, A. Assessing the diversity of smallholder rice farms production strategies in Sierra Leone. NJAS–Wagening. J. Life Sci. 2016, 76, 7–19. [Google Scholar] [CrossRef]
  35. Bossa, A.Y.; Diekkruger, B.; Giertz, S.; Steup, G.; Sintondji, L.O.; Agbossou, E.K.; Hiepe, C. Modeling the effects of crop patterns and management scenarios on N and P loads to surface water and groundwater in a semi-humid catchment (West Africa). Agric. Water Manag. 2012, 115, 20–37. [Google Scholar] [CrossRef]
  36. Madry, W.; Pluta, S.; Sieczko, L.; Studnicki, M. Phenotypic diversity in a sample of blackcurrant (Ribes nigrum L.) cultivars maintained in the Fruit Breeding Department at the Research Institute of Pomology and Floriculture in Skierniewice, Poland. J. Fruit Ornam. Plant Res. 2010, 18, 23–37. [Google Scholar]
  37. Bidogeza, J.C.; Berentsen, P.B.M.; De Graaff, J.; Lansink, A. A typology of farm households for the Umutara Province in Rwanda. Food Secur. 2009, 1, 321–335. [Google Scholar] [CrossRef]
  38. Alvarez, S.; Paas, W.; Descheemaeker, K.; Tittonell, P.; Groot, J. Typology Construction, A Way of Dealing with Farm Diversity: General Guidelines for Humidtropics; Wageningen University & CGIAR: Wageningen, The Netherlands, 2014; p. 36. [Google Scholar]
  39. Hammond, J.; Fraval, S.; van Etten, J.; Suchini, J.G.; Mercado, L.; Pagella, T.; Frelat, R.; Lannerstad, M.; Douxchamps, S.; Teufel, N.; et al. The Rural Household Multi-Indicator Survey (RHoMIS) for rapid characterisation of households to inform climate smart agriculture interventions: Description and applications in East Africa and Central America. Agric. Syst. 2017, 151, 225–233. [Google Scholar] [CrossRef] [Green Version]
  40. Gelasakis, A.I.; Rose, G.; Giannakou, R.; Valergakis, G.E.; Theodoridis, A.; Fortomaris, P.; Arsenos, G. Typology and characteristics of dairy goat production systems in Greece. Livest. Sci. 2017, 197, 22–29. [Google Scholar] [CrossRef]
  41. USDA. Agricultural Research Service: U.S. Department of Agriculture. Available online: https://fdc.nal.usda.gov/index.html (accessed on 11 May 2020).
  42. Calories. Tableau Des Calories. Available online: http://www.gastronomie-wallonne.be/gastro/articles_cuisine/tableau_des_calories.pdf (accessed on 11 May 2020).
  43. Fatsecret. Fatsecret Australia. Available online: https://www.fatsecret.com.au/ (accessed on 11 May 2020).
  44. Keating, B.A.; Carberry, P.S.; Bindraban, P.S.; Asseng, S.; Meinke, H.; Dixon, J. Eco-efficient agriculture: Concepts, challenges, and opportunities. Crop. Sci. 2010, 50, 109–119. [Google Scholar] [CrossRef]
  45. Farrell, M.J. The measurement of productive efficiency. J. R. Stat. Soc. Ser. A (Gen.) 1957, 120, 253–290. [Google Scholar] [CrossRef]
  46. Coelli, T. A guide to DEAP version 2.1: A data envelopment analysis (computer) program. In CEPA Working Paper; University of New England: Armidale, Australia, 2008; pp. 1–49. [Google Scholar]
  47. Yigezu, Y.A.; Ahmed, M.A.; Shideed, K.; Aw-Hassan, A.; El-Shater, T.; Al-Atwan, S. Implications of a shift in irrigation technology on resource use efficiency: A Syrian case. Agric. Syst. 2013, 118, 14–22. [Google Scholar] [CrossRef]
  48. Torres, A.C. Revue Bibliographique des Outils Pour la Mesure des Relations Entre Agrobiodiversité et Nutrition. Master’s Thesis, La Sécurité Alimentaire pour le Développement, Université Paris Sud–Faculté Jean Monnet, Paris, France, 2013. (In French). [Google Scholar]
  49. Elloumi, M. L’agriculture tunisienne dans un contexte de libéralisation. Région et Développement 2006, 32, 130–160. (In French) [Google Scholar]
  50. Bedrani, S.; Abidar, A.; Laytimi, A. National Agriculture Policy: Algeria [MEDFROL Project]; European Union: Brussels, Belgium, 2005; p. 41. [Google Scholar]
  51. Radwan, A.; Gil, J.M.; Diab, Y.A.A.; Abo-Nahoul, M.A. Determinants of the adaption of organic agriculture in Egypt using a duration analysis technique. In Proceedings of the Agricultural Economic Society Annual Conference, Warwick, UK, 18–20 April 2011; p. 12. [Google Scholar]
  52. Harper, H.; Hallsworth, M. Counting Calories: How Under-Reporting Can Explain the Apparent Fall in Calorie Intake; Behavioural Insights Team: Londres, UK, 2016; p. 43. [Google Scholar]
  53. Komarek, A.M.; Drogue, S.; Chenoune, R.; Hawkins, J.; Msangi, S.; Belhouchette, H.; Flichman, G. Agricultural household effects of fertilizer price changes for smallholder farmers in central Malawi. Agric. Syst. 2017, 154, 168–178. [Google Scholar] [CrossRef]
  54. Ferchiou, A. Quelles Mesures de Relances Pour l’agriculture Familiale en Zone Aride: évaluation Intégrée par la Modélisation bio économique des Ménages Agricoles de Sidi Bouzid. Ph.D. Thesis, Montpellier SupAgro, Montpellier, France, 2017. (In French). [Google Scholar]
  55. Jouve, A.-M.; Belghazi, S.; Kheffache, Y. La filière des céréales dans les pays du Maghreb: Constante des enjeux, évolution des politiques. In Les Agricultures Maghrébines à l’aube de l’an 2000; Options Méditerranéennes: Série B. Etudes et Recherches; Allaya, M., Ed.; CIHEAM: Montpellier, France, 1995; Volume 14, pp. 169–192. (In French) [Google Scholar]
  56. Dobermann, A.; Nelson, R. Solutions for Sustainable Agriculture and Food Systems: Technical Report for the Post–2015 Development Agenda; Sustainable Development Solutions Network: New York, NY, USA, 2013; p. 108. [Google Scholar]
  57. FAO. Ethique et Intensification Agricole Durable; FAO: Rome, Italy, 2004; p. 33. [Google Scholar]
  58. Dugué, P.; Soulard, C.; Marrachini, E.; Houdart, M.; Michel, I.; Rhaidour, M. Systèmes maraichers urbains et périurbains en Méditerranée: Une comparaison entre Meknès (Maroc), Montpellier (France) et Pise (Italie). In Proceedings of the Journées Scientifiques Franco-Tunisiennes: Organisation des Agriculteurs et des Systèmes Agricoles dans les Territoires Urbains et Périurbains, Sousse, Tunisia, 9 March 2016; p. 10. [Google Scholar]
  59. Lacirignola, C. Les Objectifs du Développement Durable: Opportunités Méditerranéennes; L’Harmattan: Paris, France, 2016; p. 221. [Google Scholar]
  60. Payne, W. Integrated Agricultural Production Systems for Improved Food Security and Livelihoods in Dry Areas: Inception Phase Report; CGIAR Research Program on Aquatic Agricultural Systems: Amman, Jordan, 2013; p. 72. [Google Scholar]
  61. Battese, G.E.; Coelli, T.J. A model for technical inefficiency effects in a stochastic frontier production function for panel data. Empir. Econ. 1995, 20, 325–332. [Google Scholar] [CrossRef] [Green Version]
  62. Reinhard, S.; Lovell, C.A.K.; Thijssen, G. Econometric estimation of technical and environmental efficiency: An application to dutch dairy farms. Am. J. Agric. Econ. 1999, 81, 44–60. [Google Scholar] [CrossRef]
  63. Kopp, R.J. The measurement of productive efficiency: A reconsideration. Q. J. Econ. 1981, 96, 477–503. [Google Scholar] [CrossRef]
  64. Akridge, J.T. Measuring productive efficiency in multiple product agribusiness firms: A dual approach. Am. J. Agric. Econ. 1989, 71, 116–125. [Google Scholar] [CrossRef]
Figure 1. Location of the “Saïss plain” study area (Source: Baccar, 2017).
Agronomy 10 00998 g001
Figure 2. Frequency distribution of farms by size of land holding.
Agronomy 10 00998 g002
Figure 3. Box plots of nitrogen fertilizer, irrigation water, labour and yield per crop species in the study area.
Agronomy 10 00998 g003aAgronomy 10 00998 g003b
Figure 4. Projection of variables on the first two principle components. 1. % of production per type of vegetable products. 2. Irrigated area per farm. 3. Total labour per farm. 4. % of calories provided by self-consumption per type of vegetable products. 5. Total quantity of irrigation water per farm. 6. % of production per type of cereal products. 7. Total quantity of N fertilization per farm. 8. Total cost of seeds per crop and farm_Onion. 9. % of calories provided by self-consumption per type of cereal products. 10. Total cost of seeds per crop and farm_Potato. 11. Total cost of seeds per crop and farm_Wheat. 12. % of production per type of legume products. 13. Total cost of seeds per crop and farm_Faba bean. 14. % of calories provided from self-consumption per type of legume products. 15. Number of animals per type (sheep). 16. Number of animals per type (cattle). 17. Gross margin per farm from cultivated crops. 18. Total cost of seeds per crop and farm_Barley. 19. Total cost of seeds per crop and farm_Chickpea 20. Cropped area per farm household. 21. Family working population size. 22. Total mechanization cost per farm. 23. Off-farm income.
Agronomy 10 00998 g004
Figure 5. Average values of farm income, composite technical efficiency, farm self-consumption, diversity index, nitrogen technical efficiency, labour technical efficiency and water technical efficiency for the three farm types.
Agronomy 10 00998 g005
Figure 6. Envelope curves of the distribution of farm households according to input specific technical efficiencies.
Agronomy 10 00998 g006
Table 1. Criteria and variables used for identifying distinct farm household types.
Criteria for Farm TypologyVariables for Farm TypologySource of Data
Criteria that account for resource endowmentProduction potential1- Cropped area per farm household (ha)Primary data from survey
2- Irrigated area per farm (%)Calculated from the survey as a percentage of irrigated area over the total cropped farm area.
Availability of financial resources3- Gross margin per farm from cultivated crops (dh/ha) Calculated from the survey first per crop by considering production and costs, and then at farm level
4- Number of animals per type (sheep)Primary data from survey
5- Number of animals per type (cattle)
6- Off-farm income (dh/household)
Criteria that account for production intensification7- Total quantity of irrigation water per farm (m3/ha)For each crop and then farm, they were calculated from the survey as the quantity of each input multiplied by the market price of each input as given by each farmer.
8- Total labour per farm (person-day/ha)
9- Total mechanization cost per farm (dh/ha)
10- Total cost of seeds per crop_Onion (dh/ha)
11- Total cost of seeds per crop_Potato (dh/ha)
12- Total cost of seeds per crop_Wheat (dh/ha)
13- Total cost of seeds per crop_faba bean (dh/ha)
14- Total cost of seeds per crop_Barley (dh/ha)
15- Total cost of seeds per crop_Chickpea (dh/ha)
16- Total quantity of N fertilization per farm (kg/ha)
Criteria that account for production goals17- Family working population sizePrimary data from survey
18- % of production per type of cereal products
19- % of production per type of vegetable products
20- % of production per type of legume products
Per farm, it was calculated as a percentage of income ensured by each type of product (cereals, legumes, and vegetables) over the total farm income.
21- % of calories provided from self-consumption per type of cereal products
22- % of calories provided from self-consumption per type of vegetable products
23- % of calories provided from self-consumption per type of legume products
Calculated from the survey as a percentage of total calories provided by self-consumption per type of product (cereals, legumes, vegetables)
Table 2. Descriptive statistics on demography, land use, gross margins and self-consumption for sample households.
VariablesMinFirst Quartile (q1)MedianMaxThird Quartile (q3)
Family-size1.04.06.027.08.0
Total cropped area (ha)0.51.93.086.07.0
Farm gross margin (dh/ha)44.04585.87411.643,767.410,510.3
Self-Consumption Per Product (kg/capita/year)
Wheat0.0149.0300.0881.5500.0
Barley0.00.07.9397.594.0
Faba bean0.00.83.928.314.2
Chickpea0.00.02.216.86.6
Onion0.08.715.2145.538.2
Potato0.017.440.3118.266.7
Table 3. Five components resulting from the principal components analysis with loadings for each of the 23 variables and percentage of the cumulative variance explained.
CriteriaName of VariablesComponents
Axis_1Axis_2Axis_3Axis_4Axis_5Axis_6Axis_7
Criteria that account for resource endowmentProduction potential1- Cropped area per farm household (ha)0.1770.2080.327−0.3330.243−0.025−0.026
2- Irrigated area per farm (%)−0.837−0.122−0.0030.046−0.002−0.007−0.051
Availability of financial resources3- Gross margin per farm from cultivated crops (dh/ha) −0.471−0.1420.4940.356−0.0160.000−0.092
4- Number of animals per type (sheep)0.1070.0140.419−0.472−0.2130.112−0.166
5- Number of animals per type (cattle)0.118−0.0200.364−0.3900.179−0.0370.111
6- Off-farm income (dh/household)−0.471−0.1420.4940.356−0.0160.0790.042
Criteria that account for production intensification7- Total quantity of irrigation water per farm (m3/ha)−0.810−0.161−0.114−0.2240.076−0.005−0.022
8- Total labour per farm (person-day/ha)−0.820−0.163−0.140−0.1660.0810.0520.002
9- Total mechanization cost per farm (dh/ha)−0.0170.1890.5900.087−0.1090.028−0.069
10- Total cost of seeds per crop and farm_Onion (dh/ha)−0.644−0.065−0.469−0.4400.015−0.1250.120
11- Total cost of seeds per crop and farm_Potato (dh/ha)−0.568−0.0580.5490.390−0.015−0.055−0.261
12- Total cost of seeds per crop and farm_Wheat (dh/ha)0.533−0.573−0.2450.2000.222−0.079−0.025
13- Total cost of seeds per crop and farm_Faba bean (dh/ha)0.1110.817−0.0900.148−0.0950.174−0.263
14- Total cost of seeds per crop and farm_Barley (dh/ha)0.2160.0100.208−0.411−0.696−0.005−0.022
15- Total cost of seeds per crop and farm_Chickpea (dh/ha)0.1390.2760.163−0.3290.6030.0520.002
Criteria that account for production goals16- Total quantity of N fertilization per farm (kg/ha)−0.686−0.1350.0980.093−0.0490.1100.314
17- Family working population size−0.060−0.1080.190−0.2170.209−0.2060.442
18- % of production per type of cereal products0.769−0.497−0.137−0.046−0.2110.7080.104
19- % of production per type of vegetable products−0.937−0.1420.1680.0570.0510.653−0.049
20- % of production per type of legume products0.1350.892−0.025−0.0090.234−0.104−0.572
21- % of calories provided by self-consumption per type of cereal products−0.8090.010−0.186−0.154−0.062−0.016−0.385
22- % of calories provided by self-consumption per type of vegetables products−0.8090.010−0.186−0.154−0.0620.2220.115
23- % of calories provided by self-consumption per type of legume products−0.0120.801−0.1570.180−0.1510.042−0.023
Eigenvalues6.4183.2441.9331.6011.3101.1331.034
Cumulative explained variance (%)27.9042.0150.4157.3763.076872
* N.B. Bold numbers refer to loadings higher than 0.5.
Table 4. Average characteristics of the three farm household types. “n” represents the number of farms per farm type.
CriteriaVariablesIntensive Predominantly-Vegetable Farming Households
(n= 62)
Semi-Intensive Cereal Mono-Crop Farming Households
(n= 140)
Extensive Mixed Cereal-Legume Farming Households
(n= 85)
Production potentialCropped area (ha)3.884.4111.62
Irrigated area (%)80105
Availability of financial resourcesGross margin (dh/ha)1934373786491
Off-farm income (dh)369636272457
Total cattle (number)2.82.63.3
Total sheep (number)5.610.311.2
Production intensificationWater (m3/ha)577416
Labour (person-day/ha)561511
Mechanization cost (dh/ha)647768586
Seed costs (dh/ha)1648413519
Nitrogen (kg/ha)1438360
Production goalsFamily size (number)766
Production_Cereals (%)266173
Production_Legumes (%)41125
Production_Vegetables (%)70281.2
Self_consumption_Calories_Cereals (%)539766
Self_consumption_Calories _Legume (%)2231
Self_consumption_Calories _Vegetables (%)4513
Diversity indexShannon index0.120.10.25
Table 5. Average crop production, average crop product sold and average self-consumed crops per farm household type.
Intensive Predominantly-Vegetable Farming HouseholdsSemi-Intensive Cereal Mono-Crop Farming HouseholdsExtensive Mixed Cereal-Legume Farming Households
Variable/Crops*CerealsLegumesVegetablesCerealsLegumesVegetablesCerealsLegumesVegetables
WBCFOPWBCFOPWBCFOP
Area (ha)1.660.120.030.530.810.732.30.650.270.520.560.116.481.242.161.430.270.03
Yield (t/ha)3.73.71.21.733.225.43.42.91.61.623.4253.33.41.61.529.24
Total production** (t)6.10.40.040.92718.57.81.90.40.9132.721.24.23.42.280.1
Quantity sold (t)1.50.20.040.823.216.22.30.90.30.912.12.76.72.02.21.88.00.1
Quantity own-consumed per productkg/household823280.042.868133656473.31.76625.595779103232
Kg/household and capita117.53.40.010.49.719109.47.80.540.2811.14.26159.513.181.680.433.830.36
Calories/ capita.day110813.30.031.311.441.71030.9262.60.9139.31503.344.17.91.64.55
* W, B, C, F, O and P indicate wheat, barley, chickpea, faba bean, onion and potato, respectively. ** The total production does not match the sum of quantities sold and self-consumed because a part of the production is used as seeds.

