Article

Short Term Cotton Lint Yield Improvement with Cover Crop and No-Tillage Implementation

1
Department of Soil and Crop Sciences, Texas A&M University, College Station, TX 77843, USA
2
Texas A&M AgriLife Lubbock, Lubbock, TX 79403, USA
3
Department of Plant and Soil Science, Texas Tech University, Lubbock, TX 79409, USA
*
Author to whom correspondence should be addressed.
Agronomy 2020, 10(7), 994; https://doi.org/10.3390/agronomy10070994
Submission received: 25 May 2020 / Revised: 23 June 2020 / Accepted: 6 July 2020 / Published: 10 July 2020
(This article belongs to the Section Innovative Cropping Systems)

Abstract

:
No-tillage has been used for mitigating wind erosion on the Southern High Plains US for decades. This study investigated the effects of tillage and nitrogen (N) fertilizer timing on cotton lint yield, fiber quality, and seed N content during a three-year transition from conventional tillage (CT) to a no-tillage system both with a wheat (Triticum aestivum) cover crop (NTW) and without a cover crop (NT). Lint yield was different between tillage systems within each year with the NTW system producing greater lint yield than the CT system in the second and third year of the transition period. The concentration of cotton seed N was not different within years, although it was decreased in the no N added control in the third year. Cotton fiber strength was increased in the NTW system compared to the CT system in the second year of the study. However, the CT system produced increased fiber strength compared to the other two systems in 2018 and is likely the result of late-season weather conditions. It was determined that implementing a NTW system may increase lint yield within the first few years and has no effect on most fiber quality parameters, especially in environmentally challenging conditions.

1. Introduction

The first tillage implements brought to the Southern High Plains (SHP; MLRA 77C) [1] to manage soil included the moldboard plow, which allowed crop production on the mixed grass prairies of the SHP and turned them into highly productive soils [2]. Intensive tillage of soil on the SHP combined with a period of intense drought, led to extreme cases of wind erosion in the period now known as the Dust Bowl [3]. Wind erosion has reportedly caused up to a 40% reduction in cotton (Gossypium hirsutum L.) lint yield [4], and under certain conditions, such as extremely high wind speeds and blowing soil, it can cause total crop failure. Government agencies have been established across the USA since the Dust Bowl to promote the use of less intensive forms of soil management and the use of cover crops to reduce the effects of wind erosion [5]. However, tillage continues to be used on the SHP and throughout Texas agriculture, with an estimated 60% of acres being managed using conventional tillage (CT) [6].
Cotton is the predominant crop grown on the SHP, with production reaching over three million bales in 2017 [7], with a standard US cotton bale weight of 217.7 kg, this amounts to over 650 million kg cotton lint produced on the SHP in 2017. The cotton produced on the SHP in 2017 accounted for about 15% of cotton production in the USA [8]. Many studies across the USA have examined the effects of soil and nutrient management on cotton yield and fiber quality. However, research involving soil and nutrient management practices and their impacts on cotton production is lacking on the SHP.
Soil management can impact cotton yield [9,10,11]. Reduced tillage and no-till systems, especially when combined with cover crops, can impact soil properties such as water-holding capacity and nutrient cycling, which subsequently affect cotton growth and development. A study on the effects of cover crops and conservation tillage in Virginia determined that conservation tillage had no effect on yield [12]. However in the same study, a legume cover crop was determined to increase yield when combined with a rye (Secale cereale L.) cover [12]. Bauer and Busscher [13] examined individual cover crop species and combinations of those species in South Carolina. They found that lint yield was not different between conventional and conservation tillage when using a rye cover crop. Raper, Reeves, Burmester and Schwab [11] determined an increase in cotton lint yield in three out of the first four years of cover crop implementation in Alabama. Balkcom, Reeves, Shaw, Burmester and Curtis [9] reported that reduced tillage might increase yield after three years under a no-till system in the Tennessee Valley.
On the Texas Rolling Plains, a semi-arid ecoregion east of the SHP, cotton lint yield was determined to not be affected by conservation tillage system implementation during the transition period from conventional tillage [14], although once established, NT systems with and without a wheat cover crop were determined to numerically improve cotton lint yield compared to conventional tillage [15]. In addition, in another similar study DeLaune, et al. [16] determined no difference between no-till with a wheat cover crop, no-till with a mixed cover crop, no-till winter fallow, and conventional tillage under dryland conditions, averaged over a six year period on the Texas Rolling Plains [16]. However, it was determined that the no-till mix and no-till wheat systems produced roughly the same numerical increase in cotton lint yield compared to the conventional tillage system (9.5 and 9.4%, respectively) [16]. While the majority of these studies were conducted in ecoregions other than the SHP, a few studies have examined soil management impacts on cotton lint yield in this area. Bronson, et al. [17] and Keeling, et al. [18] determined no changes in cotton lint yield due to conservation tillage implementation compared to CT, although these studies were conducted with older varieties. These results are in contrast to a recent study on the SHP where a NT system with a rye cover crop was determined to produce reduced lint yield compared to a CT system in irrigated cotton production [19]. Due to the variable results in semi-arid systems and the difference in effects on the SHP compared to other areas across the country, it is important to continue to study these systems on the SHP to determine the feasibility of using cover crops and conservation tillage in the unstable climate of the SHP.
In addition to soil management practices, proper nutrient management is essential for productive plant growth, especially in NT and cover cropped systems where nutrient availability is likely to be influenced by added organic material [20]. Nitrogen (N) is one of the essential plant nutrients that can limit cotton yield if not available at levels required by the plant. The addition of N fertilizer increases cotton lint yield [21,22,23], while deficiencies of N can reduce the photosynthetic ability of the plant [22,24]. The effects of N timing in a cover-cropped cotton production system are less known. Previous research in the mid-south region of the USA has determined no effect of N timing on cotton lint yield [25] although this study was conducted under CT. Moreover, no overall trend in lint yield was determined for the best timing of N application in Alabama [26], while it was determined that a split application of N fertilizer resulted in greater lint yield in Greece [27], both of these being conducted in CT systems. However, like the small amount of data regarding the use of cover crops on the SHP, the timing of N fertilization has been understudied in the SHP semi-arid ecoregion (Köppen Climate Classification: BSk), particularly following a cover crop.
The objective of this study was to quantify the changes in lint yield due to NT and cover crop use, combined with altered N application timing, during a three year transition phase from CT with no winter cover crop. In addition, this study aimed to assess any changes in N uptake based on seed N concentrations after three years of cover crops, NT, and N fertilizer management. Specifically, it is hypothesized that there will be a reduction in cotton lint production in NT systems with a cover crop compared to CT systems. In addition, it was hypothesized that a split application of N fertilizer would result in an increase in cotton lint yield compared to an N fertilizer application at a single time point.

2. Materials and Methods

2.1. Site Descriptions

The study was conducted at the Texas A&M AgriLife Research and Extension Center in Lubbock, Lubbock County Texas (33.687°, −101.827°). The 30-year average rainfall and temperature (1981–2010) for the study site were 486 mm and 15.9 °C, respectively. Maximum monthly temperature, average monthly temperature, and monthly cumulative precipitation is for the study years is presented in Figure 1. Inorganic N (NO3 and NH4+) wet deposition was calculated to be 1.73 kg ha−1 in 2018 at this research site, based on wet deposition rates for that year collected at the Muleshoe National Wildlife Refuge Bailey [28]. The soil was an Acuff loam described as fine-loamy, mixed, superactive, thermic Aridic Paleustolls [29]. Soil characterization was conducted prior to the beginning of this study in 2016 [30] with an average pH of 7.4 and nitrate (NO3-N) concentration determined to be less than 7 mg kg−1 for all tillage systems. Conventional tillage was used on this land for at least 60 years before NT implementation in fall 2015. The research site was planted to cotton for 11 of the last 17 years, and during this time corn (Zea mays L.) was planted in 2003 and 2014, and sorghum (Sorghum bicolor) was planted in 2002, 2008, 2009, 2014, and 2015.

2.1.1. Experimental Design and Treatments

The study used a split-plot design with tillage system as the main factor and N fertilizer application timing (N treatment) as the split factor. Tillage systems included: no-till with a winter wheat (Triticum aestivum) cover crop (NTW), no-till winter fallow (NT) and conventional tillage winter fallow (CT) and were replicated 3 times. Nitrogen fertilizer application timings were arranged in a randomized complete block within each tillage. Nitrogen treatment included the following three levels: (1) no-added N (control); (2) 100% of N applied as a pre-plant application (PP); (3) 100% of N side-dressed applied (SD) at the cotton growth stage of pinhead square; (4) 40% of N applied PP and 60% SD applied (SPLIT); and, (5) 100% of N applied PP with a N stabilizer product (STB). Limus® Nitrogen Management (N-butyl-thiophosphoric triamide and N-Propyl-thiophosphoric triamide, BASF Corporation, Florham Park, NJ, USA), a dual-action urease inhibitor, was used as the stabilizer product. Within each of the three replicates, tillage as main plots were randomly assigned to 4 rows (1 m spacing) and N fertilizer treatments were randomly assigned within each main plot. There was a total of 45, 4-row plots 15 m in length.

2.1.2. Field Management

All field management practices are summarized in Supplementary Table S1. A wheat cover crop (TAM 304) was planted on 20 November 2015 (re-planted on 25 January 2016) for the 2016 season, and 22 November 2016 for the 2017 season, at a seeding rate of 67 kg ha−1. The 2018 wheat cover crop was initially planted on 18 November 2017 but failed after multiple plantings. Triticale (Trical 813; Triticale hexaploide Lart.) cover crop was planted on 15 Feb 2018 at a seeding rate of 67 kg ha−1 and established. Winter cover failures are likely on the SHP due to conditions at seeding and limited precipitation following cover crop planting. However, there was good establishment in the first two years of the study, and marginal establishment in the third year. Cover crop aboveground biomass was sampled (1 m2) at termination date, with data reported in McDonald, Lewis, Ritchie, DeLaune, Casey and Slaughter [30]. Aboveground biomass was not collected in 2018 due to the late planting date, and the cover present being small. Cover crops were chemically terminated on 13 April 2016, 20 April 2017, and 22 May 2018 using glyphosate [N-(phosphonomethyl)glycine] at 2.2 kg active ingredient (a.i.) ha−1 in 2016, 3.5 kg a.i. ha−1 in 2017 and 3.0 kg a.i. ha−1 in 2018.
All N fertilizer was applied at a total rate of 168 kg ha−1 as urea ammonium nitrate (UAN, 32-0-0) via knife injection using a coulter fertilizer applicator. On 10 May 2016, 11 May 2017, and 19 May 2018 PP N treatments were applied and on 13 July 2016, 20 July 2017, 16 July 2018 SD N treatments were applied to respective plots. Fields were prepared by shredding stalks with a four-row John Deere shredder (Moline, IL, USA) in all tillage systems for both 2016 and 2017, and the CT plots were then disked to a depth of 5–8 cm with a four-row John Deere offset disk. Trifluralin [α,α,α-trifluoro-2,6-dinitro-N,N-dipropyl-p-toluidine] was applied at 0.84 kg a.i. ha−1 and incorporated using a four-row spring tooth harrow to a depth of 5–8 cm in the CT system on 22 February 2016, 22 March 2017, and 24 April 2018. A bed lister was then used to re-form planting beds in the CT system. Tillage was conducted using a sweep cultivator in the CT system one time in each growing season at a depth of 5–8 cm. A rotary hoe was used to scratch all tillage systems about a week after planting in 2017, to a depth of about 1 cm, to encourage seed emergence and prevent soil crusting. Glyphosate was applied once in 2016 and 2017 for weed control, in addition to cover crop termination, at a rate of 2.7 kg a.i. ha−1 on 3 May 2016 and on 17 June 2017 at a rate of 3.4 kg a.i. ha−1 with 0.77 kg of spray adjuvant (AMS, ammonium sulfate). An application of 2,4-D (2,4-dichlorophenoxyacetic acid) was made on 6 April 2016 in the CT system at a rate of 2.1 kg a.i. ha−1. Engenia (dicamba: N,N-Bis-(3-aminopropyl)methylamine salt of 3,6-dichloro-o-anisic acid) was applied on 21 June 2018 at a rate of 0.28 kg a.i. ha−1. In addition, a combined application of Xtendimax (diglycolamine salt of dicamba, 3,6-dichloro-o-anisic acid) and glyphosate was made on 10 July and 13 August at a rate of 0.56 kg a.i. ha−1 dicamba and 1.8 kg a.i. ha−1 glyphosate in 2018. About 152 mm of furrow irrigation was applied on each of the following dates: 1 July 2016, 27 July 2016, 13 August 2016, 6 June 2017, 30 July 2017, 26 May 2018, 23 June 2018, and 6 August 2018.
Cotton (DP 1321 B2RF) was planted at a rate of 124,000 seeds ha−1 on 26 May 2016 and 6 June 2017. Cotton (DP 1518 B2XF) was planted at a rate of 130,000 seeds ha−1 on 24 May 2018. The variety of cotton planted was changed for 2018 to implement new herbicide technologies approved for use on the SHP. Emergence stand counts of cotton plants were conducted in 2018 by averaging the plant population within a 3-m long section of each of the middle two rows of each plot. Cotton was harvested using a modified two-row Case International Harvester 1400 cotton stripper (CNH Industrial, London, United Kingdom) on 14 November 2016, 15 November 2017, and 16 November 2018. Seed cotton was harvested from the center two rows of each plot and weighed using a portable scale. Grab samples were collected from harvested burr cotton and subsequently ginned to calculate seed and lint turnout and lint yield. Fiber quality was analyzed using high volume instrumentation (HVI) at the Texas Tech University Fiber and Biopolymer Research Institute (http://www.depts.ttu.edu/pss/fbri.php; Lubbock, TX 79412, USA) in 2017 and 2018.

2.2. Soil Characterization

Soil characterization was conducted prior to beginning the study in 2016 with composite samples collected from each replication of the tillage system. Samples were composited because no N treatments had been implemented at the time of sampling. Samples were collected to a depth of 15 cm. The average soil pH across all tillage systems was 7.4 and did not differ with tillage system (Table 1). Organic carbon (OC) for this soil was 5.2 g kg−1 when averaged across tillage systems. Total N (TN) averaged 0.7 g kg−1 across tillage systems, and neither OC nor TN differed due to the tillage system. It was determined that the wheat cover crop in the NTW system reduced NO3-N concentrations compared to the NT and CT systems without a cover crop, which supports previous reports of N use by cover crops (Table 1, [20]). No differences were determined for P, K, Ca, Mg, S, and Na among tillage systems.

2.3. Plant Nitrogen Analysis

Cotton seed was collected after ginning and acid delinted using sulfuric acid (66 deg. Baumé). In 2016, seeds were frozen at 20 °C before grinding. In 2017, seed was frozen with liquid N before grinding. Delinted seed was ground to pass a 2-mm sieve using an Analysenmühle mill (Analytical mill, IKA Works INC, Wilmington, NC, USA). Nitrogen concentrations were determined for seed via combustion analysis using an Elementar Vario Max CN (Elementar, Ronkonkoma, NY, USA) at the Texas A&M AgriLife Research and Extension Center in Vernon, TX [31,32,33] in 2016 and 2017. In 2018, cotton seed was collected from ginned cotton samples and analyzed via combustion analysis using an LECO elemental analyzer (LECO Corporation, St. Joseph, MI, USA) by Waters Agricultural Laboratories, Inc. (Camilla, GA, USA) for N concentration.

2.4. Nitrogen Use Efficiency

Agronomicefficiency (AE) of N was calculated as the increase in yield per unit of N applied to determine the best management strategy for timing of N fertilizer application. Agronomic N use efficiency was calculated for all years of the study (2016–2018) and was defined as: (Y-Y0)/F, where Y was lint yield with N fertilizer applied, Y0 was the control yield with no N applied, and F was the rate of fertilizer application in kg ha−1 [34]. Agronomic use efficiency was calculated within year due to a significant year effect on cotton lint yield.

2.5. Statistical Approach

Data were analyzed using Proc GLIMMIX at a significance level of a < 0.10 using SAS software version 9.4 [35]. The GLIMMIX procedure is a generalized linear mixed model that can incorporate random effects, and it can also be used to fit statistical models to data with nonconstant variability, as well as where the response is not normally distributed [36]. Year effects were determined as the interaction of year with tillage system, N treatment, and both tillage system and N treatment with year treated as a random effect. Main-plot treatments (NTW, NT, CT) and split-plot treatments (control, PP, SD, SPLIT, STB) were treated as fixed effects. Replication was treated as a random effect for cotton lint yield, fiber quality, and stand count due to the lack of N treatment effects, and thus the statistical testing of only tillage differences. In addition, cover crop biomass, was analyzed with replication as the random effect due to only one tillage system being tested. Finally, seed N concentration and AE were tested using replication and replication by tillage as random effects for within year analysis. Fischer’s protected LSD (a < 0.05) was used to separate means of significant impacts.

3. Results

3.1. Cover Crop Biomass

On the SHP, wheat cover crop growth is heavily dependent upon winter precipitation, which was scarce in 2017 and 2018. Due to the lack of precipitation, and the late establishment of the cover crop in 2018, cover crop biomass was not collected in 2018. Wheat biomass data were previously published [30]. The aboveground biomass of the wheat cover crop in 2016 and 2017 was affected by the interaction of year and N treatment (p < 0.001) and was analyzed within each year of the study. Nitrogen treatment did not affect cover crop biomass in the first year of the study (p = 0.279). No treatments had been implemented prior to planting this cover crop, so no difference was expected. Mean cover crop biomass in 2017 was 3180 kg ha−1. Nitrogen treatment did affect cover crop biomass in the second year of the study (p = 0.027), with the PP (1547 kg ha−1) SD (1795 kg ha−1) and SPLIT (1655 kg ha−1) treatments producing greater biomass than the control (822 kg ha−1). In addition, the SPLIT treatment produced greater biomass than the STB (1092 kg ha−1) treatment. When analyzed within year, there is no relationship between cover crop biomass and cotton lint yield (2016: p = 0.913; 2017: p = 0.53).

3.2. Cotton Lint Yield

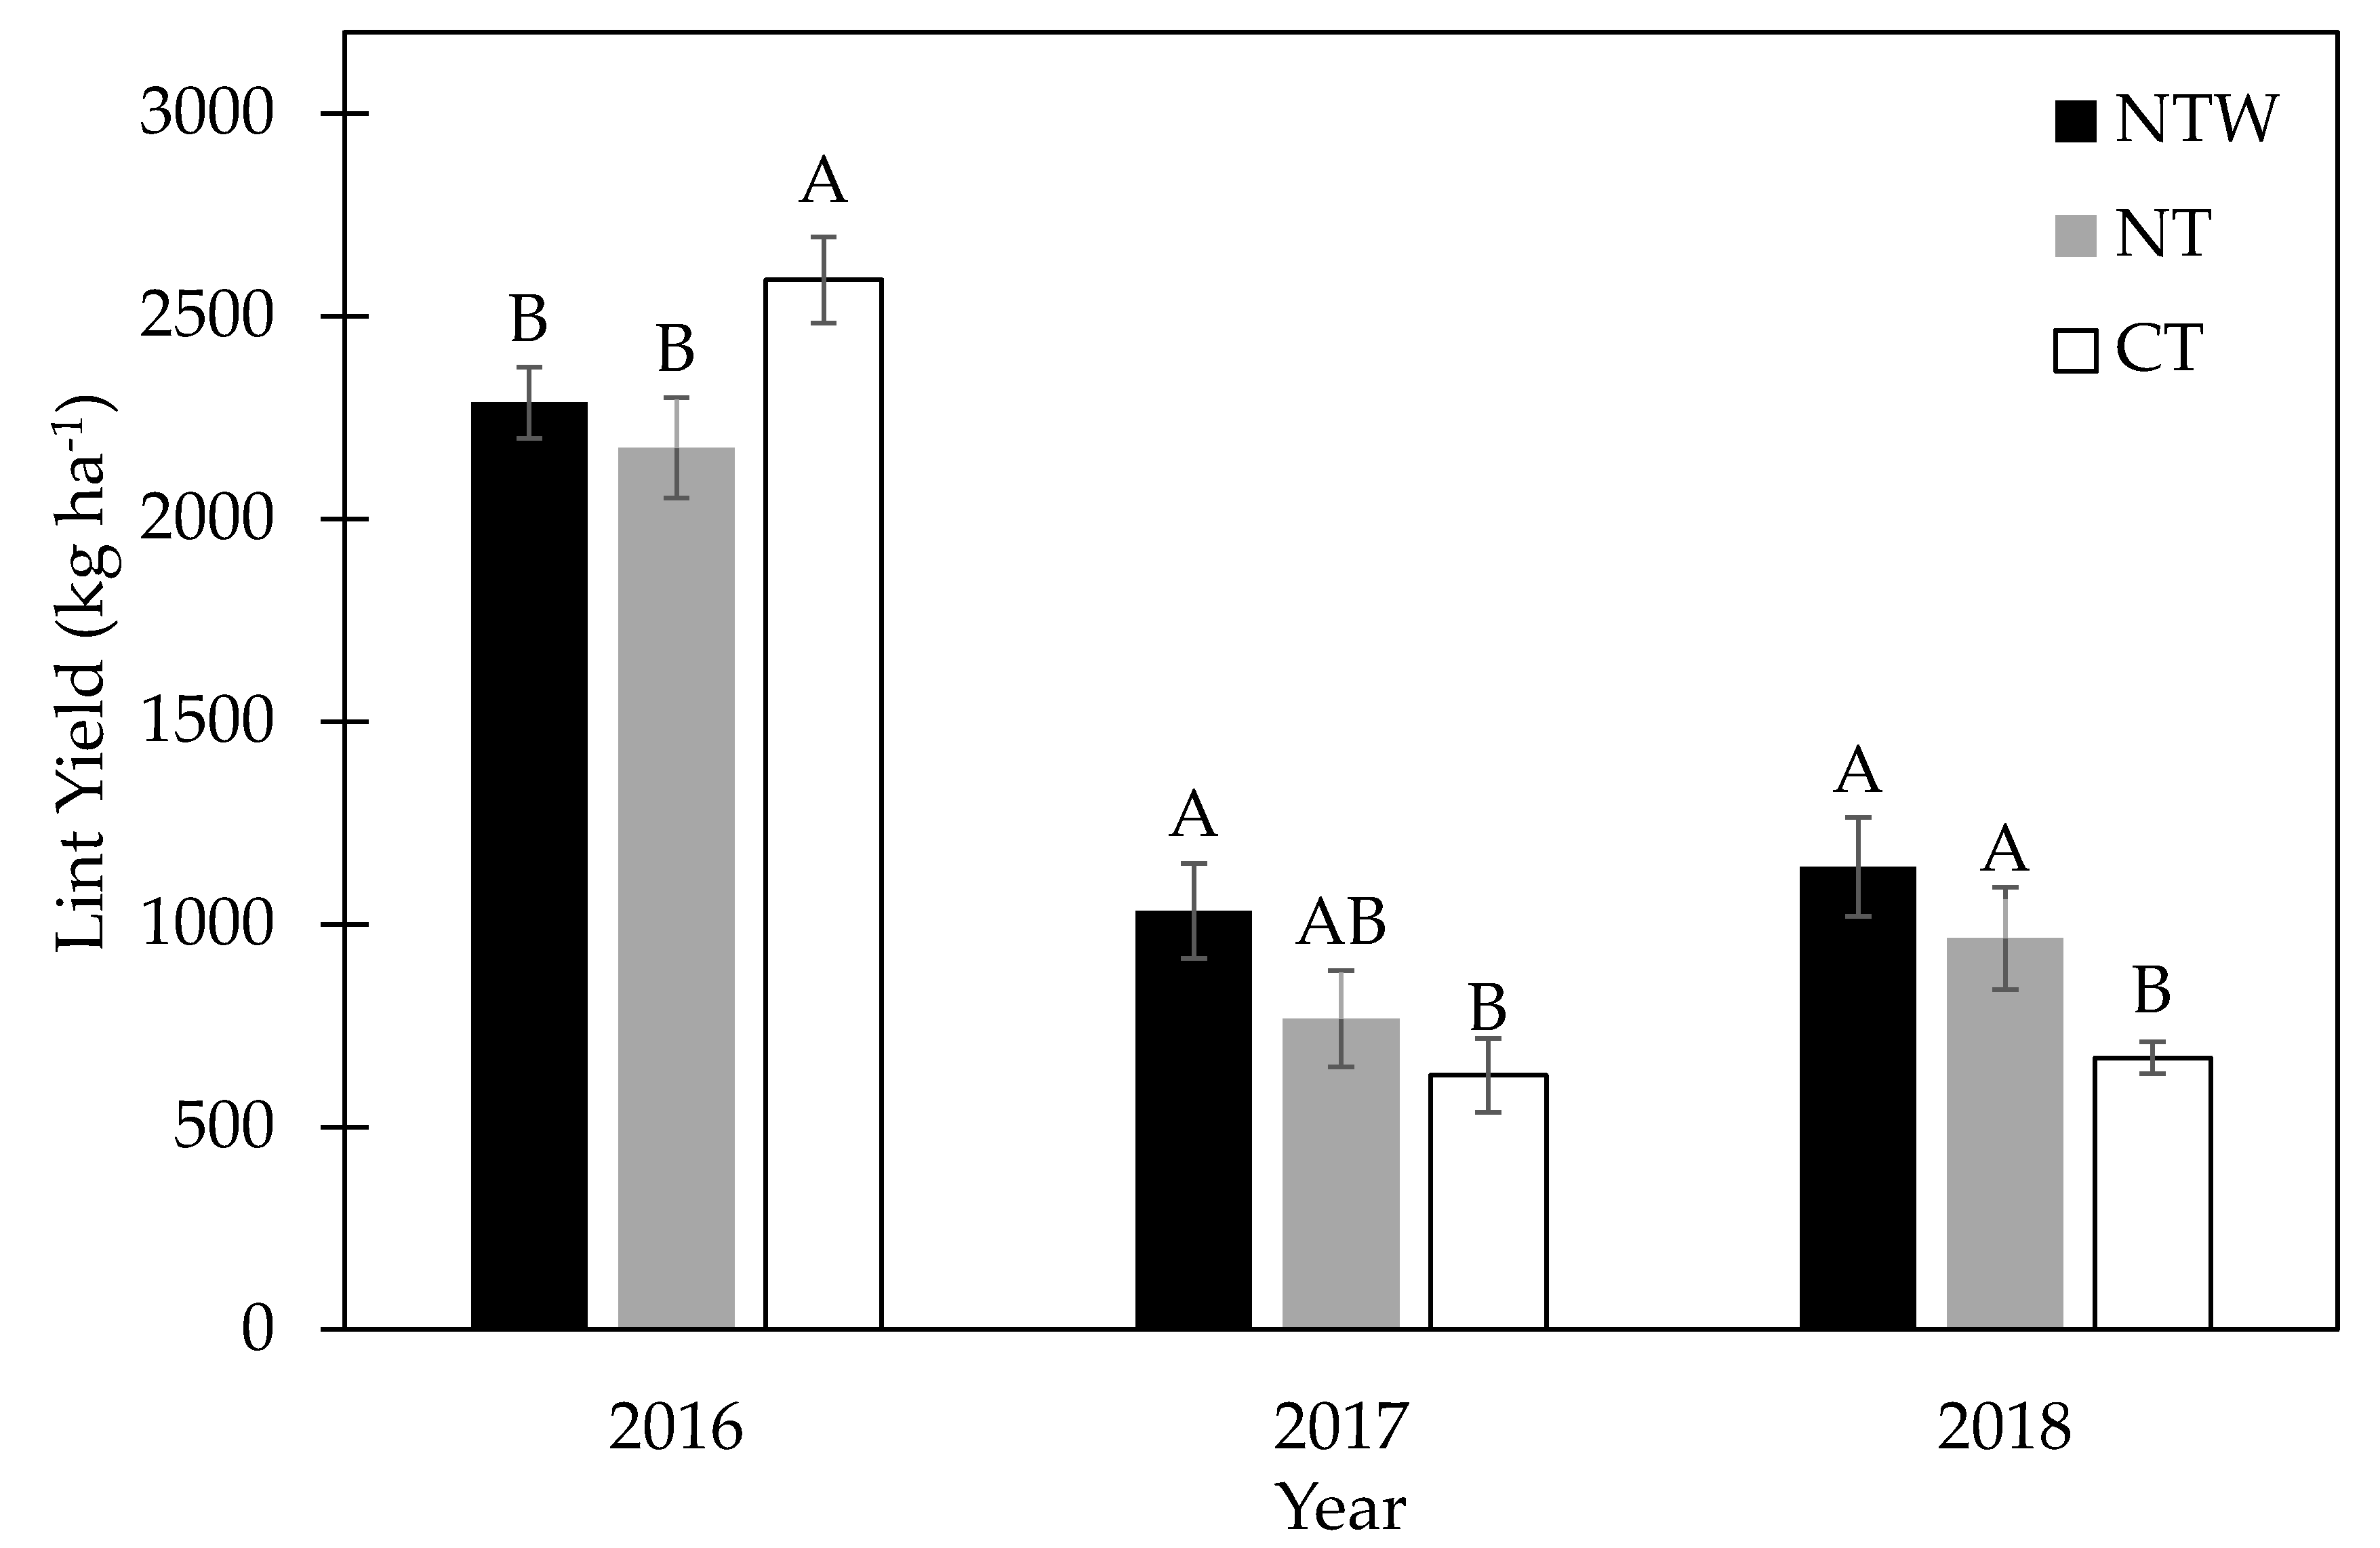
Lint yield was affected by the interaction of tillage system and year (p = 0.004) with yields in 2016 ranging from 2175 kg ha−1 to 2589 kg ha−1, 627 kg ha−1 to 1032 kg ha−1 in 2017, and 670 kg ha−1 to 1141 kg ha−1 in 2018 (Figure 2). Average monthly temperatures during seedling emergence were 21 and 27 °C in May and June 2017, respectively, and 26 and 28 °C in May and June 2018, respectively, compared to 20 and 26 °C in 2016 (Figure 1a–c). Maximum daily high temperatures were 39 °C or above in May 2017 and 2018 and above 42 °C in June 2017 and 2018 compared to 35 and 40 °C in May and June 2016, respectively (Figure 1a–c). Precipitation was reduced in 2017 and 2018 (34.5 and 66.6 mm, respectively) compared to 2016 (119.4 mm). With potential plant stand differences due to the cover crop protection observed in 2017, plant stand data were collected in 2018. Greater average plant populations were determined in the NTW system (75,908 plants ha−1) and the NT system (67,725 plants ha−1) compared to the CT system (56,527 plants ha−1; p = 0.016).
No split plot (N treatment), or interaction effects between the tillage system and N treatment were determined within any year of the study (Table 2). In 2016, the CT system produced approximately 300 kg ha−1 and 415 kg ha−1 more cotton lint than the NTW and NT systems, respectively (Figure 1). The 2016 growing season was the first season following NTW and NT implementation and cover crops, and it was determined that tillage system affected lint yield (Table 2), with the CT system producing greater cotton lint than the NTW and NT systems (Figure 2). Tillage also affected lint yield in both 2017 and 2018 (Table 2), with the NTW system producing greater lint yield compared to the CT system in both years (Figure 2). There was not a difference between the NT system compared to the NTW and CT systems in 2017 and 2018 (Figure 2). Nitrogen treatment did not affect lint yield in any of the three study years (Table 2).

3.3. Fiber Quality

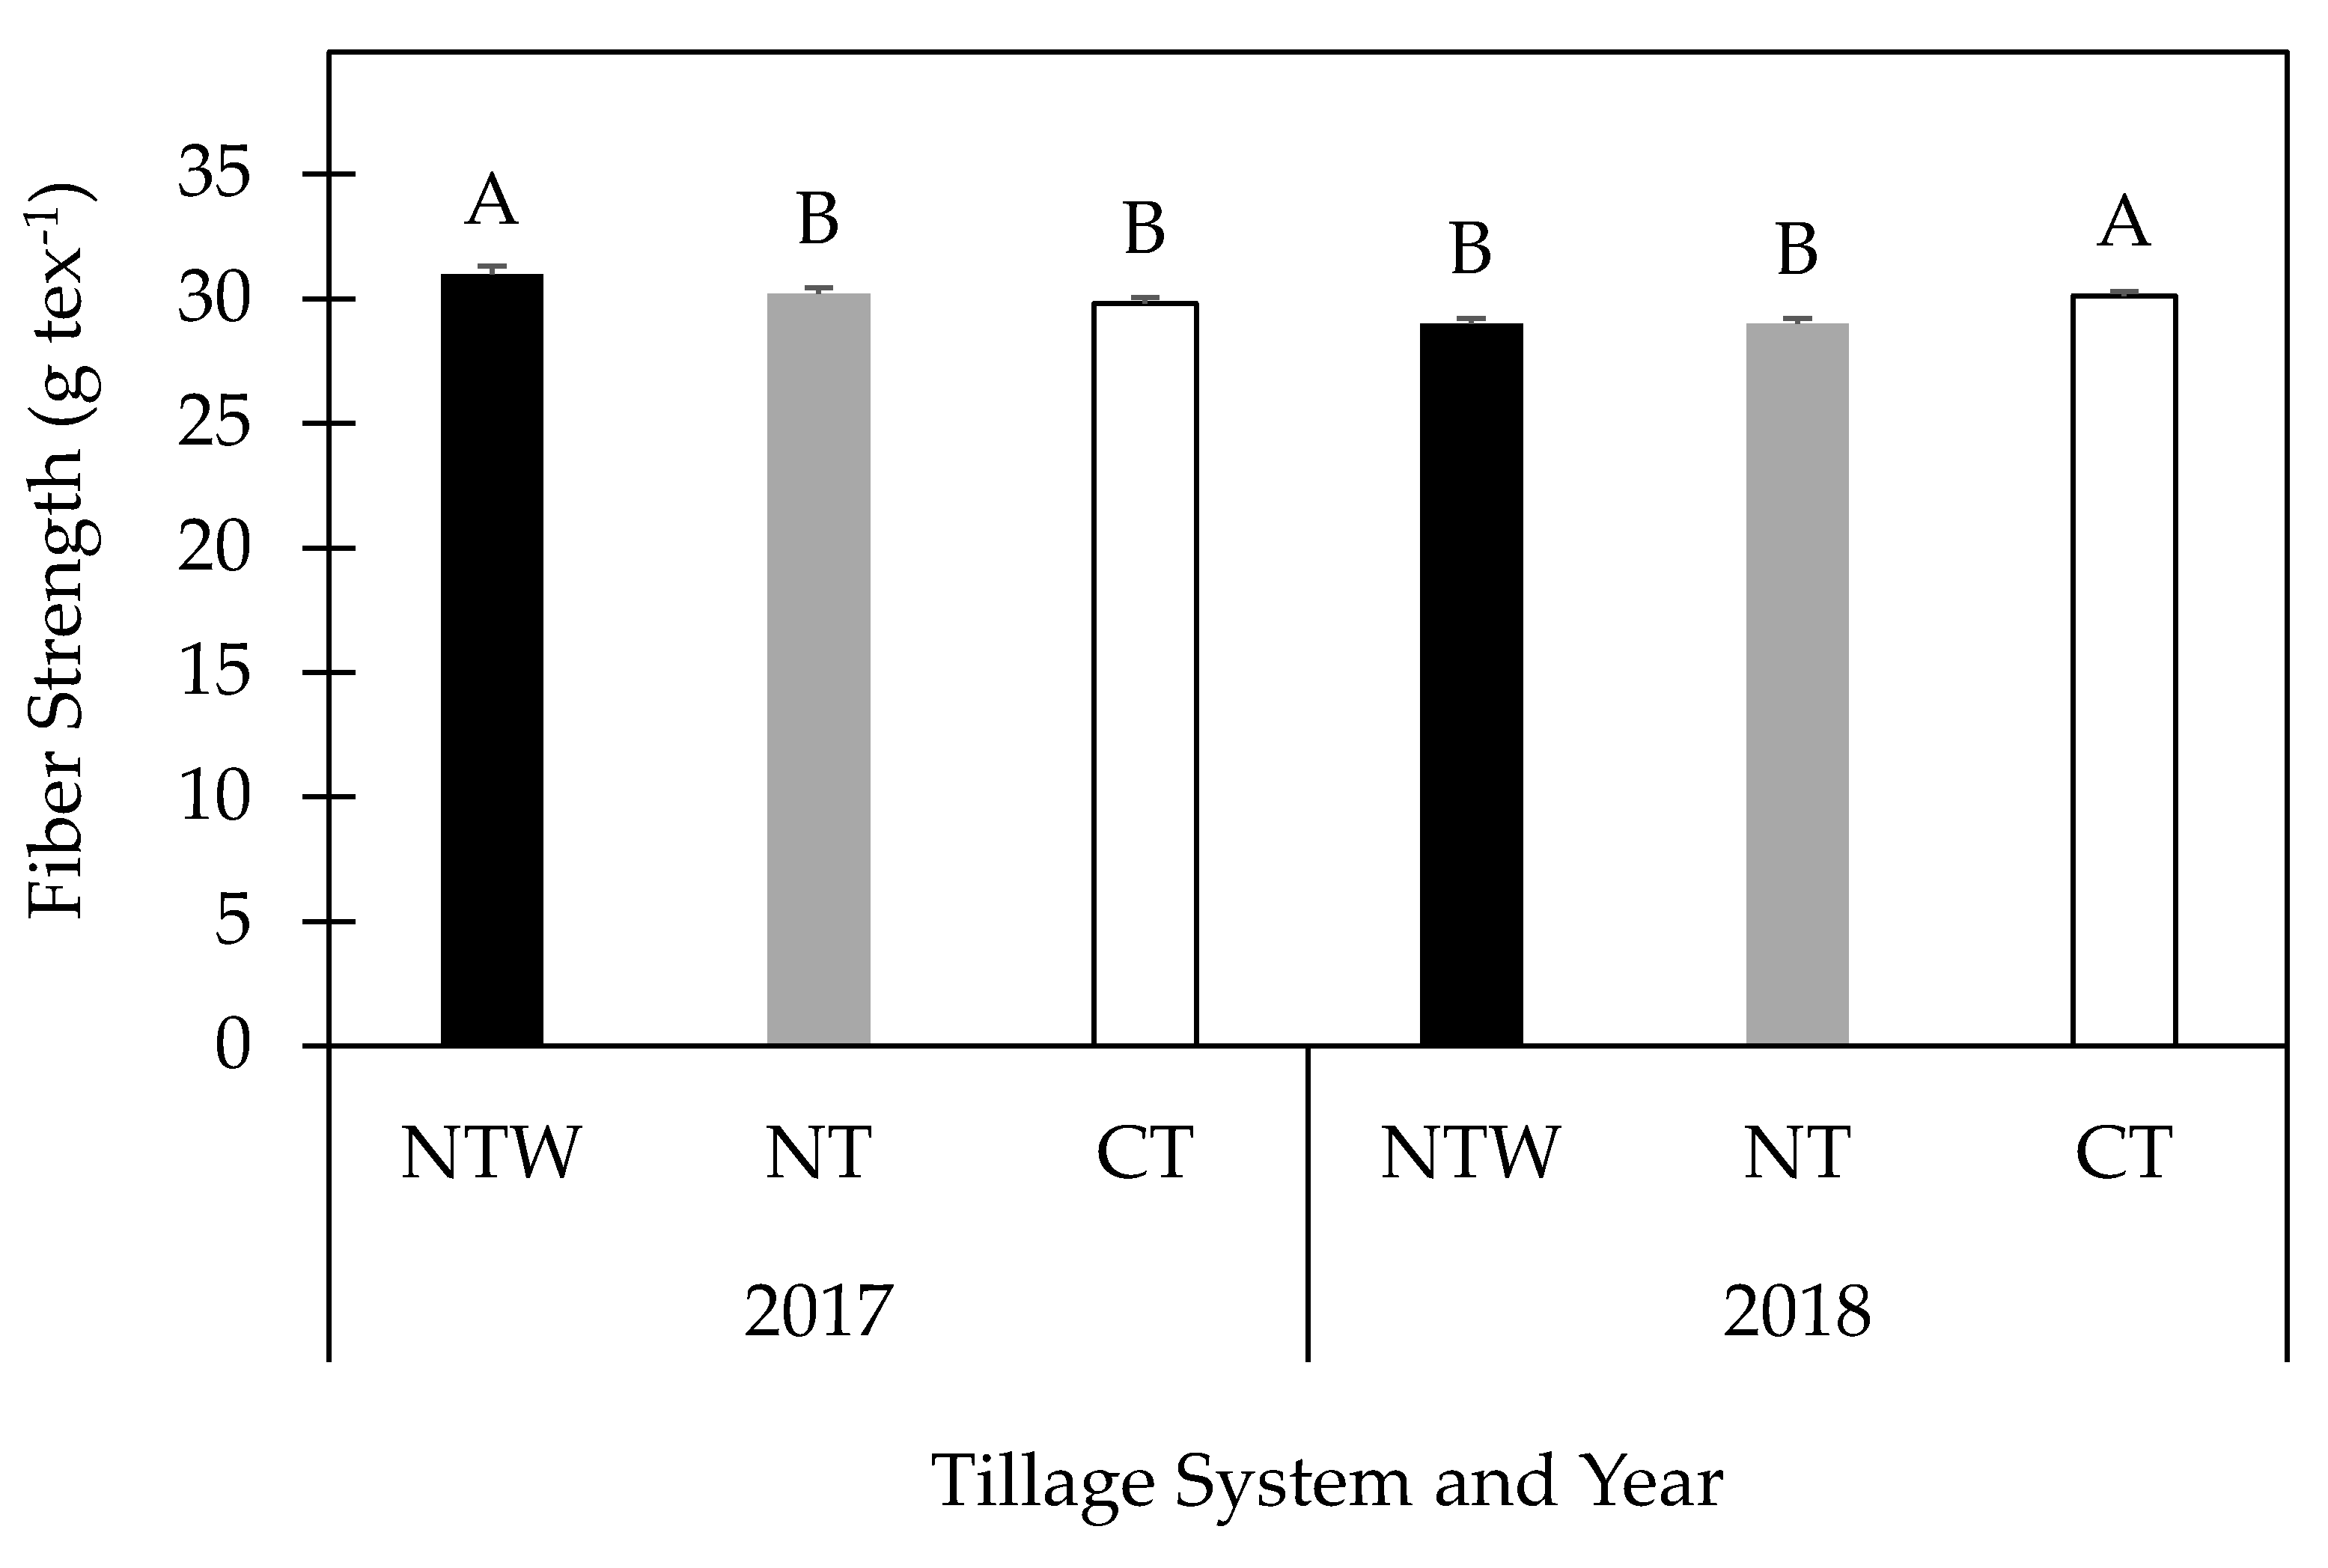
Fiber strength was the only fiber quality parameter affected by the interaction of year and tillage system (p < 0.001) and was analyzed within year. Tillage system affected fiber strength in 2017 (p = 0.011) and 2018 (p < 0.001) with the NTW system having greater fiber strength compared to the NT and CT system in 2017 (Figure 3). In 2018, the CT system produced cotton lint with greater fiber strength than the NTW and NT systems (Figure 3). Fiber strength was not determined to be affected by the timing of N in the second and third year of N treatment implementation (2017: p = 0.21; 2018: p = 0.73).
Due to the determination of a year effect on fiber strength additional fiber quality parameters were analyzed within the year including: micronaire, uniformity, and length. No differences between tillage systems were determined for any of the additional fiber quality parameters, with the exception of micronaire in 2017 (p = 0.002) where the NTW (3.2) and NT (3.1) systems produced cotton lint with more micronaire than the CT system (2.9).

3.4. Agronomic Use Efficiency

The agronomic use efficiency of N was analyzed within each year due to its dependence on yield as a significant factor which was affected by study year. No effect on AE was determined for tillage system, N treatment, or their interaction in the three years of the study (Table 3).

3.5. Plant Seed N

Seed N concentration was analyzed within year due to the significant effect of year on cotton yield. There were no seed N concentration differences in 2016 or (Table 4). In 2018, reduced N concentrations in the control compared to the rest of the N treatments were determined (Table 4, Figure 4).

4. Discussion

4.1. Cover Crop Biomass

An increase in cover crop biomass was expected for the SD and SPLIT treatments compared to the PP and STB treatments, as they represent the mid-season application of N for this study, and thus are likely to have greater residual N for the cover crop to use after the cotton growing season. In addition, an increase in cover crop biomass was expected between added N treatments and the control, and was determined for the SD and SPLIT treatments. However, there was no difference in biomass between mid-season applied treatments, SD and SPLIT, and the PP treatment which indicates potentially similar NUE for the cotton crop regardless of N fertilizer application timing leaving low levels of N for the cover crop to use. The lack of a relationship between cover crop biomass and cotton lint yield in 2016 was expected, as the wheat cover crop was grown prior to any N treatments being implemented, and there was likely consistent plant available N across the entire study area. After one year of treatment implementation, there was still no correlation between wheat aboveground biomass and yield, which may point to a longer time period for the presence of wheat cover to impact lint yield. Any cover crop growth on the SHP should provide intrinsic benefits to the system as a major purpose for cover crop use is wind erosion mitigation through increasing the turbidity of wind at the soil surface, reducing the potential for wind damage.

4.2. Cotton Lint Yield

The reduced lint yield in 2017 and 2018 compared to 2016 was likely due to residual N use in 2016 which increased cotton lint yields compared to 2017 and 2018 and may have also been affected by environmental conditions (Figure 2). Environmental conditions in 2017 and 2018 included reduced precipitation and higher temperatures early in the growing season, which may have decreased cotton seedling emergence, thus reducing yield. When evaluated in 2018, it was determined that the no-till systems (NTW and NT) had more abundant plant stands compared to the CT system, likely indicating the inherent benefits of NT on the SHP as it relates to reducing wind erosion. However, NT without a cover crop is often not a viable system in semi-arid, high-wind areas such as the SHP, where producers often need to run implements, sand fighters, to form soil clods after a rain [5]. These clods increase the turbidity of the air at the soil surface and can reduce wind erosion. When using a strictly NT system without a cover crop, there may be the potential for more significant wind erosion and crop damage due to the erodibility of sandy soils without crop residue [5] and the lack of tillage or sand fighting in the NT system to increase turbidity.
The maintenance and improvement between NT systems with and without a cover crop compared to CT systems (Figure 1) agrees with recent research on the semi-arid Texas Rolling Plains, where cotton lint yield was not affected by tillage practice during the transition from CT to conservation tillage system and increases in lint yield were determined once treatments had established [14,15]. Cotton lint yield in all three tillage systems in 2017 and 2018 were reduced compared to the tillage systems in 2016.
The increase for the NTW system compared to the CT system in the latter years may be due to early season protection of the cotton seedlings from harsh climatic conditions including high temperatures, decreased precipitation and wind erosion (Figure 1a–c). Temperatures reaching 39 °C in May and 44 °C in June and high winds throughout the early growing season in 2017 likely reduced cotton seedling emergence and vigor in both the CT and the NT plots (data not collected). The residue from the winter cover in the NTW system likely protected from blowing sand, allowing cotton seedlings to establish better compared to the CT and NT system. It is prudent to note the lack of difference in cotton lint yield between the NTW and NT systems in all three years of the study, although numerical increases were present for the NTW system (Figure 1). The increase for the NTW and NT system compared to the CT system also indicates the inherent benefit of wind erosion mitigation of NT on the SHP. Wind erosion can cause severe crop damage and even crop failure on the SHP [5], while the mitigation of wind erosion by using a cover crop and NT maintains or slightly improves cotton lint yield soon after implementation, as determined in this study. Although not significant, there was a numerical increase in plant abundance for the NTW system compared to the NT system with an average increase of over 8000 plants ha−1. This agrees with the numerical, but not significant, increase in cotton lint yield for the NTW system compared to the NT system in 2018 (Figure 1). Often, it is assumed that there will be a yield deficit in the first few years of cover crop and NT implementation particularly in dry climates, although the increase in lint yield for the NT and NTW systems compared to the CT system agrees with previous research with NT systems where no difference in cotton yield was determined across studies, especially in dry climates [37].
Often, yield benefits are not seen for several years or at all following implementation of conservational tillage systems. Lewis et al. [19] reported in a long term study in the SHP, that after 17 years a CT system without a cover crop had greater cotton lint yields than a NT system with a rye cover crop [19], which may point to variable impacts across the ecoregion due to soil type and other unmeasured factors. When compared to average irrigated lint yields on the SHP (1087 kg ha−1) [38], lint yield in the NTW system (approximately 1032 kg ha−1) in 2017 was just below the average yield, while in 2018 lint yield in the NTW and NT systems (1142 kg ha−1 and 965 kg ha−1, respectively) were numerically greater than the average lint yield across the SHP (808 kg ha−1, NASS 2018).
The lack of a N treatment effect on cotton lint yield supports previous research that determined the timing of N fertilizer application does not affect yield when the rate of application is unchanged [25,26]. The lack of differences in lint yield between N treatments and the control may be due to several factors including: residual N deeper in the soil profile than was measured, which did not result in N deficiency in the control with no added N; environmental conditions; and, NO3-N in the irrigation water. Agronomic efficiency was not affected by altering the timing of N fertilizer application for any year of this study (Table 3). Related to the lack of N treatment differences on cotton lint yield, it was expected that AE would not vary between the timings of N application. The lack of AE difference was also likely due to the application of N through irrigation water, which would apply a small amount of N at various points throughout the year, potentially leading to comparable N use efficiencies across the tillage systems and N treatments of this three-year study.
The concentration of NO3-N in the irrigation water was determined to be 8.44 mg kg−1 in 2018, and NO3-N additions through irrigation were determined based on this concentration (Table 4). This concentration of NO3-N is not uncommon in the area, and falls within the general average of 3 to 10 mg kg−1 in Texas [39]. Average N addition due to irrigation was about 39 kg NO3-N ha−1 per year [39]. With this addition of N in the irrigation water, the timing of N application becomes more complicated as NO3-N is added with each irrigation. This reduces the ability to accurately predict which timing of N fertilizer would be most effective for these systems. Unplanned N addition through the irrigation water may mask any effects of one fertilizer application timing compared to the others and should be accounted for when examining these types of systems in the future.

4.3. Fiber Quality

Fiber strength was affected by tillage system in 2017 and 2018 (Figure 3). Late season rains have long been known to decrease fiber strength [40]. The shift in precipitation from July/August in 2017 to September/October in 2018 with the potential for reduced evaporation in the NTW and NT systems compared to the CT system was likely the cause of the difference between years. Previous research indicates little to no difference in fiber quality between conservation tillage implementation, with or without cover crops, compared to CT systems [9,10,13]. The addition of N fertilizer has been reported to increase fiber strength [22,41], although this was not determined in this study, likely due to the addition of NO3-N through irrigation water and the use of a single N rate across the study with the exception of the control.
When other fiber quality parameters were analyzed within year, it was determined that micronaire was affected by the tillage system in 2017. Micronaire is used as an indication of fiber maturity, with values between 3.5–3.6 and 4.3–4.9 being considered as the base level. However, all micronaire values determined for the cotton lint produced in 2017 would be classified as discount grades (3.4 and under, 5.0 and above), while the average micronaire value across the SHP in 2017 was 3.2 [42]. Micronaire increases in the NTW and NT systems compared to the CT system in 2017 may be due to better establishment due to the benefits of no-tillage systems and thus earlier boll development, resulting in greater heat unit accumulation and a more mature cotton fiber [43]. Due to the large effect of breeding and environment on fiber quality, it is important to continue to evaluate these parameters as cotton varieties and the environment changes on the SHP.

4.4. Plant Seed N

Cotton seed N concentration is a good measure of plant N use as it has been shown to constitute up to 70% of cotton N uptake [44]. A reduction in seed N concentration was determined for the control compared to the applied N treatments in 2018 (Table 4, Figure 4). The reduction in seed N concentration in the control would be expected as there was no application of N fertilizer. The delayed reduction in seed N concentration between N treatments and the control until the third year (2018) potentially indicates the use of residual N to satisfy cotton N demands in the control during the first two years. Previous research has indicated a critical seed N concentration threshold for yield reduction of about 35 g kg−1 [45] which all N treatments surpassed during this study with the exception of the control in 2018 (33.6 g kg−1, Figure 4). Egelkraut, Kissel, Cabrera, Gascho and Adkins [45] determined that above this critical threshold no lint yield increase would be observed, which was supported by the lack of a N treatment effect on cotton lint yield over this three-year period (Table 2). Previous studies have indicated a correlation between N fertilizer rate and cotton seed N concentration, with seed N in excess of 35 g kg−1 indicating over-fertilization [46]. Due to an average seed N concentration of 38.7 g kg−1, and the lack of correlation between seed N concentrations and cotton yield, it is possible that fertilizer N rates are above optimal based on this metric. In addition, with all seed N concentrations being greater than the critical threshold with the exception of the control in 2018, it is clear that the addition of N through irrigation water has a significant effect on cotton N uptake. With these seed N concentrations providing support for irrigation N addition effects on cotton lint yield as well, and further indicating irrigation N addition effects on cotton lint yield on the SHP.

5. Conclusions

The use of a combination of a wheat cover crop and NT can improve yield on the SHP in the first three years of implementation compared to CT without a cover crop. When considering the integration of cover crops and NT in a semi-arid region which experiences extremes in climatic conditions, it is important to consider the early season protection of the soil and cotton seedlings. In addition, in-season moisture stress mitigation afforded by the cover crop residue and reduced tillage is a potentially important benefit of a NTW system. The ability to mitigate extreme heat and wind is important on the SHP where these conditions are common. When making recommendations for best N management practices, timing of fertilizer application is usually included, although in newly implemented conservation tillage systems on the SHP it is critical to also consider irrigation N addition in any nutrient calculations. This is important to consider, as the rate of N application may be a greater determinant for AE in this eco-region and should be evaluated further.

Supplementary Materials

The following are available online at https://www.mdpi.com/2073-4395/10/7/994/s1, Table S1: Field operations in 2016, 2017, and 2018.

Author Contributions

Conceptualization, K.L.L.; Formal analysis, M.D.M.; Funding acquisition, K.L.L.; Investigation, M.D.M.; Supervision, K.L.L. and G.L.R.; Writing—original draft, M.D.M.; Writing—review & editing, K.L.L. and G.L.R. All authors have read and agreed to the published version of the manuscript.

Funding

This research received no external funding.

Acknowledgments

The authors would like to thank the Soil Fertility and Chemistry Lab Group at Texas A&M AgriLife Research, Lubbock for their help in maintaining field operations and conducting data collection.

Conflicts of Interest

The authors declare no conflict of interest.

References

  1. National Resource Conservation Service. Land resource regions and major land resource areas of the United States, the Caribbean, and the Pacific Basin. In US Department of Agriculture Handbook; Agriculture, United States Department of Agriculture: Washington, DC, USA, 2006; Volume 296. [Google Scholar]
  2. Lal, R.; Reicosky, D.C.; Hanson, J.D. Evolution of the plow over 10,000 years and the rationale for no-till farming. Soil Till. Res. 2007, 93, 1–12. [Google Scholar] [CrossRef]
  3. Baumhardt, L. Dust Bowl Era. In Encyclopedia of Water Science, Second Edition (Print Version); CRC Press: Boca Raton, FL, USA, 2003; pp. 246–250. [Google Scholar] [CrossRef]
  4. Zobeck, T.M.; Bilbro, J.D. Crop productivity and surface soil properties of a severely wind-eroded soils. In Proceedings of the Sustaining the Global Farm. 10th International Soil Conservation Organization Conference, West Lafayette, IN, USA, 23–28 May 1999. [Google Scholar]
  5. Zobeck, T.M.; van Pelt, R.S. Wind Erosion. In Soil Management: Building a Stable Base for Agriculture; Hatfield, J.L., Sauer, T.J., Eds.; Soil Science Society of America: Madison, WI, USA, 2011; pp. 209–227. [Google Scholar] [CrossRef]
  6. National Agriculture Statistics Service. Quick Stats—Texas Land Use Practices. Available online: https://quickstats.nass.usda.gov/results/2D65C1DB-B947-370D-8DD9-82AA17CAC756 (accessed on 17 May 2018).
  7. United States Department of Agriculture, National Agriculture Statistics Service. Cotton Production; USDA, Ed.; National Agricultural Statistics Service: Austin, TX, USA, 2017.
  8. National Agriculture Statistics Service. Quick Stats—US Total Cotton Production. Available online: https://quickstats.nass.usda.gov/results/40B70CDD-296F-3192-88D3-9BB60985F40D (accessed on 21 May 2018).
  9. Balkcom, K.S.; Reeves, D.W.; Shaw, J.N.; Burmester, C.H.; Curtis, L.M. Cotton yield and fiber quality from irrigated tillage systems in the Tennessee Valley. Agron. J. 2006, 98, 596–602. [Google Scholar] [CrossRef] [Green Version]
  10. Boquet, D.J.; Hutchinson, R.L.; Breitenbeck, G.A. Long-term tillage, cover crop, and nitrogen rate effects on cotton: Yield and fiber properties. Agron. J. 2004, 96, 1436–1442. [Google Scholar] [CrossRef]
  11. Raper, R.; Reeves, D.; Burmester, C.; Schwab, E. Tillage depth, tillage timing, and cover crop effects on cotton yield, soil strength, and tillage energy requirements. Appl. Eng. Agric. 2000, 16, 379. [Google Scholar] [CrossRef] [Green Version]
  12. Daniel, J.B.; Abaye, A.O.; Alley, M.M.; Adcock, C.W.; Maitland, J.C. Winter annual cover crops in a Virginia no-till cotton production system: II. cover crop and tillage effects on soil moisture, cotton yield, and cotton quality. J. Cotton Sci. 1999, 3, 84–91. [Google Scholar]
  13. Bauer, P.J.; Busscher, W.J. Winter cover and tillage influences on coastal plain cotton production. J. Prod. Agric. 1996, 9, 50–54. [Google Scholar] [CrossRef]
  14. DeLaune, P.B.; Sij, J.W.; Park, S.C.; Krutz, L.J. Cotton production as affected by irrigation level and transitioning tillage systems. Agron. J. 2012, 104, 991–995. [Google Scholar] [CrossRef]
  15. DeLaune, P.B.; Mubvumba, P.; Ale, S.; Kimura, E. Impact of no-till, cover crop, and irrigation on Cotton yield. Agric. Water Manag. 2020, 232, 106038. [Google Scholar] [CrossRef]
  16. DeLaune, P.B.; Mubvumba, P.; Fan, Y.; Bevers, S. Agronomic and economic impacts of cover crops in Texas Rolling Plains cotton. Agrosystems Geosci. Environ. 2020, 3, e20027. [Google Scholar] [CrossRef] [Green Version]
  17. Bronson, K.; Onken, A.; Keeling, J.; Booker, J.; Torbert, H. Nitrogen response in cotton as affected by tillage system and irrigation level. Soil Sci. Soc. Am. J. 2001, 65, 1153–1163. [Google Scholar] [CrossRef]
  18. Keeling, W.; Segarra, E.; Abernathy, J.R. Evaluation of conservation tillage cropping systems for cotton on the Texas Southern High Plains. J. Prod. Agric. 1989, 2, 269–273. [Google Scholar] [CrossRef]
  19. Lewis, K.L.; Burke, J.A.; Keeling, W.S.; McCallister, D.M.; DeLaune, P.B.; Keeling, J.W. Soil benefits and yield limitations of cover crop use in Texas High Plains cotton. Agron. J. 2018, 110, 1616–1623. [Google Scholar] [CrossRef]
  20. Lyons, S.E.; Ketterings, Q.M.; Godwin, G.; Cherney, J.H.; Czymmek, K.J.; Kilcer, T. Early fall planting increases growth and nitrogen uptake of winter cereals. Agron. J. 2017, 109, 795–801. [Google Scholar] [CrossRef]
  21. Nelson, W.L. The Effect of Nitrogen, Phosphorus, and Potash on Certain Lint and Seed Properties of Cotton1. Agron. J. 1949, 41, 289–293. [Google Scholar] [CrossRef]
  22. Read, J.J.; Reddy, K.R.; Jenkins, J.N. Yield and fiber quality of Upland cotton as influenced by nitrogen and potassium nutrition. Eur. J. Agron. 2006, 24, 282–290. [Google Scholar] [CrossRef]
  23. Singh, Y.; Rao, S.S.; Regar, P.L. Deficit irrigation and nitrogen effects on seed cotton yield, water productivity and yield response factor in shallow soils of semi-arid environment. Agric. Water Manage. 2010, 97, 965–970. [Google Scholar] [CrossRef]
  24. Wullschleger, S.D.; Oosterhuis, D.M. Photosynthetic carbon production and use by developing cotton leaves and bolls. Crop Sci. 1990, 30, 1259–1264. [Google Scholar] [CrossRef]
  25. Pettigrew, W.T.; Adamczyk, J.J. Nitrogen Fertility and Planting Date Effects on Lint Yield and Cry1Ac (Bt) Endotoxin Production. Agron. J. 2006, 98, 691–697. [Google Scholar] [CrossRef]
  26. Mullins, G.L.; Monks, C.D.; Delaney, D. Cotton response to source and timing of nitrogen fertilization on a sandy Coastal Plain soil. J. Plant Nutr. 2003, 26, 1345–1353. [Google Scholar] [CrossRef]
  27. Setatou, H.B.; Simonis, A.D. Effect of time and rate of nitrogen application on cotton. In Fertilizers and Environment: Proceedings of the International Symposium “Fertilizers and Environment”, Held in Salamanca, Spain, 26–29 September 1994; Rodriguez-Barrueco, C., Ed.; Springer: Dordrecht, The Netherlands, 1996; pp. 121–125. [Google Scholar] [CrossRef]
  28. National Atmospheric Deposition Program (NRSP-3); NADP Program Office, Wisconsin State Laboratory of Hygiene: Madison, WI, USA, 2020.
  29. U.S. Department of Agriculture. National Resource Conservation Service Acuff Soil Series. Available online: https://soilseries.sc.egov.usda.gov/OSD_Docs/A/ACUFF.html (accessed on 17 May 2018).
  30. McDonald, M.D.; Lewis, K.L.; Ritchie, G.L.; DeLaune, P.B.; Casey, K.D.; Slaughter, L.C. Carbon dioxide mitigation potential of conservation agriculture in a semi-arid agricultural region. Aims Agric. Food 2019, 4, 206–222. [Google Scholar] [CrossRef]
  31. McGeehan, S.L.; Naylor, D.V. Automated instrumental analysis of carbon and nitrogen in plant and soil samples. Commun. Soil Sci. Plant Anal 1988, 19, 493. [Google Scholar] [CrossRef]
  32. Schulte, E.E.; Hopkins, B.G. Estimation of Soil Organic Matter by Weight by Weight Loss-on-Ignition. In Soil Organic Matter: Analysis and Interpretation; Magdoff FR, T.M., Hanlon, E.A., Jr., Eds.; Soil Science Society of America: Madison, WI, USA, 1996; pp. 21–32. [Google Scholar]
  33. Storer, D.A. A simple high volume ashing procedure for determining soil organic matter. Commun. Soil Sci. Plan. 1984, 15, 759–772. [Google Scholar] [CrossRef]
  34. Snyder, C.S.; Bruulsema, T.W. Nutrient Use Efficiency and Effectiveness in North America: Indices of Agronomic and Environmental Benefit; International Plant Nutrition Insititue (IPNI): Norcross, GA, USA, 2007. [Google Scholar]
  35. SAS Institute. SAS/STAT Software—The GLIMMIX Procedure. Available online: https://support.sas.com/rnd/app/stat/procedures/glimmix.html (accessed on 26 April 2018).
  36. SAS Institute. Base SAS® 9.4 Procedures Guide: Statistical Procedures, 2nd ed.; SAS Institute Inc.: Cary, NC, USA, 2013. [Google Scholar]
  37. Pittelkow, C.M.; Linquist, B.A.; Lundy, M.E.; Liang, X.; van Groenigen, K.J.; Lee, J.; van Gestel, N.; Six, J.; Venterea, R.T.; van Kessel, C. When does no-till yield more? A global meta-analysis. Field Crop. Res. 2015, 183, 156–168. [Google Scholar] [CrossRef] [Green Version]
  38. National Agriculture Statistcs Service. Quick Stats—Texas Southern High Plains Cotton Production, Irrigated. Available online: https://quickstats.nass.usda.gov/results/37C9EFA1-8E99-34FD-BA1B-BB6EA819481A (accessed on 3 April 2019).
  39. DeLaune, P.; Trostle, C. Nitrates in irrigation water: An asset for crop production. Texas AgriLife Extension Service. E-619; Texas A&M AgriLife Communications: College Station, TX, USA, 2012. [Google Scholar]
  40. Hanson, R.G.; Ewing, E.C.; Ewing, E.C., Jr. Effect of environmental factors on fiber properties and yield of deltapine cottons. Agron. J. 1956, 48, 573–581. [Google Scholar] [CrossRef]
  41. Bauer, P.J.; Roof, M.E. Nitrogen, aldicarb, and cover crop effects on cotton yield and fiber properties. Agron. J. 2004, 96, 369–376. [Google Scholar] [CrossRef]
  42. United States Department of Agriculture. Agriculture Marketing Service, Upland Season Mike Classing Office by State, Lubbock, 2017; USDA: Washington, DC, USA, 2017.
  43. Bradow, J.M.; Davidonis, G.H. Quantitation of fiber quality and the cotton production-processing interface: A physiologist’s perspective. J. Cotton Sci. 2000, 4, 34–64. [Google Scholar]
  44. Bronson, K.F. Nitrogen use efficiency of cotton varies with irrigation system. Better Crop. Plant Food 2008, 92, 20–22. [Google Scholar]
  45. Egelkraut, T.; Kissel, D.; Cabrera, M.; Gascho, G.; Adkins, W. Nitrogen concentration in cottonseed as an indicator of N availability. Nutr. Cycl. Agroecosystems 2004, 68, 235–242. [Google Scholar] [CrossRef]
  46. Rochester, I.J. Using seed nitrogen concentration to estimate crop N use-efficiency in high-yielding irrigated cotton. Field Crop. Res. 2012, 127, 140–145. [Google Scholar] [CrossRef]
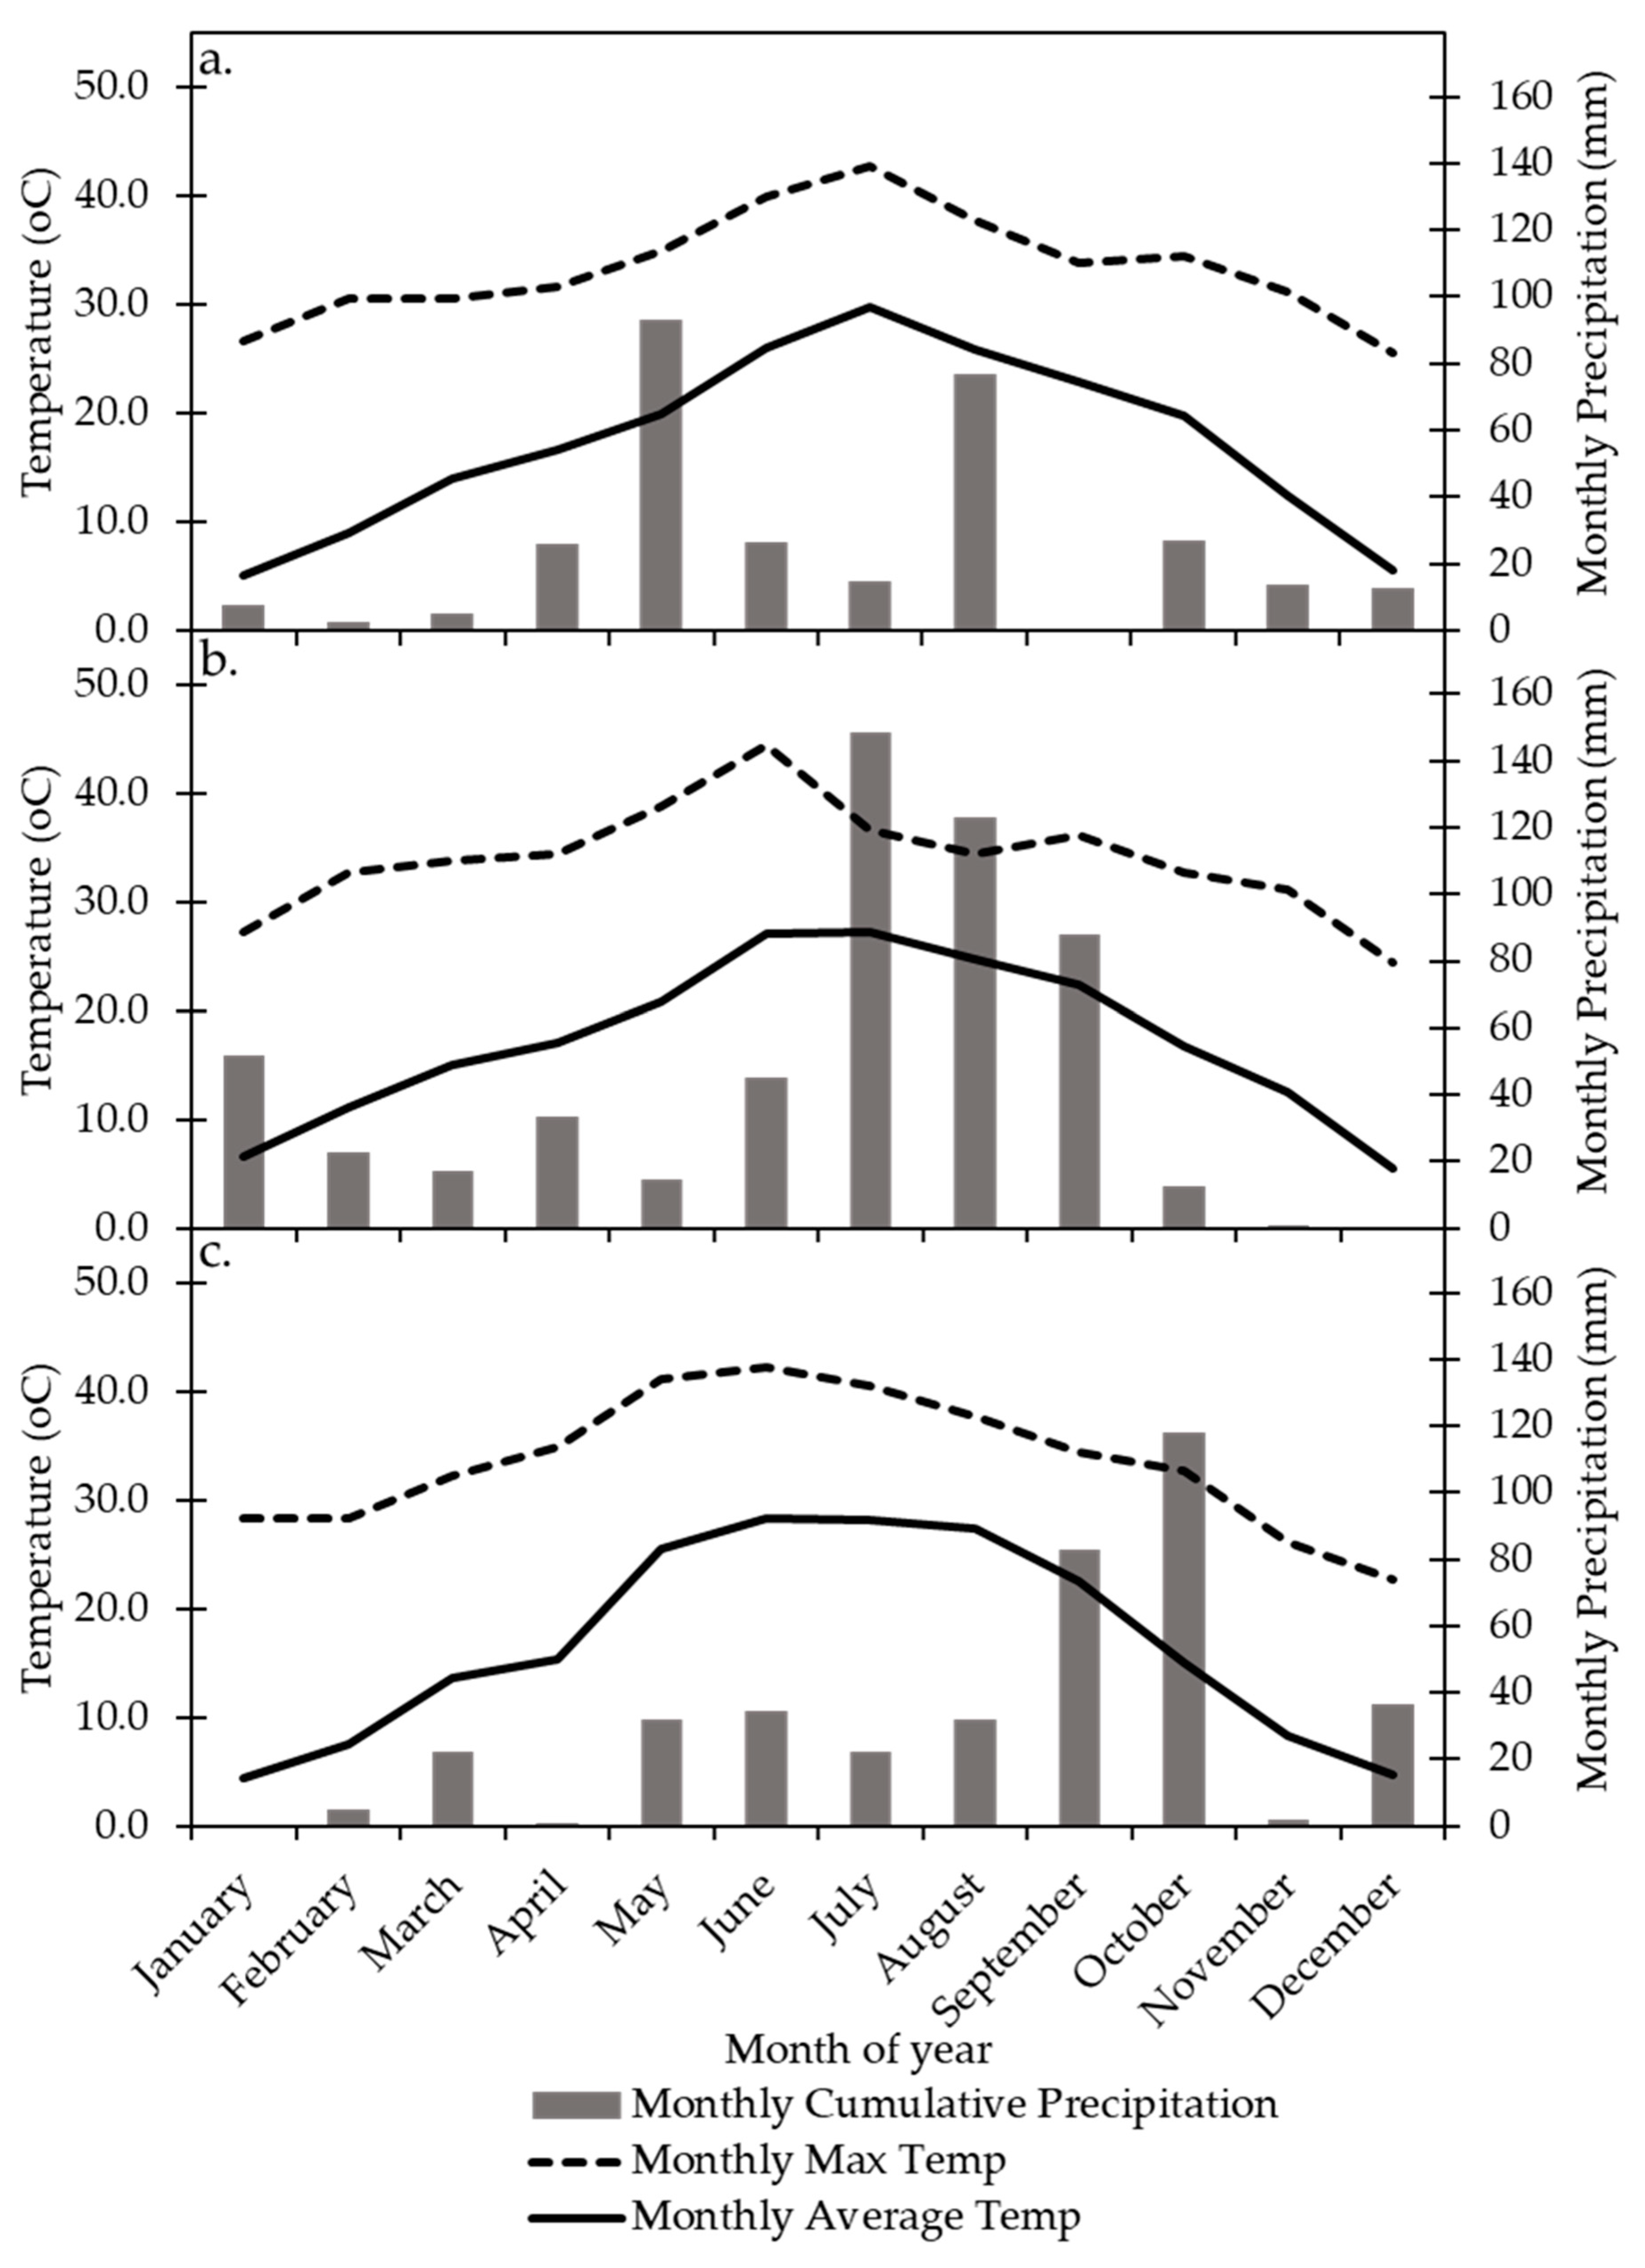
Figure 1. Maximum monthly temperatures, average monthly temperatures and monthly cumulative precipitation at the Lubbock International Airport (33.6656°, −101.8231°) located 1 km south of the research site, from 1 January through 31 December in 2016 (a), 2017 (b), and 2018 (c).
Agronomy 10 00994 g001
Figure 2. Lint Yield in 2016, 2017, and 2018. NTW, no-till with winter wheat cover; NT, no-till winter fallow; CT, conventional tillage winter fallow. Bars are standard error of the mean. Tillage means within year with the same letter are not different (α = 0.05).
Agronomy 10 00994 g002
Figure 3. Fiber strength differences due to tillage system in 2017 and 2018. NTW, no-till with winter wheat cover; NT, no-till winter fallow; CT, conventional tillage winter fallow. Bars are standard error of the mean. LSD letters are compared within year and are significant at p < 0.05.
Agronomy 10 00994 g003
Figure 4. Cotton seed nitrogen (N) concentration (g kg-1) for nitrogen (N) treatments averaged across tillage systems in 2016, 2017, and 2018. Control, 0 added N fertilizer; PP, 100% preplant; SD, 100% side-dressed; SPLIT, 40% preplant, 60% side-dressed; STB, 100% preplant with N stabilizer. LSD letters are compared within year across N treatment and are significant at p < 0.05.
Agronomy 10 00994 g004
Table 1. Soil characteristics of samples collected at a depth of 0–15 cm following cover crop termination in April 2016 (previously reported by McDonald et al., 2019).
Tillage System apHOC bTN cNO3-NPKCaMgSNa
g kg−1------------------------------mg kg−1-------------------------
NTW7.45.30.6920.4b4242318598231329
NT7.45.40.7456.9a4946319938091436
CT7.55.10.6906.8a4641919318521132
p-value0.9010.2640.3050.0280.6040.1880.5190.3370.5280.217
a NTW, no-till with winter wheat cover; NT, No-till winter fallow; CT, conventional tillage winter fallow; b OC, organic carbon; c TN, total nitrogen.
Table 2. Analysis of variance results for tillage system, nitrogen (N) treatment, and interaction effects on lint yield in 2016, 2017, and 2018.
YearTillage SystemN TreatmentInteraction
ANOVA (p-Value < 0.05)
20160.0290.3870.990
20170.0460.5370.996
20180.0160.6240.996
Table 3. Analysis of variance results for tillage system, nitrogen (N) treatment, and interaction effects on agronomic use efficiency of N by the cotton crop in 2016, 2017, 2018.
YearTillage SystemN TreatmentInteraction
ANOVA (p-Value < 0.05)
20160.9110.6170.985
20170.2910.4660.998
20180.8840.7410.961
Table 4. Analysis of variance results for tillage system, nitrogen (N) treatment, and interaction effects on cotton crop seed N concentration (g kg−1) in 2016, 2017, 2018.
YearTillage SystemN TreatmentInteraction
ANOVA (p-Value < 0.05)
20160.1180.2770.888
20170.7270.5520.928
20180.9030.0040.357