Abstract
The evaluation of users’ satisfaction from the available e-Government services is a very important factor for the e-Government evolution. In this research, the MUlticriteria Satisfaction Analysis (MUSA) method and the related software is used in order to evaluate the users’ satisfaction of agricultural e-Government services. For this reason, we used the results of a survey conducted for an agricultural e-Government web portal in Greece. Five main criteria and the thirty-one sub-criteria were used in order to calculate the global and partial users’ satisfaction. From the results, the strong and the weak points of the agricultural e-Government services and the specific usability attributes that are more crucial for the users’ satisfaction were determined. The results of the questionnaire revealed that the average level of the users’ satisfaction is high but there are still actions to be taken in order to improve the provided agricultural e-Government services. Furthermore, the users of agricultural e-Government services attributed great importance to the criteria of interaction and accessibility. The MUSA method highlights the actions that have to be taken using action and improvement diagrams.
1. Introduction
The reform of public administration leads governments to invest in e-Government projects and initiatives. Internet and Communication Technologies (ICTs) give the opportunity to citizens to be better informed about both policy and services provided by governments in a user-friendly environment [1,2]. There are many definitions for the e-Government services that differ in their focus and use. e-Government is:
- “the use of ICTs for delivering government information and services to the citizens and businesses”—United Nations (UN) [3].
- “the use of ICT and particularly the Internet, as a tool to achieve better government”—Organisation for Economic Co-operation and Development (OECD) [4].
- “is the use of ICT in public administrations combined with organizational change and new skills in order to improve public services and democratic processes and strengthen support to public policies”—European Union [5].
- “is the use of ICT in public administration, aiming to offer electronic services.”—Devadoss et al. [6].
The following simple definition is adopted in order to combine all the approaches mentioned above: “We can define e-Government as the provision of public services and information online, 24 h in 24 h and 7 days a week.” Finally, Pardo [7] notes that anyone can create a website, but eGovernance is much more than that.
Regarding agriculture, ICTs have dramatically changed the face of agriculture in developed countries [8]. Many farm activities have been linked to databases, e-communication, e-platforms and websites, enabling producers to access government and non-government projects, credit, markets, technical and scientific assistance [9,10]. In many cases the access to knowledge and information has become a key element of competitiveness at local, regional and international levels. In short, the face of agriculture in the developed world has changed as ICT has become increasingly critical for farmers and decision-makers [11]. The use of ICT in agriculture is growing but remains clearly lower than in other sectors of the economy as rural areas are by definition usually remote, sparsely populated and often dependent on natural resources [12]. Farmers usually live far away from the government structures and it is difficult for them to have access to the necessary services, making the need for e-Government services more important [13]. Many governments have already adopted the use of e-Government to provide agricultural services to their farmer citizens [13]. The e-Government provides tools to different agricultural entities to coexist in a network where they can use multiple government services under a common interface and through a single access point [14,15].
Most governments place great emphasis on their citizens’ satisfaction from their e-government services [16]. Governments also face the challenge to provide more valuable, responsive, efficient and effective services [17]. This introduces a new requirement: to measure citizens’ satisfaction as a factor for continuous e-government improvement. Muhtaseb et al. [18] argues that a user-centered approach in the development of websites is a crucial factor in the success of any online attempt. According to them, the success of a website can be measured by using four main factors: (a) frequency of use, (b) if they return to a website, (c) if they recommend it, and (d) frequency of making the same actions in the future [18]. According to Fensel et al. [19], loyalty is also one more key factor and can be defined as a customer’s intention or predisposition to purchase from the same organization again. According to Sterne, businesses and organizations use the internet both to serve their clients but also to conduct satisfaction surveys [20].
In this paper we measure the users’ satisfaction of a web portal for e-government agricultural services in Greece. More specifically, this paper refers to a users’ satisfaction web survey for the services provided in the agroGOV web portal. The survey was conducted before the official publication of the web portal in order to improve the usability of the portal. The data was processed using the MUSA (Multicriteria Satisfaction Analysis). The results of MUSA method explain the users’ satisfaction level and analyze in depth the behavior and expectations of the users [18].
2. The MUlticriteria Satisfaction Analysis (MUSA) Method
There are many researches in the literature analyzing different methodologies for evaluating e-Government policies [21]. On the other hand, citizen satisfaction [17] is a key point in providing e-Government services. The MUlticriteria Satisfaction Analysis (MUSA) method is widely used for measuring the user or customer satisfaction of different services [22,23,24,25,26,27]. The MUlticriteria Satisfaction Analysis (MUSA) method is a multivariable analytic-synthetic approach to the problem of measurement and analysis of customer satisfaction [11]. This innovative methodology is based on the principles of multi-criteria decision analysis, adopting the principles of the analytic-synthetic approach and the theory of value systems or utility [28]. The provided results can evaluate quantitative global and partial satisfaction levels and determine the weak and strong points of the agricultural e-Government services. Furthermore, the results of this study will help the government to improve their services and develop more effective e-Government services [17].
The main purpose of the multicriteria method MUSA is the synthesis of a set of user’s preferences in quantitative mathematical function values [11]. The model aggregates the individual opinions of the users into a function, assuming that the user’s global satisfaction depends on a set of satisfaction criteria or variables representing the service characteristic dimensions [29]. The evaluation of user’s satisfaction can be considered as a multicriteria analysis problem, assuming that the customer global satisfaction is a particular criterion i which is represented as a monotonic variable Xi from a set of criteria family X = (X1, X2, ..., Xn). [30]. This tool evaluates the user’s satisfaction levels in two dimensions, the global satisfaction and the partial satisfaction, for each of the satisfaction criteria [30]. Finally, it provides a complete set of results that explains the users’ satisfaction level and analyzes in depth the advantages and weaknesses of the provided services [18].
The MUSA method assesses global and partial satisfaction functions Y* and Xi*, respectively, given customers’ judgements Y and Xi [31]. The MUSA method follows the general principles of ordinal regression analysis under restrictions by using linear programming techniques to solve [32].
The basic ordinal regression equation is:
where n is the number of criteria and b is the weight of the i criterion.
The value functions are normalized in the internal
The model has the objective to achieve the maximum possible consistency between the Y and preferences in estimating Y*, which is also the collective satisfaction function [27]. To minimize possible deviations introduced for each customer, j is a double error variable. Thus, the Equation (1) takes the form:
where is the estimation of the global value function , and and are the overestimation and the underestimation error, respectively.
The above equation applies to each client who has expressed a definite satisfaction opinion, and for this reason the variables of underestimation error should be set for each individual customer.
According to the aforementioned definitions and assumptions, the customers’ satisfaction evaluation problem can be formulated as a linear program in which the goal is the minimization of the sum of errors under the constraints:
- ordinal regression equation for each customer
- normalization constraints for and in the interval [0, 100]
- monotonicity constraints and .
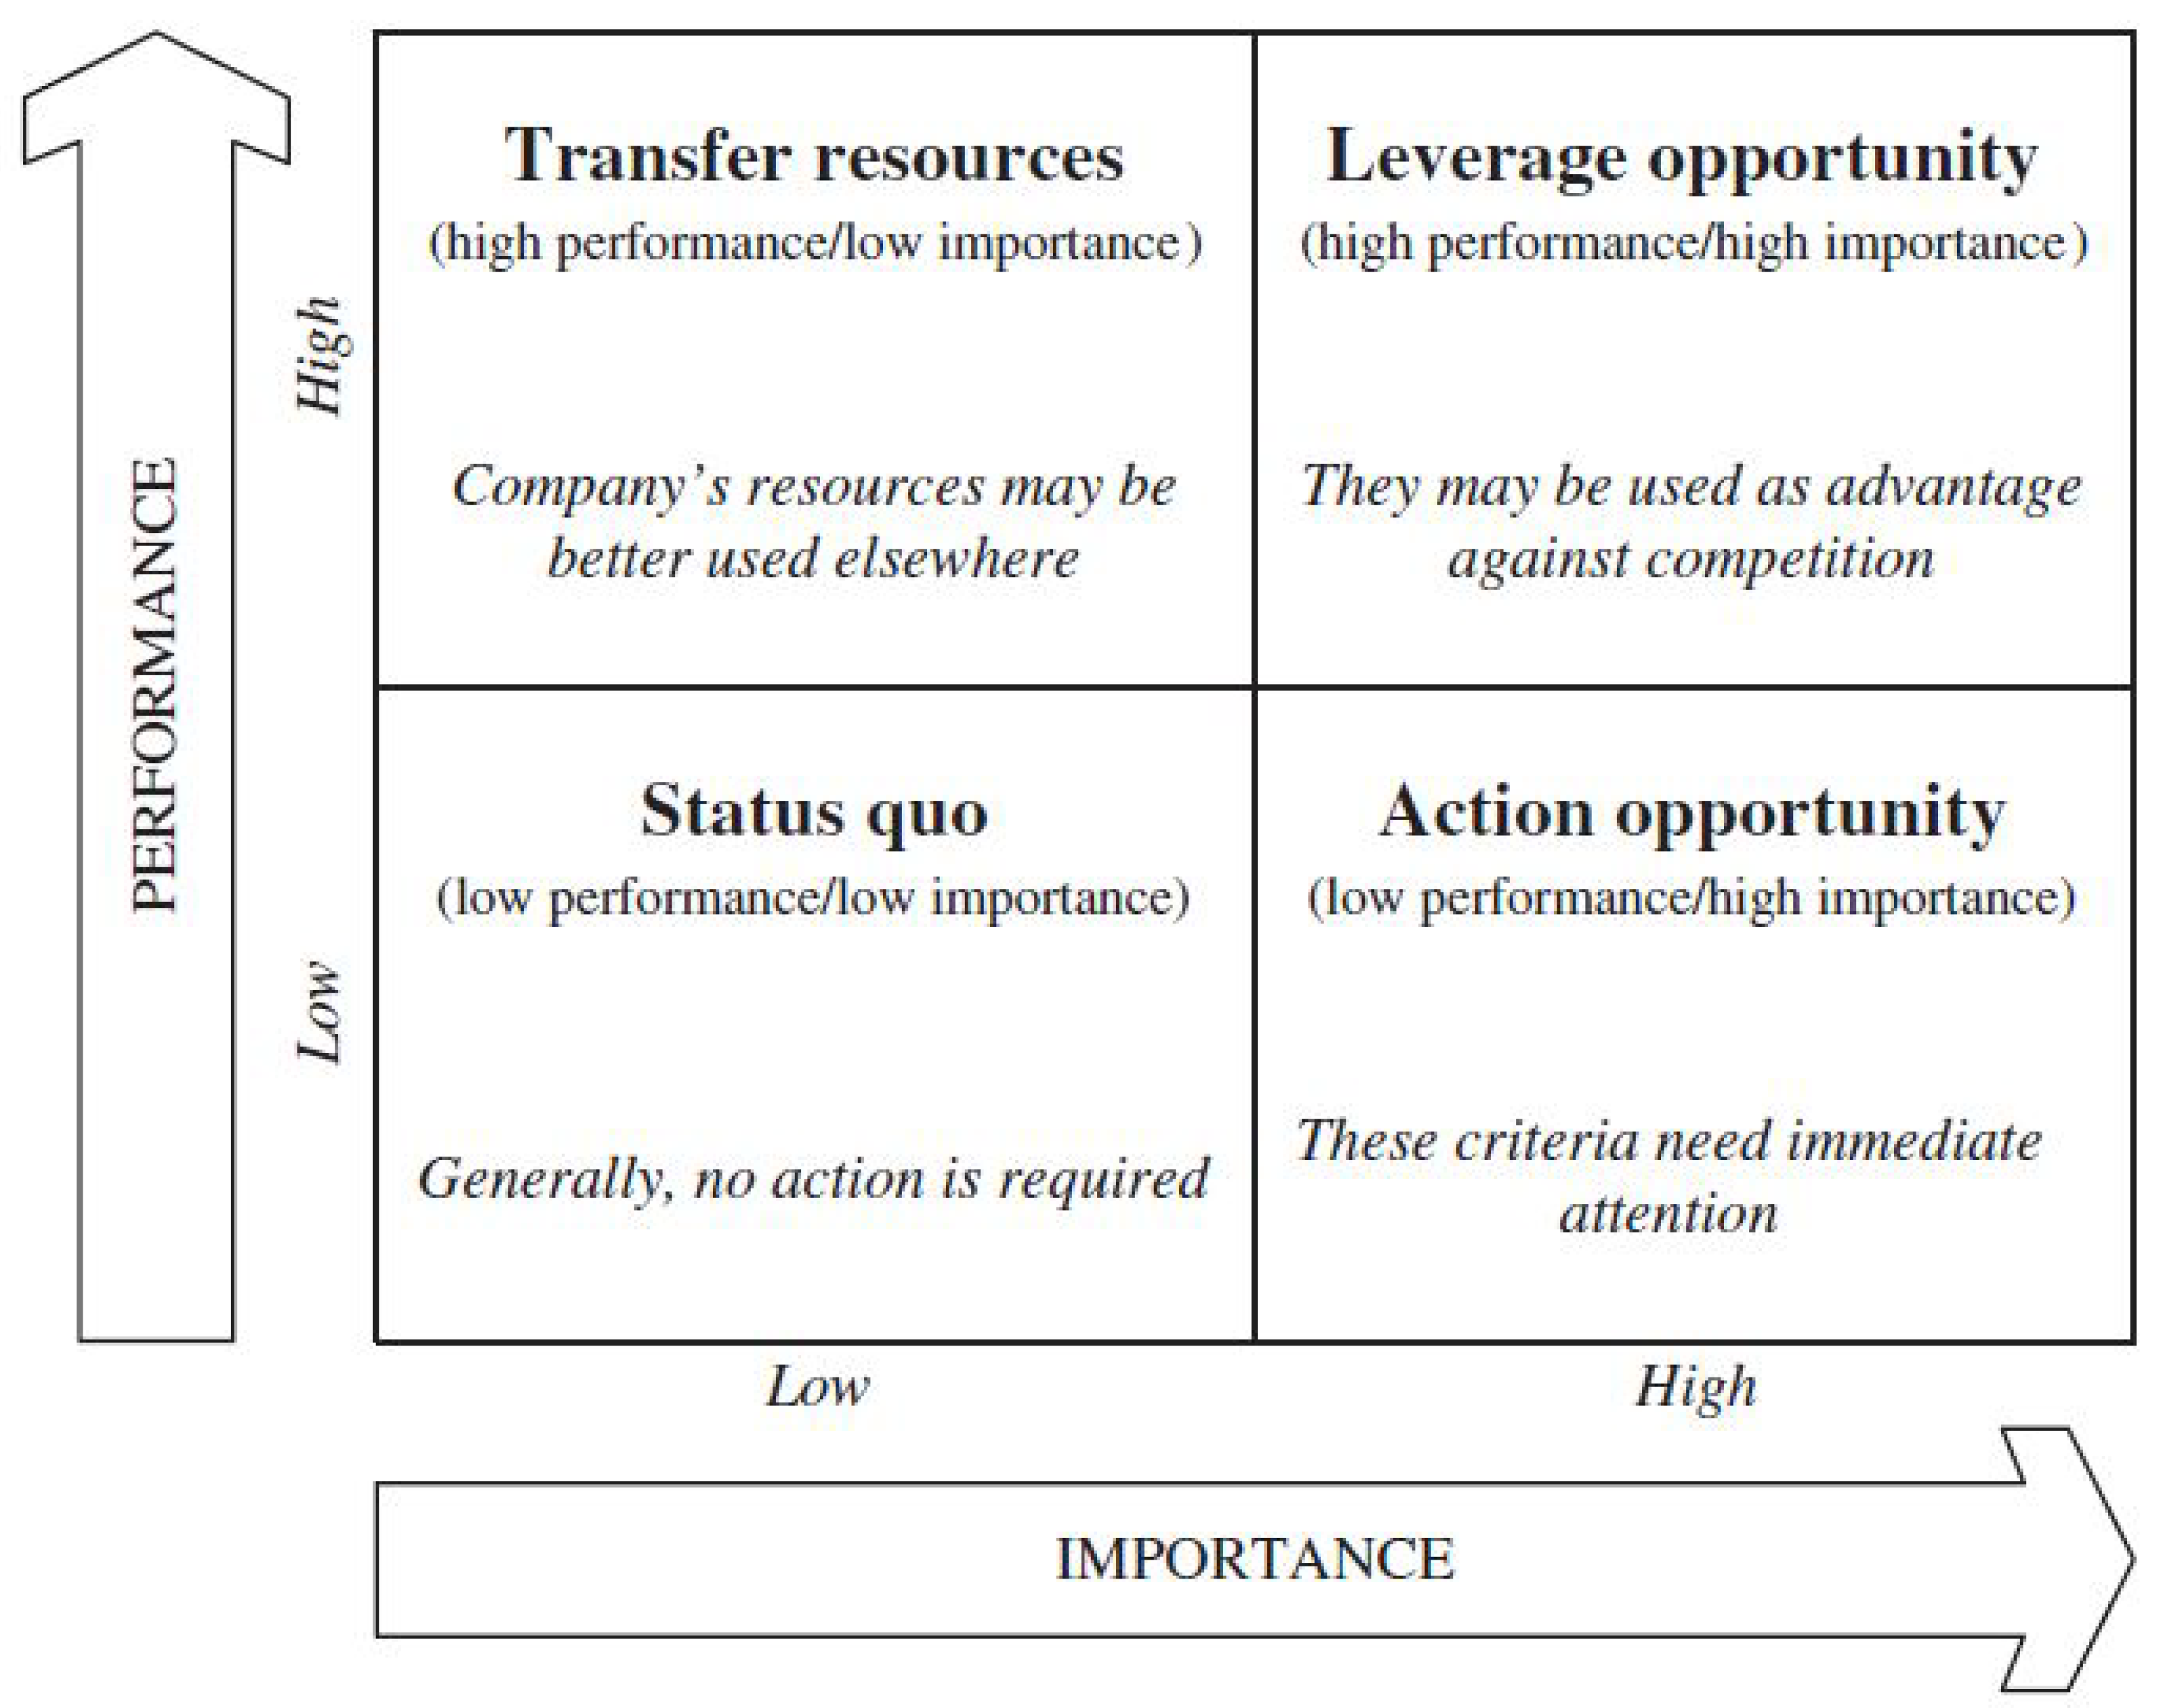
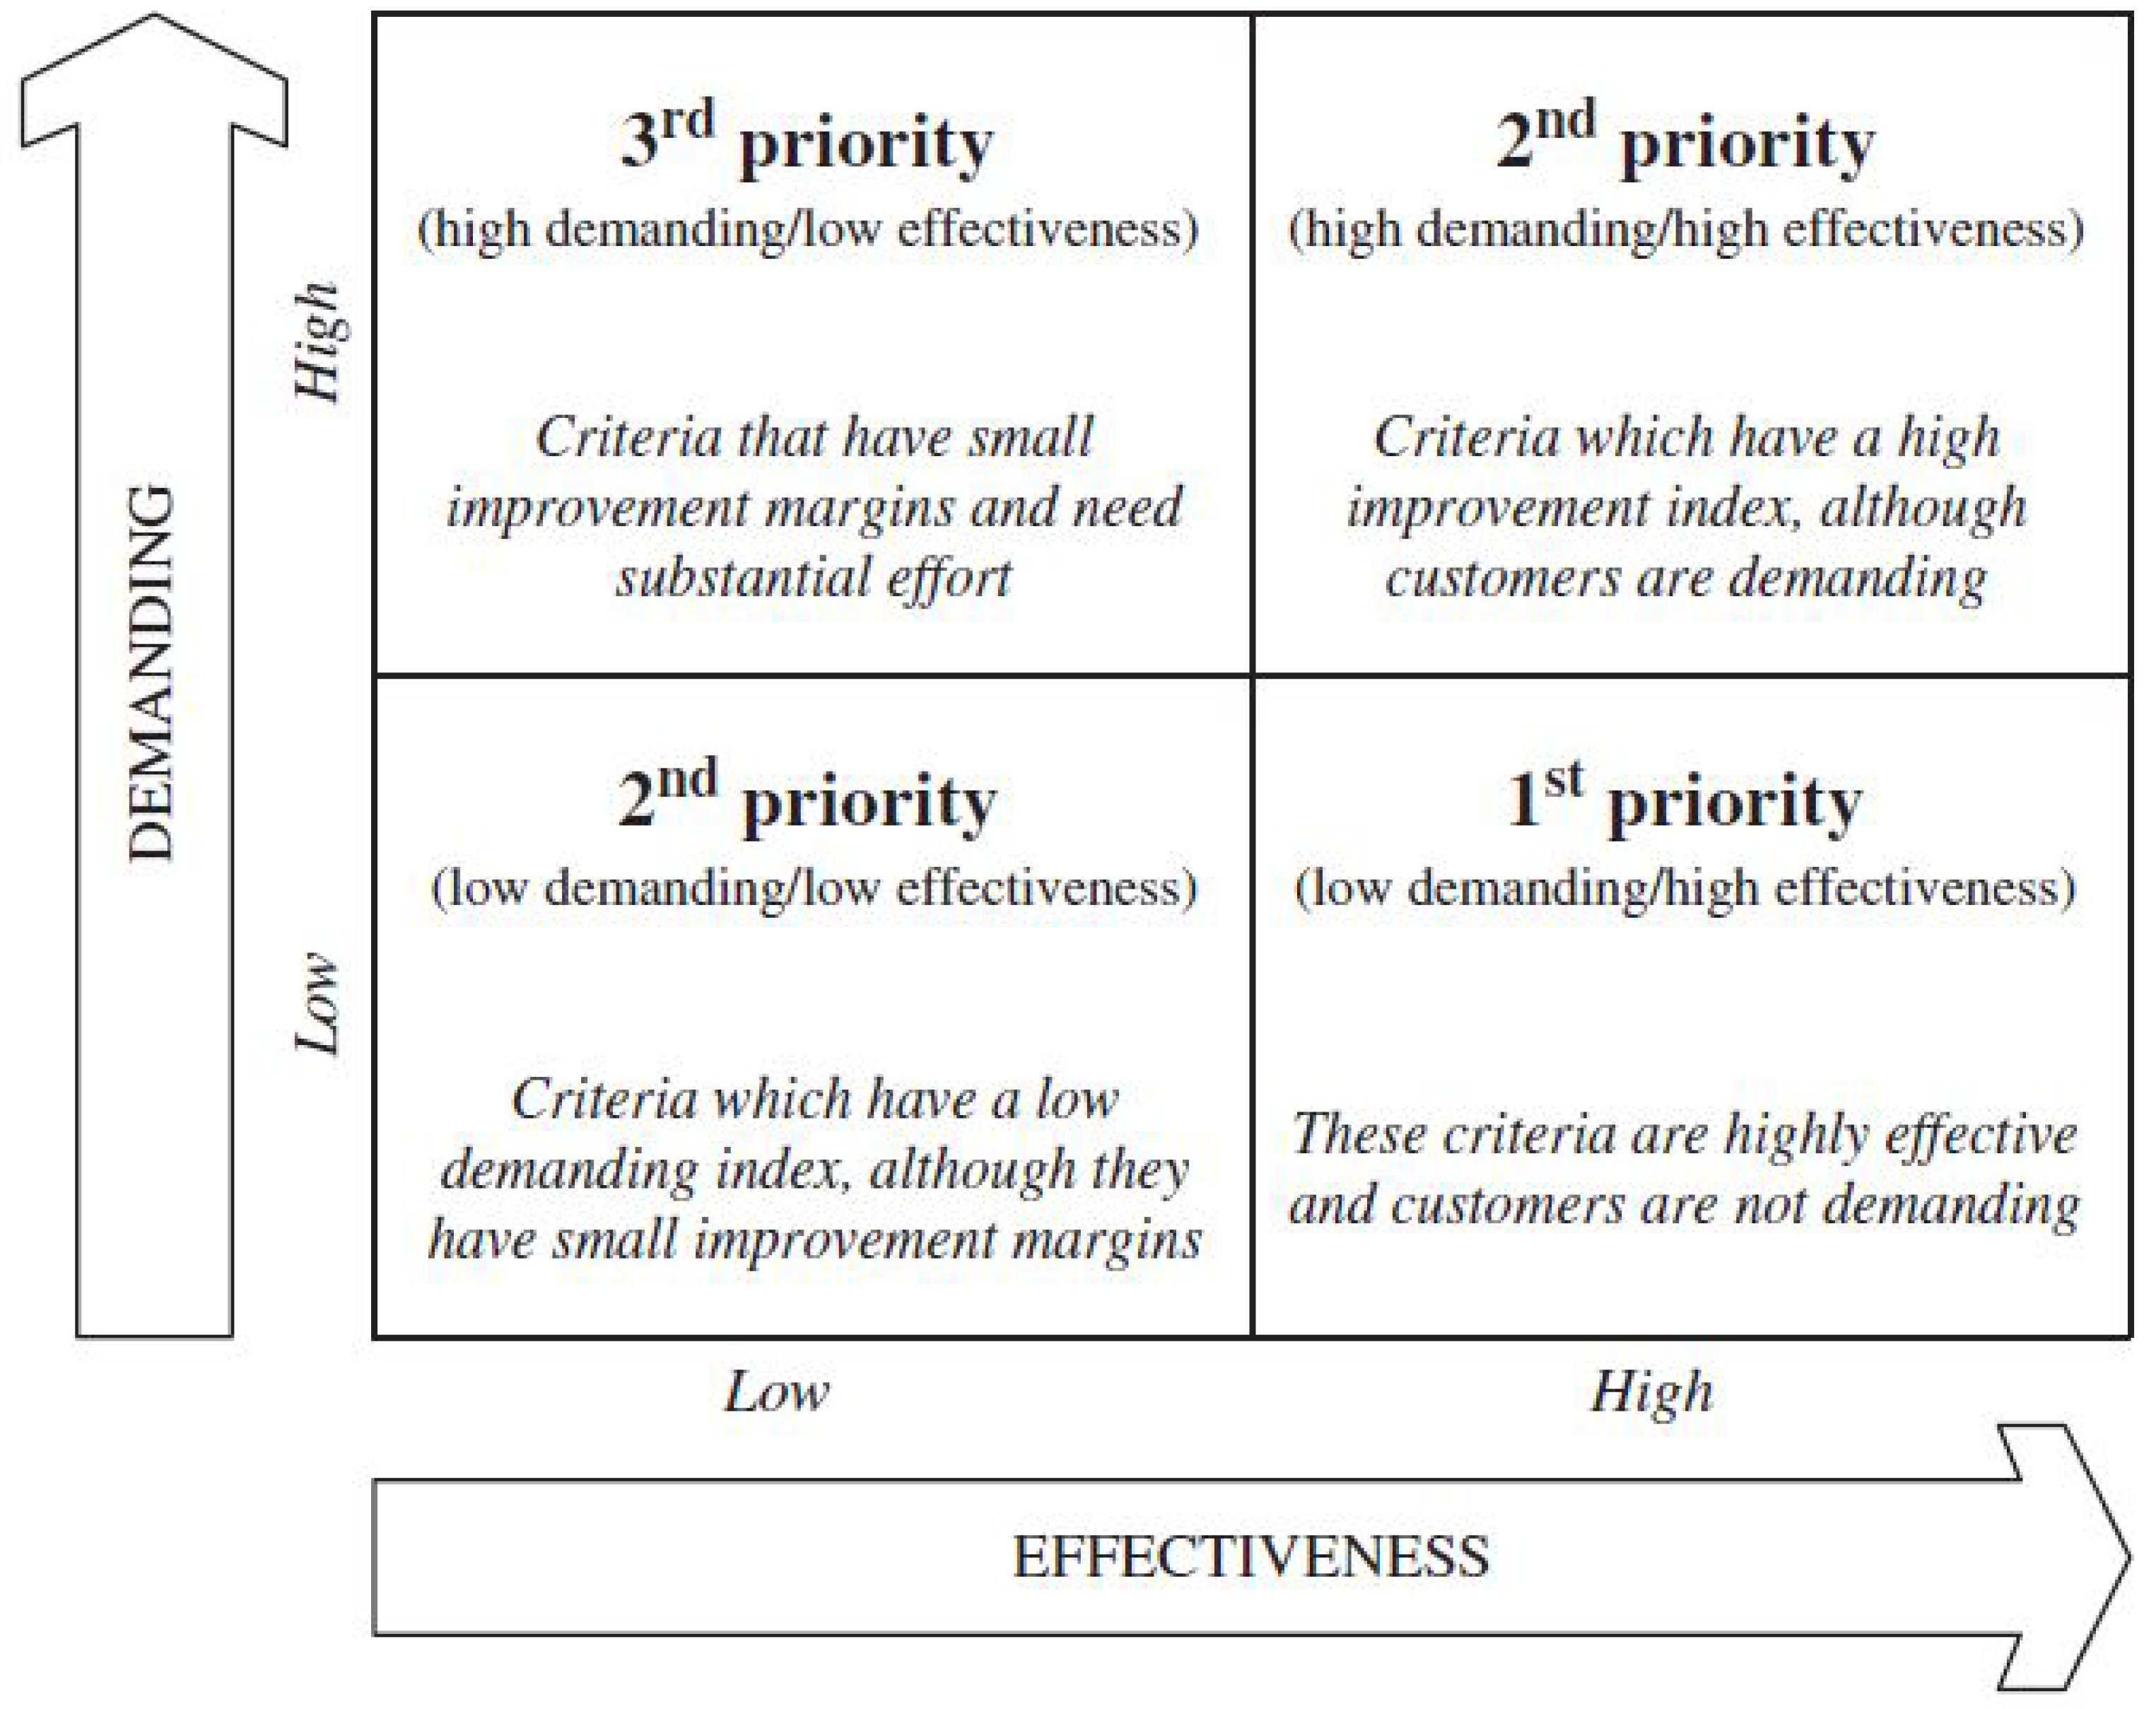
The MUSA method offers a significant advantage over other methods, including that the results of this method can be used to improve continuously the quality of the system [11]. Other methods can only provide a quantified estimate of the total customer satisfaction and unsatisfactory information for in-depth analysis of customer satisfaction and specific satisfaction for each dimension specified. The MUSA method not only identifies, in addition to global and partial satisfaction for each dimension of satisfaction, but also, with the construction and improvement of action diagrams, indicates the points at which the business must be improved to increase customer satisfaction and gives the priority that should be given to actions for improvement. The action diagram, shown in Figure 1, is divided into quadrants according to performance and importance [33], and the improvement diagram, shown in Figure 2, is divided into quadrants according to demanding and effectiveness.
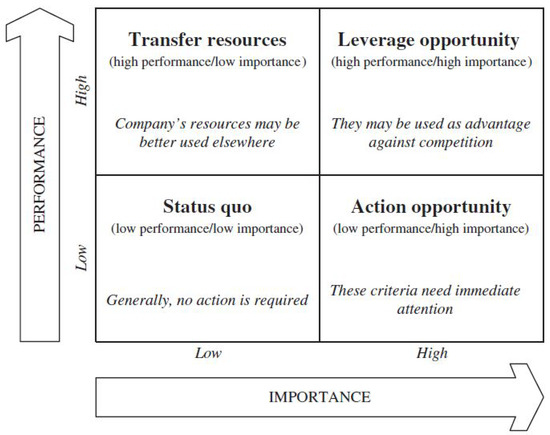
Figure 1.
Action diagram [17].
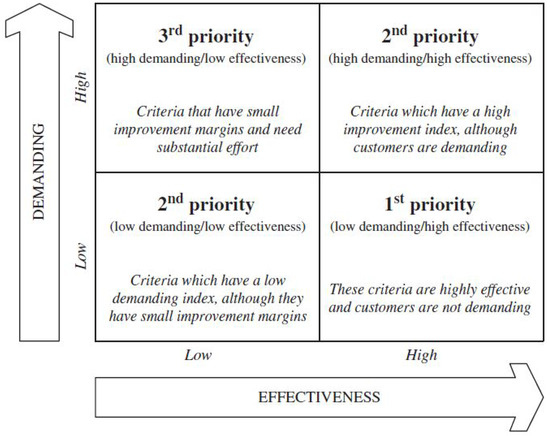
Figure 2.
Improvement Diagram [17].
Criteria and Sub-Criteria Used
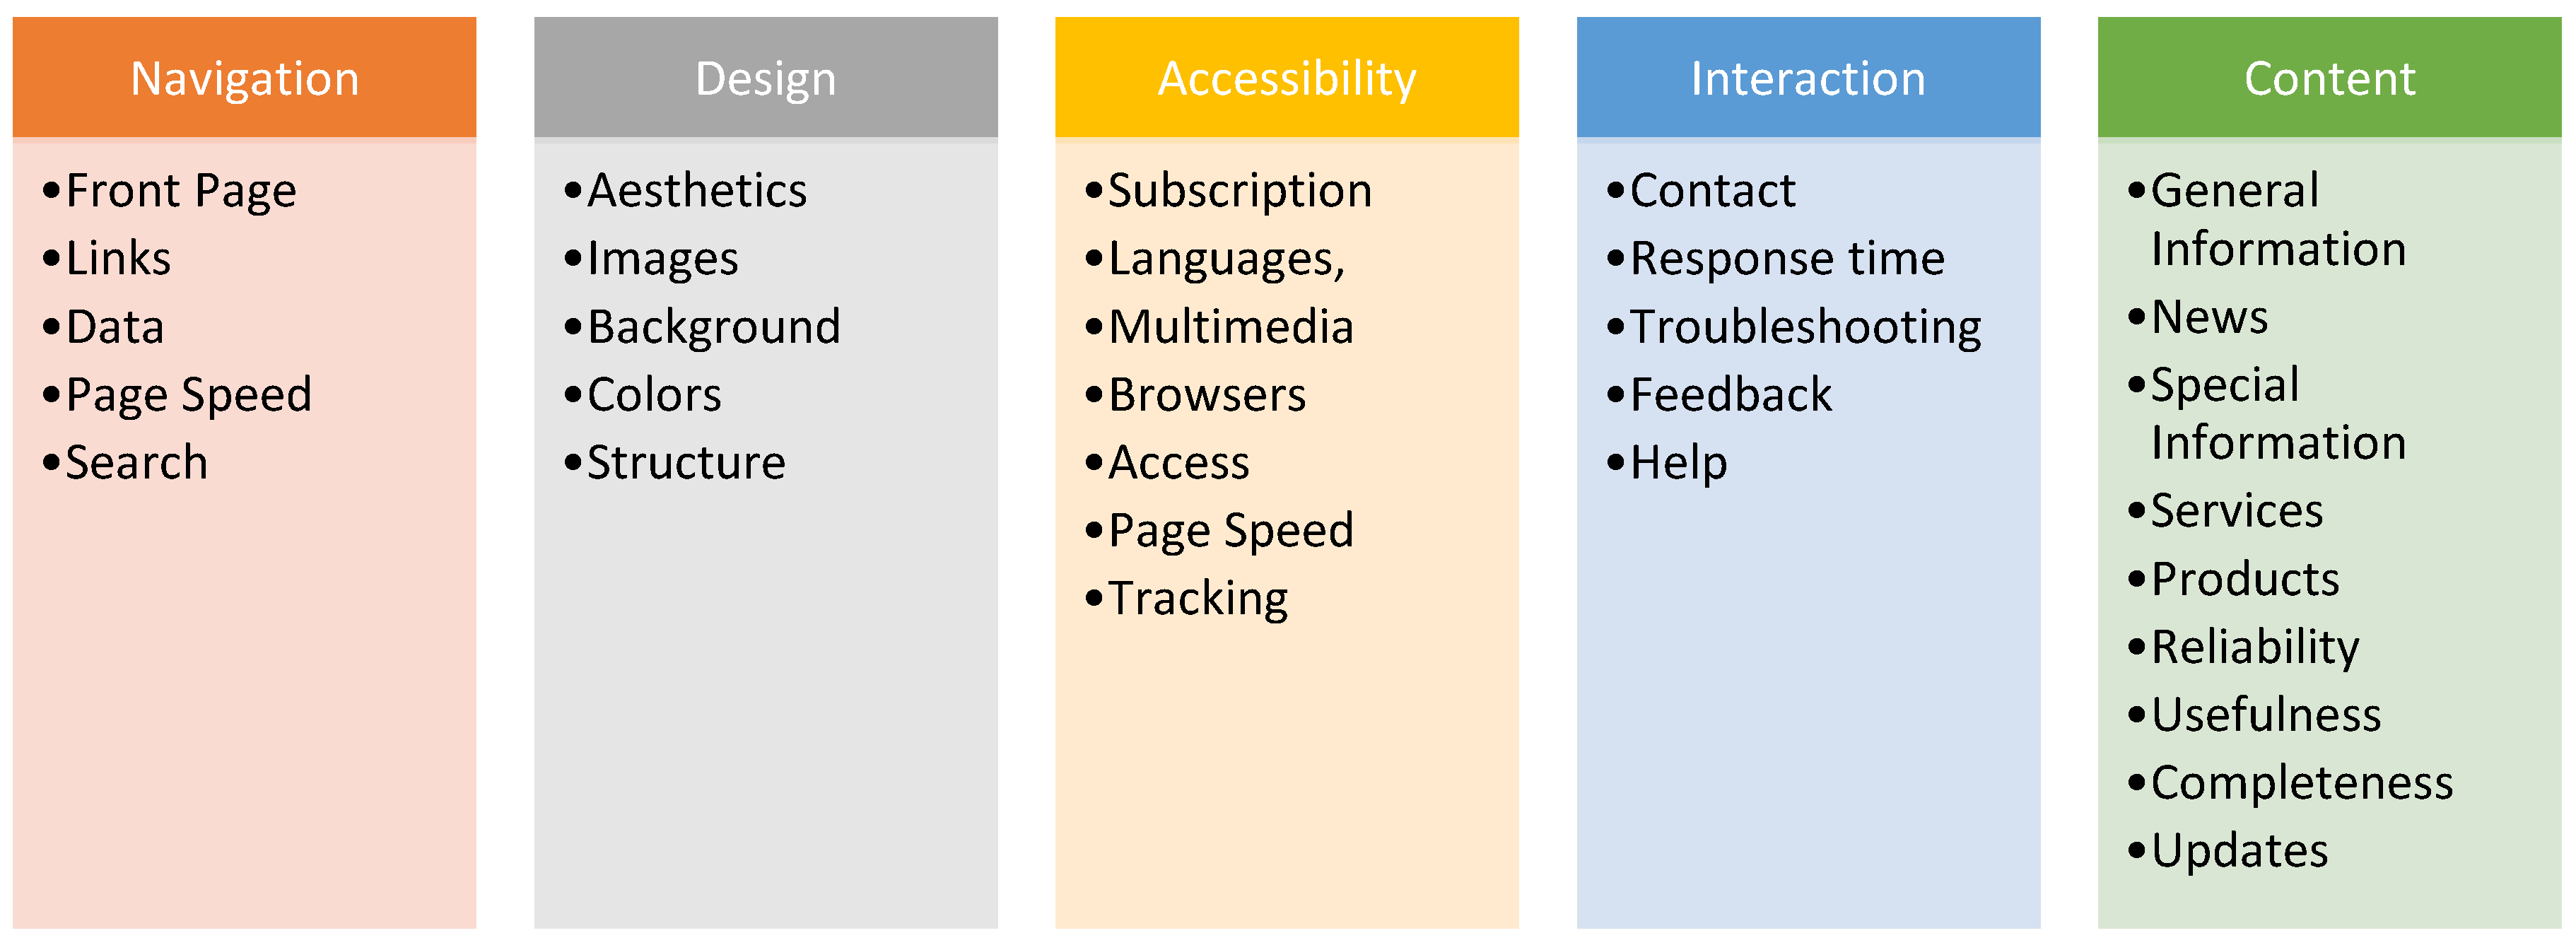
For the evaluation of a web portal, several criteria have been suggested. Particularly, agricultural web portals have been suggested by various writers [34,35] for many evaluation criteria related to design, quality, content, navigation, etc. There is a large number of studies that suggest different criteria and sub-criteria for the evaluation of e-Government services [21]. Lidija and Povilas suggest to classify these criteria in groups regarding their relation to the services provided [36]. Papadomichelaki and Mentzas [37] propose six main criteria and a list of attributes for the evaluation of e-Government services. For measuring users’ satisfaction, it is necessary to identify the main dimensions (criteria) and sub-criteria that fulfill the above requirements. Based on bibliographical research, the set of satisfaction criteria used in this research was classified into five main groups. These criteria are:
- Navigation
- Design
- Accessibility
- Interaction
- Content
These five criteria were added to several sub-criteria that measure these dimensions. The sub-criteria are presented in the following Table 1.

Table 1.
Main Criteria and Sub-Criteria.
The questionnaire was divided into three sections. The first section included the demographic questions (seven questions) for the users. The second section included three questions regarding the level of computer knowledge, frequency of using the internet, and the number of visits to the agroGOV.gr portal. The above characteristics of the users were not considered in the analysis and discussion of results for the MUSA method [38]. The third section was the main body of the questionnaire. It included 37 questions regarding the degree of agreement and the users’ satisfaction from the specific criteria and sub-criteria. It was divided into five sub-sections for the main satisfaction criteria (Navigation, Design, Accessibility, Interaction and Content). Each sub-section included a question about the main satisfaction criterion and questions for each of the satisfaction sub-criteria. On the last page of the questionnaire a question for measuring the global satisfaction was included. The judgments were measured using a 5-point qualitative scale of the form: very satisfied, satisfied, neither satisfied nor dissatisfied, dissatisfied, very dissatisfied [33,39].
The survey was conducted online over a two-month period before the official publication of the website. The users were experts in the field of ICT, students, researchers and academics in the field of e-Government. It is important to note that with the term “users” we are referring to the people who tested the web portal and are mentioned above. The respondents were asked voluntarily to complete the questionnaire and were informed that the survey was for academic research purposes. They had to make several visits to the website before they could fill out the questionnaire. There were 195 users who fulfilled these limitations. Finally, 101 online questionnaires were completed. For the analysis of the results, we used the MUSA FOR WINDOWS software.
3. Results
3.1. Descriptive Statistics
The descriptive statistics focused on the frequencies of the responses regarding the overall and partial satisfaction for each one of the main criteria. Table 2 shows that overall satisfaction expressed by the users was positive, with 66% expressing a positive opinion (satisfied and very satisfied) and only 10% having a negative opinion (very dissatisfied and dissatisfied). Regarding the individual criteria, we observed that the positive satisfaction opinions outweighed the negative ones with corresponding percentages to overall satisfaction. In particular, the results for Navigation were positive with 68% of users being satisfied, while only 13% expressed a negative opinion. The Design of the website satisfied 56% of users, while 17% of users were not satisfied with it. This was the highest rate of negative opinions for all the individual criteria. Similar results were presented in the Accessibility criterion. Overall, 56% of users were satisfied with the accessibility of the website, while 12% were dissatisfied. Corresponding results were also presented for the criteria of Interaction and Content. The Interaction satisfied 62% of the users and the Content satisfied 63% of the users. From these results we can conclude that the users seemed to be satisfied both with overall satisfaction and for each criterion separately.

Table 2.
Frequencies of Overall and Partial Satisfaction (%).
3.2. Satisfaction Analysis
The results in this section are based on the MUSA method. The main objective of the MUSA is the identification of users’ attitude and preferences by calculating the weights and the average satisfaction indices for each one of the criteria [33]. By combining the weights of the satisfaction criteria with the average satisfaction indices, it is possible to calculate a series of action diagrams that can determine what the strengths and weaknesses are of users’ satisfaction and what the needs for improvement are. These diagrams are essentially performance importance maps and are often referred to as strategic maps, decision maps, or perceptual maps in the international literature [40,41].
The results of the MUSA method show that the criteria of Interaction and Accessibility seemed to be the most important for the users of the web portal [42] (Table 3). The most important criterion was accessibility which was weighted 28.98%, and the second most important criterion for website users was interaction, with a 26.20% weight. The remaining criteria presented similar importance for the users.

Table 3.
Criteria weights and average satisfaction, demanding and improvement indices (%).
In a scale of 0–100 per cent, the results show the score that the users attributed for the measurement of their global and partial satisfaction. Users were satisfied by the web portal as the global satisfaction index was high (78.73%). The partial satisfaction indexes were particularly high for the criteria of accessibility (85.41%) and for the criterion of interaction (84.24%). The lowest satisfaction index was presented for the criterion of Design (69.23%).
By combining the weights of satisfaction criteria with the average satisfaction indices a set of action diagrams can be designed, which can identify what the strengths and weaknesses of users’ satisfaction are and in which criteria improvement efforts are needed.
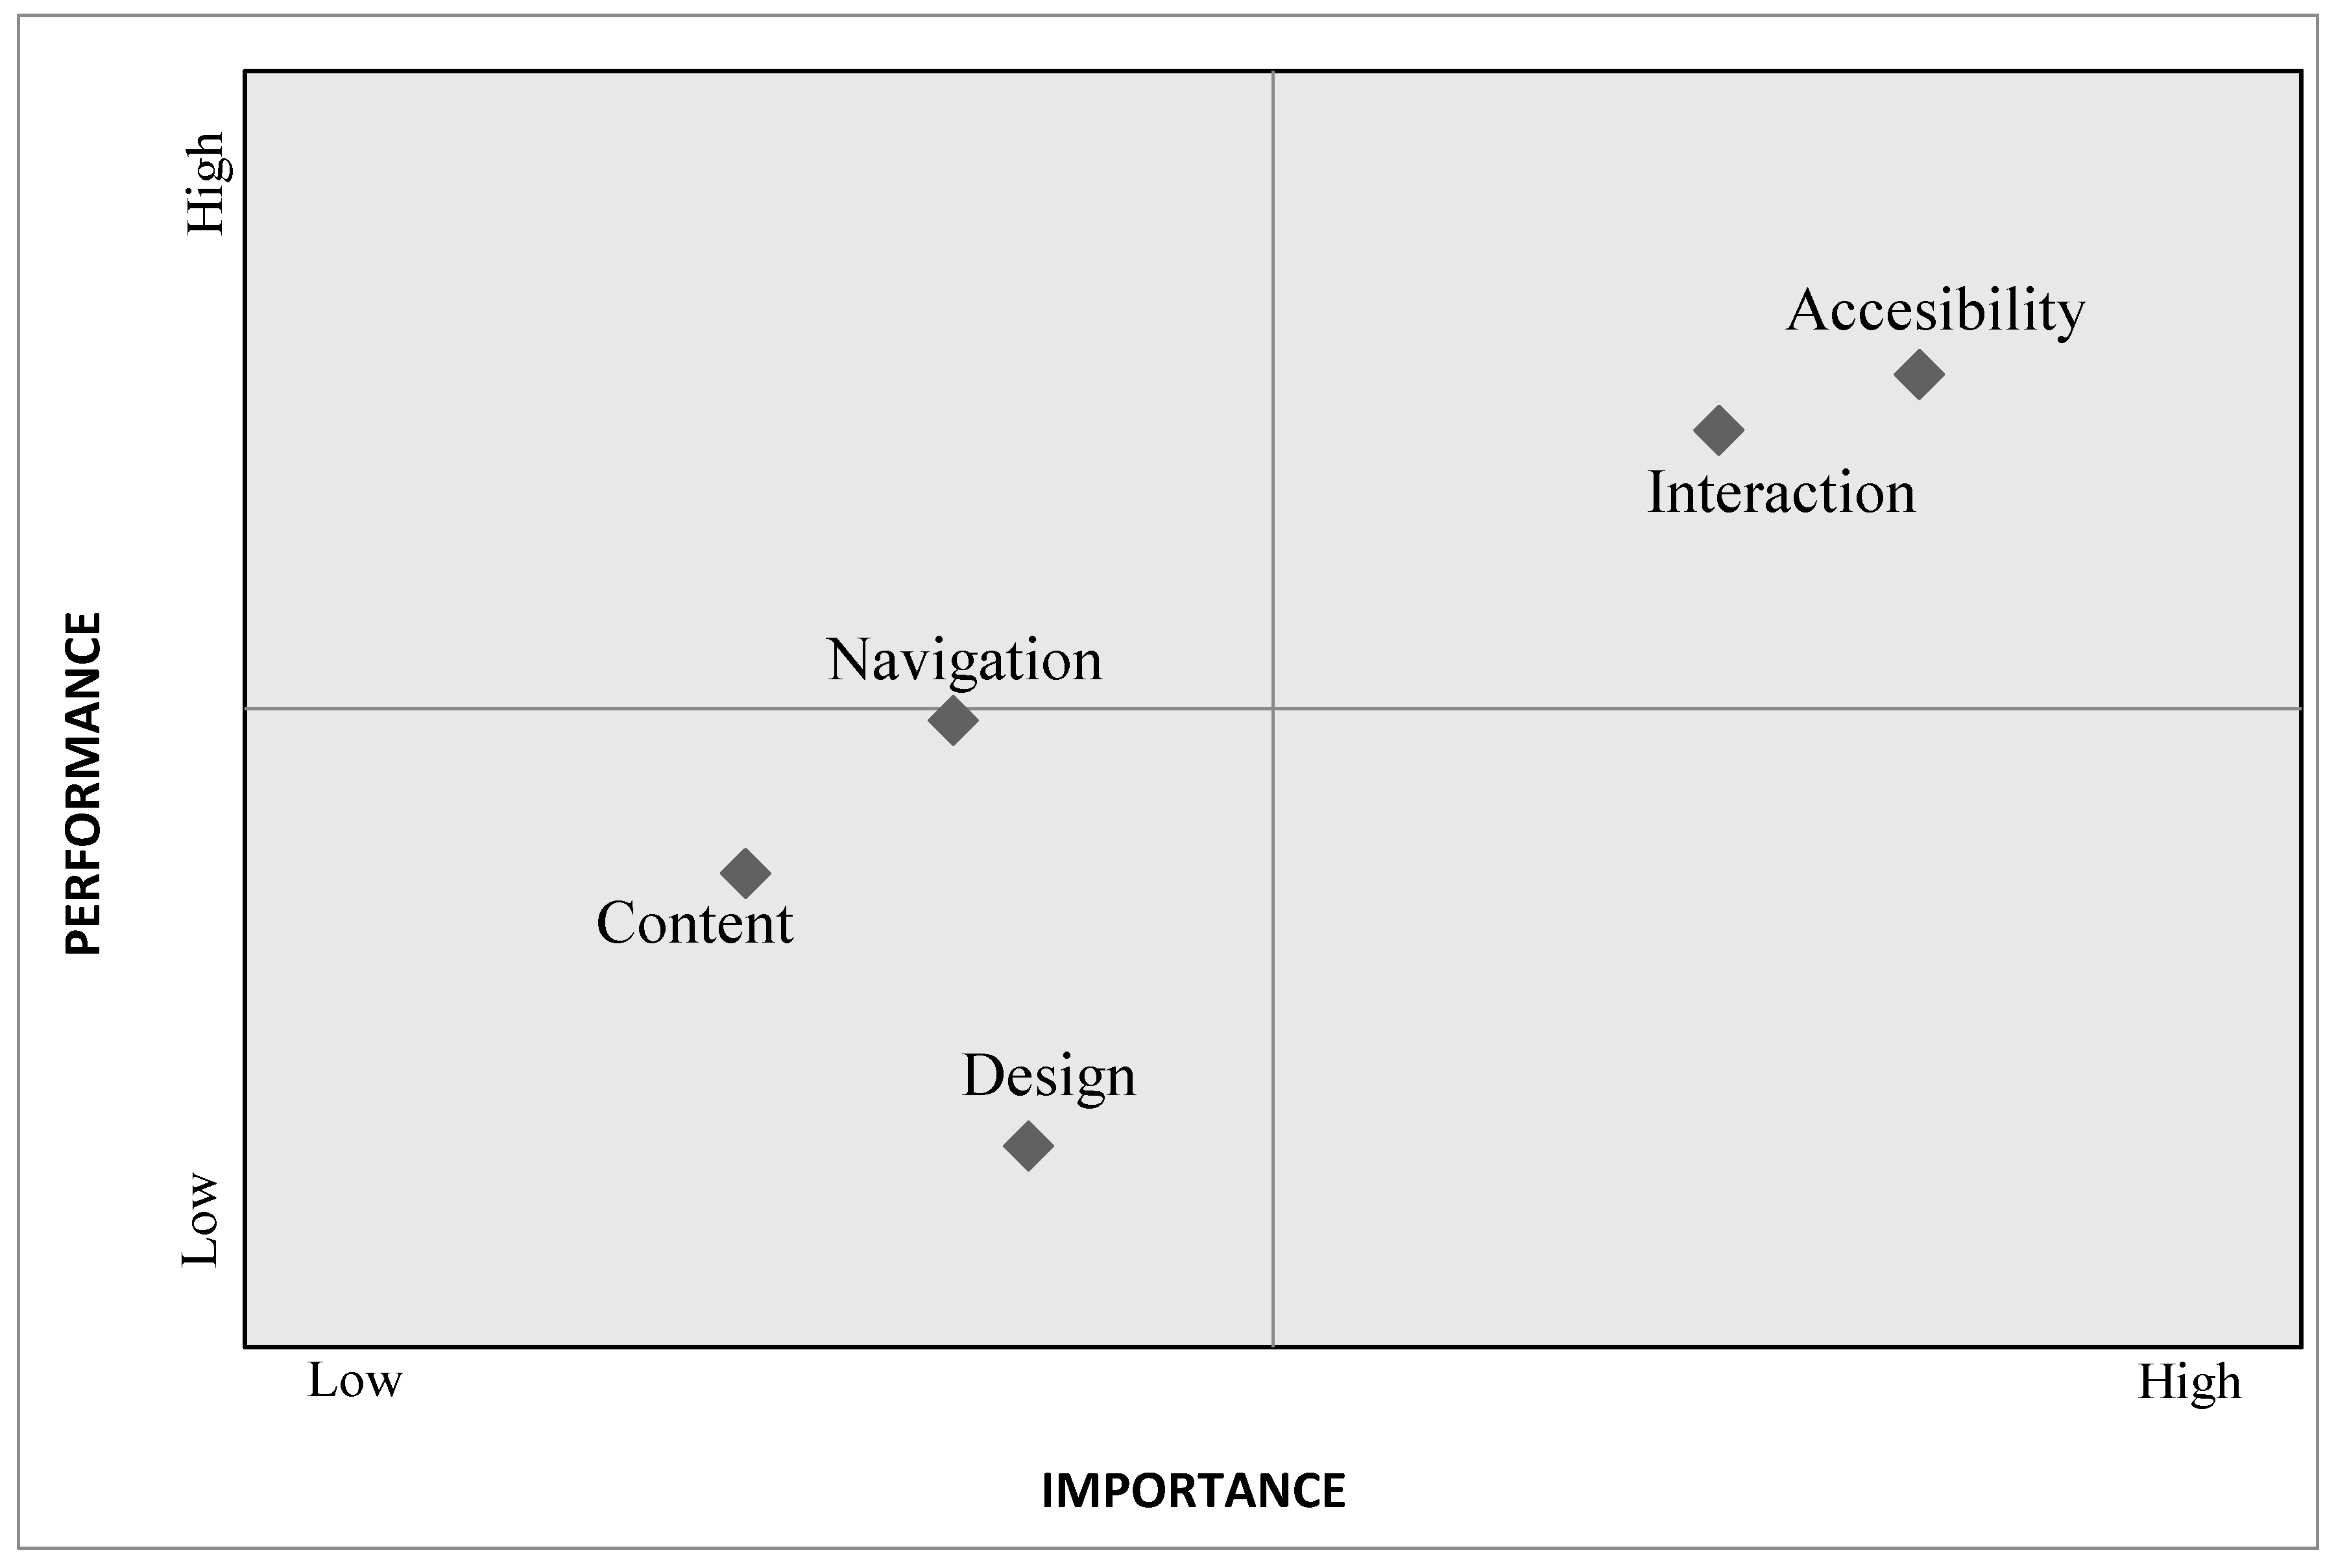
At first, we can observe that no criterion belongs to the fourth quadrant (the “Action opportunity” quadrant) of the action diagram (Figure 3). This basically suggests that there aren’t important criteria that need immediate attention. It should also be noted that the criteria of Interaction and Accessibility belong to the power quadrant and can be the competitive advantages of the website as they present high efficiency and are considered important criteria for all users. The criteria of Design and Content have the lowest satisfaction indices although users do not consider them as important, so according to MUSA method no action of improvement is required. However, these criteria can’t be ignored by the web portal developers. If the users in the future increase their importance of Design and the Content, this will be a problem that deserves immediate attention.
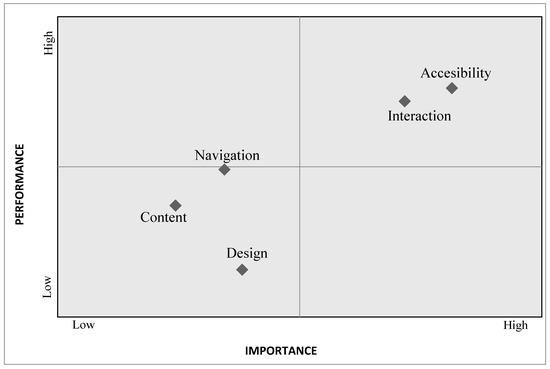
Figure 3.
Action diagram for the five main criteria.
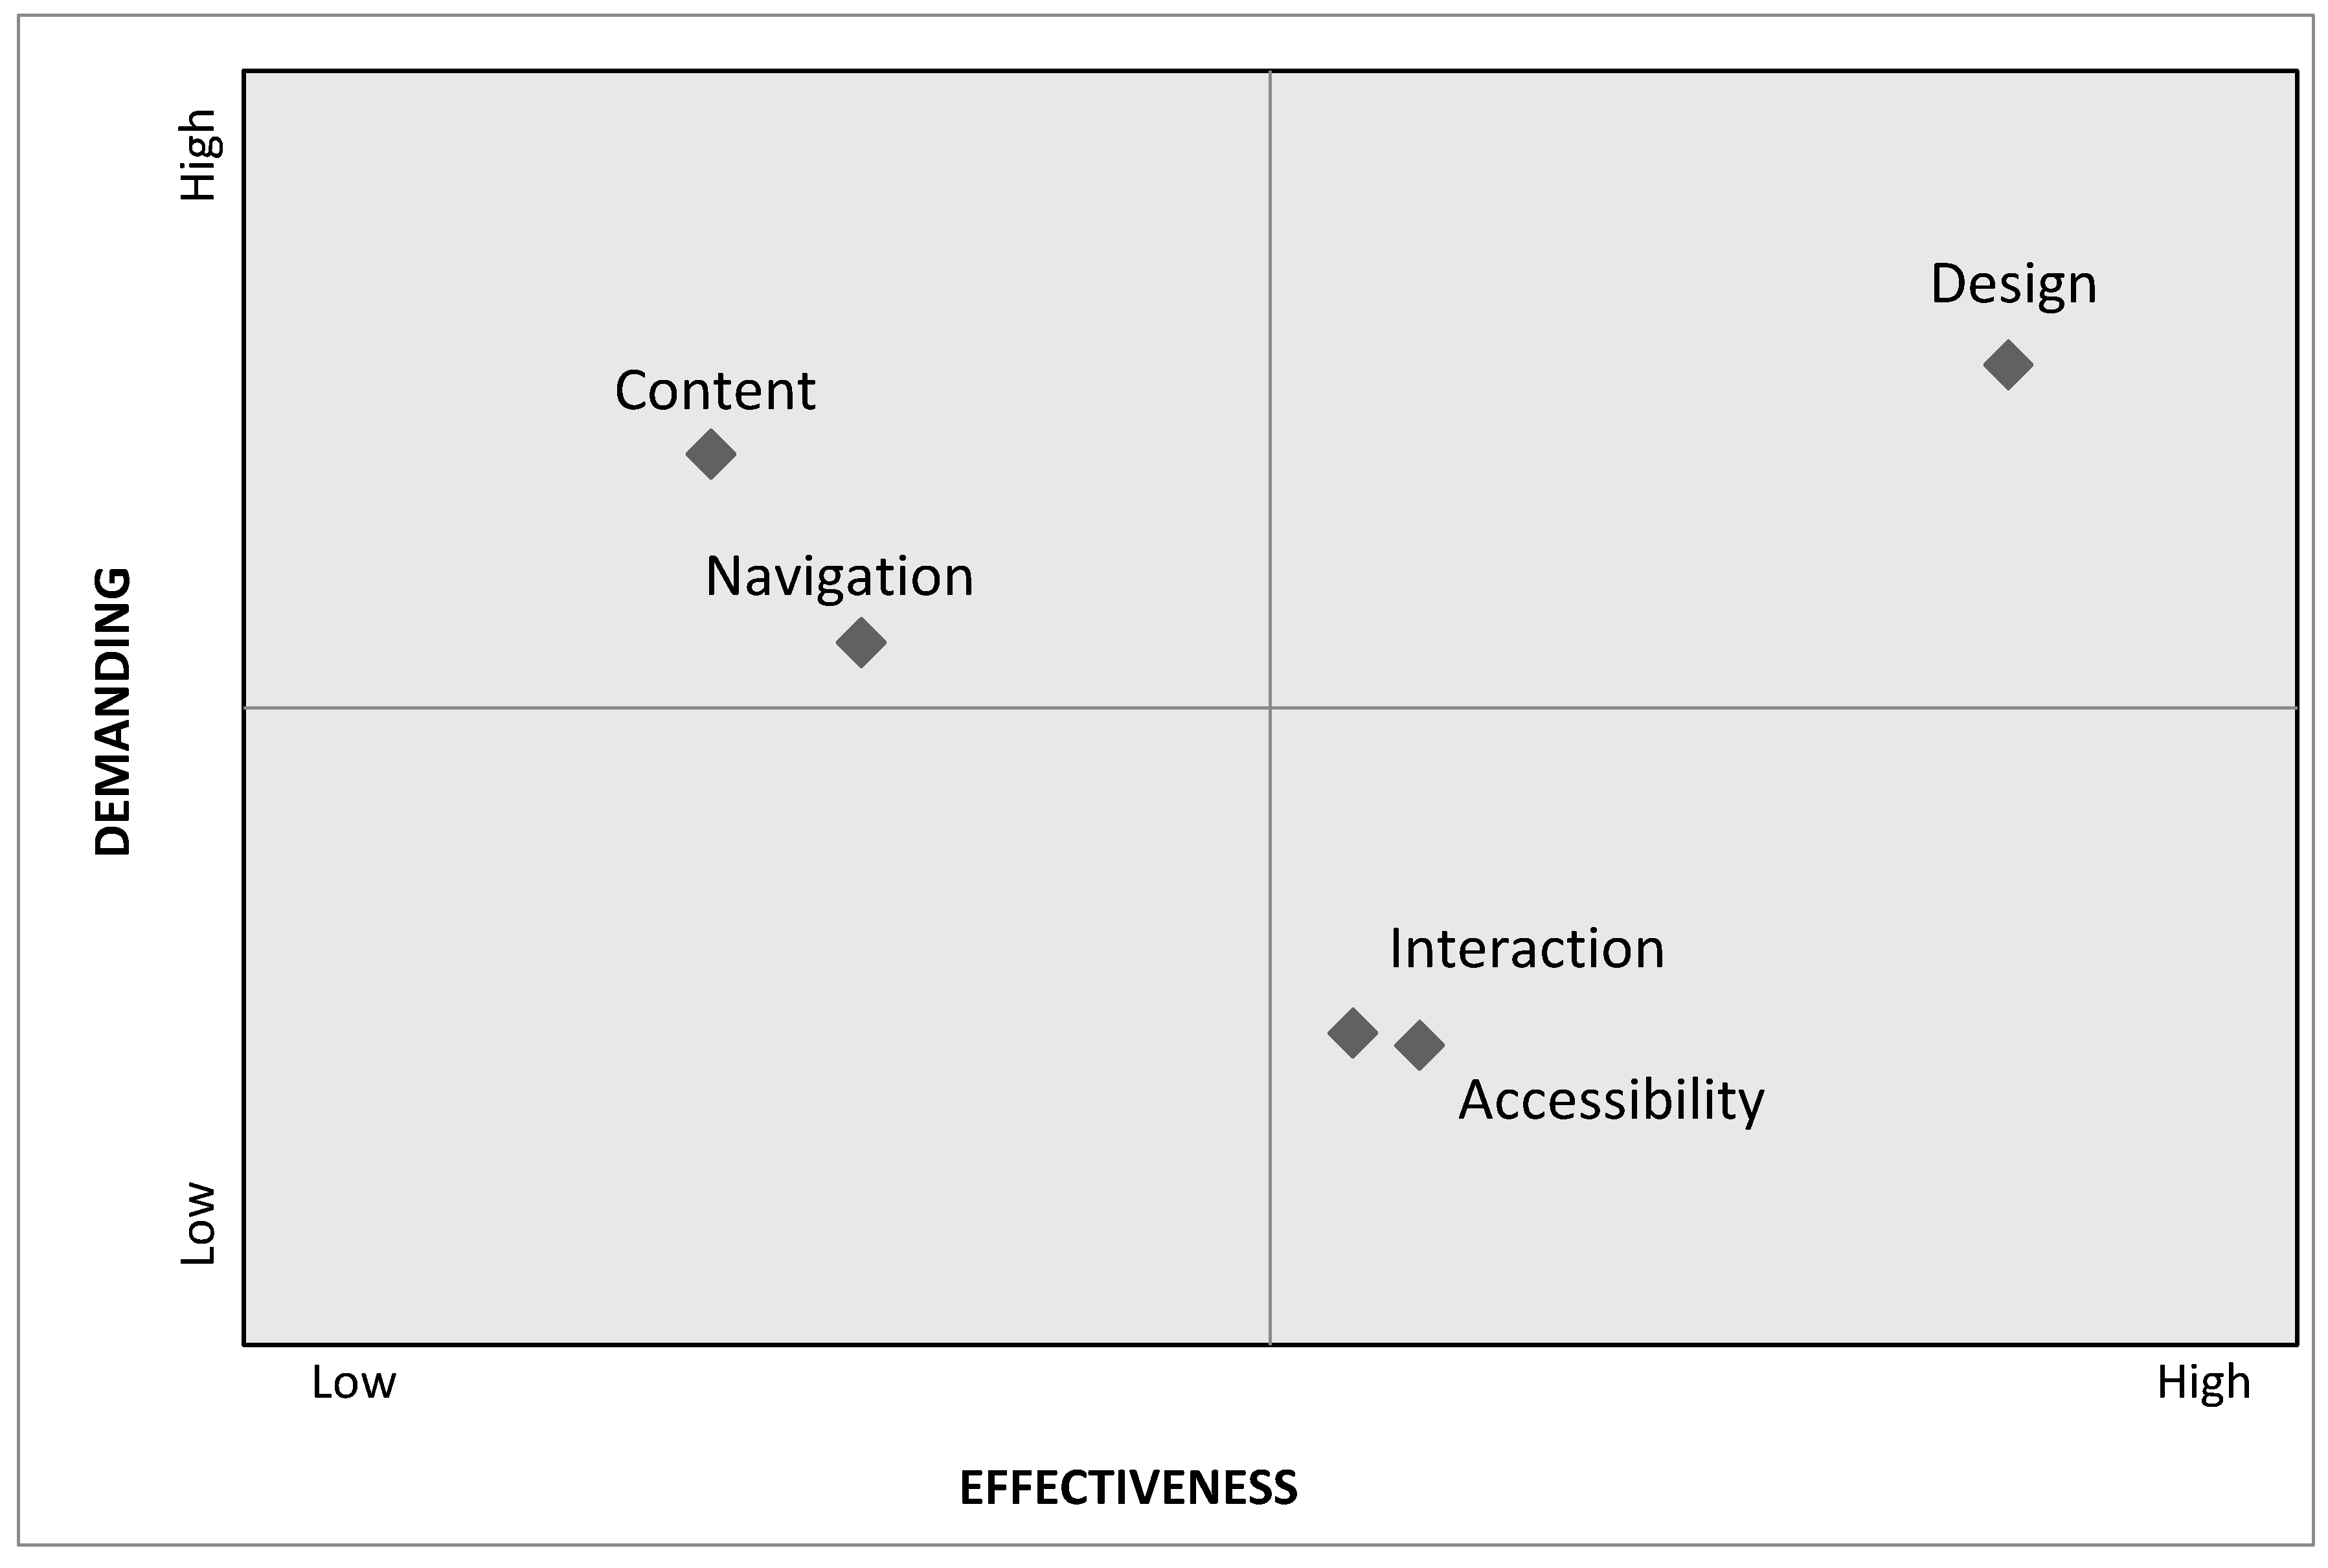
Figure 4 shows the Improvement diagram for all the criteria. From this diagram we can conclude that the criterions that should be improved first are Interaction and Accessibility because these criteria are highly effective, and customers are not demanding. The Design is the criterion that must be improved next because it exhibits high effectiveness and high demanding. Finally, the criteria of Content and Navigation are the last priority for improvement as they present low effectiveness and high demanding.
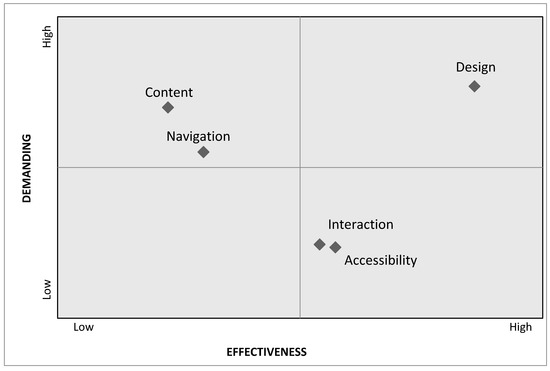
Figure 4.
Improvement diagrams for the five main criteria.
3.3. Partial Satisfaction Analysis
Regarding the partial satisfaction analysis, we have analyzed all the sub-criteria of the five main satisfaction criteria of the agroGOV users.
3.3.1. Navigation
The first criterion considered is Navigation. This criterion has five sub-criteria, which are the appearance of the Home Page (Front Page N.), connections between web pages (Links), the available data on the web pages (Data), page speed response (Page Speed) and searching information in the web page (Search).
The results of the MUSA method, as shown in the Table 4, show that users are satisfied with most of the criteria. With respect to the average satisfaction index, all sub-criteria indices are high, with the highest percentage for the Data (85.2%) and the lowest for the Links sub-criterion (64.6%). At the same time, on the basis of the demanding index we can characterize the visitors as “non-demanding” for all the sub-criteria, except for the Links sub-criterion for which visitors can be characterized as “neutral”. This conclusion can be derived as the demanding indices for most sub-criteria are close to −100 (non-demanding users) and far away from 100 (very demanding users). The users with demanding index values from −30 to 30 are characterize as “demanding”.

Table 4.
Partial Satisfaction Frequencies and Average Satisfaction, Demanding and Improvement Indices for the Navigation Criterion (%).
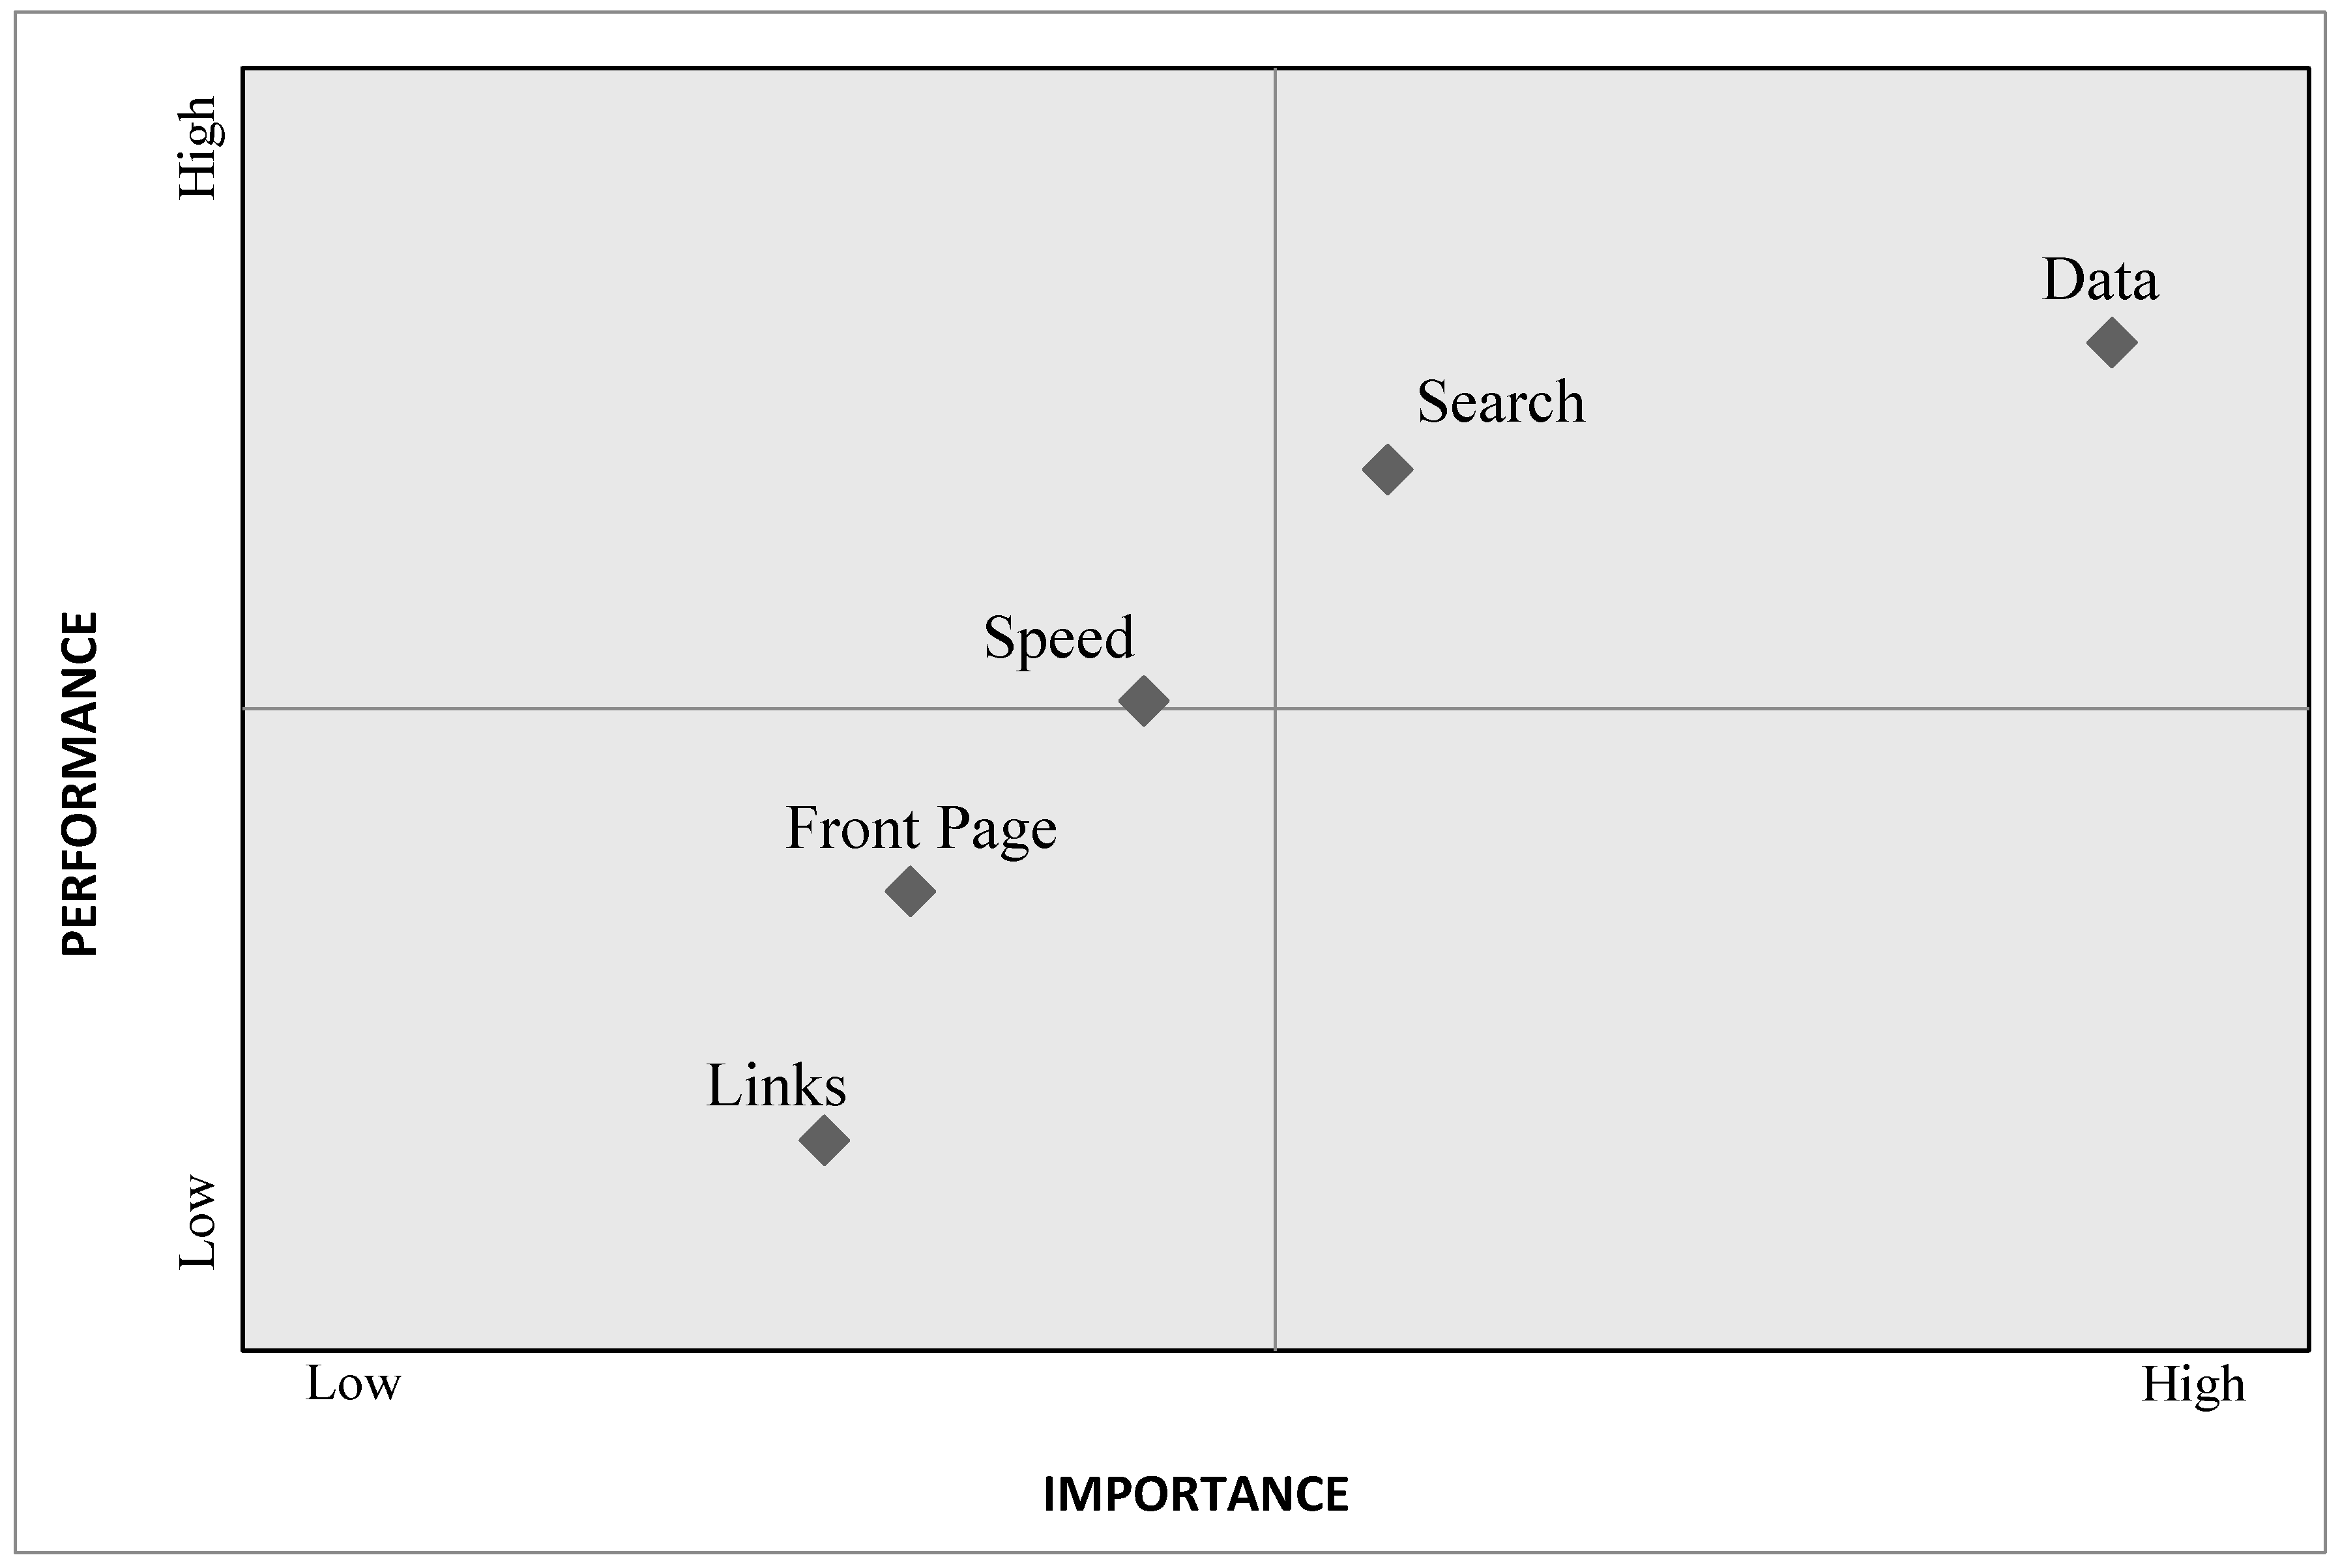
Regarding the action diagram for the Navigation criterion (Figure 5), we observed that the Search and Data sub-criteria are in the high performance and importance quadrant and constitute the comparative advantage of the website. On the other hand, the Front Page and Links sub-criteria are in the state of small effort/low effectiveness, which means that they should be closely monitored since they could become important to users in the future.
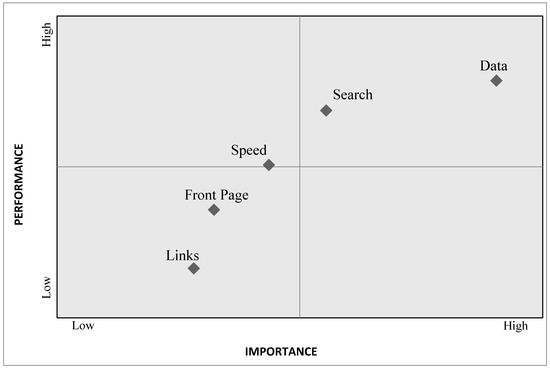
Figure 5.
Action diagram for the Navigation criterion.
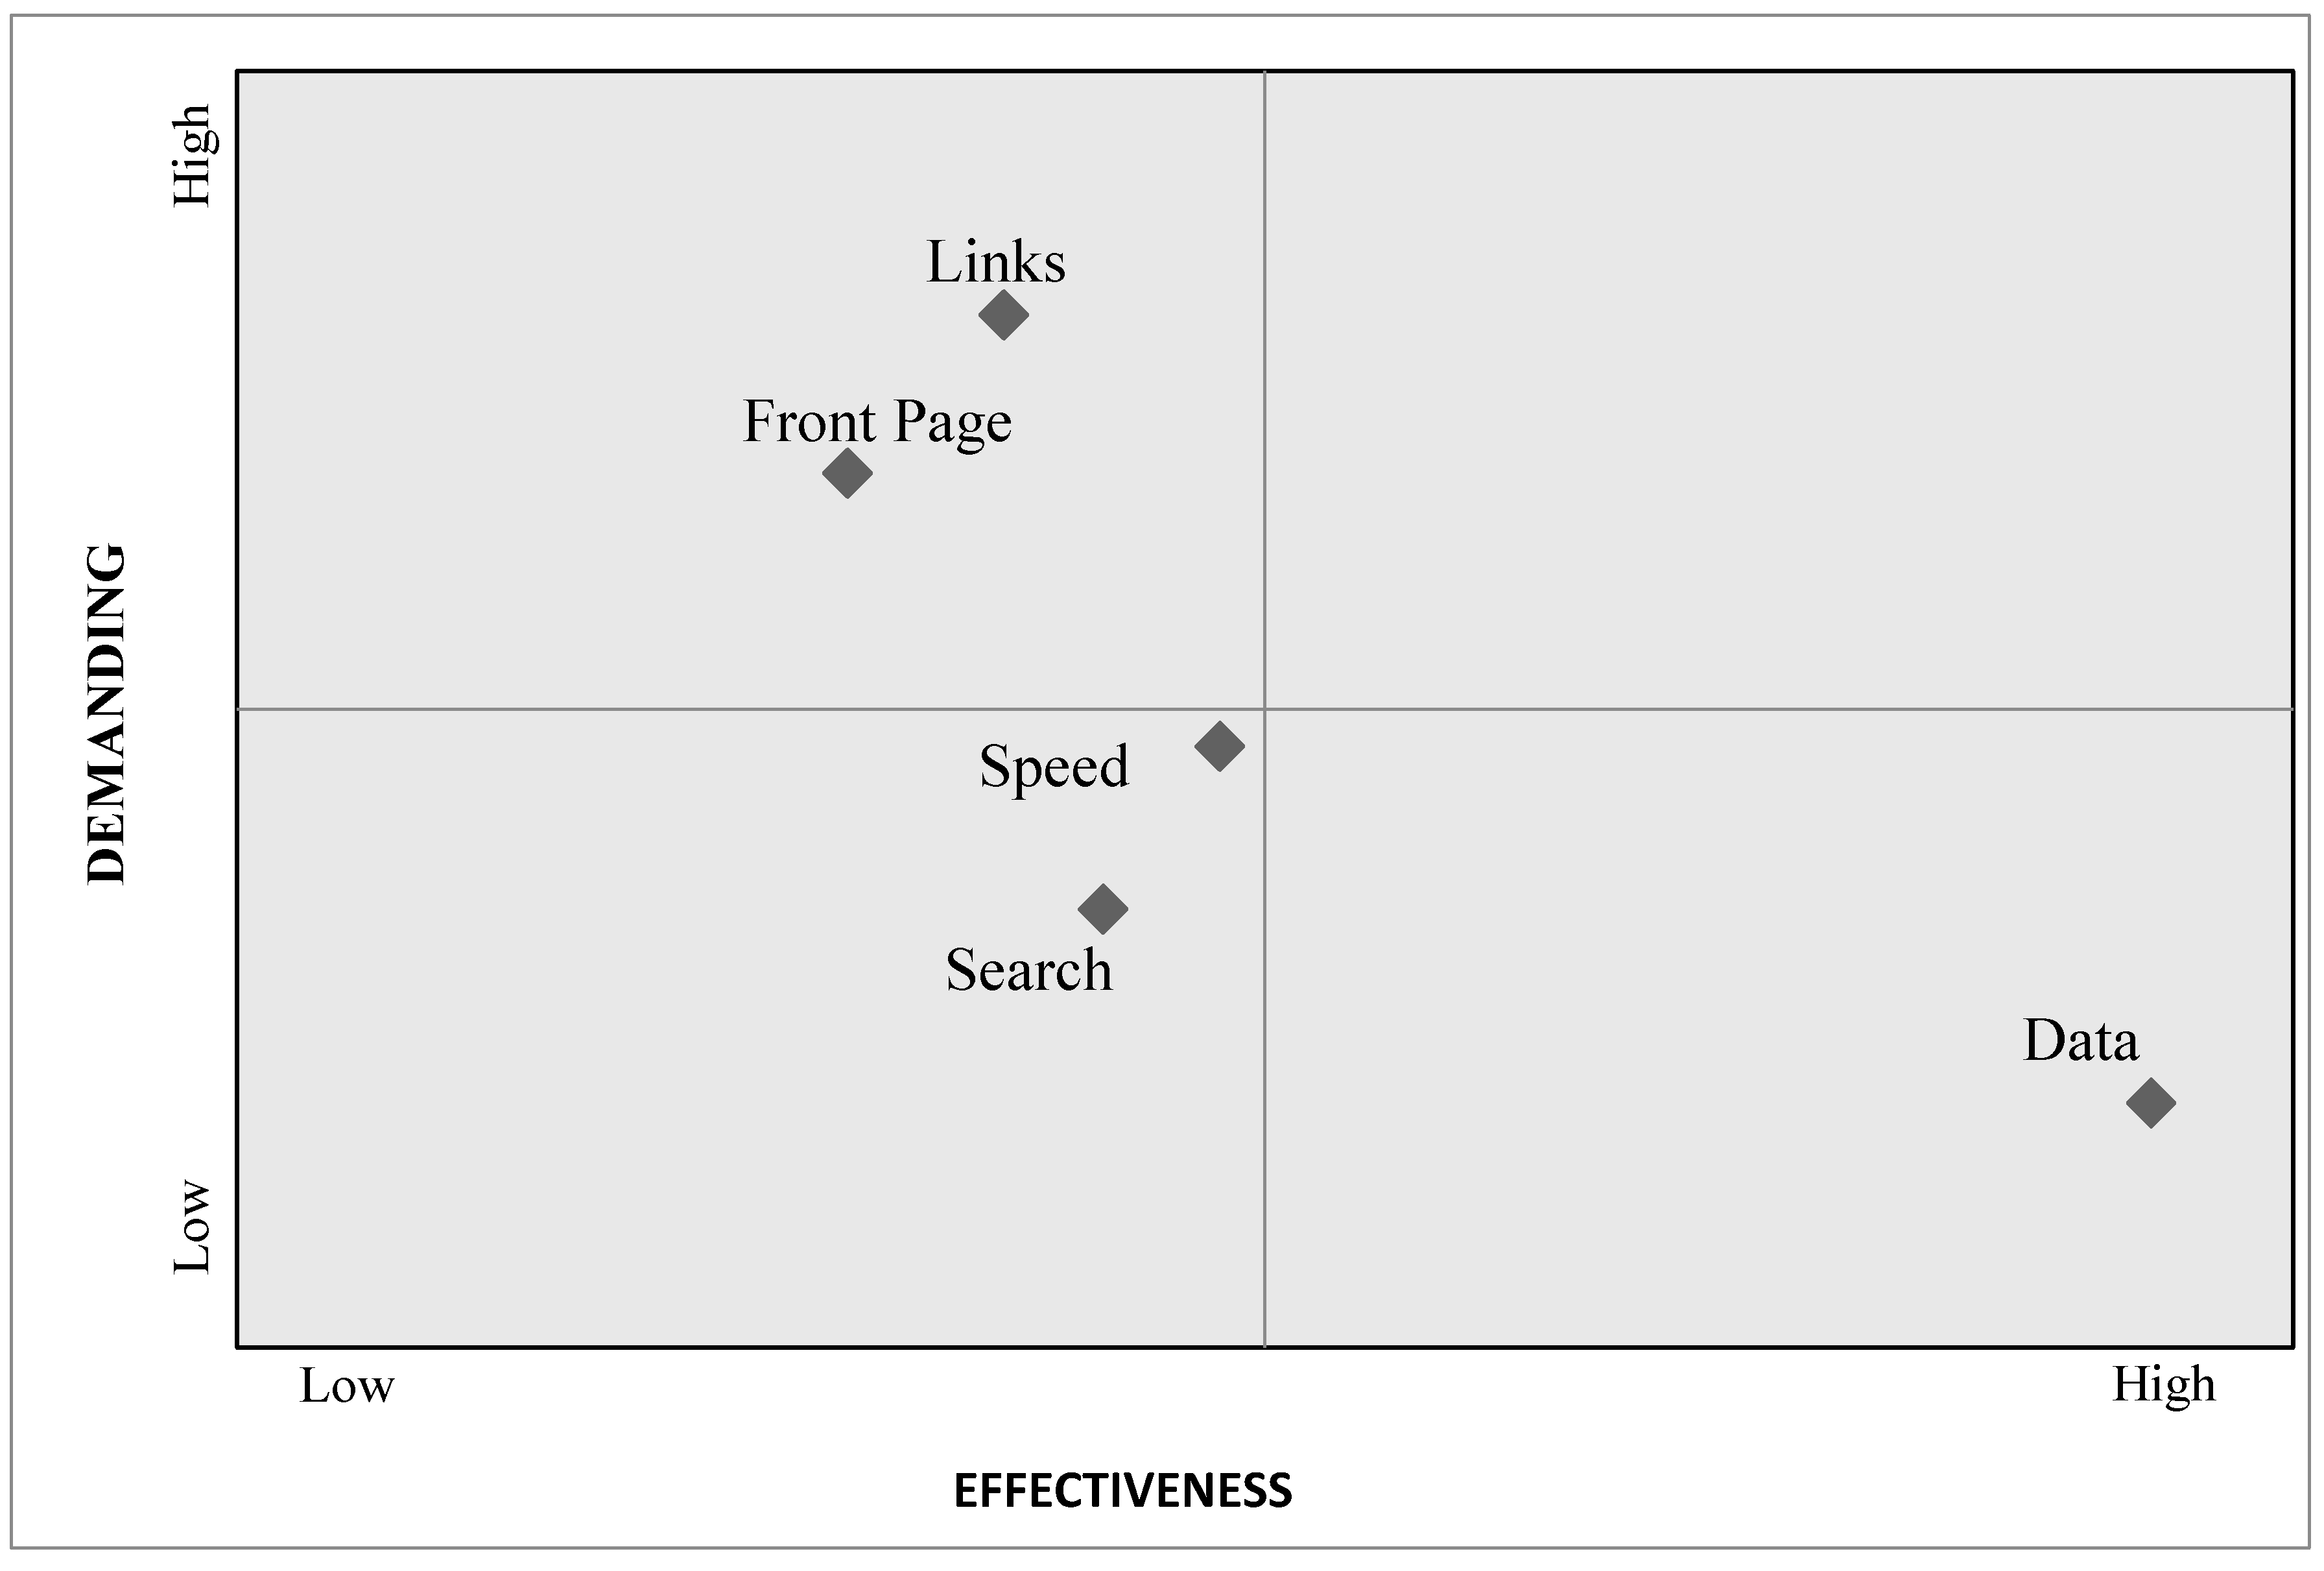
Concerning the improvement efforts as shown by the relevant navigation improvement diagram (Figure 6), they should be focused on the sub-criteria of Data since the improvement will require little effort and will be highly effective. On the contrary, the sub-criteria of Links, Front Page, Speed and Search are of low priority for improvement as they show low efficiency with significant effort to improve.
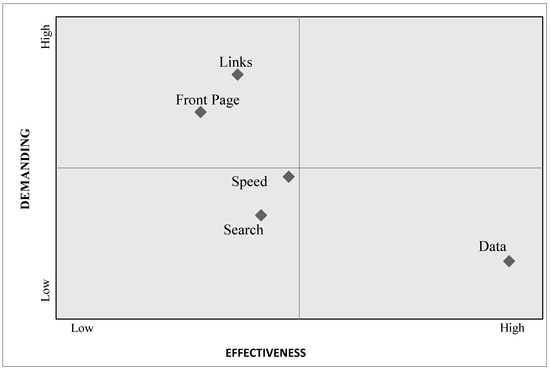
Figure 6.
Improvement diagram for the Navigation criterion.
3.3.2. Design
The second criterion being considered is Design. This criterion has six sub-criteria, which are the aesthetics of the website (Aesthetics), the design of the home page (FrontPage Design), the photos of the website (Images), the background of the website (Background), the colors of the web page (Colors) and the website organization (Organization). The results of the MUSA method as shown in the table below illustrate that visitors are satisfied with almost all the sub-criteria. Front Page D. with 52.9% and the Organization with 63.0% satisfaction are not high enough. Visitors can be described as "demanding" for the sub-criteria for Organization and FrontPage D. and “non-demanding” for the other sub-criteria, based on the demanding indices (Table 5).

Table 5.
Partial Satisfaction Frequencies and Average Satisfaction, Demanding and Improvement Indices for the Design Criterion (%).
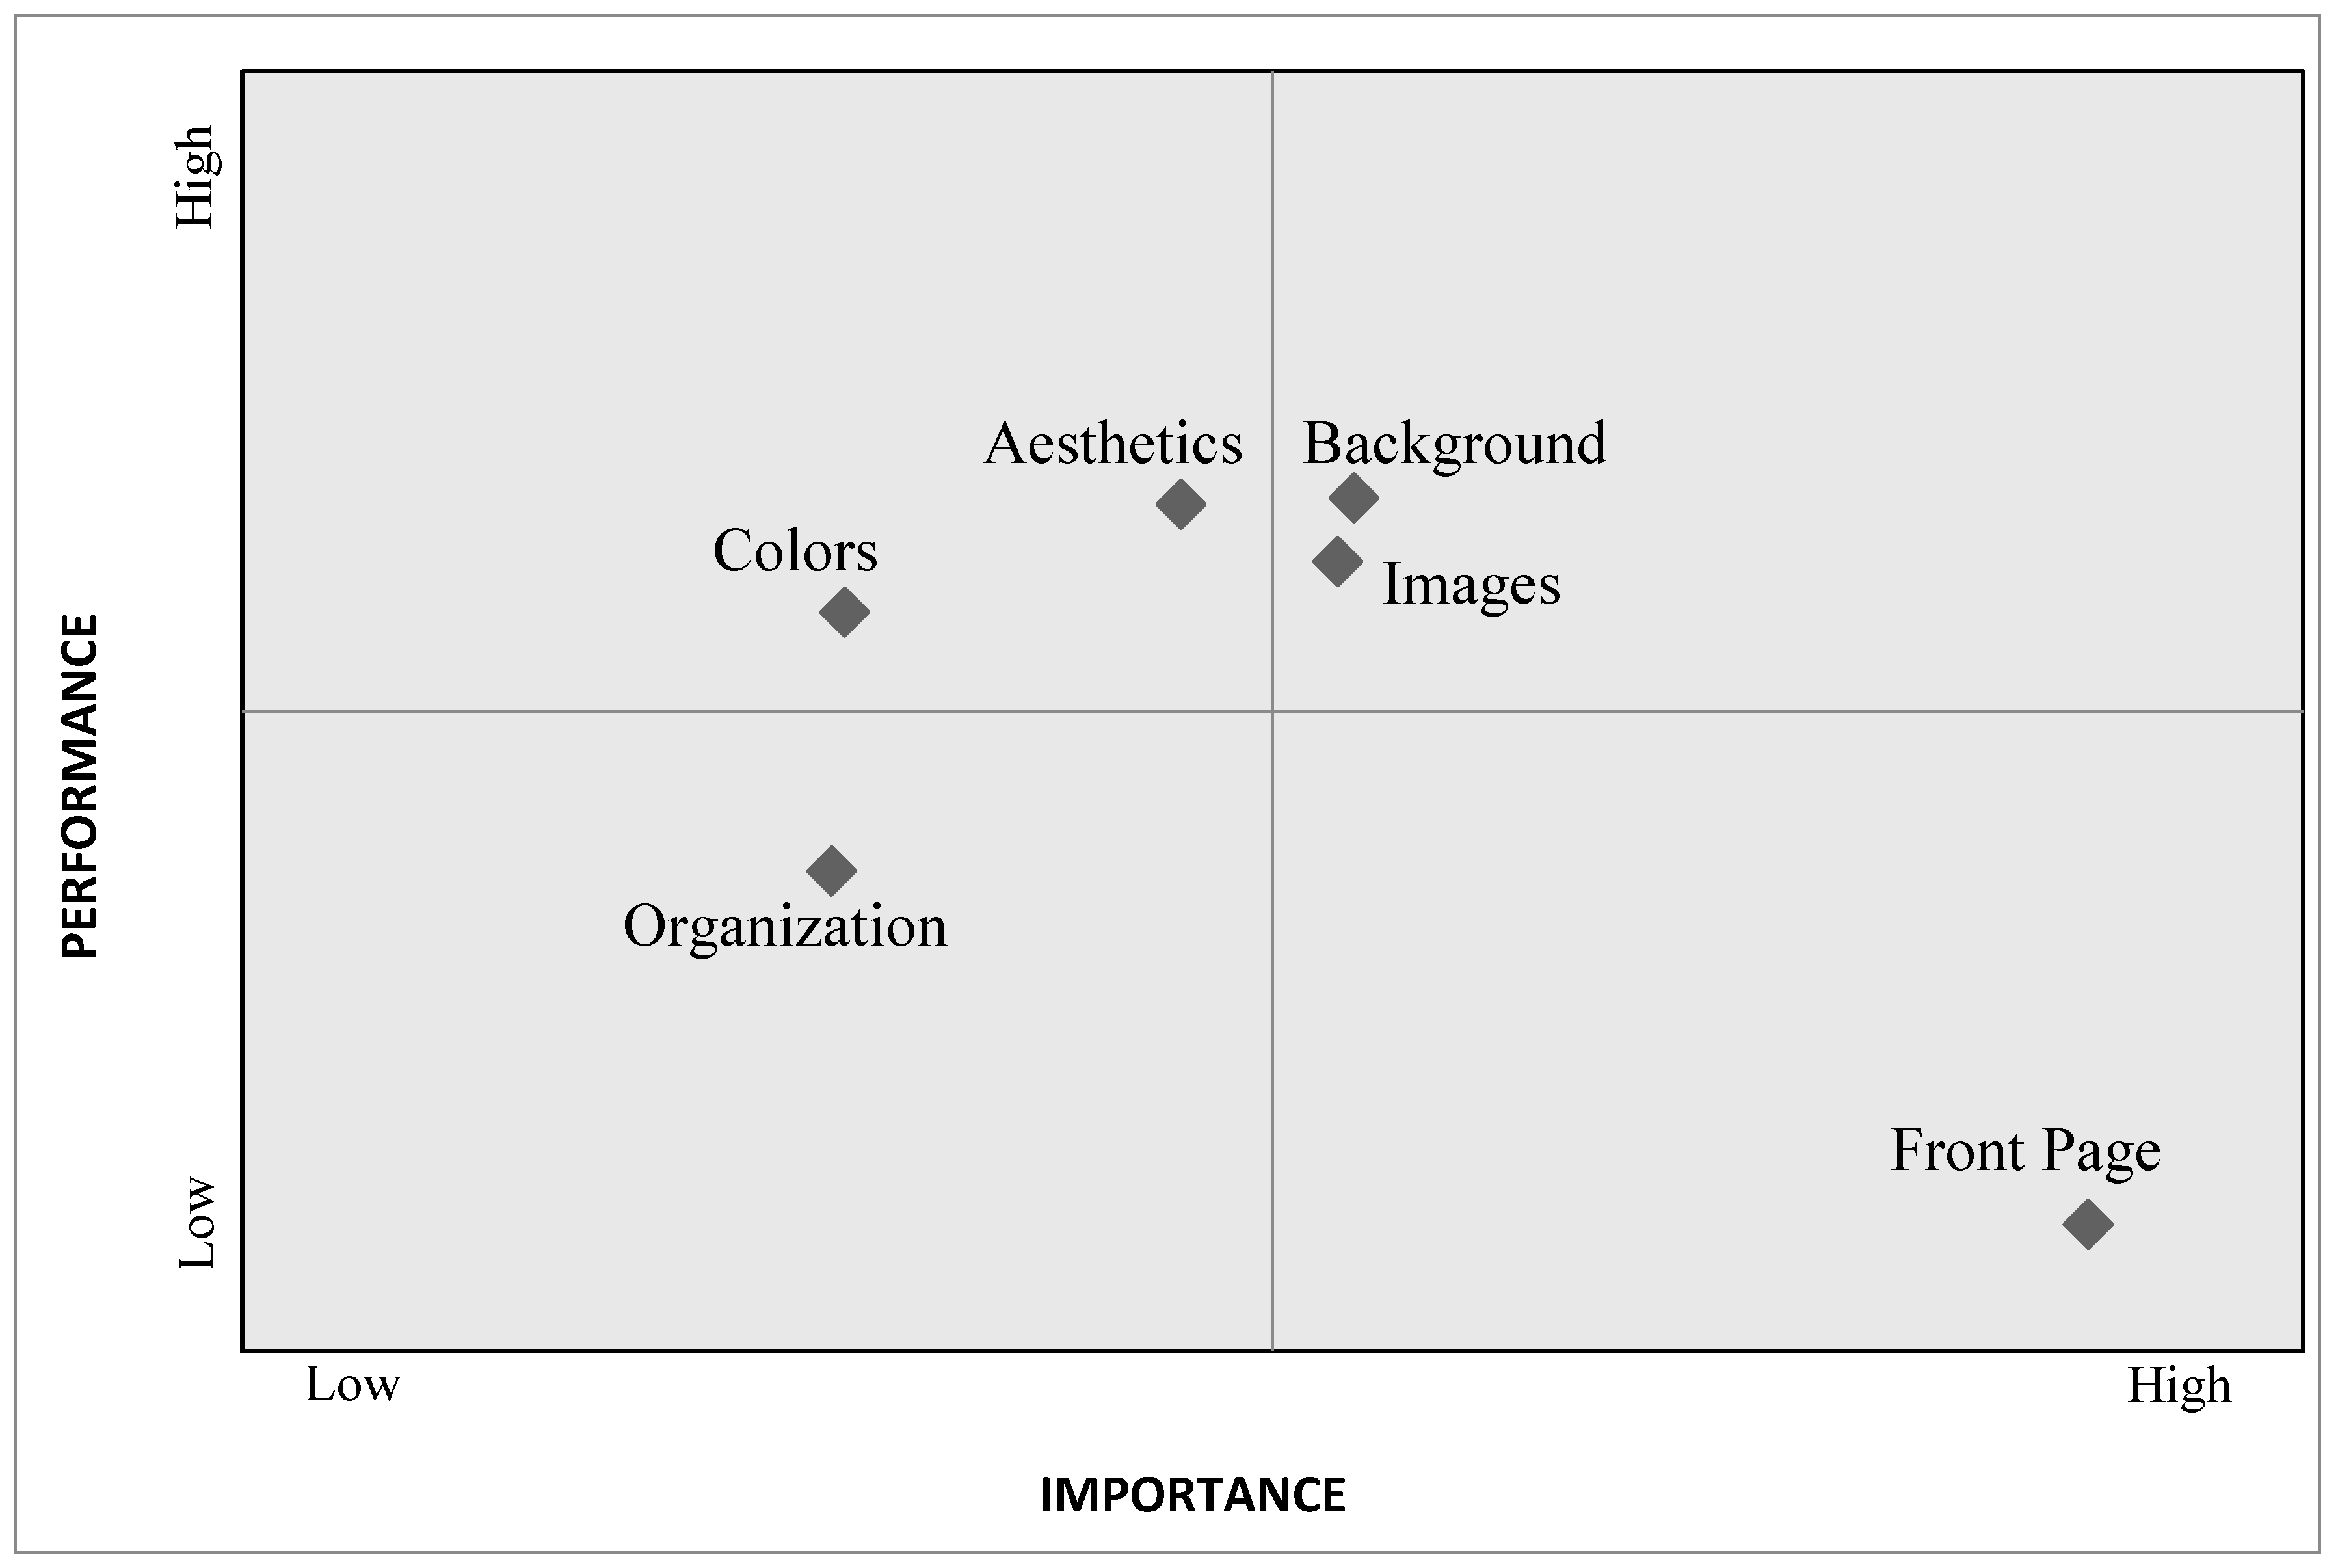
From the relevant Action diagram for the Design criterion (Figure 7), we can elicit that the FrontPage D. is the sub-criterion that should be prioritized since it is considered important for the users and they are not satisfied with it. On the contrary, Background and Images are the comparative advantages of agroGOV.gr, while the organization sub-criterion should be considered for future rearrangements.
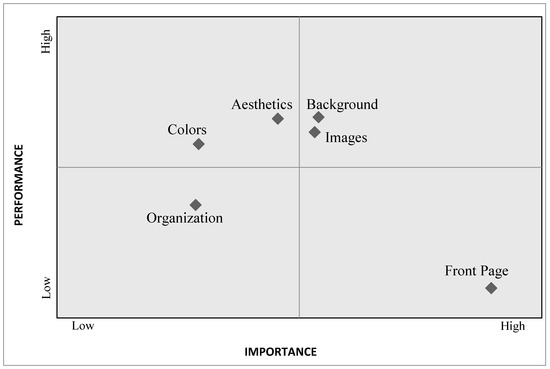
Figure 7.
Action diagram for the Design criterion.
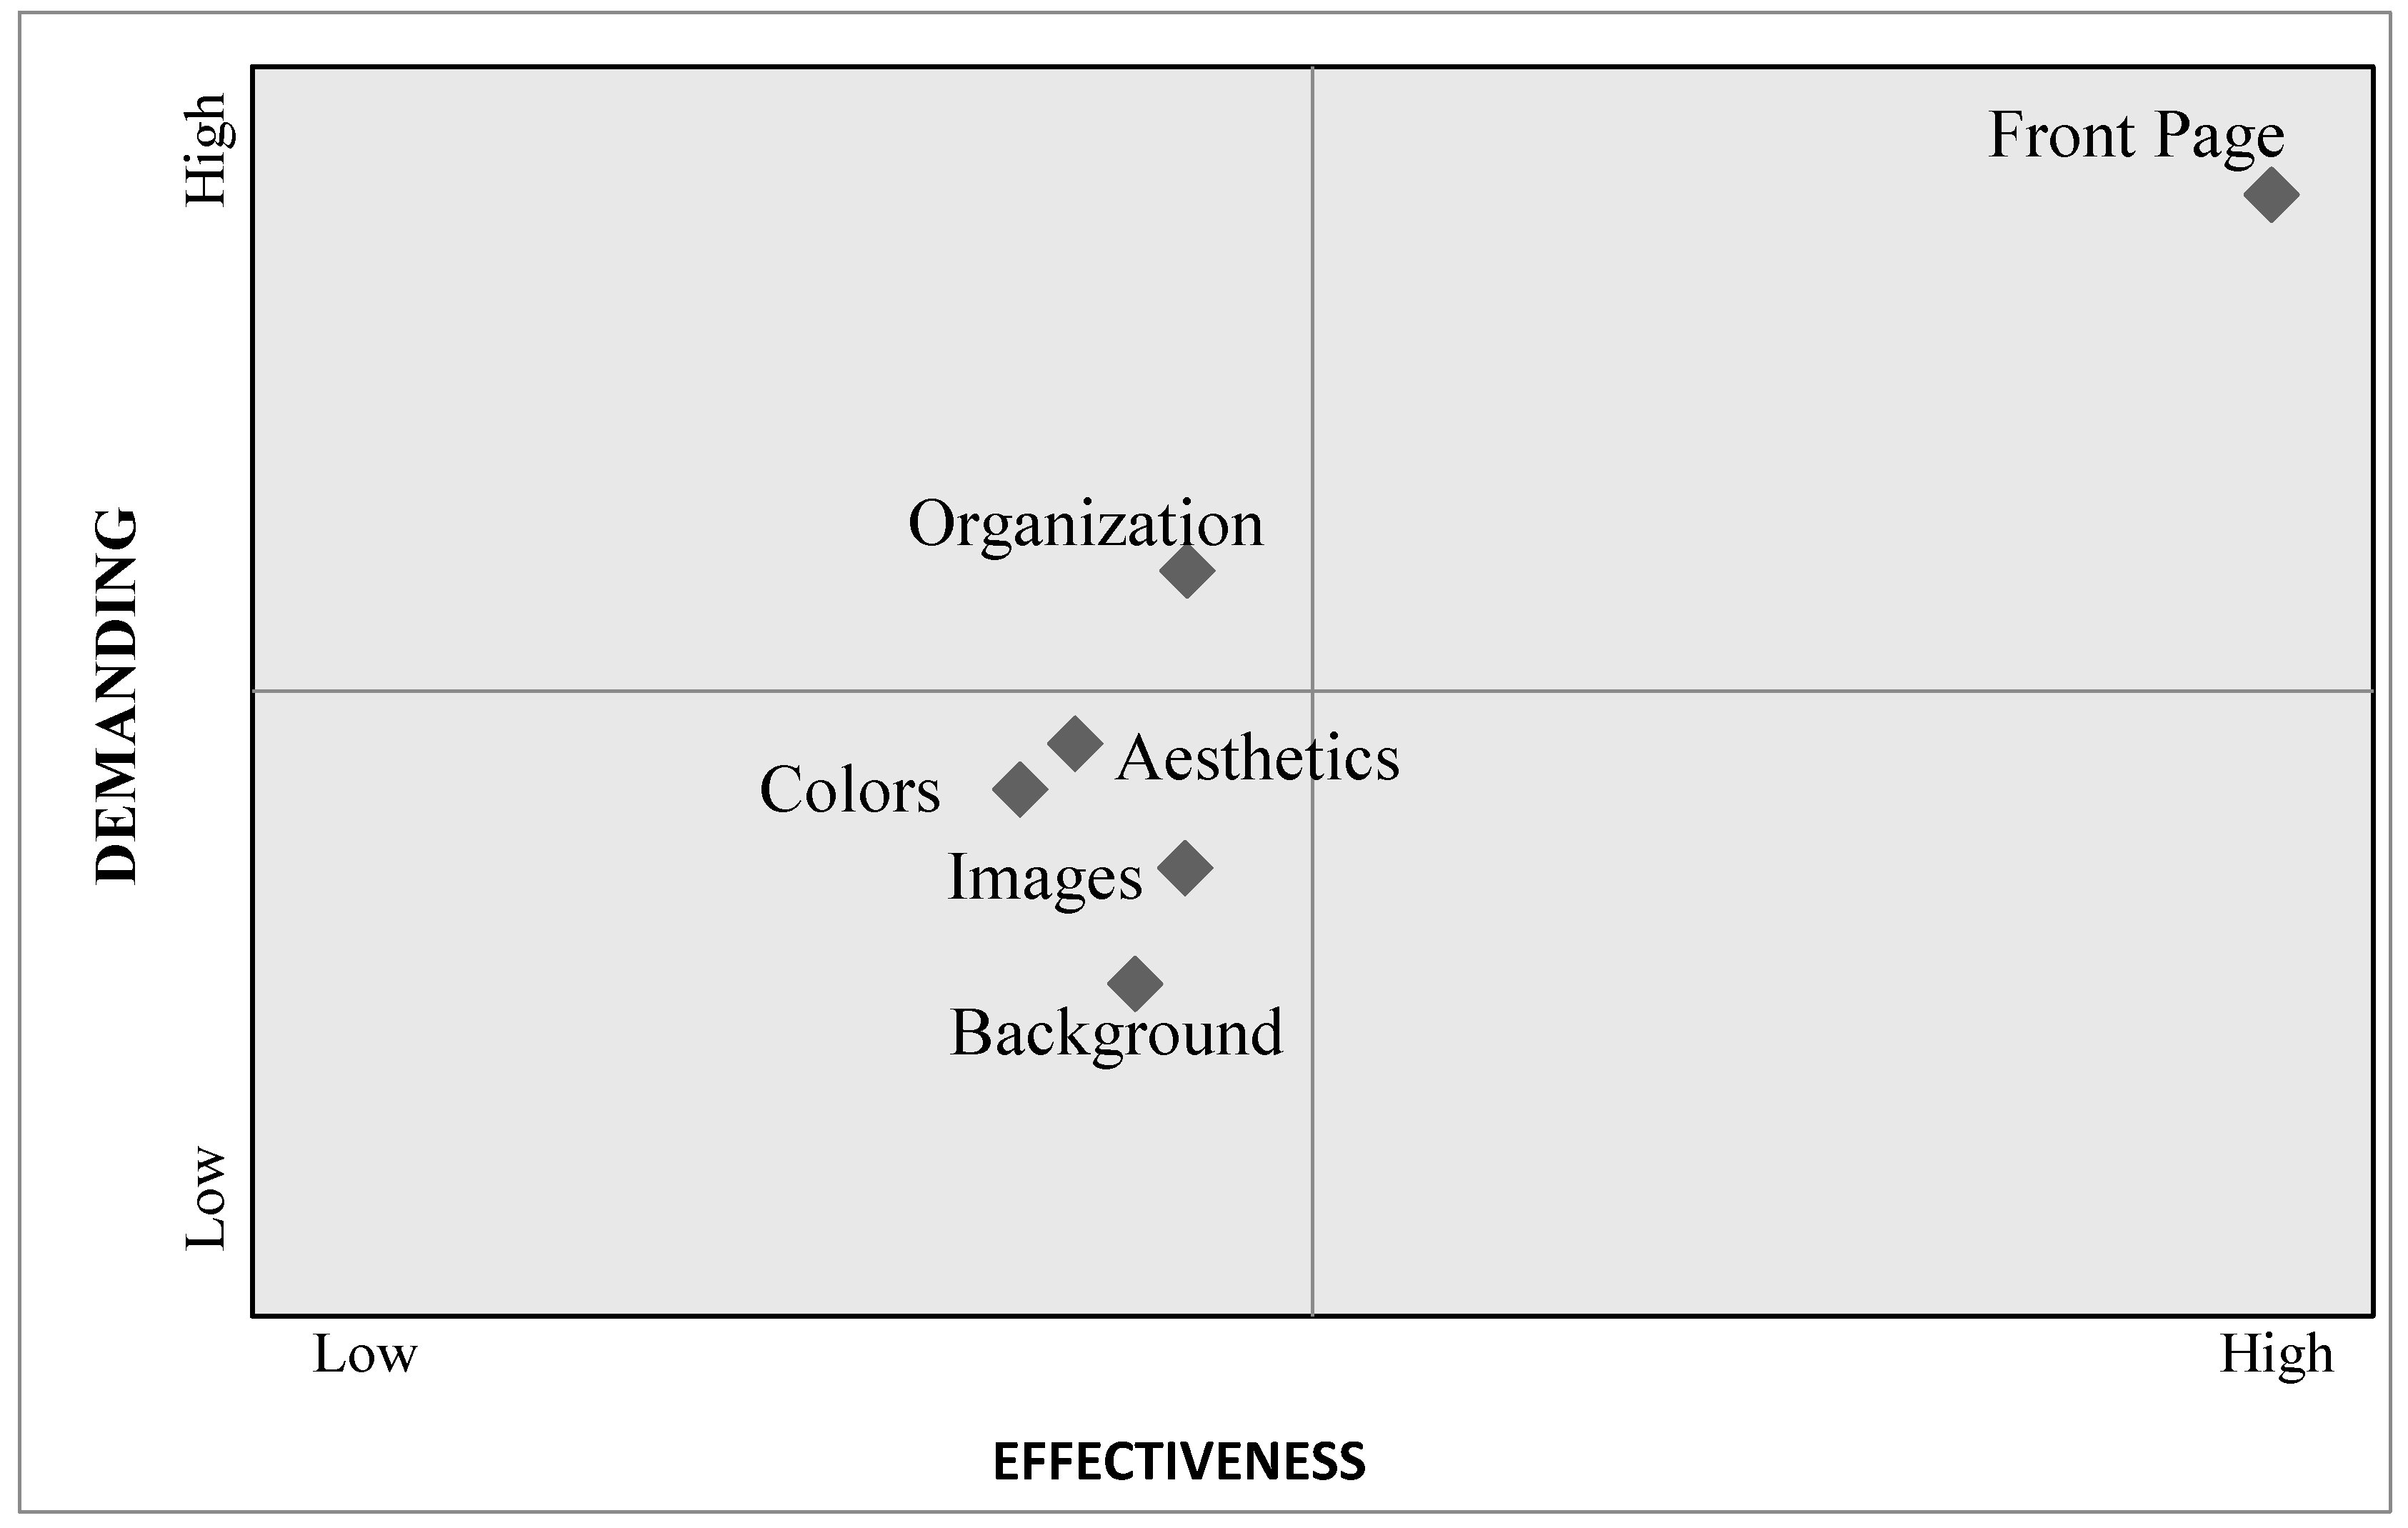
Regarding the improvement diagram of the Design criterion, a major priority is to improve the FrontPage D., while all other features, except from the Organization, are not of high priority for improvement (Figure 8).
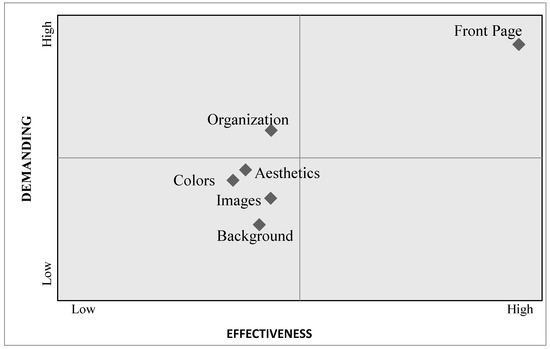
Figure 8.
Improvement diagram for the Design criterion.
3.3.3. Accessibility
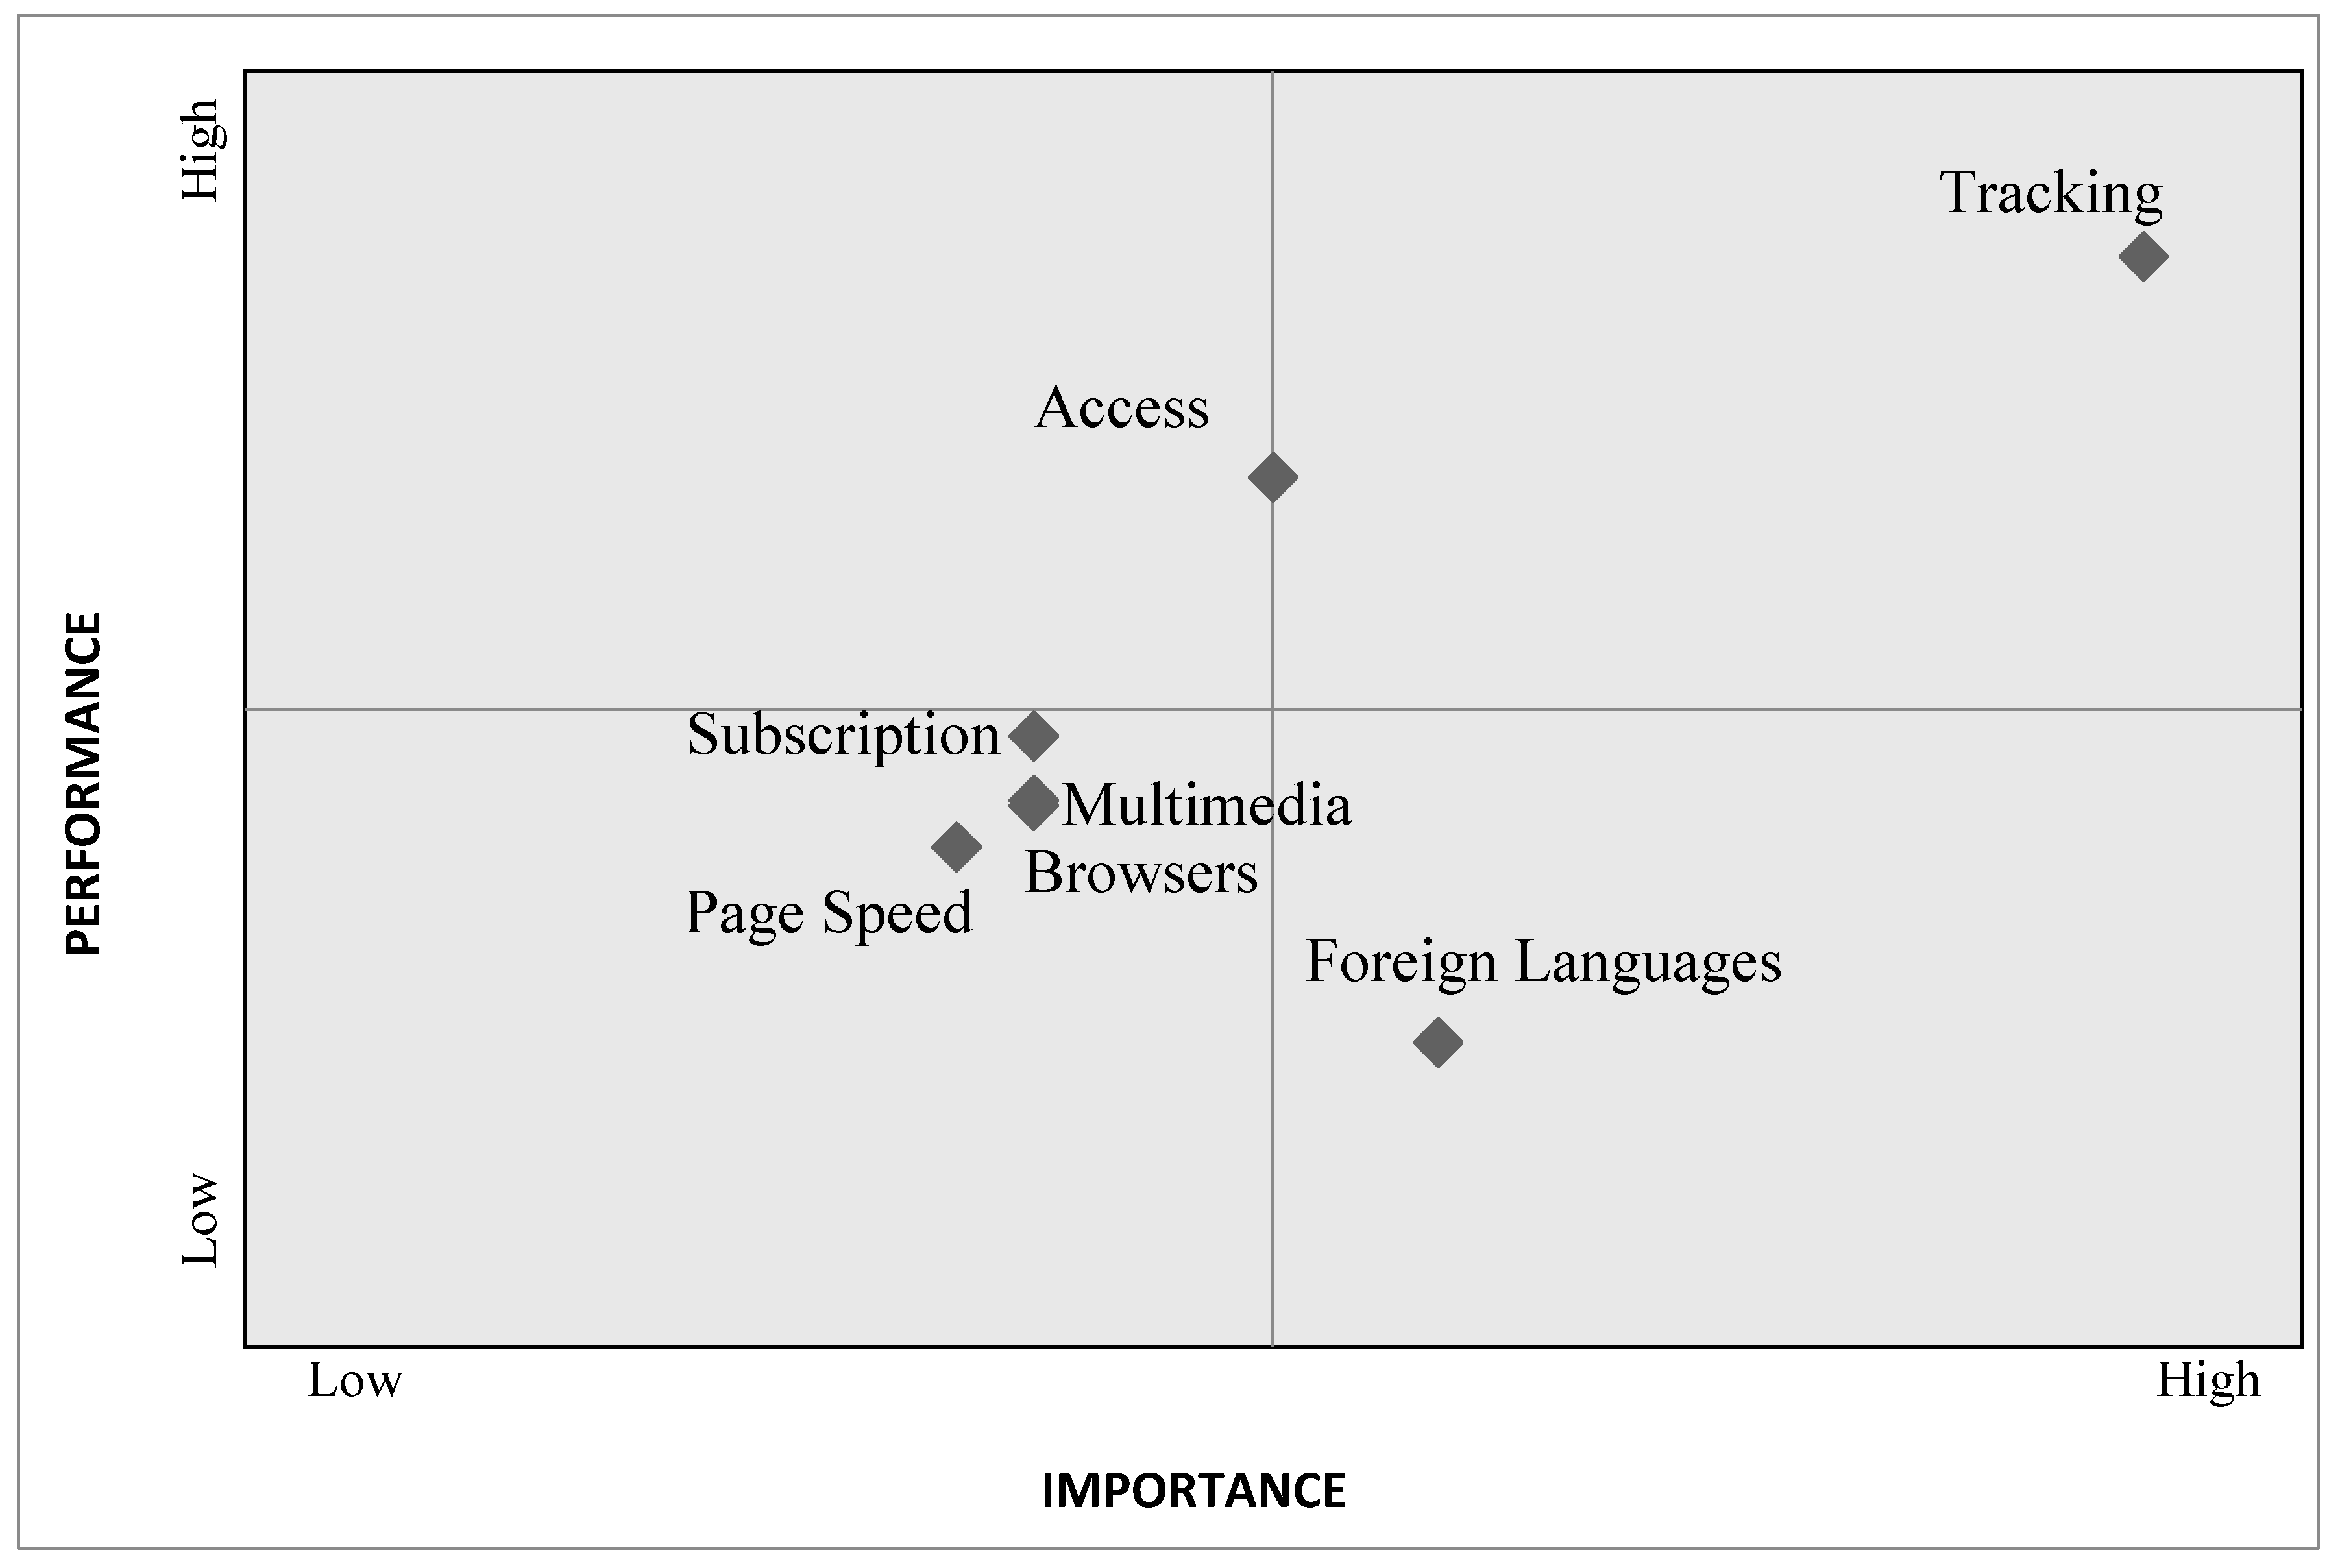
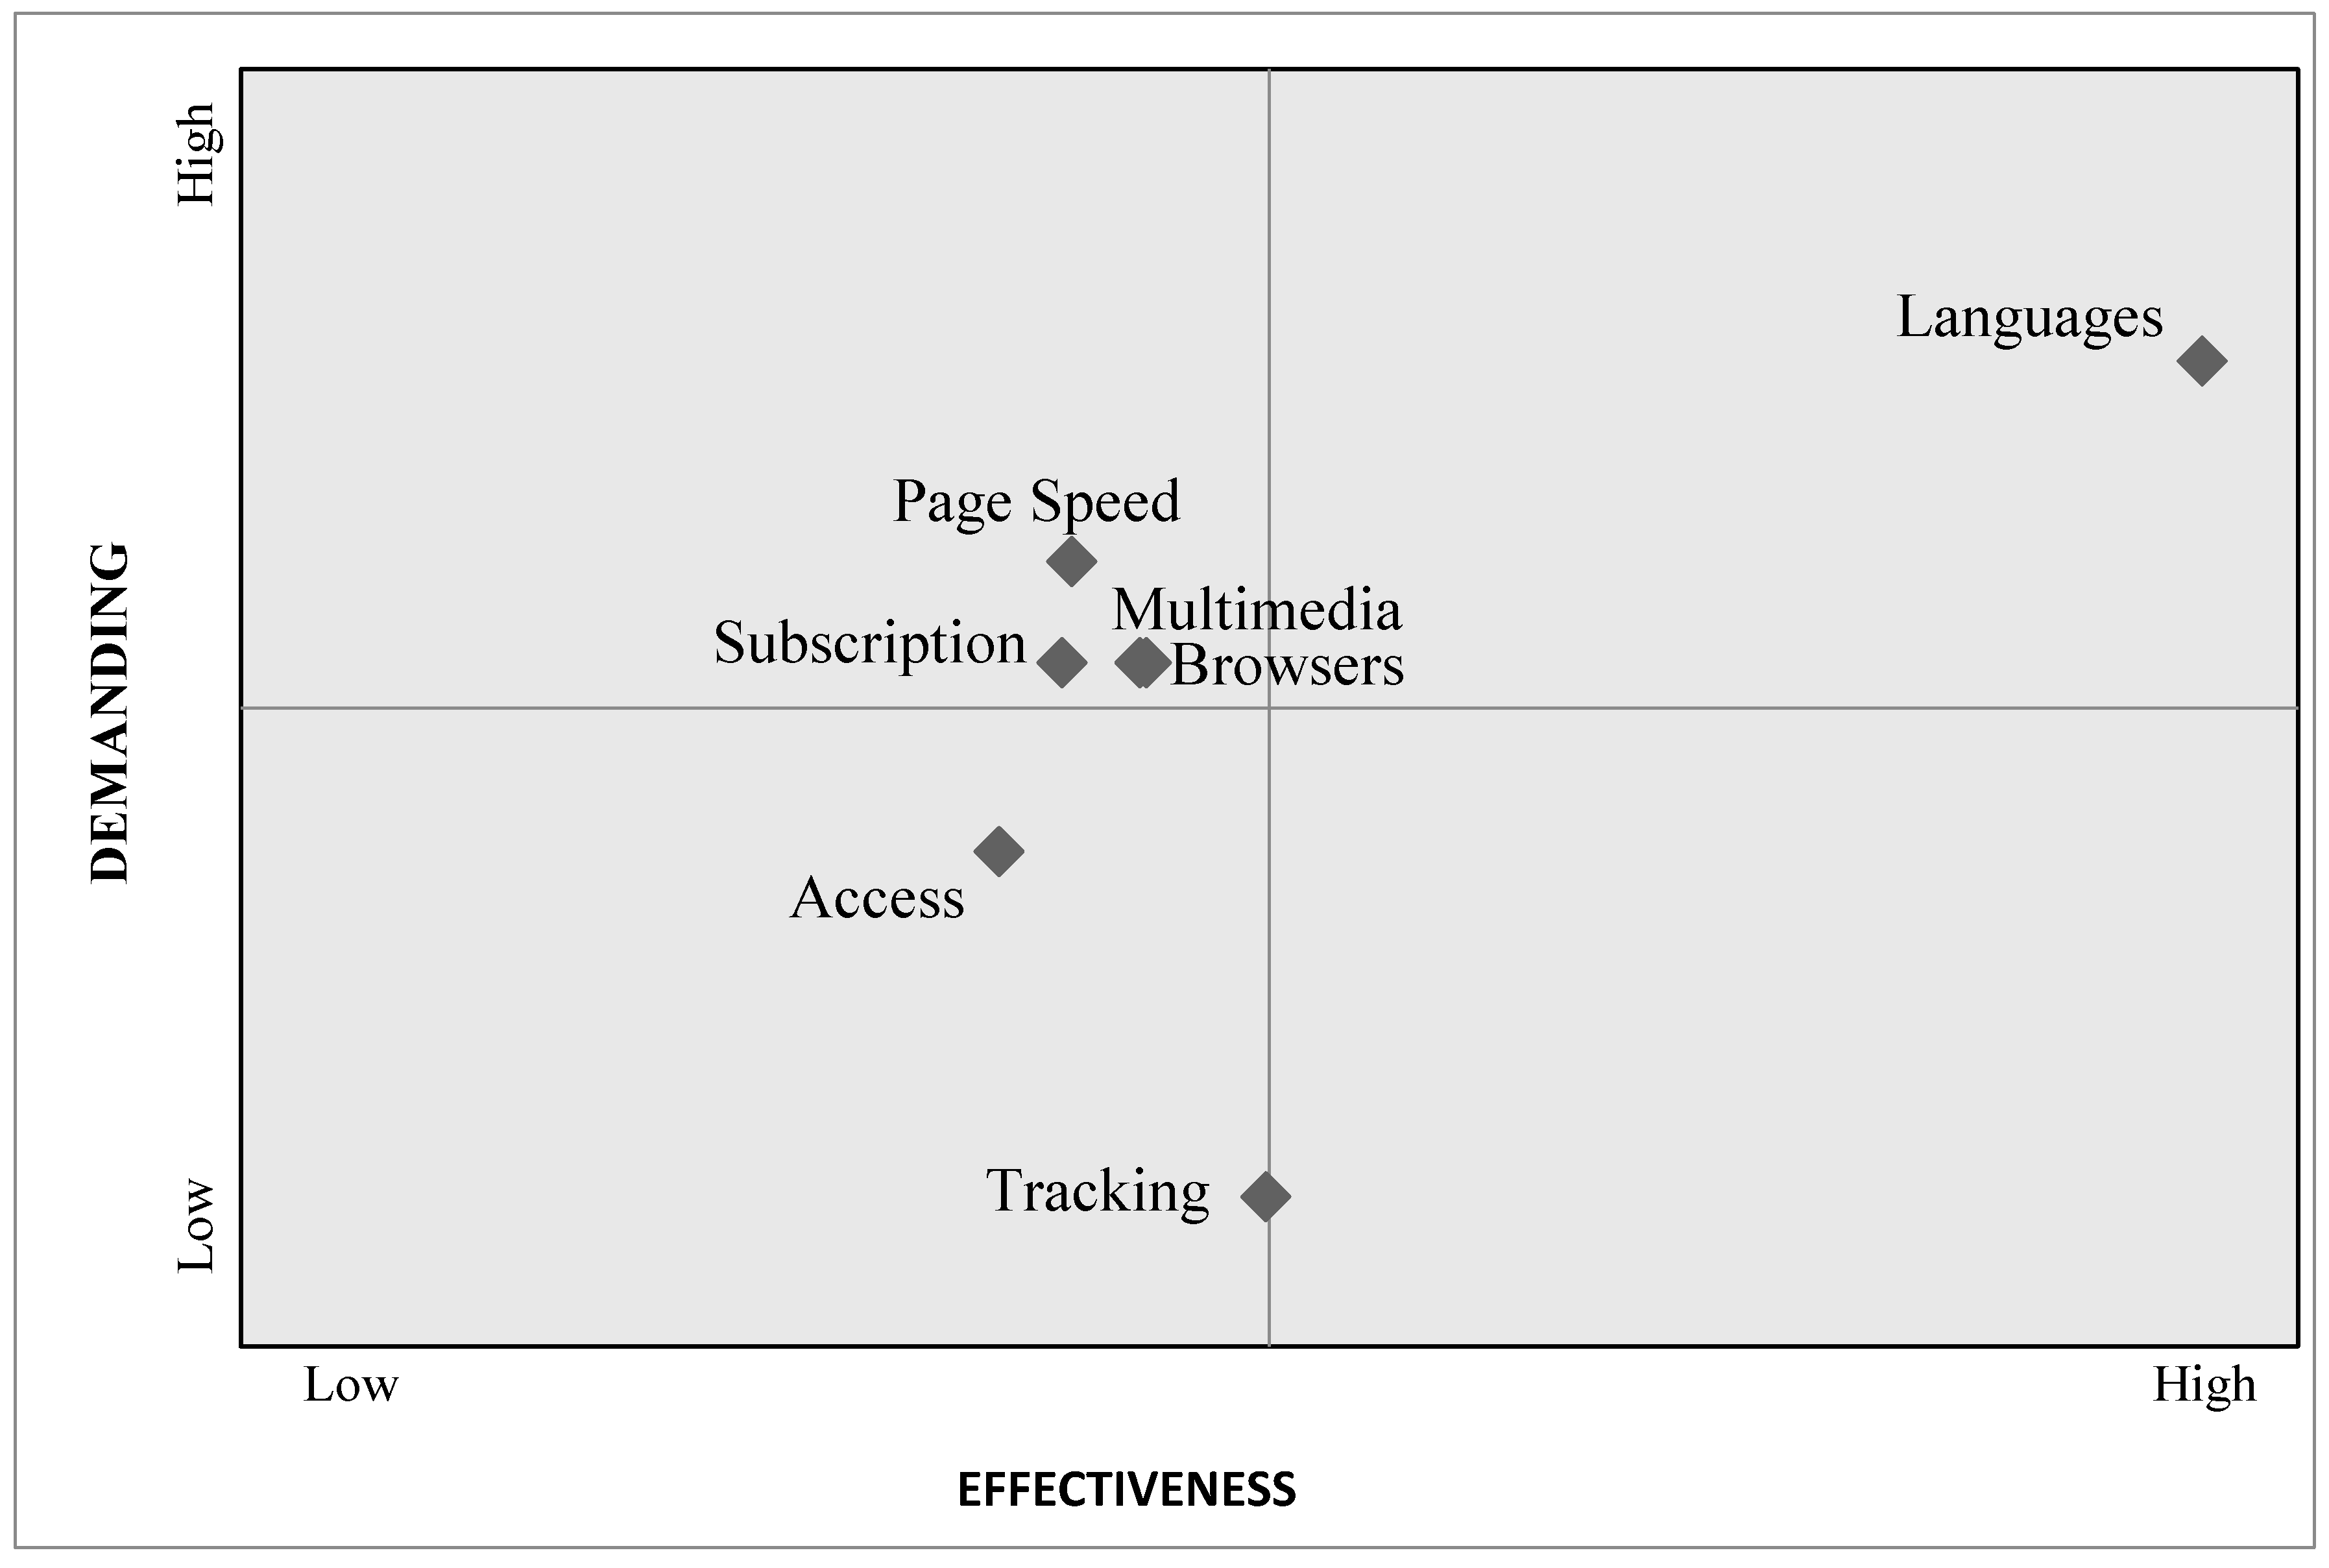
The third criterion being considered is Accessibility. This criterion has seven sub-criteria, which are: User registration (Subscription), Multilingual support (Languages), Multimedia support (Multimedia), Browsers support (Browsers), access to website content (Access), page speed response (Page Speed) and search engines detection (Tracking). From the results of the MUSA method as shown in the Table 7, the satisfaction index is high for the Tracking sub-criterion as they can easily find the web portal in Search Engines. Visitors appear to be "demanding" for sub-criteria of Subscription, Languages, Multimedia, Browsers and Page Speed, whilst they are "non-demanding" for the Access and Tracking sub-criteria (Table 6).

Table 6.
Partial Satisfaction Frequencies and Average Satisfaction, Demanding and Improvement Indices for the Accessibility Criterion (%).
From the relevant action diagram for Accessibility (Figure 9), it appears that the sub-criterion of Languages should be prioritized, while Tracking and Access constitute a comparative advantage. From Figure 10 we can conclude that no sub-criterion is found in the first improvement quadrant, as shown in the improvement chart below, while the second priority for improvement is the sub-criterion Languages.
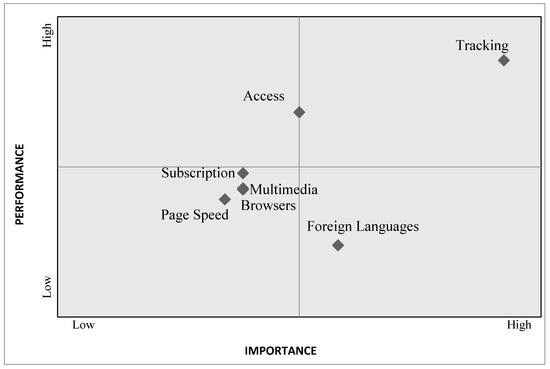
Figure 9.
Action diagram for the Accessibility criterion.
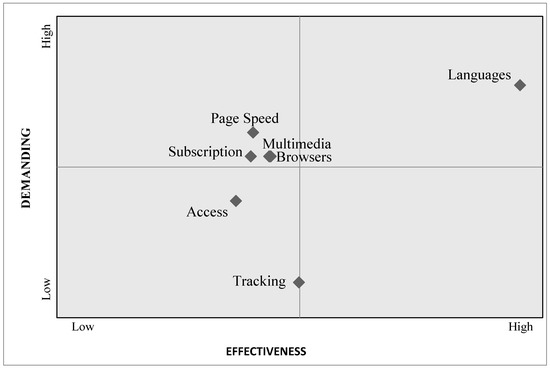
Figure 10.
Improvement diagram for the Accessibility criterion.
3.3.4. Interaction
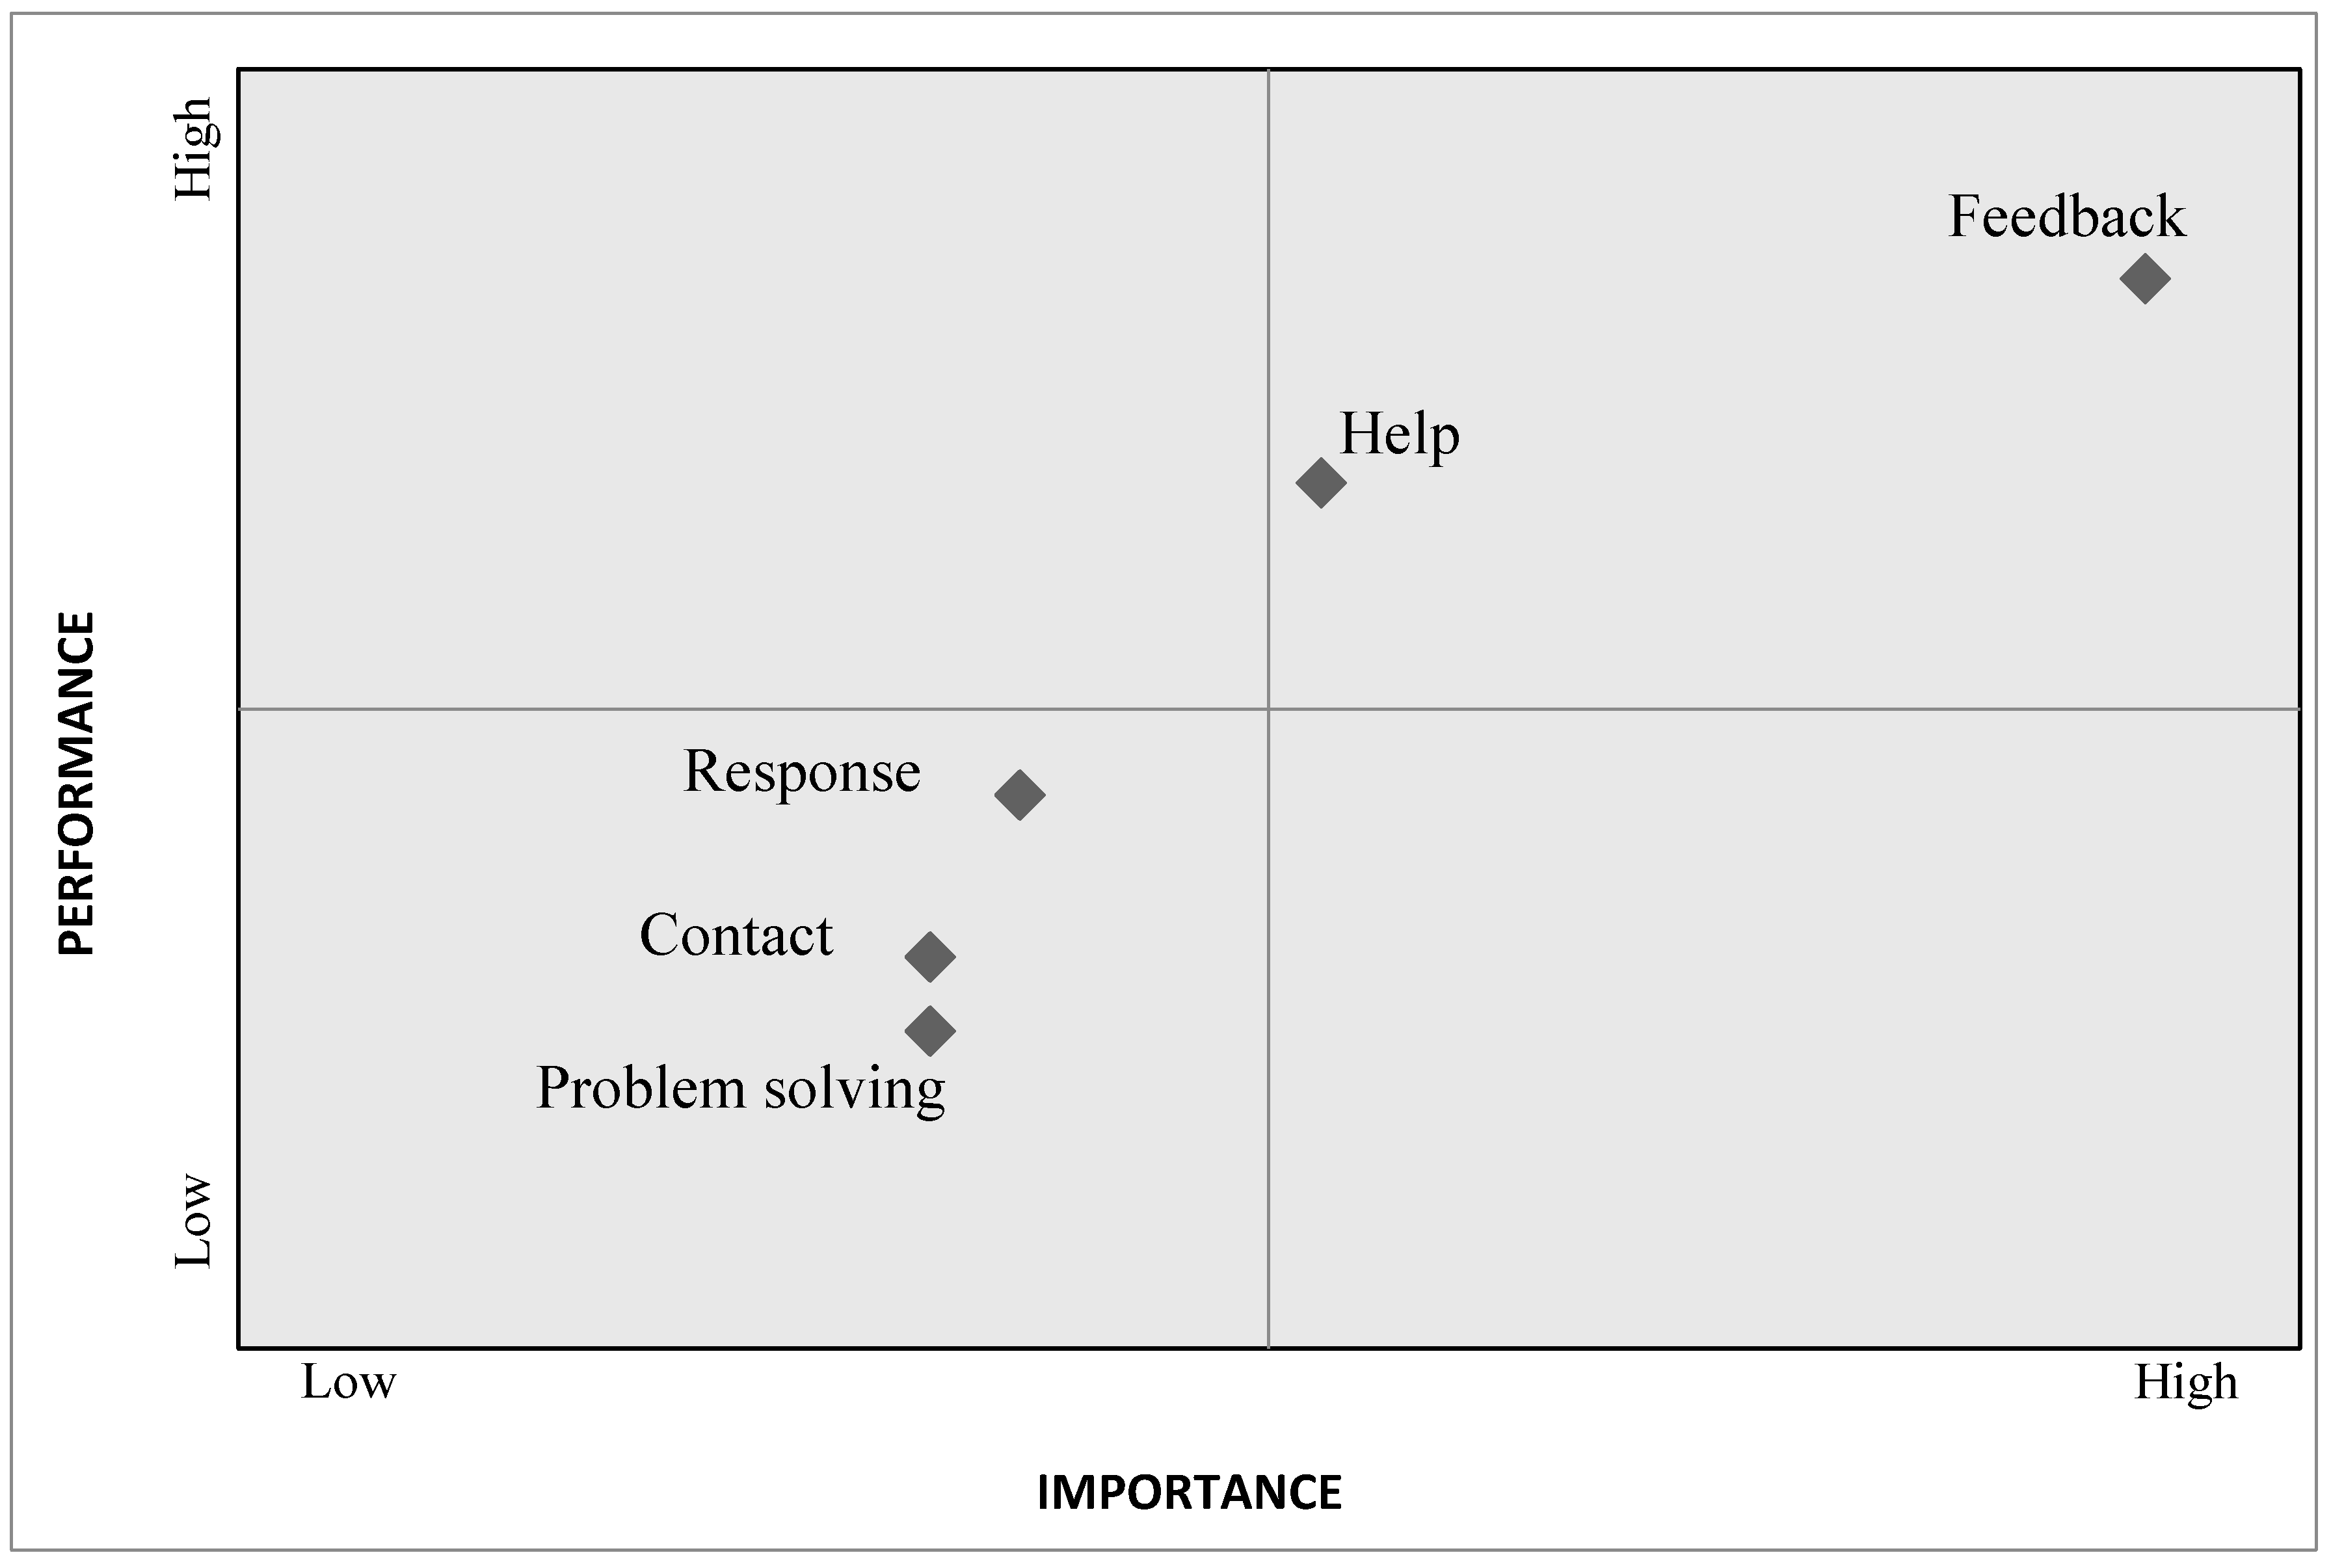
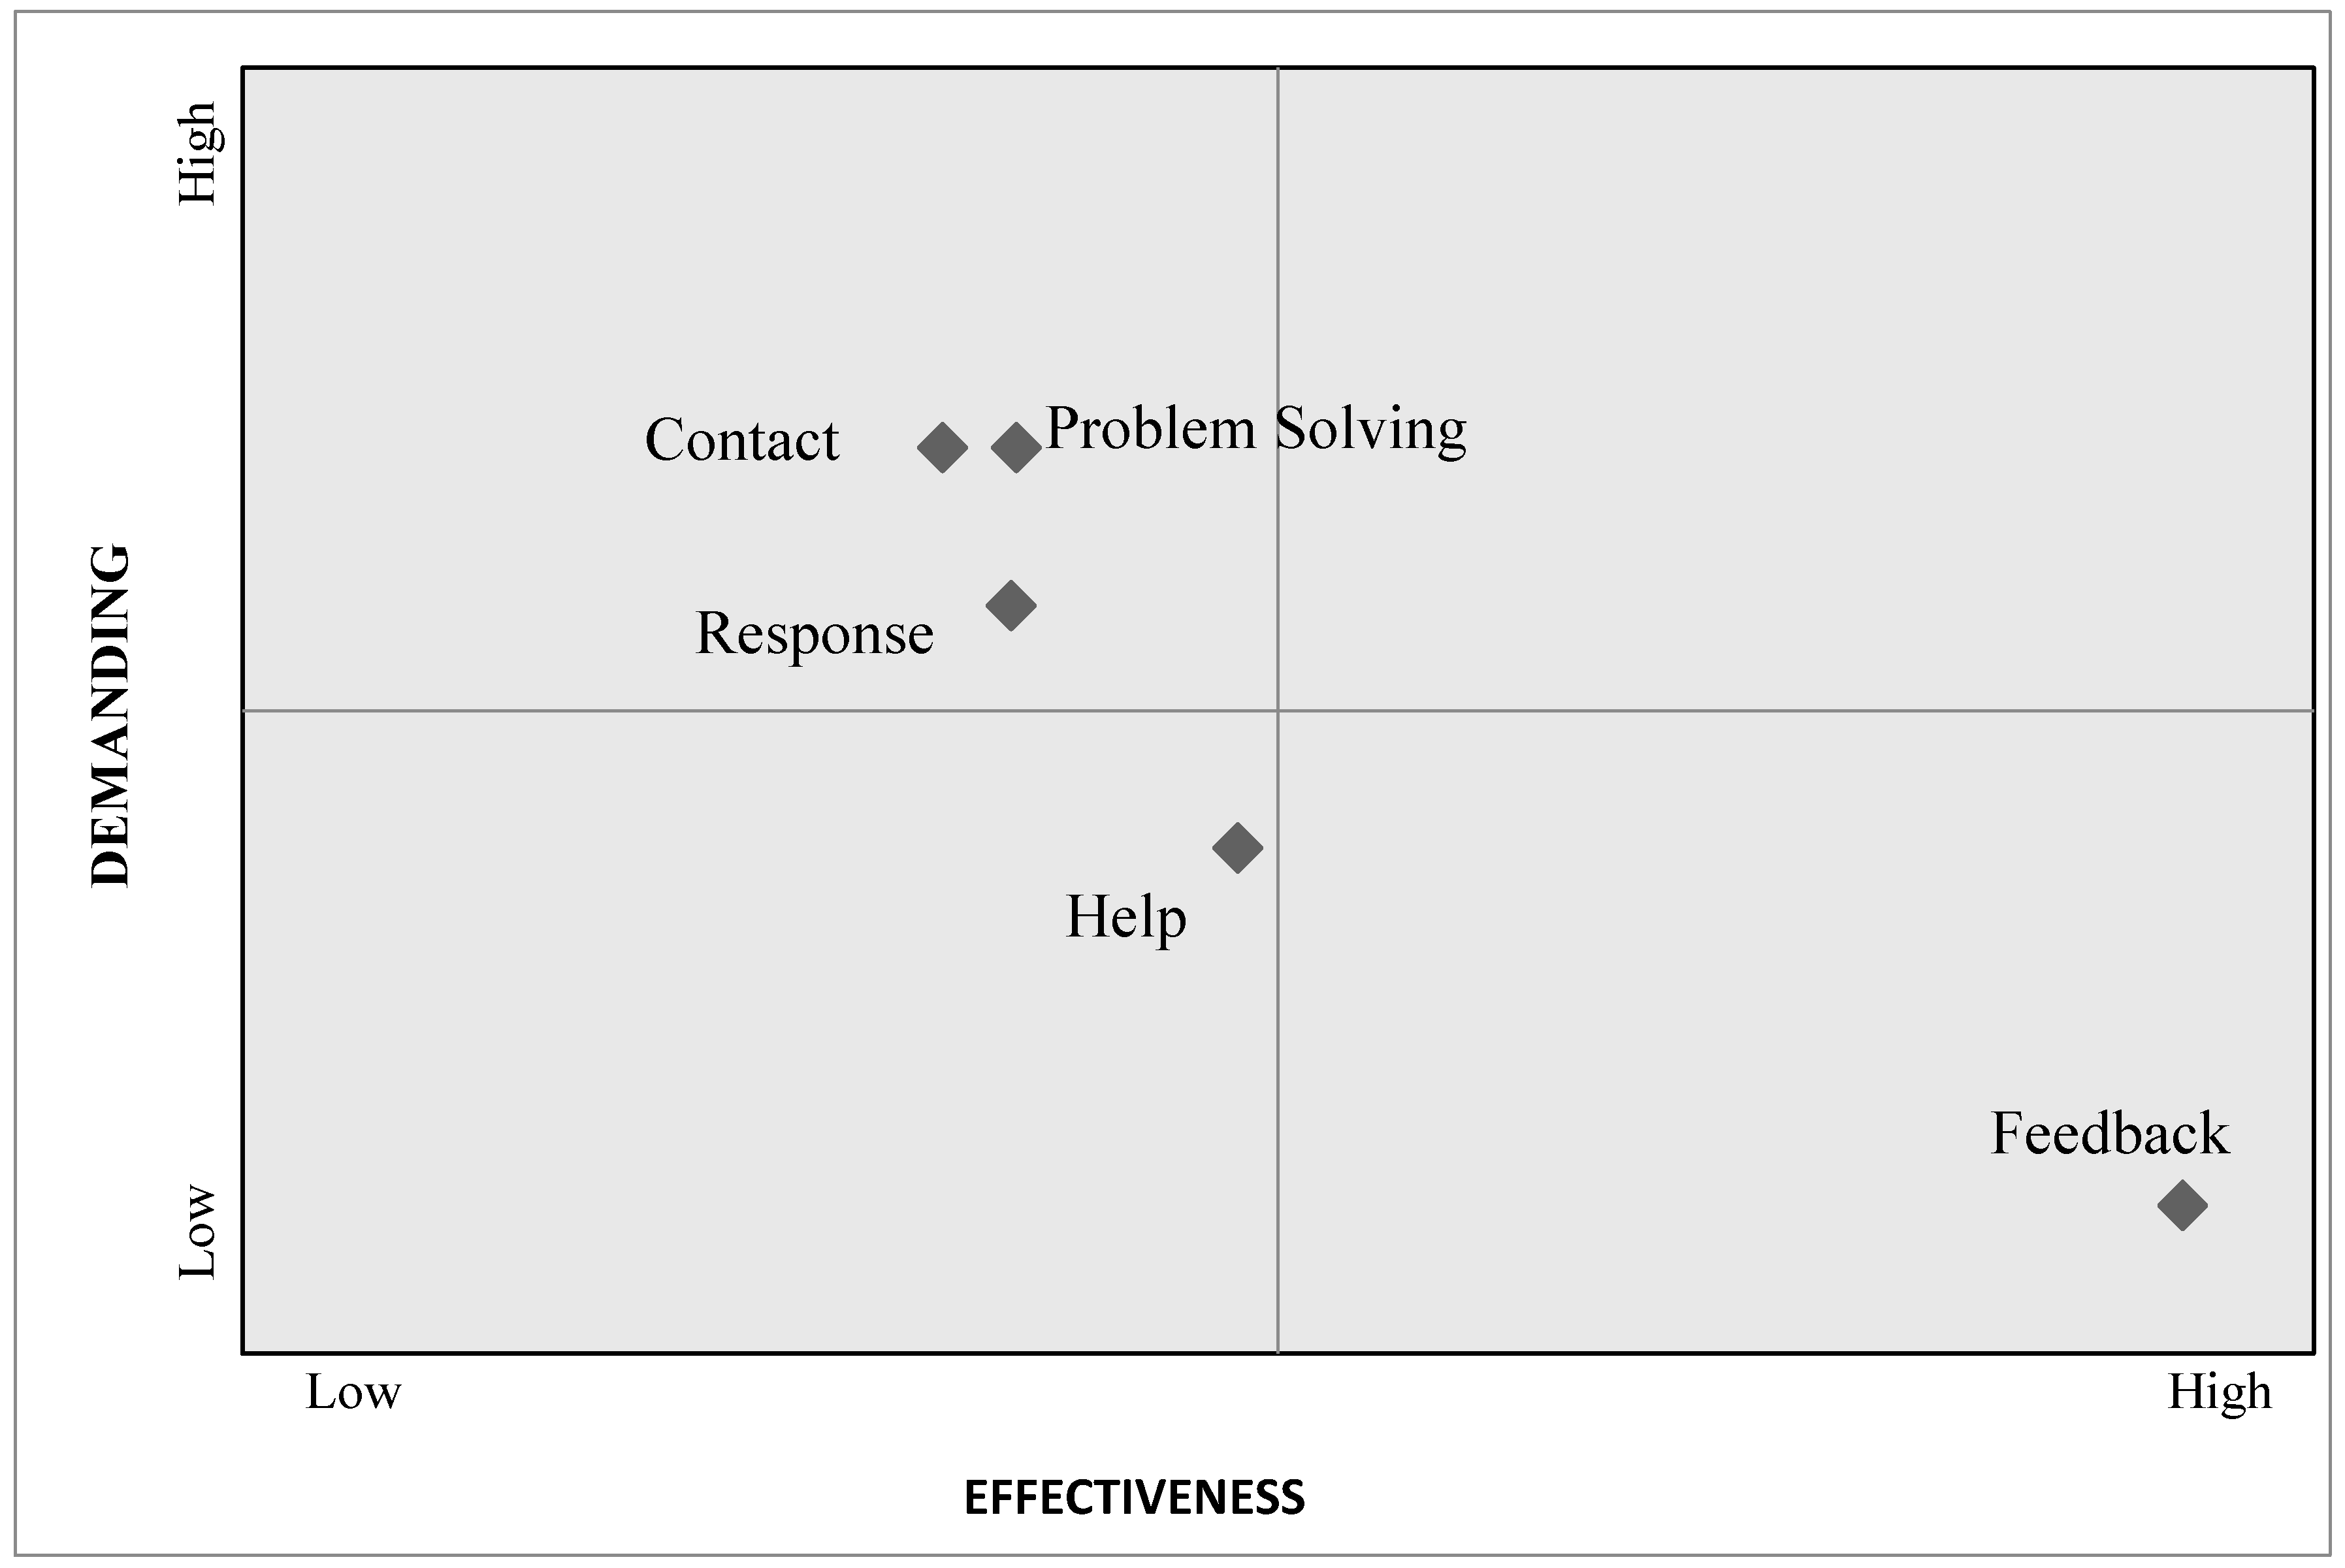
The fourth criterion being considered is Interaction. This criterion has five sub-criteria, which are communication with users (Contact), response to user requirements (Response), problem solving (Problem solving), user feedback (Feedback) and help provision (Help). The results of the MUSA method as shown in the Table 7 below show that the satisfaction indices are particularly high for all the sub-criteria with highest percentage for feedback (83.3%). Furthermore, regarding the demanding index, users of the site are “non-demanding” for all the sub-criteria of the Interaction Criterion.

Table 7.
Partial Satisfaction Frequencies and Average Satisfaction, Demanding and Improvement Indices for the Interaction Criterion (%).
The relevant action diagram (Figure 11) depicts that the comparative advantages of the website are Feedback and Help, whilst there are no sub-criteria in the first priority quartile in order to constitute a top priority for the site.
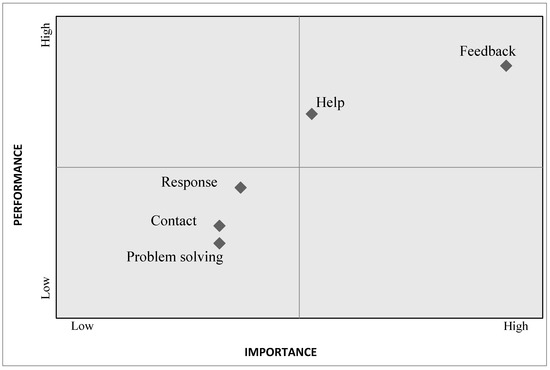
Figure 11.
Relative Action diagram for the Interaction criterion.
However, the relative improvement diagram (Figure 12) illustrates that Feedback is a top priority for improvement since it is highly effective for users with little effort to improve on the site.
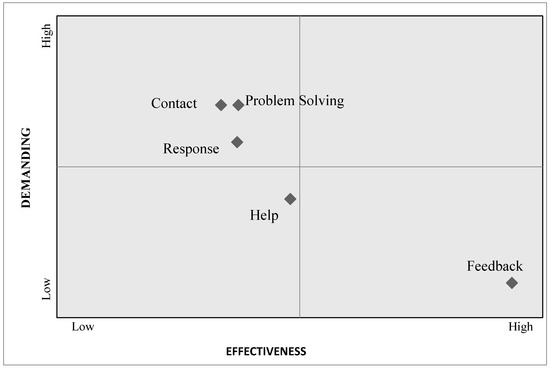
Figure 12.
Improvement diagram for the Interaction criterion.
3.3.5. Content
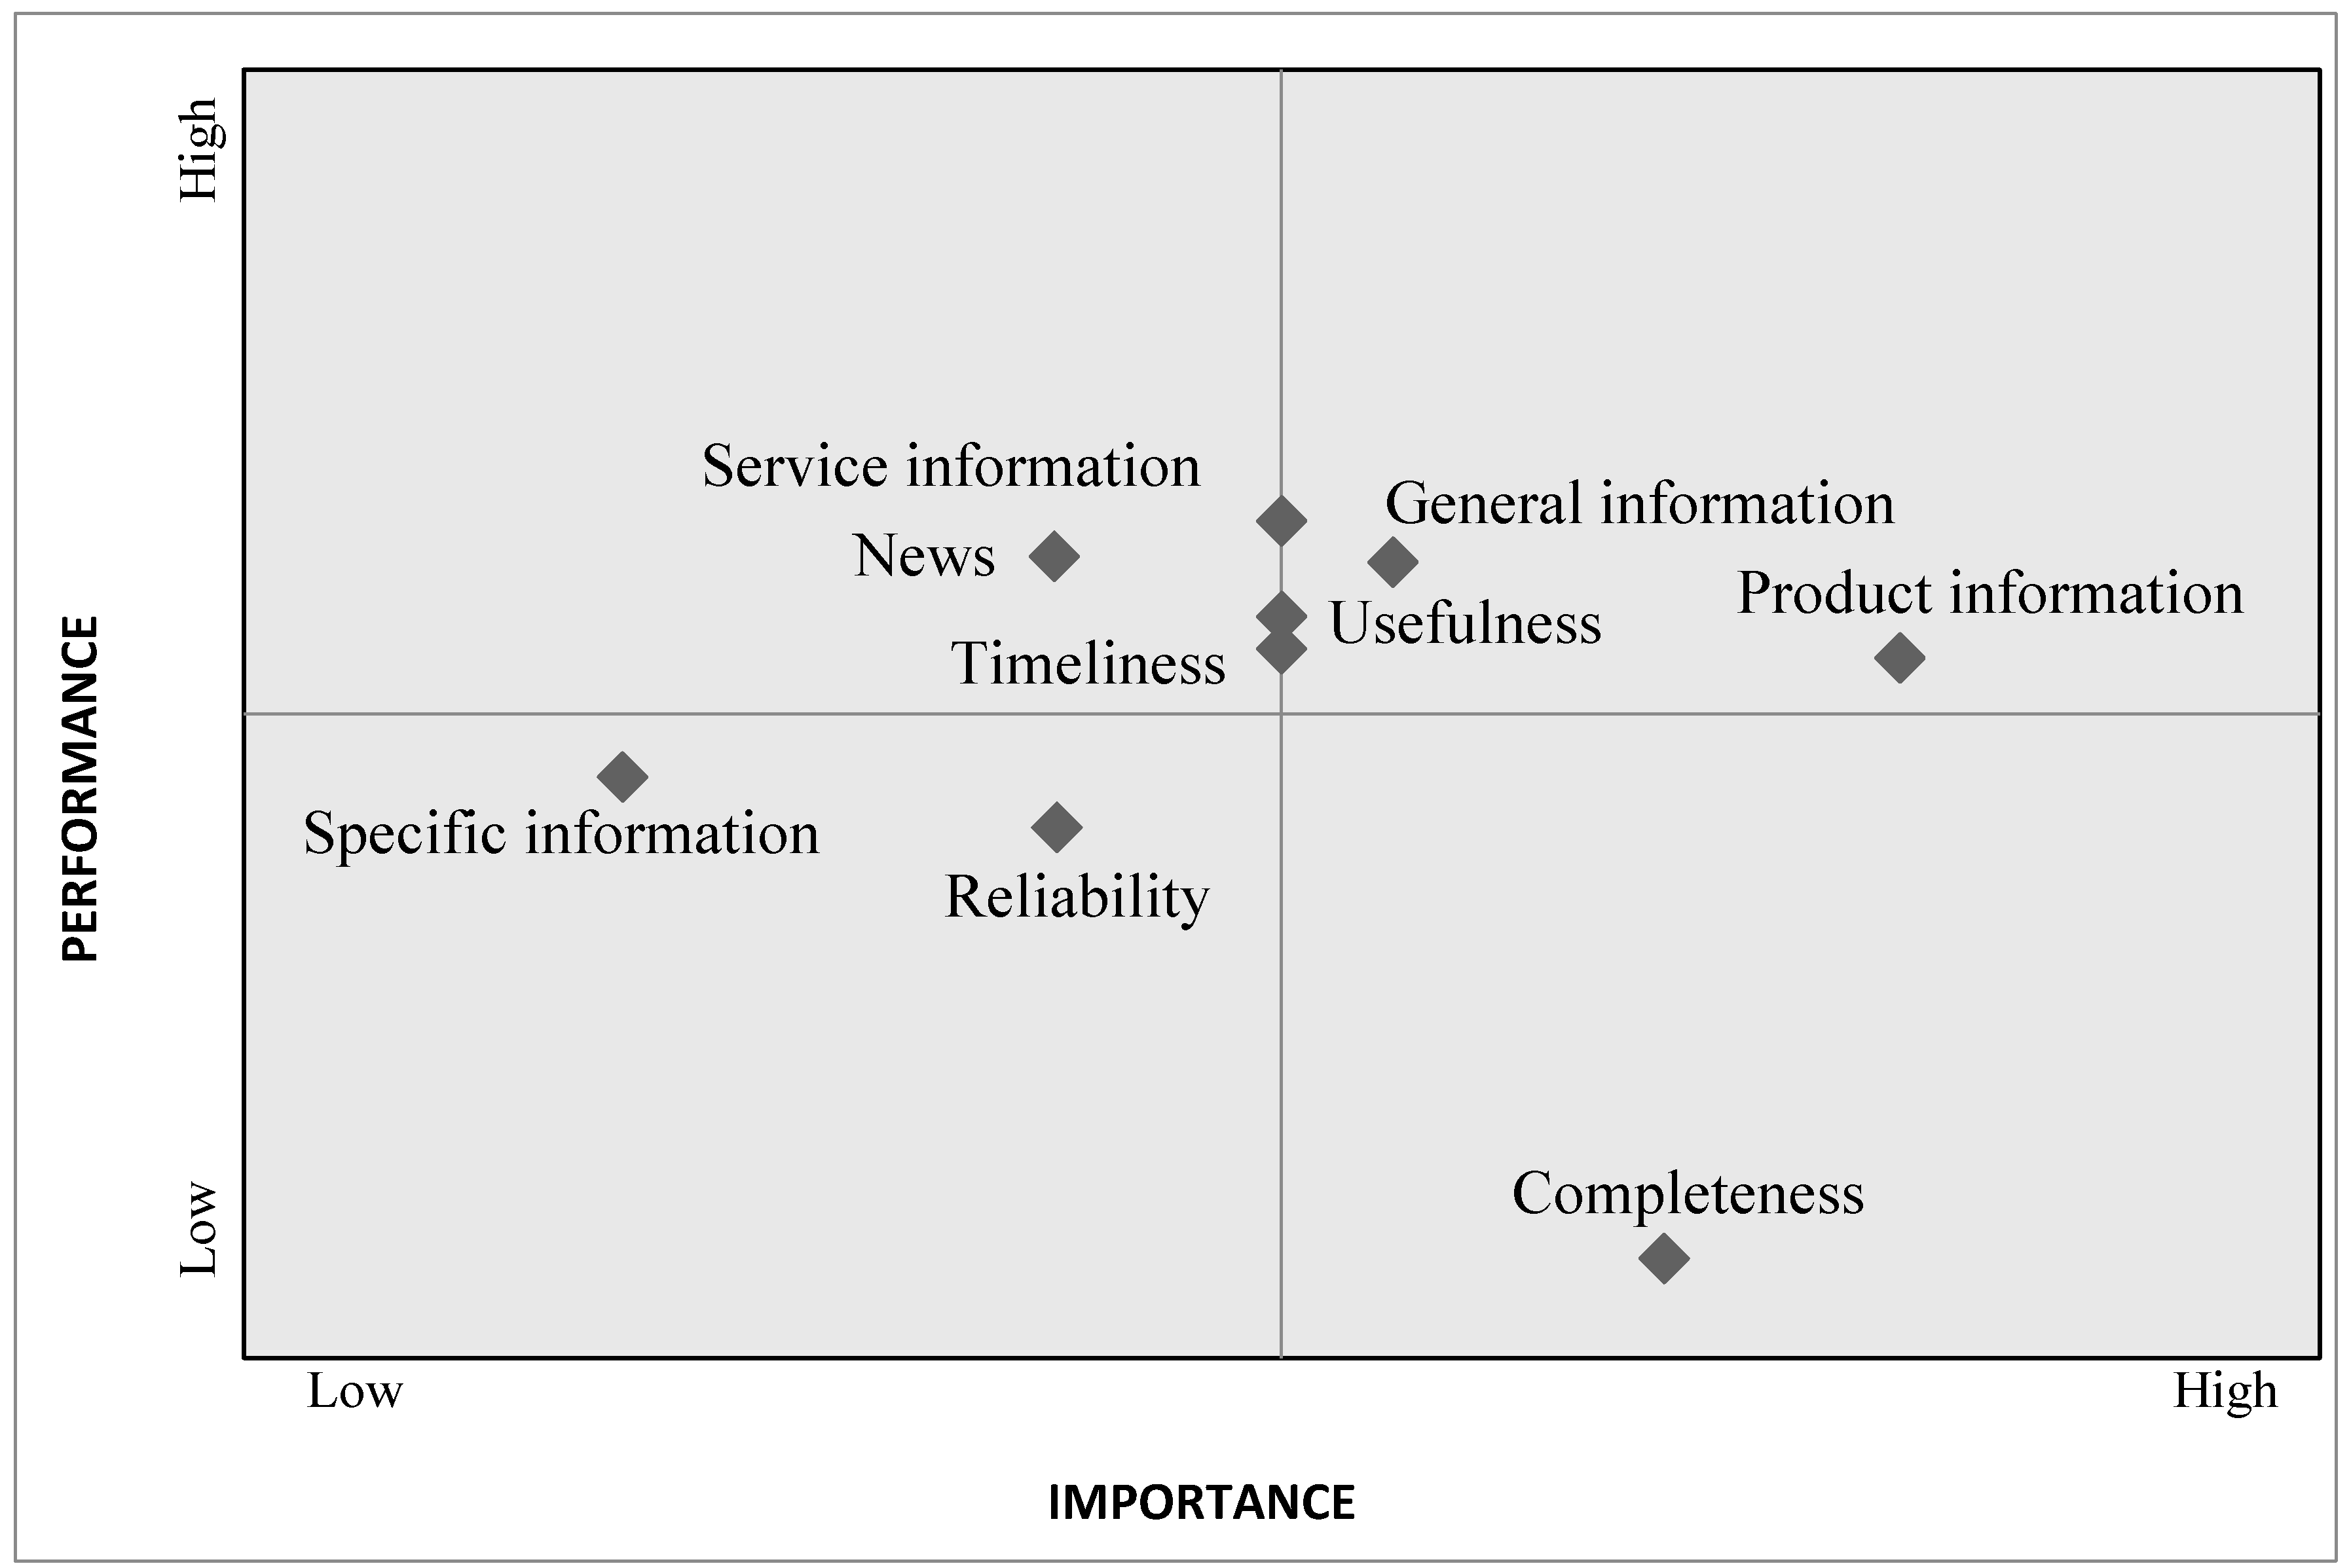
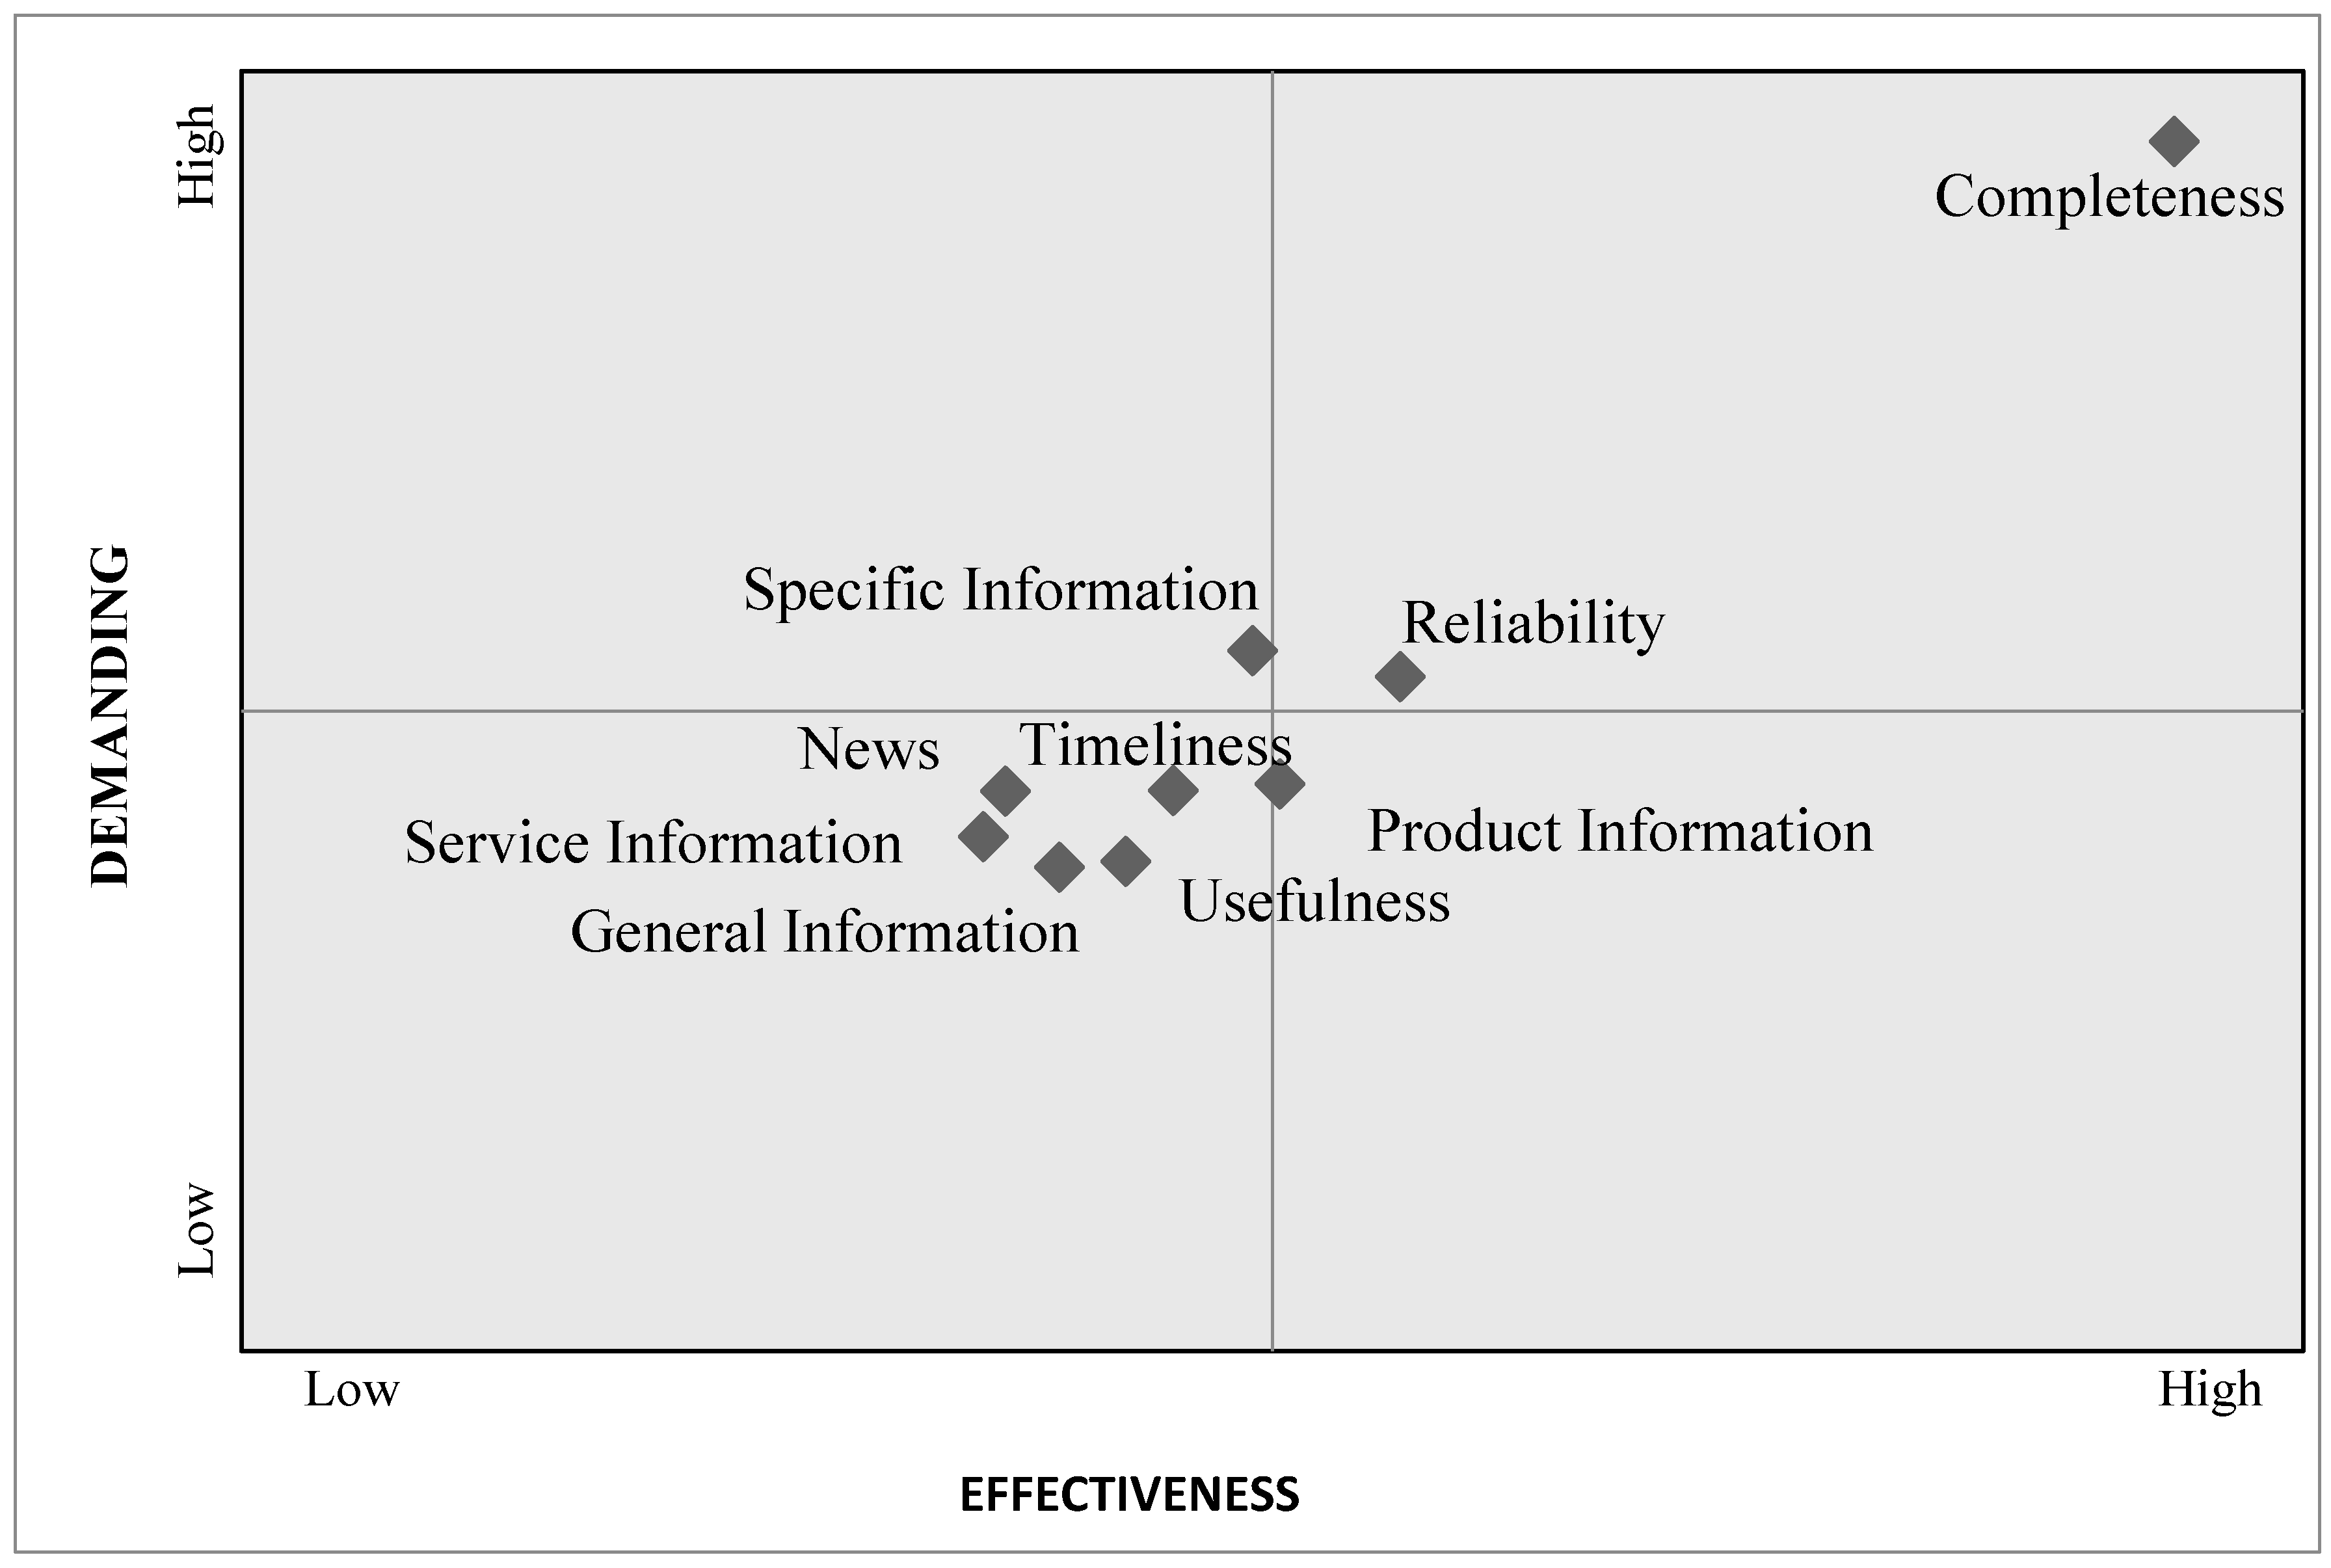
The last criterion being considered is the site Content. This criterion has nine sub-criteria, which are the provision of general information (General Information), the provision of specific information (Special Information), news reports (News), the provision of product information (Products), the provision of information about services (Services), the reliability of the published information (Reliability), the completeness of information (Completeness), the usefulness of the information (Usefulness) and the update of the published information (Update).
The satisfaction index shows that users’ satisfaction is not high enough with the majority of sub-criteria, while the “Completeness” criterion illustrates the lowest percentage (45.0%) (Table 8). The users are characterized as “demanding” for all the sub-criteria except from Completeness, for which they are characterized as “very demanding.”

Table 8.
Partial Satisfaction Frequencies and Average Satisfaction, Demanding and Improvement Indices for the Content Criterion (%).
The relevant action diagram for the content criterion (Figure 13) shows that Completeness is in critical priority for improvement for the website, while General Information and Product Information constitute the comparative advantages. Service information, Usefulness and Updates should be taken into consideration, since with a little improvement they can be comparative advantages for the website as well.
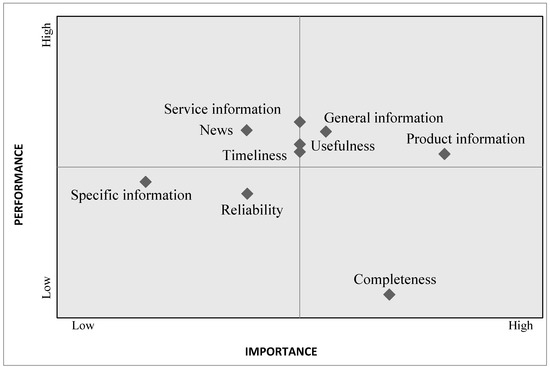
Figure 13.
Action diagram for the Content criterion.
Regarding the relative improvement diagram (Figure 14), we observe that there are criteria that are a first priority for improvement. However, product information can be improved with little effort. Completeness and Reliability could be highly effective, but they demand significant effort and constitute a secondary priority for improvement.
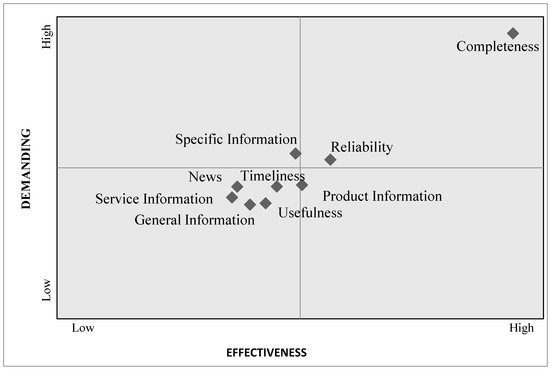
Figure 14.
Improvement diagram for the Content criterion.
4. Conclusions
In this paper we tried to measure the satisfaction of the users of the provided e-Services in Greece by an agricultural e-government portal. The evaluation of the agricultural services through an online satisfaction survey may be considered one of the most reliable methods. The analysis of the users’ satisfaction gives the opportunity for governments to determine future actions in order to improve their services based on reliable views of their users. For this reason, we used the MUSA method, which is based on the principles of multicriteria analysis, and particularly on the aggregation–disaggregation approach and linear programming modelling. The implementation of the method in users’ satisfaction evaluated quantitative global and partial satisfaction levels and determined the strong and the weak points of the provided agricultural e-Government services.
More specifically, in this research the strong and weak points of the agroGOV web portal were identified. The research evaluated the performance of the portal by measuring the overall and partial users’ satisfaction for 31 sub-criteria. The web portal competitive advantages and disadvantages were presented and, finally, the improvement priorities for each criterion were analyzed. All these findings are essential in evaluation of e-government web portals.
Taking into account that the users’ satisfaction is a dynamic process that does not remain stable, the results from the global satisfaction index showed that the users of the web portal were satisfied from the services that are provided. The partial satisfaction analysis indicates the improvement efforts that the governments may consider for the development of e-government web portals. The partial satisfaction indices and the action diagrams showed that there are still actions that can be taken in order to increase satisfaction, especially in Content and Design. Through the improvement diagrams that the MUSA method creates, the e-Government web portal developers can identify which dimensions of the web portal should be improved first. More specifically, the improvement diagram showed that in the criteria of Navigation the sub-criterion Data, in the Interaction the sub-criterion Feedback, and in accessibility the sub-criterion Languages are the most important for users and are in the first priority for the next improvements. According to the results of our study, to increase the usability of the agricultural e-government websites, designers should focus on the Front Page, the Data, the Feedback, the foreign Languages and the Completeness of the available data.
Moreover, the MUSA method seems to be is a valuable procedure for governments in order to improve their e-Government services by evaluating their users’ satisfaction.
In the future, an important extension of this research may concern the installation of a permanent user satisfaction barometer.
Funding
This research received no external funding.
Conflicts of Interest
The author declare no conflict of interest.
References
- Grigoroudis, E.; Siskos, Y. Service Quality and Customer Satisfaction Measurement; New Technologies Publications: Athens, Greece, 2000. [Google Scholar]
- Introna, L.; Hayes, N.; Petrakaki, D. The working out of modernization in the public sector: The case of an E-government initiative in Greece. Int. J. Public Adm. 2009, 33, 11–25. [Google Scholar] [CrossRef]
- United Nations. What is e-Government. Available online: https://publicadministration.un.org/egovkb/en-us/About/UNeGovDD-Framework#whatis (accessed on 26 January 2020).
- UN; OECD. The e-Government Imperative: Main Findings; OECD e-Government Studies; OECD: Paris, France, 2003; ISBN 9264101179. [Google Scholar]
- Commission of the European Communities. The Role of eGovernment for Europe’s Future; Communication from the Commission to the Council, the European Parliament; The European Economic and Social Committee and the Committee of the Regions: Brussels, Belgium, 2003. [Google Scholar]
- Devadoss, P.; Pan, S.; Huan, J. Structurational analysis of e-Government initiatives: A case study of SCO. Decis. Support Syst. 2002, 34, 253–269. [Google Scholar] [CrossRef]
- Pardo, T. Realizing the Promise of Digital Government: It’s More than Building a Web Site; Center for Technology in Government: Albany, NY, USA, 2000; Volume 3. [Google Scholar]
- Bournaris, T.; Manos, B.; Vlachopoulou, M.; Manthou, V. E-government and farm management agricultural services in Greece. Int. J. Bus. Innov. Res. 2011, 5, 325. [Google Scholar] [CrossRef]
- Manthou, V.; Matopoulos, A.; Vlachopoulou, M. Internet-based applications in the agri-food supply chain: A survey on the Greek canning sector. J. Food Eng. 2005, 70, 447–454. [Google Scholar] [CrossRef][Green Version]
- Tsolakis, N.; Bechtsis, D.; Bochtis, D. AgROS: A robot operating system based emulation tool for agricultural robotics. Agronomy 2019, 9, 403. [Google Scholar] [CrossRef]
- Bournaris, T.; Manos, B.; Moulogianni, C.; Kiomourtzi, F.; Tandini, M. Measuring users satisfaction of an e-Government portal. Procedia Technol. 2013, 8, 371–377. [Google Scholar] [CrossRef]
- Kilkenny, M. Transport costs and rural development. J. Reg. Sci. 1998, 38, 293–312. [Google Scholar] [CrossRef]
- Mahaman, B.D.; Ntaliani, M.S.; Costopoulou, C.I. E-gov for rural development: Current trends and opportunities for agriculture. In Proceedings of the 2005 EFITA/WCCA Joint Congress on “T in Agriculture”, Vila Real, Portugal, 25–28 July 2005; pp. 589–594. [Google Scholar]
- USDA. eGoverment Strategic Plan FY 2002-FY 2006; United States Department of Agriculture eGovernment Program; USDA: Washington, DC, USA, 2002.
- Rao, R. ICT e-Governance for rural development. In Proceedings of the “Governance in development: Issues, Challenges and Strategies” Organized by Institute of Rural Management, Anand, India, 14–19 December 2004. [Google Scholar]
- Eggers, W.; Bellman, J. The Journey to Government’s Digital Transformation; Deloitte University Press: New York, NY, USA, 2015. [Google Scholar]
- Manolitzas, P.; Yannacopoulos, D. Citizen satisfaction: A multicriteria satisfaction analysis. Int. J. Public Adm. 2013, 36, 614–621. [Google Scholar] [CrossRef]
- Muhtaseb, R.; Lakiotaki, K.; Matsatsinis, N. Applying a multicriteria satisfaction analysis approach based on user preferences to rank usability attributes in E-tourism websites. J. Theor. Appl. Electron. Commer. Res. 2012, 7, 28–48. [Google Scholar] [CrossRef]
- Fensel, D.; Brodie, M.L. Ontologies: A Silver Bullet for Knowledge Management and Electronic Commerce; Springer: Berlin, Germany, 2004; ISBN 9783540003021. [Google Scholar]
- Sterne, J. Customer Service on the Internet: Building Relationships, Increasing Loyalty, and Staying Competitive; Wiley: Hoboken, NJ, USA, 1996; ISBN 9780471155065. [Google Scholar]
- Stanimirovic, D.; Jukic, T.; Nograsek, J.; Vintar, M. Analysis of the methodologies for evaluation of e-government policies. In Electronic Government, Proceedings of the International Conference on Electronic Government, Kristiansand, Norway, 3–6 September 2012; Scholl, H.J., Janssen, M., Wimmer, M.A., Moe, C.E., Flak, L.S., Eds.; Springer: Berlin/Heidelberg, Germany, 2012; pp. 234–245. [Google Scholar]
- Zerva, A.; Tsantopoulos, G.; Grigoroudis, E.; Arabatzis, G. Perceived citizens’ satisfaction with climate change stakeholders using a multicriteria decision analysis approach. Environ. Sci. Policy 2018, 82, 60–70. [Google Scholar] [CrossRef]
- Manolitzas, P.; Kostagiolas, P.; Grigoroudis, E.; Intas, G.; Stergiannis, P. Data on patient’s satisfaction from an emergency department: Developing strategies with the Multicriteria Satisfaction Analysis. Data Br. 2018, 21, 956–961. [Google Scholar] [CrossRef] [PubMed]
- Kitsios, F.; Stefanakakis, S.; Kamariotou, M.; Dermentzoglou, L. E-service evaluation: User satisfaction measurement and implications in health sector. Comput. Stand. Interfaces 2019, 63, 16–26. [Google Scholar] [CrossRef]
- Drosos, D.; Skordoulis, M.; Arabatzis, G.; Tsotsolas, N.; Galatsidas, S. Measuring industrial customer satisfaction: The case of the natural gas market in Greece. Sustainability 2019, 11, 1905. [Google Scholar] [CrossRef]
- Arabatzis, G.; Grigoroudis, E. Visitors’ satisfaction, perceptions and gap analysis: The case of Dadia-Lefkimi-Souflion National Park. For. Policy Econ. 2010, 12, 163–172. [Google Scholar] [CrossRef]
- Evangelos, G.; Panagiotis, K.; Yannis, S.; Athanasios, S.; Denis, Y. Tracking changes of e-customer preferences using multicriteria analysis. Manag. Serv. Qual. Int. J. 2007, 17, 538–562. [Google Scholar] [CrossRef]
- Grigoroudis, E. Preference disaggregation for measuring and analysing customer satisfaction: The MUSA method. Eur. J. Oper. Res. 2002, 143, 148–170. [Google Scholar] [CrossRef]
- Ipsilandis, P.G.; Samaras, G.; Mplanas, N. A multicriteria satisfaction analysis approach in the assessment of operational programmes. Int. J. Proj. Manag. 2008, 26, 601–611. [Google Scholar] [CrossRef]
- Siskos, Y.; Grigoroudis, E. Measurement customer satisfaction for various services using multicriteria analysis. In Aiding Decisions with Multiple Criteria; Kluwer Academic Publishers: Berlin, Germany, 2002; pp. 457–482. [Google Scholar]
- Grigoroudis, E.; Siskos, Y. Customer Satisfaction Evaluation. Methods for Measuring and Implementing Service Quality; Springer Science & Business Media: Berlin, Germany, 2010; Volume 139. [Google Scholar]
- Grigoroudis, E.; Siskos, Y. MUSA: A decision support system for evaluating and analyzing customer satisfaction. In Proceedings of the 9th Panhellenic Conference in Informatics, Thessaloniki, Greece, 30 September–2 October 2011. [Google Scholar]
- Grigoroudis, E.; Litos, C.; Moustakis, V.A.; Politis, Y.; Tsironis, L. The assessment of user-perceived web quality: Application of a satisfaction benchmarking approach. Eur. J. Oper. Res. 2008, 187, 1346–1357. [Google Scholar] [CrossRef]
- Kargioti, E.; Vlachopoulou, M.; Manthou, V. Evaluating customers online satisfaction: The case of an agricultural website. In Proceedings of the 3rd HAICTA International Conference on Information Systems in Sustainable Agriculture Agroenvironment and Food Technology, Volos, Greece, 20–23 September 2006; pp. 66–75. [Google Scholar]
- Patsioura, F.; Vlachopoulou, M.; Manthou, V. Evaluation of an agricultural web site. In Proceedings of the International Conference on Information Systems & Innovative Technologies in Agriculture, Food and Environment, Thessaloniki, Greece, 18–20 March 2004; pp. 28–37. [Google Scholar]
- Lidija, K.; Povilas, V. Assumptions of E-government services quality evaluation. Eng. Econ. 2007, 55, 68–74. [Google Scholar]
- Papadomichelaki, X.; Mentzas, G. e-GovQual: A multiple-item scale for assessing e-government service quality. Gov. Inf. Q. 2012, 29, 98–109. [Google Scholar] [CrossRef]
- Drosos, D.; Tsotsolas, N.; Chalikias, M.; Skordoulis, M.; Koniordos, M. Evaluating customer satisfaction: The case of the mobile telephony industry in Greece. In Proceedings of the Communications in Computer and Information Science, Volgograd, Russia, 15–17 September 2015; Kravets, A., Shcherbakov, M., Kultsova, M., Shabalina, O., Eds.; Springer International Publishing: Cham, Switzerland, 2015; Volume 535, pp. 249–267. [Google Scholar]
- Grigoroudis, E.; Siskos, Y.; Saurais, O. TELOS: A customer satisfaction evaluation software. Comput. Oper. Res. 2000, 27, 799–817. [Google Scholar] [CrossRef]
- Customers Satisfaction Council. Customer Satisfaction Assessment Guide; Motorola University Press: Schaumburg, IL, USA, 1995.
- Naumann, E.; Giel, K. Customer Satisfaction Measurement and Management: Using the Voice of the Customer; SB—Marketing Education Series; Thomson Executive Press: Cincinnati, OH, USA, 1995; ISBN 9780538844390. [Google Scholar]
- Koilias, C. Evaluating students’ satisfaction: The case of informatics department of TEI athens. Oper. Res. 2005, 5, 363–381. [Google Scholar] [CrossRef]
© 2020 by the author. Licensee MDPI, Basel, Switzerland. This article is an open access article distributed under the terms and conditions of the Creative Commons Attribution (CC BY) license (http://creativecommons.org/licenses/by/4.0/).

