Article

Solubility and Efficiency of Rock Phosphate Fertilizers Partially Acidulated with Zeolite and Pillared Clay as Additives

by
Ana Paula Bettoni Teles
,
Marcos Rodrigues
and
Paulo Sergio Pavinato
*
College of Agriculture Luiz de Queiroz—ESALQ-USP, Av. Pádua Dias, 11, Piracicaba-SP 13418-900, Brazil
*
Author to whom correspondence should be addressed.
Agronomy 2020, 10(7), 918; https://doi.org/10.3390/agronomy10070918
Submission received: 24 April 2020 / Revised: 22 June 2020 / Accepted: 24 June 2020 / Published: 27 June 2020

Abstract

:
Soluble phosphates are the most common sources currently used in crop production in tropical soils; however, they present low efficiency and are more expensive than natural rock phosphates. The objective was to develop new phosphate fertilizers with slow solubility through the partial acidification of rock phosphates (RPs), incorporating materials with adsorption characteristics to favor slow dissolution and prevent phosphorus (P) fixation in the soil. Three rock phosphates, Araxá (ARP), Bayovar (BRP) and Morocco (MRP), were evaluated at two acidulation levels (25 and 50% Ac.) and two additives; pillared clays (PILC) and zeolites (Zeo), plus triple superphosphate (TSP) and a control (nil-P). The soil diffusion was evaluated in concentric rings in Petri dishes. Solubility was evaluated in leaching columns and sampled in layers from surface for P forms in the soil profile. The relative agronomic efficiency (RAE) was evaluated in maize. Greater diffusion was provided by TSP, followed by BRP and MRP both with 50% Ac. + Zeo, and MRP with 50% Ac. + PILC. Percolated P was more pronounced under TSP, followed by RPs (BRP and MRP) with 50% Ac. + Zeo. BRP and MRP + 50% Ac. were the most promising sources with RAE above 74% compared to TSP.

Graphical Abstract

1. Introduction

Phosphorus (P) plays an important role in plant metabolism, since it is involved in processes such as cell energy transfer, respiration and photosynthesis [1], making it an essential and irreplaceable element. Plants absorb P from the soil solution as phosphate ions, mainly H2PO4 [2]. However, soils usually have low levels of plant-available P, especially in tropical regions. This is a result of adsorption and precipitation reactions, and its high affinity with soil constituents [3]. Given this limited P availability, agricultural production is highly dependent on the use of fertilizers.
Phosphate fertilizers are produced from rock phosphate (RP), a natural non-renewable resource. About 80% of the RP mined annually is used for fertilizer production and, considering the current level of consumption, it is expected that reserves will vanish in three centuries time [2,4]. The possibility of exhaustion of this resource may compromise global food production [5]. The most used phosphate sources in agriculture are those that are highly water soluble, with fast dissolution in the soil which favors precipitation and adsorption. Approximately three days after the application of these sources in the soil, a large part of their P (more than half in some cases) is transformed into non-labile forms [6,7], substantially reducing their efficiency when applied to crops. Therefore, the future availability of P depends on the development of new technologies or soil management practices to improve its efficiency.
Considering this reference to the motivation to improve P efficiency, partial acidulation of RP is a technological development already in existence [8] that can be of help. In the processing of partially acidulated phosphates, a small amount of sulfuric or phosphoric acid reacts with RP in order to breakdown part of the hydroxyapatite (insoluble P) into monocalcium phosphate (soluble P), and thereby obtain a fast dissolution product [9]. Moreover, the incorporation of minerals with high phosphate adsorption capacity and/or high cation exchange capacity (CEC), such as pillared clays (PILC) and zeolites, into partially acidulated phosphates shows promise to improve agronomic efficiency [10,11]. The premise is that the initial P release will saturate the acidic sites of the PILC before adsorption, which act as a vehicle for slow and gradual dissolution into soil solution. Furthermore, when calcium (Ca) from RP is released after dissolution, it can be held by negative charges of the PILC or zeolites, favoring the solubilization of acid-unreacted RP, which also prevents Ca-P retrogradation [10,11].
Thus, we hypothesized herein that new phosphate fertilizers with slower and more synchronized solubility according to plant demand are more efficient than completely acidulated commercial sources. This study aimed to develop new crop efficient sources of phosphate fertilizers with gradual solubility using partial acidulation (25 and 50% of total solubilization) in the following distinct rock phosphates—Araxá (ARP), Bayovar (BRP) and Morocco (MRP)—and also adding high reactivity minerals such as pillared clay (PILC) and zeolites (Zeo), thus enabling the evaluation of the potential pH change in the soil, soil P diffusion; P solubilization and P agronomic efficiency.

2. Materials and Methods

2.1. Phosphate Rocks and Additives

Two high-reactivity sources of RP (Bayovar from Peru and BG4 from Morocco) and one low-reactivity source (Araxá from Brazil) were used as raw material for the production of partially acidulated phosphate fertilizers. Their chemical parameters and composition and total P2O5, 2% citric acid soluble P (PCA 2%) and water soluble concentrations of each RP are presented in Table 1. Additionally, zeolites and pillared clay (PILC) were used as additives in the phosphate fertilizers for improving the dissolution, also characterized in Table 1.
Natural zeolite, a mineral composed of intertwined tetrahedra, was obtained from Slovakia, provided by the Celta Brazil company. The zeolites were ground and passed through a 60 mesh sieve to increase the specific surface area. The clays used for pillarization came from a natural rock rich in montmorillonite (bentonite), supplied by Bentonit União Nordeste S.A., commercially known as Brasgel. For the pillarization process, the bentonite was finely milled, fractionated and purified in order to eliminate its coarser fractions and decrease its impurities. Purification of the material was carried out by removing iron oxides following the dithionite-citrate-bicarbonate method [15]. Next, the material was dispersed with Na2CO3 0.1 g L−1 solution with continuous stirring for approximately 12 h and fractionated by sedimentation to obtain the clay fraction (<2 μm).
The purified clay was pillared based on the methodology described by Narayanan and Deshpande [16]. The pillaring solution was obtained by using constant dripping of 0.4 mol L−1 NaOH in a solution of 0.2 mol L−1 AlCl3·6H2O under constant stirring at room temperature. At the end of the drip, the solution remained under stirring for a period of 15 h, with the first two hours at a temperature of 60 °C and the remaining time at room temperature (25 °C). For clay intercalation, the pillaring solution was then dripped at a maximum rate of 5 mL min−1 in a clay suspension of 1% (w/w), under vigorous stirring. After this, the material was continuously stirred for a period of 20 h. The resulting product was washed with deionized water to remove all free chlorine, oven dried at 60 °C and calcinated at 350 °C. In order to confirm pillarization, the final product was submitted to X-ray diffractometry (XRD), in a Miniflex II Desktop X-Ray Diffractometer Rigaku apparatus, with CuKα radiation, using the powder blade method. When saturated with sodium, the natural clay had a basal spacing of 1.4 nm. After the intercalation of aluminum polyhidroxication (pillarization) and calcination at 350 °C, it was observed that the clay reached a basal space of 1.8 nm, evidencing that the pillarization had been effective (Figure 1).

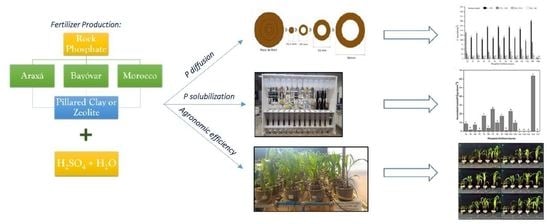
2.2. Fertilizer Production

Both minerals, PILC and zeolites, were mixed with each RP in a proportion of 9% of the final volume, followed by partial acidification with sulfuric acid corresponding to 25 and 50% of the proportional commercial acidulation of soluble phosphates, such as simple superphosphate. The resulting mixture was cured for seven days, then oven dried, ground and passed through a 60 mesh sieve and granulated in a wet dish granulator, which consisted of the application of a dextrin-based binder solution (10% w/v) to the dry blend to obtain the granules. The final products were oven dried at 45 °C until reaching a constant weight and then standardized into granules of 2–3 mm diameter.

2.3. Chemical Analysis

Twelve new products were obtained with the combinations mentioned above, which were characterized in terms of total P2O5 extracted with concentrated nitric acid + hydrochloric acid, and P2O5 soluble in water (H2O), soluble in neutral ammonium citrate + water (NAC + H2O) and soluble in 2% citric acid (PCA), according to the methodologies of the Brazilian Ministry of Agriculture, Livestock and Supply [17] (Table 2).

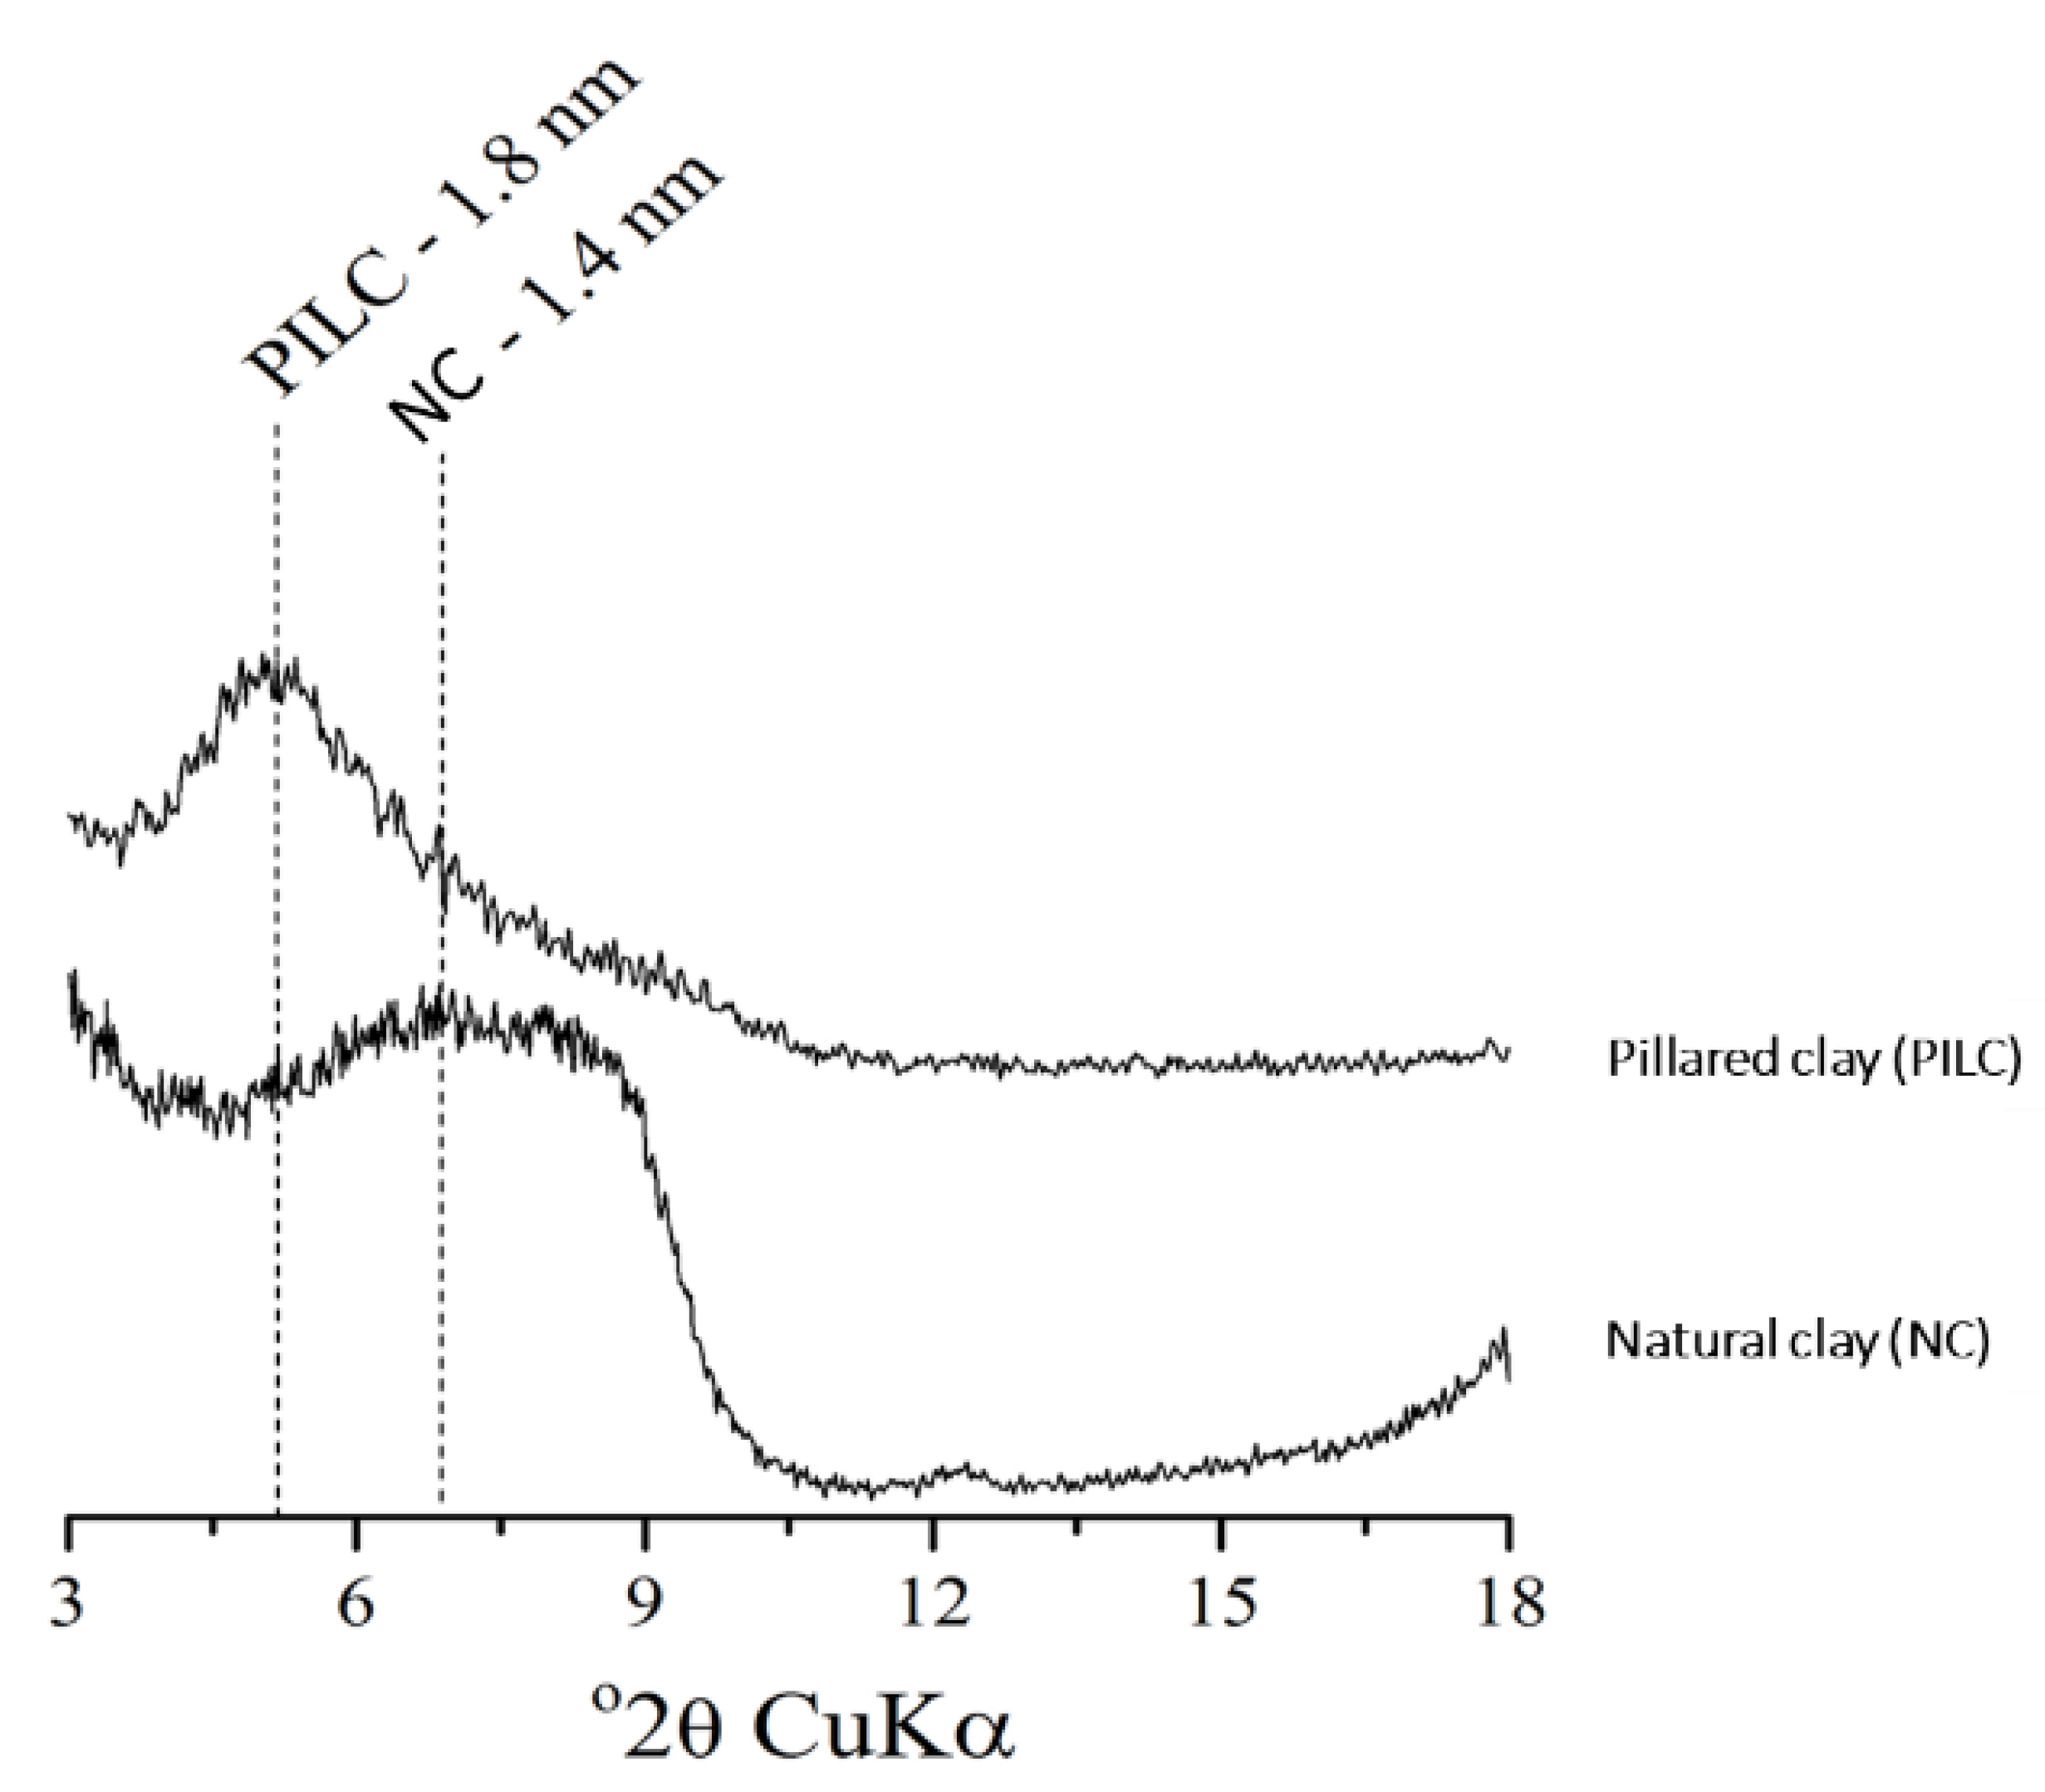
2.4. X-Ray Diffraction Analysis

All the final products (phosphate fertilizers) were characterized in terms of the mineralogical composition and structural changes that occurred in the RPs after acidification by means of X-ray diffraction (XRD). For this purpose, the powder blade method was used and the diffractograms were generated using the Miniflex II Desktop X-Ray Diffractometer Rigaku, with CuKα radiation, with an analysis interval of 5° to 60° 2θ.

2.5. Phosphorus Diffusion in Petri Dishes

Phosphorus diffusion from fertilizer granules was evaluated in plastic Petri dishes (8.6 cm in diameter and 1.1 cm tall) containing 78 g of dry soil with four replications, following a methodology described by Degryse and McLaughlin (2014) [18]. The soil was a loamy sand Hapludox [19] or Latossolo Vermelho Amarelo distrófico according to the Brazilian classification system [20]. In order to increase the soil base saturation to 70%, CaCO3 and MgCO3 were applied at a ratio of 3:1, respectively. The soil properties after liming are listed in Table 3.
Soil in Petri dishes was moistened with deionized water up to 60% of the soil water holding capacity. Plates were then sealed with plastic film, covered with aluminum foil and left to equilibrate the soil solution for 24 h at 26 °C. The next day, they were opened and a granule of each fertilizer, corresponding to each treatment (Table 2) containing about 5.0 mg P, was placed exactly in the center of the plate, and lightly pressed into the soil. Next, they were again sealed with plastic film and covered with aluminum foil to prevent water loss and light incidence. They were then incubated at a temperature of 26 °C, for five weeks. One no-P fertilizer treatment and one treatment containing triple superphosphate (TSP) were also incubated as controls. Each treatment was replicated four times.
After incubation, Petri dishes were dismantled and the soil was sampled in concentric circles around the granule. The radii of the soil layers sampled were 0–7.75; 7.75–13.5; 13.5–25.5 and 25.5–43 mm, starting from the center (granule). Samples were dried at 40 °C and sieved (<2 mm) to determine the total and available P and the pH in water (ratio 1:10). Total P was determined by acid digestion with H2SO4 + H2O2, following the methodology proposed by Olsen and Sommers [21]. Available P was determined by anion exchange resin (membranes), following the first step of the procedure proposed by Hedley et al. [22]. Concentration of P in the extracts was colorimetrically determined by the blue-molybdate method [23].

2.6. Soil Columns P Solubilization

Fertilizer solubility was evaluated in leaching thermoplastic acrylic columns with an internal diameter of 2.1 cm and a height of 25 cm. Nylon caps were fitted to the bottom of the column with a hole in the center where plastic hoses were attached to collect leaked water. Above each column, 300 mL bottles were attached, adapted to drip water constantly, controlling the flow. Fifty grams of dry soil were added to each column equivalent to reaching up to nearly 10 cm in height in the column. Original soil properties are presented in Table 4. Next, it was saturated with distilled water. Subsequently, fertilizers corresponding to each treatment were added at 100 mg P per column to the top soil surface. The treatments evaluated herein were: T1–12 (Table 2) as well as pure phosphates ARP(T13); BRP(T14); MRP(T15); TSP(T16) and a control (T17). Deionized water was percolated through the columns at a rate of 20 mL day−1 in the first 25 days. After that, the same amount was used every three days until 60 days had elapsed. The content of P was determined in leachates by the blue-molybdate method, following Murphy and Riley [23].
At the end of the incubation period, the columns were disassembled and the soil sampled in the following layers of 0–1; 1–2; 2–3; 3–6 and 6–10 cm, starting from the top. Samples were oven dried at 40 °C and sieved (<2 mm) and chemical P fractionation was performed according to the methodology proposed by Hedley et al. [22], with modifications by Condron et al. [24]. The last extractor (0.5 mol L−1 NaOH), because of lack of interest for our purpose, was skipped. The P concentration in extracts was determined by the blue-molybdate method [23]. The compartments estimated with the respective fractions were as follows: labile, which includes the inorganic P extracted by anion exchange resin (PiAER) plus inorganic and organic P extracted by 0.5 mol L−1 NaHCO3 (PiBIC and PoBIC); moderately labile, which includes the inorganic and organic P extracted by 0.1 mol L−1 NaOH (PiHid0.1 and PoHid0.1) more inorganic P extracted by HCl (PiHCl); and non-labile, composed of the residual acid digestion (Presidual).

2.7. Plant Growth-Pot Experiment

The agronomic efficiency of the phosphate fertilizers generated in our lab was evaluated in a greenhouse pot study using a maize (Zea mays L.) hybrid 2B587 from Dow Seeds as a test crop. Soil and treatments used here were the same from the previously mentioned column P solubilization test. The experimental design was completely randomized with four replicates, in plastic pots with 3 L capacity, coated with plastic bags containing 3 kg of soil.
Phosphate treatments were added at the rate of 60 mg kg−1 soil, based on the total P content of each fertilizer. The basic sowing fertilization for all pots consisted of 20 mg kg−1 of N as ammonium nitrate (32% N) and 60 mg kg−1 of K2O as polyhalite (14% of K2O) in a uniform hand mixture in the total soil volume. Thirty milliliters per pot of micronutrients solution were added containing: 0.81 mg kg−1 B (H3BO3 p.a.), 1.56 mg kg−1 Fe (Fe (NO3)2.9H2O p.a.), 3.66 mg kg−1 Mn (MnSO4.H2O p.a.), 4.0 mg kg−1 Zn (ZnSO4.7H2O p.a.), 1.33 mg kg−1 Cu (CuSO4.5H2O p.a.) and 0.15 mg kg−1 Mo ((NH4)6Mo7O24.4H2O p.a.). Twenty days after sowing, this was complemented with 40 mg kg−1 of N as ammonium nitrate solution and another 30 mL per pot of the same micronutrient solution.
Each pot was sown with five maize seeds, later leaving the two best plants growing for 45 days. At the end, maize shoots and roots were harvested. Roots were washed in distilled water. Both plant parts were oven dried at 65 °C until constant dry mass (DM). After determining the DM of the shoot and root, the tissue was ground to determine the foliar P content through nitric-perchloric digestion [25] and to estimate accumulated total P.
The agronomic efficiency of the phosphate fertilizers was estimated in relation to the high water solubility commercial source (TSP), and therefore named, relative agronomic efficiency (RAE), obtained from the following equation:
RAEi = (Yi − Y0/YTSP − Y0) ∗ 100
where Yi is the DM produced by source i, YTSP the DM produced by the commercial source (TSP) and Y0 is the DM produced by the control treatment (no P addition).

2.8. Statistical Analysis

All data were submitted to normality analysis (Shapiro–Wilk test) and homoscedasticity (Barlett’s test) at 5% of error probability and then to variance analysis (ANOVA). The Scott–Knott test at 5% was used for comparisons between treatments. Statistical analysis was performed using the ExpDes statistical package [26] in the R computational statistical environment [27].

3. Results and Discussion

3.1. Mineralogical and Structural Changes in Fertilizers

X-ray diffraction was performed to visualize changes in the mineral structure and its arrangement in RPs after partial acidification and incorporation of PILC and zeolites. Notably, in pure phosphates (ARP, BRP and MRP), there was a dominance of apatite, with some quartz present only in MRP. After acidulation, the intensity of the apatite peaks and the appearance of calcium sulfates, such as gypsum and bassanite, were observed. In RPs treated by 25% acidulation, the decrease in apatite peaks was less intense than those treated by 50% acidulation. Furthermore, calcium sulfate peaks became more intense under the highest acidification level, as a consequence of the sulfuric acid reaction (Figure 2). When the reaction was 100%, it was described as follows:
Ca10(PO4)6F2 + 7H2SO4 + 6.5H2O3Ca(H2PO4H2O + 7CaSO4·1/2H2O + 2HF
When the amount of acid used was not sufficient to react 100% of the apatite, we obtained the so-called partially acidulated phosphates [9], as obtained in this study, and the apatite peaks did not disappear completely. Aside from this, the presence of zeolites or PILC as additives did not interfere in the phosphate peaks presented in diffractograms (Figure 2).
The BRP diffractogram showed apatite peaks of lower crystallinity when compared to other pure phosphates (ARP and MRP). This is evidenced by wider peaks and lower intensity due to the occurrence of isomorphic substitutions of phosphate by carbonate in the mineral structure [28]. As a consequence, BRP was more susceptible to solubilization, with apatite peaks almost disappearing after its partial acidification, even at the lowest rate (25% ac.) (Figure 2). These results are in accordance with Mattiello et al. [28] and Santos et al. [29], who both studied the generation of phosphate fertilizers from the acidic residues of the metallurgical industry and different RPs, including BRP and ARP, and observed the greater vulnerability of BRP to acidulation when compared to other non-reactive RPs such as ARP.
According to Dorozhkin [30], several factors may influence the solubility of apatite and among them the most relevant are the composition of the rock, the particle size and the strength and composition of the acid used to solubilize. In this study, the smaller amount of sulfuric acid used (25%) was enough to alter the crystalline structure of all RPs, generating calcium sulfates (gypsum and bassanite) and transforming part of the apatite into more soluble forms (e.g., monocalcium phosphate). The presence of more soluble forms of P in these partially acidulated products was detected by the greater solubility in water (Table 2) when compared to the pure RPs, whose solubility in water was nearly zero (Table 1). Thus, even under less acidulation, increments in agronomic efficiency according to the structural changes promoted in relation to the pure phosphates were expected and will be discussed below.

3.2. Phosphorus Diffusion

3.2.1. Changes in Soil pH by Phosphate Fertilizers

All treatments, including TSP, increased the pH around the granule in relation to control (Figure 3). In the first layer, where the effect was more pronounced, the greatest increases were observed under TSP and almost all reactive RPs (T5, T6, T7, T9, T11 and T12), with the exception of treatments 8 and 10. Therefore, the capacity of these fertilizers to change the soil pH does not seem to be related to the presence of PILC and zeolites in their formulation, but to the higher solubility of phosphates. In corroboration, Cesar [31], when evaluating the diffusion of P from several phosphate sources in two contrasting textured tropical soils, observed that all phosphate sources, including pure TSP and those associated with BRP, were able to increase the pH close to the fertilizer granule.
According to Hettiarachchi et al. [32], after soluble or partially soluble phosphate fertilizer deposition in the soil, the granules’ first action is to absorb water. This water moves towards the pores of the granules predominantly by capillarity flow and vapor transfer, and from there a series of reactions begins and one of the first items to change is the pH. Commonly, it is expected that partially acidulated phosphates and TSP decrease soil pH near the granule because of the acidic nature of their saturated solution [33], and the displacement of H+ from the surface of the colloids to the soil solution caused by the increase in Ca concentration [34]. This acidifying effect of the dissolution of fertilizers containing monocalcium phosphate has already been reported in other studies. Lombi et al. [35], studying the lability, mobility and solubility of different phosphate fertilizers in calcareous and non-limestone soils, observed a significant decrease in soil pH up to a distance of 13.5 mm from the granule. Similar results were reported by them in another study carried out only on calcareous soils [36]. Silva [37] evaluated the diffusion of P from traditional fertilizers with reduced solubility in Entisol and observed that all fertilizers containing monocalcium phosphate were able to decrease the soil pH near the application point. Nascimento et al. [38] when studying the diffusion of P from calcium, magnesium and ammonium phosphates in soils of Brazil (Ultisol) and the United States (Mollisol), observed that calcium phosphate (TSP) was able to decrease the pH in all situations; however, this decrease was more significant in the soil with an initial pH of 8.0 (alkaline). In addition to the acidic characteristics of this source and the displacement of H+ from the CEC to the soil solution induced by the increase in Ca concentration, the authors explain, based on the work of Cerozi and Fitzsimmons [39], that phosphate ions present three protonation constants (pH 2.1, 7.2 and 12.6). Thus, when the phosphate ion is added to soils with a pH higher than 7.2, there is a tendency for this ion to deprotonate, i.e., to donate H+ to the solution, leading to a decrease in soil pH.
Giving due credit to substantial evidence that the soil pH around the granule would decrease with the dissolution of phosphate fertilizers, the contradictory results observed here can be explained by the specific adsorption reactions of P on the surface of Fe and Al oxides, which potentially released OH into the soil solution [40]. It is important to highlight that the majority of the soils in which there was a decrease in pH around the granules were calcareous or alkaline soils, with distinct characteristics from our study. Thus, the contrasting results can be attributed to these differences, since in soils with high pH, the precipitation of P with Ca becomes one of the main mechanisms of P immobilization [32], which does not release OH into the soil solution, as is the case with adsorption to Fe and Al oxyhydroxides [40].

3.2.2. Available and Total P after Fertilizer Diffusion

TSP was the source with the highest soil available P content up to 25.5 mm from the granule (Figure 4a). Partial acidulated fertilizers (50% ac.) produced from BRP and MRP containing PILC and zeolites in the formulation (T5, T7, T9 and T11) also presented superior values of available P in the first layer (<7.75 mm) compared to other sources. According to Williams [41], soil P movement depends, among other factors, on the composition of the fertilizer granule. Thus, in the second layer (7.75–13.5 mm), fertilizers from BRP and MRP containing zeolite resulted in higher P resin contents when compared to the same phosphates containing PILC, within the same level of acidulation (T5 < T7; T6 < T8; T9 < T11; T10 < T12). In the third layer (13.5–25.5 mm), this behavior was observed only in phosphates produced from BRP at 50% acidulation (T5 < T7) (Figure 4a). The highest P diffusion under products containing zeolite is attributed to its lower MPAC (31 mg kg−1) when compared to PILC (5527 mg kg−1). In the case of products containing PILC, the P released by acidulation may possibly have bound to its clay acidic sites, inhibiting P movement in the soil.
No difference in available P was observed between control (T14) and the sources produced (T1–T12) in the last layer (25.5–43 mm), except for treatments T1, T4 and T7 whose differences are most likely due to small analytical variations (Figure 4a). Hardly any P from fertilizers would reach this distance and still remain available due to their strong interactions with the soil clay minerals [18]. In general, the phosphates produced from ARP with 50% ac. containing PILC or zeolites (T1 and T3) provided the lowest levels of available P up to a distance of 13.5 mm when compared to BRP and MRP, at the same level of acidulation (T5, T7, T9 and T11). However, within the less acidulated group (25% ac.), there were no major differences between them (T2, T4, T6, T8, T10 and T12), especially in the first layer (0–7.75 mm) (Figure 4a).
All the RPs with 50% ac. presented higher available P up to 13.5 mm from the granule when compared with 25% ac. Apatite is the main mineral present in RPs (Figure 2), and its dissolution is facilitated in acidic medium [42]; thus, the more H+ enters the system, the greater its dissolution. More than 65% of the available P from our fertilizers was restricted to the first layer (<7.75 mm), similar to TSP although a completely soluble source (Figure 4c). In general, the available P in soil decreased gradually with the distance from the granule. Overridingly, in the literature, there are reports of small movements of P from phosphate fertilizers in soil [18,35,36,43,44], confirming that only a small portion of the soil (few millimeters) is actually influenced by P fertilizers.
The results of total P content in each distance from the granule represent the diffusion of P from fertilizers in five weeks of incubation (Figure 4b). In general, the phosphate sources that resulted in the lowest total P in the first layer (<7.75 mm), regardless of the control, were also the ones that resulted in the highest P content in the adjacent layer (7.75–13.5 mm) (T7, T11 and TSP). More than 90% of total P from phosphate sources derived from ARP at both acidulation levels (T1–T4) and from reactive RP (BRP and MRP) with 25% ac. (T6, T8, T10 and T12) was restricted to the first 7.75 mm from the granule. The source with the greatest diffusion was TSP, even though more than 60% remained close to the granule (<7.75 mm) (Figure 4d).
In general, partially acidulated phosphates containing zeolite promoted more total P diffusion when compared to the same phosphates containing PILC, at the same level of acidulation (T1 < T3; T2 < T4; T5 < T7; T6 < T8; T9 < T11; T10 < T12) (Figure 4d). As already mentioned, this greater diffusion with zeolites is attributed to its smaller MPAC. Possibly, P released from the dissolution of RPs + PILC was potentially bound to the acidic sites of its own clay, limiting P movement in the soil. Silva [37] evaluated the diffusion of P from reduced solubility phosphate fertilizers in Cerrado soil using the SEM-EDXA (Scanning Electron Microscope with Energy Dispersive X-ray Analyzer) technique to determine the elemental composition of the granules before and after a period of soil contact. The results show that approximately 50% of P remained within the fertilizer granule even after five weeks of incubation in most of the evaluated products. He also verified the presence of ions such as Ca, Fe and Al in the constitution of these granules after the incubation, which may explain their small dissolution.
A certain level of soil moisture is fundamental to adequate fertilizer dissolution. However, once the fertilizer granules are in contact with the soil, two forces will regulate P availability; firstly, the water flows towards the granule by negative osmotic potential, carrying with it numerous chemical species such as Ca2+, Al3+, Fe2+, Mg2+, etc. This explains the presence of several elements inside the granules after incubation which were not part of their original composition, as observed by Silva [37]. Secondly, dissolved elements from the granule move to outside the surrounding areas of lower concentration. At this time, due to the high affinity of P with various metals, insoluble compounds such as P-Al and P-Fe precipitates, for example, may form [32,37], which justifies the weak diffusion and great permanence of P close to the fertilizer granule (<7.75 mm). Another fact is the movement of the companion ion [45], in this case especially Ca. For more intense P diffusion into the soil solution, more Ca dissolution and movement is required, preferably outside the granule region, which was not intensified in our study because of the static incubation, without solution flow, in agreement with the results already reported by Silva [37].
Moreover, the movement of P depends on fertilizer characteristics, such as the size of their particles/granules and their composition, and a series of soil properties, such as compaction, moisture level and mineralogical composition [41]. Thus, Benbi and Gilkes [46] studied the movement of P from TSP in two soils with high and low MPAC. After four weeks of fertilizer application, the added P was retained up to 80 mm away from the fertilizer granule in both soils. Within this 80 mm boundary, they also observed that P retention occurs in three different zones; one refers to the local of fertilizer granule, another one to the region next to the granule where precipitation and adsorption reactions predominate near the maximum limits, and the last is the most external where P is adsorbed to the soil at lower levels than its MPAC. These different zones of P accumulation are in agreement with the restricted available P diffusion observed here in our study.

3.3. Solubilization of Fertilizers in Soil Columns

3.3.1. Leaching Potential

The presence of P in leached solution was not detected in the control treatment. Moreover, no P was detected in the leached solutions containing pure RPs (ARP, BRP and MRP), which testifies to the zero water solubility of these sources (Table 1). Therefore, it is assumed that all the P contained in the leached water derives from the lab treatments applied to these RPs (Figure 5).
According to the acidulation level and additives incorporated in each source evaluated herein, distinct amounts of P were detected in the leachate through the soil columns over the 60 days’ incubation period (T1–T12) (Figure 5a). In total, five groups were identified; the first group, involving treatments T2, T4, T6 and T10, was classified as insoluble phosphates, meaning that these treatments were not able to promote leaching of P sufficient to differentiate from pure RPs and control, varying from 1.2 to 3.5 mg P per column over the 60 days’ incubation period. The second group, consisting of treatments T1, T3, T8 and T12, represented fertilizers with reduced solubility, sufficient to be different from the insoluble ones, with the P leached ranging from 7.4 to 10.0 mg P per column. The third group consisted of treatments T5 and T9, whose leaching was 18.0 and 17.5 mg of P per column, respectively, and the fourth group, composed of treatments T7 and T11, registered 25.2 and 23.0 mg of P per column, respectively. These last two groups, involving treatments with high reactive RPs, are potentially viable alternatives for overcoming the totally soluble sources due to the slower dissolution of P into solution. TSP, the one with the highest P loss in leached solution (64 mg of P per column), constituted the fifth and last group (Figure 5b).
According to the P solubilization and leaching patterns observed for all the fertilizers evaluated here (except for the insoluble ones—group 1), it is possible to identify two distinct phases (Figure 5a). The first phase consisted of the first 10 days, when more than 50% of P had already leached. From the 10th day onwards, there was a significant decrease in the P content in the leaching solution, comprising a second leaching phase. These two phases are explained by the high P affinity to the soil constituents. When released from fertilizer, the P will potentially bind to the surface of Fe and Al oxides. Initially, the soft energy of these bonds still allows for P percolation through the profile (first phase). Subsequently, the concentration of P in leachate decreases due to the increase in energy (“aging”) of P linkage (bidentate and binucleate bonds), inhibiting P leaching in the solution [44].
Clearly, the acidulation levels were the major factors responsible for the dissolution of RPs and, consequently, for the differences in P levels detected in leachate (Figure 5b). However, the presence of PILC restricted the leaching of P, mainly in the treatments from reactive RPs (T5, T6, T9 and T10), due to its high MPAC (5527 mg kg−1) when compared to treatments with Zeolite in the same RPs (T7, T8, T11 and T12).

3.3.2. Phosphorus Lability

For better comprehension of the P dynamics and its accumulation in soils, sequential extraction with distinct strength solutions has become a fundamental tool [47,48,49,50]. The “P fractionation” procedure allows for evaluating the forms and distribution of this nutrient in the soil according to the fractions extracted, as well as the fate of P applied via fertilizers, in order to identify changes in soil nutrient dynamics. All the fertilizers studied, including pure RPs, were able to increase the labile P fractions in the soil profile after 60 days of incubation. In the first layer (0–1 cm) ARP + PILC + 50% ac. (T1) provided the highest levels of labile P when compared to other sources, in the following decreasing sequence: T1 > TSP = T3 = T5 = T9 > T2 = T4 = T7 = T9 > T6 = T10 > T8 > T12 > T14 = T15 > T13 > T17 (Figure 6a and Appendix A). In deeper layers, in general, sources with 50% ac. recorded the highest increases in soil labile P pool, but were much less expressive than in the 0–1 cm layer (Figure 6b–e).
There was great accumulation of moderate labile P throughout the profile under our fertilizer sources (T1–T12), detaching the first layer (0–1 cm), where it represented more than 88% of the total P (Figure 6a and Appendix A). In general, it was observed that 50% ac. resulted in higher contents of P extracted by 0.1 mol L−1 NaOH and lower contents of P extracted by 1 mol L−1 HCl when compared to 25% ac. (Appendix C). Based on these observations, it is clear that P solubilized from fertilizers was rapidly bound to mineral compounds in our test soil. Thus, its availability over time will be compromised by the strength of the reaction (monodentate, bidentate and/or binucleate bonds). Nevertheless, the sources produced from the same RPs containing incorporated PILC had a higher content of P extracted with 0.1 mol L−1 NaOH than those containing zeolites at the same level of acidulation (25 or 50% ac.) (Appendix C). This is mainly due to the presence of AlOH and AlOH2 groups in PILC that are able to adsorb a large amount of P (PILC MPAC = 5527 mg kg−1) [51]. Some plant species are capable of acquiring P from this moderately labile inorganic P fraction via different mechanisms such as mycorrhizal association or P-solubilizing rhizosphere exudates [52,53].
In the first soil layer (0–1 cm), the total P content ranged from 2.007 (T15) to 13.242 (T6) mg kg−1 (Figure 6a). The residual fertilizer granules were homogenized to the soil at this layer when sampling, justifying this large amount of total P. According to Silva [37], after a short time in contact with the soil, approximately 50% of the P remains inside the fertilizer granule. The permanence of P within or surrounding the granule, as observed in this study, was due to the incomplete dissolution of the partially acidulated phosphates, proved by the significant participation of P extracted by HCl, which refers to Ca-phosphates (Appendix C). The formation of insoluble compounds such as P-Al and P-Fe or the adsorption of P onto the surface of Fe and Al sesquioxides also contributed to this accumulation, evidenced by the Pi fraction extracted by 0.1 mol L−1 NaOH (Appendix C). Under TSP, although a soluble source, P accumulation was also observed in this top layer due to its high affinity to the surface of Fe and Al sesquioxides. The retrogradation process (P-Ca) also restricted the movement of P from TSP, but to a lesser extent than the other sources (Figure 6a, Appendix C).
The non-labile P pool was the least influenced by our treatments (Figure 6). When analyzing the participation of each compartment in the total P in our soil, it was observed that under no fertilizer (control), the non-labile P represented the greatest part of the total P throughout the profile (74–89%). Several studies in tropical soils similarly reported this expressive proportion of non-labile P due to the high energy binding between phosphate and functional groups of Fe and Al sesquioxides [47,48,49,54,55,56]. Although there was an accumulation of non-labile P in the 0–1 cm layer under fertilizer application, its proportion to the total P was very small (3.2–13.4%) compared to other layers evaluated, and the sources that provided the highest accumulations were those produced from ARP (T1–T4), given its much lower reactivity compared to other sources (BRP and MRP) (Figure 6a). For other layers, non-labile P participation varied from 25 to 44.3% of the total P, but was not clearly influenced by any specific source/treatment (Figure 6b–e).

3.4. Agronomic Efficiency

At maize harvest (45 days after sowing), plants had typical symptoms of P deficiency under control (T17) and under pure RP treatments ARP (T13) and MRP (T15). Reduced growth and purplish, dark brown or dried leaves were the main symptoms observed (Appendix E). The difference in development between treatments was expressive, plants that received TSP looked healthy and better than other treatments, but all the partially acidulated phosphate sources with the incorporation of PILC and zeolites were able to promote greater maize growth than control and pure RPs.
Pure sources of ARP (T13) and MRP (T15) did not provide sufficient P for maize plants to express their initial growth potential, showing performances similar to the control for all the parameters evaluated (shoot and root DM, and accumulated P in shoot and root), resulting in very low RAE (0.8 and 10.6%, respectively) (Table 5). Therefore, the use of these RPs for direct application as fertilizer is not feasible. Partial acidulation (25 or 50% ac.) and incorporation of PILC or zeolites into their formulations resulted in significant increases in all plant parameters, with RAE ranging from 26.8 (T2) to 85.4% (T11).
The pure source BRP (T14) was able to differentiate from the control in plant growth parameters, with an RAE of 36.6% (Table 5). When BRP was acidulated by 25% (T6 and T8), it was not enough to significantly increase plant response. Similar results were also detected for ARP and MRP under 25% ac. (T2, T4, T10 and T12). However, it is worth mentioning that there was a physical difference between these fertilizers when BRP was applied in the powder/bran form, the same way that it is commercialized, and the phosphates that received 25% acidulation were applied as granules. The higher the phosphate contact with the soil, i.e., the greater its specific surface area, the greater its dissolution due to the higher contact of phosphate with the H+ protons present in the soil [57,58,59,60].
Among the lab fertilizers produced in our study, treatments T5 and T11 were the ones that provided RAE nearly similar to TSP (89 and 85%, respectively). Both received 50% acidulation, but T5 was produced from BRP with PILC and T11 was produced from MRP with zeolites. Treatments T7 (BRP + Zeo + 50% Ac.) and T9 (MRP + PILC + 50% Ac.) also resulted in good RAE indexes (74 and 76%, respectively). In view of these results, 50% acidulation may be a profitable alternative to improve fertilizer efficiency when using sedimentary RPs for crop production. Otherwise, additives PILC and zeolite do not seem to be effective in increasing P agronomic efficiency (Table 5).
Numerous published research studies on the effectiveness of partially acidulated phosphate fertilizers found conflicting results [57,61,62,63,64,65,66]. This is attributed to differences in the physical form of application (powder versus granular), the products used for acidulation, the type of soil used to test the fertilizers and the doses tested [57,67]. From our study, it is possible to confirm that the type of RP used as raw material for the production of a partially acidulated phosphate also influences its effectiveness.
In fact, our previous incubation experiments (diffusion and solubilization) showed better results from sources containing zeolites (greater P diffusion and solubilization). This high P availability of fertilizers containing zeolite reflected in higher RAE only for MRP under 50% ac. (T11). In sources under 25% ac., the difference between zeolite and PILC products in similar RP sources was negligible. However, as solution soluble P can be easily adsorbed in a short period of time, the slower solubilization under the presence of PILC or even zeolite may play an important effect for better plant P utilization over time.
We confirmed here the very low diffusion of P in the soil. Therefore, we can say that the phosphate fertilizer placement can strongly influence its agronomic efficiency, and application techniques should be considered when thinking about improving the phosphate fertilizer use efficiency. A study conducted by Nkebiwe et al. [68], summarizing current techniques for N and P fertilizer placement in soil, showed that overall, fertilizer placement led to 3.7% higher yield, 3.7% higher nutrient concentration and 11.9% higher nutrient content in above-ground parts than fertilizer broadcast in soil surface. In fact, understanding the dynamics of P when fertilizers are applied in soil by different placement strategies and the use of new technologies may help to utilize P more efficiently.

4. Conclusions

The highest values of relative agronomic efficiency (>74%) were obtained with 50% acidulation of reactive RPs from Peru (BRP) and from Morocco (MRP) (T5, T7, T9; T11). Thus, these sources can be considered as being better suited alternatives for overcoming high solubility sources when searching for a product with more gradual P release into the soil. In the same trend, fertilizers produced from BRP and MRP with 50% acidulation containing zeolite in the formulation (T7 and T11) provided the highest diffusion and percolation of P in the soil profile, although still much lower than TSP. Otherwise, even zeolite and PILC seem not effective in increasing P agronomic efficiency.
All the fertilizers were able to increase the labile and moderately labile P fractions in the soil profile after 60 days of incubation. However, in the top layer, close to the fertilizer (0–1 cm), the sources containing PILC with 50% acidulation provided higher labile P contents when compared to zeolite, at the same level of acidulation and even RP source (T1 > T3, T5 > T7, T9 > T11). TSP was the most effective in percolating P in the soil profile, even in labile or moderate labile pools.

Author Contributions

Conceptualization, A.P.B.T. and P.S.P.; methodology, A.P.B.T., M.R. and P.S.P.; data curation, A.P.B.T.; statistical analysis, M.R.; writing—original draft preparation, A.P.B.T.; writing—review and editing, P.S.P. and M.R.; validation, A.P.B.T., M.R. and P.S.P. All authors have read and agreed to the published version of the manuscript.

Funding

This research did not receive any specific grant from funding agencies in the public, commercial, or not-for-profit sectors. The authors are grateful to Coordination for the Improvement of Higher Education Personnel (CAPES), which supported the scholarship to the first author.

Conflicts of Interest

The authors declare no conflicts of interest.

Appendix A

Table A1. Labile, moderately labile and non-labile P pools in the surface soil layer of the column in response to phosphate fertilizer application after 60 days.
TreatmentsLabile PModerately Labile PNon-Labile P
mg Kg−1
0–1 cm
T1709.6 a10618.3 b620.6 a
T2555.2 c11779.9 a654.2 a
T3647.9 b10206.3 b600.1 a
T4588.6 c10268.8 b705.1 a
T5609.3 b9797.2 c387.8 c
T6479.8 d12343.4 a419.2 c
T7583.3 c7776.2 c395.4 c
T8390.4 e10360.9 b392.1 c
T9624.7 b7840.0 c357.4 c
T10520.6 d11000.6 b499.3 b
T11567.0 c8171.4 c396.4 c
T12329.3 f10381.0 b380.2 c
T13140.5 h6152.8 d573.0 b
T14191.0 g2773.1 e300.0 d
T15213.6 g1523.4 f269.7 d
T16638.8 b3548.3 e361.8 c
T1721.9 i41.4 g197.9 d
Mean values followed by the same letter do not differ by t-test (Scott-Knott, P < 0.05). ns, not significant. T1 = ARP + PILC + 50% Ac.; T2 = ARP + PILC + 25% Ac; T3 = ARP + Zeo + 50% Ac; T4 = ARP + Zeo + 25% Ac.; T5 = BRP + PILC + 50% Ac.; T6 = BRP + PILC + 25% Ac.; T7 = BRP + Zeo + 50% Ac; T8 = BRP + Zeo + 25% Ac; T9 = MRP + PILC + 50% Ac.; T10 = MRP + PILC + 25% Ac.; T11 = MRP + Zeo + 50% Ac.; T12 = MRP + Zeo + 25% Ac.; T13 = ARP (Araxá rock phosphate); T14 = BRP (Bayovar rock phosphate); T15 = MRP (Morocco rock phosphate); T16 = TSP (triple superphosphate); T17 = control. PILC = pillared clay; Zeo = zeolite.

Appendix B

Table A2. Labile fractions of inorganic and organic P in the soil extracted by anion exchange resin (PAER) and 0.5 mol L−1 NaHCO3 (PiBIC and PoBIC) in different layers of the columns according to the sources of phosphate fertilizers.
SourcesLabile P (mg kg1)
PRTAPiBICPoBIC
0–1 cm1–2 cm2–3 cm3–6 cm6–10 cm0–1 cm1–2 cm2–3 cm3–6 cm6–10 cm0–1 cm1–2 cm2–3 cm3–6 cm6–10 cm
T1220.7 a132.6 a139.5 b129.7 b89.6 d400.9 a74.2 b75.3 c80.2 a51.1 d88.6 a42.9 a16.8 a14.5 b10.6 a
T2183.9 b108.0 b95.7 c93.3 c72.7 e322.3 c70.7 b61.6 d49.6 b39.3 e48.8 b30.0 b3.7 b17.6 a14.9 a
T3190.6 b132.5 a151.4 b132.1 b107.1 b396.2 a81.0 a86.0 b76.6 a59.8 b61.0 a32.2 b20.1 a11.9 b14.5 a
T4184.6 b111.6 b106.1 c98.6 c83.5 d336.5 b68.8 b66.5 d51.4 b42.1 e67.3 a31.3 b12.4 b13.4 b14.4 a
T5208.1 a133.1 a154.8 b140.0 b123.8 a369.7 b79.5 a80.9 c77.5 a59.1 b61.1 a32.4 b19.7 a24.6 a19.6 a
T6157.4 b106.4 b104.5 c98.6 c097.6 c269.8 d59.5 c62.6 d54.4 b50.7 d52.5 b25.9 b12.9 b18.4 a15.4 a
T7207.0 a132.0 a137.0 b132.8 b113.1 b280.8 d72.2 b76.3 c76.1 a58.6 b95.4 a27.9 b7.7 b19.1 a13.8 a
T8139.9 c88.6 c96.6 c98.3 c86.2 d156.4 e60.4 c61.0 d55.4 b48.1 d94.0 a18.5 c2.8 b14.2 b10.8 a
T9245.7 a137.8 a143.1 b130.7 b112.5 b312.8 c74.4 b70.2 d67.8 a53.4 c66.0 a10.2 d26.4 a15.9 b11.0 a
T10171.2 b83.0 c86.0 c89.7 c71.3 e296.6 c50.9 d50.0 e50.3 b35.7 f52.6 b5.0 d10.2 b21.0 a15.2 a
T11217.0 a140.3 a186.6 a137.4 b119.8 a269.0 d72.1 b76.7 c74.1 a54.3 c80.9 a7.8 d16.4 a10.5 b14.2 a
T12136.6 c88.3 c77.7 c92.3 c92.7 c120.8 f46.0 e38.0 f49.8 b41.1 e71.7 a7.0 d26.5 a18.7 a13.5 a
T1372.4 d50.2 d55.4 d67.3 d76.0 e34.7 g35.4 f33.6 f39.8 c39.8 e33.3 b5.1 d20.1 a28.4 a12.2 a
T14100.4 d39.0 d49.1 d63.9 d70.2 e51.3 g31.0 f36.1 f42.9 c39.5 e39.1 b5.3 d13.8 b17.4 a10.7 a
T15134.2 c39.3 d49.1 d57.5 d67.0 e37.1 g31.0 f33.3 f39.5 c39.5 e42.1 b6.4 d11.5 b14.6 b12.9 a
T16229.7 a130.5 a139.4 b157.4 a128.8 a361.2 b72.3 b94.0 a87.9 a63.5 a47.8 b9.6 d15.4 a26.4 a12.9 a
T170.7 e0.5 e0.2 e0.3 e0.4 f4.0 h3.7 g5.4 g6.0 d2.3 g17.0 b1.1 d8.1 b3.5 b2.7 b
Means followed by the same letter in the column do not differ from each other by the Scott-Knott test at 5% probability. T1 = ARP + PILC + 50% Ac.; T2 = ARP + PILC + 25% Ac; T3 = ARP + Zeo + 50% Ac; T4 = ARP + Zeo + 25% Ac.; T5 = BRP + PILC + 50% Ac.; T6 = BRP + PILC + 25% Ac.; T7 = BRP + Zeo + 50% Ac; T8 = BRP + Zeo + 25% Ac; T9 = MRP + PILC + 50% Ac.; T10 = MRP + PILC + 25% Ac.; T11 = MRP + Zeo + 50% Ac.; T12 = MRP + Zeo + 25% Ac.; T13 = ARP (Araxá rock phosphate); T14 = BRP (Bayovar rock phosphate); T15 = MRP (Morocco rock phosphate); T16 = TSP (triple superphosphate); T17 = control. PILC = pillared clay; Zeo = zeolite.

Appendix C

Table A3. Moderately labile fractions of inorganic and organic P in the soil extracted by 0.1 mol L−1 NaOH (PiHid0.1 and PoHid0.1) and 1 mol L−1 HCl (PHCl) in different layers of the columns in function sources of phosphate fertilizers.
SourcesModerately Labile P (mg kg1)
PiHid0.1PoHid0.1PHCl
0–1 cm1–2 cm2–3 cm3–6 cm6–10 cm0–1 cm1–2 cm2–3 cm3–6 cm6–10 cm0–1 cm1–2 cm2–3 cm3–6 cm6–10 cm
T12227.6 b91.9 b92.8 a82.5 c66.8 e771.3 a22.0 c49.3 b36.9 b31.9 b7619.2 b3.0 a1.7 c1.5 b5.5 a
T21348.3 c89.6 b77.3 c69.5 e57.6 f302.1 c18.6 c36.0 c29.2 b23.2 c10129.4 a3.1 a1.3 d1.4 b3.5 a
T32690.5 a99.5 a100.8 a90.2 b78.5 c831.9 a10.2 d51.9 b38.9 b28.3 b6683.8 b3.6 a1.7 c1.7 b4.6 a
T4914.8 d89.7 b87.1 b72.0 d63.5 e414.5 c4.8 d38.8 c27.5 b20.1 c8939.4 a2.9 a1.2 d1.5 b4.9 a
T51340.6 c99.8 a102.1 a91.7 b76.3 c518.5 b16.8 c49.4 b39.1 b22.0 c6879.2 b3.5 a1.8 c2.0 b5.2 a
T6907.1 d90.7 b82.1 b73.3 d72.6 d264.8 c1.2 d35.2 c28.2 b21.6 c11171.3 a2.6 a1.5 c2.2 a4.5 a
T7677.2 d99.9 a97.0 a87.2 b88.7 b308.5 c11.2 d42.7 c35.4 b22.6 c6790.4 b3.2 a1.8 c1.9 b1.6 b
T8359.4 e87.0 b84.1 b77.2 d87.8 b292.3 c8.2 d37.3 c42.2 b22.8 c9709.0 a2.0 b1.7 c1.5 b1.0 b
T91049.0 d96.3 a104.6 a84.0 c88.6 b261.0 c53.2 a37.5 c31.0 b29.8 b6529.9 b1.8 b2.0 b2.9 a1.0 b
T10850.0 d82.0 c78.3 c72.4 d74.1 d222.4 c37.8 b41.9 c26.7 b32.9 b9928.1 a0.7 c1.4 d1.7 b0.7 b
T11307.0 e90.7 b97.0 a88.4 b90.7 b357.6 c58.7 a50.0 b31.3 b34.6 b7506.7 b1.2 c2.0 b2.0 b1.2 b
T12186.6 e73.6 d75.2 c73.7 d79.0 c343.1 c35.7 b37.7 c30.2 b34.1 b9851.1 a0.7 c1.3 d1.4 b0.9 b
T1366.2 f62.6 e64.2 d64.3 e77.8 c296.5 c38.9 b37.3 c31.9 b34.9 b5789.9 b1.7 b2.6 a2.8 a2.0 b
T1457.6 f54.7 f61.7 d67.2 e77.1 c276.3 c33.8 b44.7 c29.4 b39.7 b2439.1 c2.1 b2.7 a2.9 a2.2 b
T1545.5 f54.1 f59.8 d64.1 e72.9 d282.0 c29.5 b38.5 c35.0 b47.6 a1195.8 d1.9 b2.5 a2.7 a2.3 b
T162136.6 b97.3 a101.2 a99.4 a96.5 a511.7 b45.3 a72.3 a57.0 a49.7 a899.8 d1.8 b2.4 a2.6 a1.9 b
T1712.4 f12.3 g10.3 e11.3 f10.6 g28.5 d0.3 d14.9 d2.6 c0.0 d0.5 e0.1 c0.1 e0.3 c0.3 b
Means followed by the same letter in the column do not differ from each other by the Scott-Knott test at 5% probability. T1 = ARP + PILC + 50% Ac.; T2 = ARP + PILC + 25% Ac; T3 = ARP + Zeo + 50% Ac; T4 = ARP + Zeo + 25% Ac.; T5 = BRP + PILC + 50% Ac.; T6 = BRP + PILC + 25% Ac.; T7 = BRP + Zeo + 50% Ac; T8 = BRP + Zeo + 25% Ac; T9 = MRP + PILC + 50% Ac.; T10 = MRP + PILC + 25% Ac.; T11 = MRP + Zeo + 50% Ac.; T12 = MRP + Zeo + 25% Ac.; T13 = ARP (Araxá rock phosphate); T14 = BRP (Bayovar rock phosphate); T15 = MRP (Morocco rock phosphate); T16 = TSP (triple superphosphate); T17 = control. PILC = pillared clay; Zeo = zeolite.

Appendix D

Table A4. Residual fraction (Presidual) of P in the soil, considered non-labile, in different layers of the columns according to the sources of phosphate fertilizers.
SourcesNon-Labile P (mg kg1)
Presidual
0–1 cm1–2 cm2–3 cm3–6 cm6–10 cm
T1620.6 a122.5 ns128.6 b138.8 a133.0 a
T2654.2 a122.3123.7 b142.7 a99.0 b
T3600.0 a126.5130.6 b146.4 a107.4 b
T4705.1 a122.8129.0 b127.2 b104.1 b
T5387.7 c125.8131.3 b148.5 a112.6 a
T6419.1 c129.5129.7 b137.6 a123.4 a
T7395.3 c125.3138.3 b149.9 a116.3 a
T8392.1 c123.0133.9 b142.5 a118.9 a
T9357.4 c135.0148.0 a149.4 a114.4 a
T10499.3 b128.1155.0 a129.7 b115.1 a
T11396.4 c136.0155.4 a141.3 a117.5 a
T12380.1 c118.6147.8 a138.1 a117.0 a
T13572.9 b128.1144.5 a149.4 a121.0 a
T14300.0 d127.2146.2 a141.1 a119.1 a
T15269.7 d129.3136.0 b138.3 a120.5 a
T16361.7 c133.0138.1 b149.4 a119.8 a
T1794.8 d111.4113.5 b109.8 c106.7 b
Means followed by the same letter in the column do not differ from each other by the Scott-Knott test at 5% probability. ns = not significant. T1 = ARP + PILC + 50% ac.; T2 = ARP + PILC + 25% ac.; T3 = ARP + Zeo + 50% ac.; T4 = ARP + Zeo + 25% ac.; T5 = BRP + PILC + 50% ac.; T6 = BRP + PILC + 25% ac.; T7 = BRP + Zeo + 50% ac.; T8 = BRP + Zeo + 25% ac.; T9 = MRP + PILC + 50% ac.; T10 = MRP + PILC + 25% ac.; T11 = MRP + Zeo + 50% ac.; T12 = MRP + Zeo + 25% ac.; T13 = ARP (Araxá rock phosphate); T14 = BRP (Bayovar rock phosphate); T15 = MRP (Morocco rock phosphate); T16 = TSP (triple superphosphate); T17 = control. PILC = pillared clay; Zeo = zeolite.

Appendix E

Figure A1. Maize plants at harvest (45 days growth) showing the differences between treatments. (A) 1 = Control (T17); 2 = ARP (T13); 3 = ARP + PILC + 25% ac. (T2); 4 = ARP + PILC + 50% ac. (T1); 5 = TSP (T16). (B) 1 = Control (T17); 2 = ARP (T13); 3 = ARP + Zeo + 25% ac. (T4); 4 = ARP + Zeo + 50% ac. (T3); 5 = TSP (T16). (C) 1 = Control (T17); 2 = BRP (T14); 3 = BRP + PILC + 25% ac. (T6); 4 = BRP + PILC + 50% ac. (T5); 5 = TSP (T16). (D) 1 = Control (T17); 2 = BRP (T14); 3 = BRP + Zeo + 25% ac. (T8); 4 = BRP + Zeo + 50% ac. (T7); 5 = TSP (T16). (E) 1 = Control (T17); 2 = MRP (T15); 3 = MRP + PILC + 25% ac. (T10); 4 = MRP + PILC + 50% ac. (T9); 5 = TSP (T16). (F) 1 = Control (T17); 2 = MRP (T15); 3 = MRP + Zeo + 25% ac. (T12); 4 = MRP + Zeo + 50% ac. (T11); 5 = TSP (T16). ARP = Araxá rock phosphate; BRP = Bayovar rock phosphate; MRP = Morroco rock phosphate; TSP = triplo superphosphate; PILC = pillared clay; Zeo = zeolite.
Agronomy 10 00918 g0a1

References

  1. Lambers, H.; Plaxton, W.C. Phosphorus: Back to the roots. In Phosphorus Metabolism in Plants; Plaxton, W.C., Lambers, H., Eds.; Wiley-Blackwell: Hoboken, NJ, USA, 2015; pp. 3–22. [Google Scholar]
  2. Roberts, T.L.; Johnston, A.E. Phosphorus use efficiency and management in agriculture. Resour. Conserv. Recy. 2015, 105, 275–281. [Google Scholar] [CrossRef]
  3. Shen, J.; Yuan, L.; Zhang, J.; Li, H.; Bai, Z.; Chen, X.; Zhang, W.; Zhang, F. Phosphorus dynamics: From soil to plant. Plant Physiol. 2011, 156, 997–1005. [Google Scholar] [CrossRef] [Green Version]
  4. [USGS] United States Geological Survey. 2015 Minerals Yearbook: Phosphate Rock [Advance Release]. 2015. Available online: https://minerals.usgs.gov/minerals/pubs/commodity/phosphate_rock/myb1-2015-phosp.pdf (accessed on 13 March 2019).
  5. Jarvie, H.P.; Sharpley, A.N.; Flaten, D.; Kleinman, P.J.A.; Jenkins, A.; Simmons, T. The pivotal role of phosphorus in a resilient water–energy–food security nexus. J. Environ. Qual. 2015, 44, 1049–1062. [Google Scholar] [CrossRef]
  6. Pagliari, P.H.; Strock, J.S.; Rosen, C.J. Changes in soil pH and extractable phosphorus following application of Turkey manure incinerator ash and triple superphosphate. Commun. Soil Sci. Plant Anal. 2010, 41, 1502–1512. [Google Scholar] [CrossRef]
  7. Rajput, A.; Panhwar, Q.A.; Naher, U.A.; Rajput, S.; Hossain, E.; Shamshuddin, J. Influence of incubation period, temperature and different phosphate levels on phosphate adsorption in soil. Am. J. Agric. Biol. Sci. 2014, 9, 251–260. [Google Scholar] [CrossRef] [Green Version]
  8. Biswas, D.R.; Narayanasamy, G. Characterization of Partially Acidulated Phosphate Rocks. J. Indian Soc. Soil Sci. 1995, 43, 618–623. [Google Scholar]
  9. Cekinski, E. Fertilizantes Fosfatados [Phosphate fertilizers]. In Tecnologia de Produção de Fertilizantes [Fertilizer Production Technology]; Cekinski, E., Calmonovici, C.E., Bichara, J.M., Fabiani, M., Giulietti, M., Castro, M.L.M.M., Silveira, P.B.M., Pressionotti, Q.S.H.C., Guardani, R., Eds.; Instituto de Pesquisas Tecnológicas: São Paulo, Brazil, 1990; pp. 95–129. (In Portuguese) [Google Scholar]
  10. Pickering, H.W.; Menzies, N.W.; Hunter, M.N. Zeolite/rock phosphate—A novel slow release phosphorus fertiliser for potted plant production. Sci. Hortic. 2002, 94, 333–343. [Google Scholar] [CrossRef]
  11. Wu, P.-X.; Liao, Z.-W. Study on structural characteristics of pillared clay modified phosphate fertilizers and its increase efficiency mechanism. J. Zhejiang Univ. Sci. B 2005, 6, 195–201. [Google Scholar] [CrossRef]
  12. [USDA-NRCS] United States Department of Agriculture—Natural Resources Conservation Service. Soil Survey Laboratory Methods Manual (SSIR 42), 4th ed.; USDA-NRCS: Washington, DC, USA, 2004.
  13. Farkas, A.; Rozic, M.; Barbaric-Mikocevic, Z. Ammonium exchange in leakage waters of waste dumps using natural zeolite from the Krapina region, Croatia. J. Hazard. Mater. 2005, 117, 25–33. [Google Scholar] [CrossRef]
  14. Alvarez, V.V.H.; Novais, R.F.; Dias, L.E.; Oliveira, J.A. Determinação e uso do fósforo remanescente [Determination and use of phosphorus remnants]. Soc. Bras. Ciênc. Solo Inf. Rep. 2000, 25, 27–33. (In Portuguese) [Google Scholar]
  15. Mehra, O.P.; Jackson, M.L. Iron oxide removal from soils and clays by a dithionite-citrate system buffered with sodium bicarbonate. Clay Clay Miner. 1960, 7, 317–327. [Google Scholar] [CrossRef]
  16. Narayanan, S.; Deshpande, K. Alumina pillared montmorillonite: Characterization and catalysis of toluene benzylation and aniline ethylation. Appl. Catal. A-Gen. 2000, 193, 17–27. [Google Scholar] [CrossRef]
  17. [MAPA] Ministério da Agricultura Pecuária e Abastecimento—Brasil [Ministry of Agriculture, Livestock, and Supply—Brazil]. Manual de Métodos Analíticos Oficiais para Fertilizantes, Corretivos, Inoculantes, Substratos e Contaminantes [Official Analytical Methods Manual for Correctives, Inoculants, Substrates and Contaminants]; MAPA: Brasília, Brazil, 2007. (In Portuguese) [Google Scholar]
  18. Degryse, F.; Mclaughlin, M.J. Phosphorus Diffusion from Fertilizer: Visualization, Chemical Measurements, and Modeling. Soil Sci. Soc. Am. J. 2014, 78, 832–842. [Google Scholar] [CrossRef]
  19. [USDA-NRCS] United States Department of Agriculture—Natural Resources Conservation Service. Soil Taxonomy: A Basic System of Soil Classification for Making and Interpreting Soil Surveys, 2nd ed.; Agriculture Handbook, 436; USDA-NRCS: Washington, DC, USA, 1999.
  20. [EMBRAPA] Empresa Brasileira de Pesquisa Agropecuária [Brazilian Agricultural Research Corporation]. Sistema Brasileiro de Classificação de Solos [Soil Classification System in Brazil], 3rd ed.; Embrapa Soils: Rio de Janeiro, Brazil, 2013. (In Portuguese) [Google Scholar]
  21. Olsen, S.R.; Sommers, L.E. Phosphorus. In Methods of Soil Analysis: Chemical and Microbiological Properties; Page, A.L., Ed.; American Society of Agronomy: Madison, WI, USA, 1982; pp. 403–430. [Google Scholar]
  22. Hedley, M.J.; Stewart, J.W.B.; Chauhan, B.S. Changes in inorganic and organic soil phosphorus fractions induced by cultivation practices and by laboratory incubations. Soil Sci. Soc. Am. J. 1982, 46, 970–976. [Google Scholar] [CrossRef]
  23. Murphy, J.; Riley, J.P. A modified single solution method for the determination of phosphate in natural waters. Anal. Chim. Acta 1962, 27, 31–36. [Google Scholar] [CrossRef]
  24. Condron, L.M.; Goh, K.M.; Newman, R.H. Nature and distribution of soil phosphorus as revealed by a sequential extraction method followed by 31P nuclear magnetic resonance analysis. Eur. J. Soil Sci. 1985, 36, 199–207. [Google Scholar] [CrossRef]
  25. Malavolta, E.; Vitti, G.C.; Oliveira, S.A. Avaliação do Estado Nutricional das Plantas: Principios E Aplicações [Assessment of the Nutritional Status of Plants: Principles and Applications], 2nd ed.; Potafos: Piracicaba, Brazil, 1997. (In Portuguese) [Google Scholar]
  26. Ferreira, E.B.; Cavalcanti, P.P.; Nogueira, D.A. ExpDes: Experimental Designs Package. R Package Version 1.1.2. 2013. Available online: https://cran.r-project.org/web/packages/ExpDes.pt/index.html (accessed on 6 October 2018).
  27. R Core Team. R: A language and Environment for Statistical Computing; R Foundation for Statistical Computing: Vienna, Austria, 2017; Available online: https://www.R-project.org (accessed on 6 October 2018).
  28. Mattiello, E.M.; Resende Filho, I.D.P.; Barreto, M.S.; Soares, A.R.; Silva, I.R.; Vergütz, L.; Melo, L.C.A.; Soares, E.M.B. Soluble phosphate fertilizer production using acid effluent from metallurgical industry. J. Environ. Manag. 2016, 166, 140–146. [Google Scholar] [CrossRef]
  29. Santos, W.O.; Hesterberg, D.; Mattiello, E.M.; Vergütz, L.; Barreto, M.S.C.; Silva, I.R.; Souza Filho, L.F.S. Increasing Soluble Phosphate Species by Treatment of Phosphate Rocks with Acidic Waste. J. Environ. Qual. 2016, 45, 1988–1997. [Google Scholar] [CrossRef] [Green Version]
  30. Dorozhkin, S.V. Dissolution mechanism of calcium apatites in acids: A review of literature. World J. Methodol. 2012, 2, 1–17. [Google Scholar] [CrossRef]
  31. Cesar, F.R.C.F. Eficiência Agronômica de Misturas no Mesmo Grânulo de Fosfatos Acidulados, Fosfatos Naturais e Enxofre Elementar [Efficiencies in Agronomics of Same Granule Mixtures in Acidulated Phosphates, Natural Phosphates, and Elementary Sulphurs]. Ph.D. Thesis, Luiz de Queiroz College of Agriculture—University of São Paulo, Piracicaba, Brazil, 2016. (In Portuguese). [Google Scholar]
  32. Hettiarachchi, G.M.; Lombi, E.; McLaughlin, M.J.; Chittleborough, D.; Self, P. Density changes around phosphorus granules and fluid bands in a Calcareous Soil. Soil Sci. Soc. Am. J. 2006, 70, 960–966. [Google Scholar] [CrossRef]
  33. Lindsay, W.L.; Frazier, A.W.; Stephenson, H.F. Identification of reaction products from phosphate fertilizers in soils. Soil Sci. Soc. Am. J. 1962, 26, 446–452. [Google Scholar] [CrossRef]
  34. Montalvo, D.; Degryse, F.; Mclaughlin, M.J. Fluid Fertilizers Improve Phosphorus Diffusion but not Lability in Andisols and Oxisols. Soil Sci. Soc. Am. J. 2014, 78, 214. [Google Scholar] [CrossRef]
  35. Lombi, E.; Mclaughlin, M.J.; Johnston, C.; Armstrong, R.D.; Holloway, R.E. Mobility, solubility and lability of fluid and granular forms of P fertiliser in calcareous and non-calcareous soils under laboratory conditions. Plant Soil 2004, 269, 25–34. [Google Scholar] [CrossRef]
  36. Lombi, E.; Mclaughlin, M.J.; Johnston, C.; Armstrong, R.D.; Holloway, R.E. Mobility and lability of phosphorus from granular and fluid monoamonium phosphate differs in a calcareous soil. Soil Sci. Soc. Am. J. 2004, 68, 682–689. [Google Scholar] [CrossRef]
  37. Silva, R.C. Eficiência Agronômica de Fertilizantes Fosfatados Com Solubilidade Variada [Agronomic Efficiencies of Phosphate Fertilizers with Variable Solubility]. Ph.D. Thesis, Luiz de Queiroz College of Agriculture—University of São Paulo, Piracicaba, Brazil, 2013. (In Portuguese). [Google Scholar]
  38. Nascimento, C.A.C.; Pagliari, P.H.; Faria, L.A.; Vitti, G.C. Phosphorus mobility and behavior in soils treated with calcium, ammonium and magnesium phosphates. Soil Sci. Soc. Am. J. 2018, 82, 622–663. [Google Scholar] [CrossRef] [Green Version]
  39. Cerozi, B.S.; Fitzsimmons, K. The effect of pH on phosphorus availability and speciation in an aquaponics nutrient solution. Bioresour. Technol. 2016, 219, 778–781. [Google Scholar] [CrossRef] [Green Version]
  40. Golden, D.C.; Stewart, R.B.; Tillman, R.W.; White, R.E. Partially acidulated reactive phosphate rock (PAPR) fertilizer and its reactions in soil—II. Mineralogy and morphology of the reaction products. Fertil. Res. 1991, 28, 281–293. [Google Scholar] [CrossRef]
  41. Williams, C.H. Reactions of surface applied superphosphate with soil II. Movement of the phosphorus and sulphur into the soil. Aust. J. Soil Res. 1971, 9, 95–106. [Google Scholar] [CrossRef]
  42. Chesworth, W.; Van Straaten, P.; Smith, P.; Sadura, S. Solubility of apatite in clay and zeolite bearing systems: Application to agriculture. Appl. Clay Sci. 1987, 2, 291–297. [Google Scholar] [CrossRef]
  43. Avila, M.A.P. Influência do Silício Sobre a Difusão do Fósforo no Solo e na Eficiência Agronômica de Fertilizantes Fosfatados Granulados [Influence of Silicon on Phosphorus Diffusion in the Soil and on Agronomic Efficiency of Granulated Phosphate Fertilizers]. Master’s Thesis, Center of Nuclear Energy in Agriculture—University of São Paulo, Piracicaba, Brazil, 2016. (In Portuguese). [Google Scholar]
  44. Degryse, F.; Baird, R.; Da Silva, R.C.; Mclaughlin, M.J. Dissolution rate and agronomic effectiveness of struvite fertilizers – effect of soil pH, granulation and base excess. Plant Soil 2017, 410, 139–152. [Google Scholar] [CrossRef]
  45. Bouldin, D.R.; Dement, J.D.; Sample, E.C. Interaction between dicalcium and monoammonium phosphates granulated together. J. Agric. Food Chem. 1960, 8, 470–474. [Google Scholar] [CrossRef]
  46. Benbi, D.K.; Gilkes, R.J. The movement into soil of P from superphosphate grains and its availability to plants. Fertil. Res. 1987, 12, 21–36. [Google Scholar] [CrossRef]
  47. Gatiboni, L.C.; Kaminski, J.; Rheinheimer, D.S.; Flores, J.P.C. Biodisponibilidade de formas de fósforo acumuladas em solo sob sistema plantio direto [Bioavailability of forms of phosphorus accumulated in soil under a direct planting system]. Rev. Bras. Cienc. Solo 2007, 31, 691–699. (In Potuguese) [Google Scholar] [CrossRef] [Green Version]
  48. Pavinato, P.S.; Merlin, A.; Rosolem, C.A. Phosphorus fractions in Brazilian Cerrado soils as affected by tillage. Soil Tillage Res. 2009, 105, 149–155. [Google Scholar] [CrossRef]
  49. Tiecher, T.; Rheinheimer, D.S.; Kaminski, J.; Calegari, A. Forms of inorganic phosphorus in soil under different long-term soil tillage systems and winter crops. Rev. Bras. Cienc. Solo 2012, 36, 271–281. [Google Scholar] [CrossRef] [Green Version]
  50. Coelho, M.J.A.; Aguiar, A.C.F.; Sena, V.G.L.; Moura, E.G. Utilization and fate of phosphorus of different sources applied to cohesive soil of Amazonian periphery. Sci. Agric. 2017, 74, 242–249. [Google Scholar] [CrossRef] [Green Version]
  51. Shanableh, A.M.; Elsergany, M.M. Removal of phosphate from water using six Al-, Fe-, and Al-Fe-modified bentonite adsorbents. J. Environ. Sci. Health A 2013, 48, 223–231. [Google Scholar] [CrossRef] [PubMed]
  52. Bolan, N.S. A critical review on the role of mycorrhizal fungi in the uptake of phosphorus by plants. Plant Soil 1991, 134, 189–207. [Google Scholar] [CrossRef]
  53. Soltangheisi, A.; Moraes, M.T.; Cherubin, M.R.; Alvarez, D.O.; Souza, L.F.; Bieluczyk, W.; Navroski, D.; Teles, A.P.B.; Pavinato, P.S.; Martinelli, L.A.; et al. Forest conversion to pasture affects soil phosphorus dynamics and nutritional status in Brazilian Amazon. Soil Tillage Res. 2019, 194, 104330. [Google Scholar] [CrossRef]
  54. Redel, Y.D.; Rubio, R.; Rouanet, J.L.; Borie, F. Phosphorus bioavailability affected by tillage and crop rotation on a Chilean volcanic derived Ultisol. Geoderma 2007, 139, 388–396. [Google Scholar] [CrossRef]
  55. Rodrigues, M.; Pavinato, P.S.; Withers, P.J.A.; Teles, A.P.B.; Herrera, W.F.B. Legacy phosphorus and no tillage agriculture in tropical oxisols of the Brazilian savanna. Sci. Total Environ. 2016, 542, 1050–1061. [Google Scholar] [CrossRef]
  56. Teles, A.P.B.; Rodrigues, M.; Herrera, W.F.B.; Soltangheisi, A.; Sartor, L.R.; Withers, P.J.A.; Pavinato, P.S. Do cover crops change the lability of phosphorus in a clayey subtropical soil under different phosphate fertilizers? Soil Use Manag. 2017, 33, 34–44. [Google Scholar] [CrossRef]
  57. Khasawneh, F.E.; Doll, E.C. The use of phosphate rock for direct application to soils. Adv. Agron. 1978, 30, 159–206. [Google Scholar]
  58. Chien, S.H.; Menon, R.G. Factors affecting the agronomic effectiveness of phosphate rock for direct application. Fertil. Res. 1995, 41, 227–234. [Google Scholar] [CrossRef]
  59. Rajan, S.S.S.; Brown, M.W.; Boyes, M.K.; Upsdell, M.P. Extractable phosphorus to predict agronomic effectiveness of ground and unground phosphate rocks. Fertil. Res. 1992, 32, 291–302. [Google Scholar] [CrossRef]
  60. Horowitz, N.; Meurer, E.J. Eficiência agronômica de fosfatos naturais. In Simpósio Sobre Fósforo na Agricultura Brasileira; Potafos/Anda: Piracicaba, Brazil, 2003; CD-ROM. [Google Scholar]
  61. Beura, K.; Padbhushan, R.; Pradhan, A.K.; Mandal, N. Partial acidulation of phosphate rock for enhanced phosphorus availability in alluvial soils of Bihar. J. Nat. Appl. Sci. 2016, 8, 1393–1397. [Google Scholar] [CrossRef]
  62. Chien, S.H.; Prochnow, L.I.; Tu, S.; Snyder, C.S. Agronomic and environmental aspects of phosphate fertilizers varying in source and solubility: An update review. Nutr. Cycl. Agroecosyst. 2011, 89, 229–255. [Google Scholar] [CrossRef]
  63. Hammond, L.L.; Chien, S.H.; Mokwunye, A.U. Agronomic Value of Unacidulated and Partially Acidulated Phosphate Rocks Indigenous to the Tropics. Adv. Agron. 1986, 40, 89–140. [Google Scholar]
  64. Lewis, D.; Sale, P.W.; Johnson, D. Agronomic effectiveness of a partially acidulated reactive phosphate rock fertiliser. Aust. J. Exp. Agric. 1997, 37, 985–993. [Google Scholar] [CrossRef]
  65. Owusu-Bennoah, E.; Zapata, F.; Fardeau, J.C. Comparison of greenhouse and 32P isotopic laboratory methods for evaluating the agronomic effectiveness of natural and modified rock phosphates in some acid soils of Ghana. Nutr. Cycl. Agroecosyst. 2002, 63, 1–12. [Google Scholar] [CrossRef]
  66. Rodriguez, R.; Herrera, J. Field evaluation of partially acidulated phosphate rocks in a Ferralsol from Cuba. Nutr. Cycl. Agroecosyst. 2002, 63, 21–26. [Google Scholar] [CrossRef]
  67. Mizane, A.; Rehamnia, R. Study of some parameters to obtain the P2O5 water- soluble from partially acidulated phosphate rocks (PAPRs) by sulfuric acid. Phosphorus Res. Bull. 2012, 27, 18–22. [Google Scholar] [CrossRef] [Green Version]
  68. Nkebiwe, P.M.; Weinmann, M.; Bar-Tal, A.; Müller, T. Fertilizer placement to improve crop nutrient acquisition and yield: A review and meta-analysis. Field Crops Res. 2016, 196, 389–401. [Google Scholar] [CrossRef]
Figure 1. X-ray diffractograms of natural clay and pillared clay after calcination at 350 °C.
Agronomy 10 00918 g001
Figure 2. X-ray diffractograms of pure and acidulated RP (25 and 50% ac.) with the incorporation of pillared clay (PILC) or zeolite (Zeo), powder blades. ARP = Araxá Rock Phosphate; BRP = Bayovar Rock Phosphate; MRP = Morocco Rock Phosphate; PILC = pillared clay; Zeo = zeolite. Identified minerals: Ap = apatite; Qz = quartz; Gy = gypsum; Ba = bassanite.
Agronomy 10 00918 g002
Figure 3. Soil pH as function of fertilizer source and soil layer after five weeks of incubation. Mean values followed by the same letter in the same layer do not differ by t-test (Scott-Knott, P < 0.05). T1 = ARP + PILC + 50% Ac.; T2 = ARP + PILC + 25% Ac; T3 = ARP + Zeo + 50% Ac; T4 = ARP + Zeo + 25% Ac.; T5 = BRP + PILC + 50% Ac.; T6 = BRP + PILC + 25% Ac.; T7 = BRP + Zeo + 50% Ac; T8 = BRP + Zeo + 25% Ac; T9 = MRP + PILC + 50% Ac.; T10 = MRP + PILC + 25% Ac.; T11 = MRP + Zeo + 50% Ac.; T12 = MRP + Zeo + 25% Ac.; T13 = TSP (triple superphosphate); T14 = control. ARP = Araxá rock phosphate; BRP = Bayovar rock phosphate; MRP = Morocco rock phosphate; PILC = pillared clay; Zeo = zeolite.
Agronomy 10 00918 g003
Figure 4. Soil available P (resin) (a) and total P content (b) in samples at distinct distances from the fertilizer granule application (radii of 0–7.75, 7.75–13.5, 13.5–25.5, and 25.5–43 mm) after five weeks of incubation. Mean values followed by the same letter for each soil layer do not differ by t-test (Scott–Knott, P < 0.05). Percent distribution of available P (c) and total P (d) from fertilizer in each layer (% PfS1–4) calculated according to the equation proposed by Lombi et al. [35]: %PfSi = [(Pf)Si ∗ Wi/Σi = 1 − 4((Pf)Si ∗ Wi], where i is the layer of the petri dish (1 to 4); (Pf)Si is the content of available or total P as a function of the fertilizer addition; and Wi the mass of soil in a particular layer. (Pf)Si was calculated by subtracting the mean of the control treatment of the other treatments with fertilizers. T1 = ARP + PILC + 50% Ac.; T2 = ARP + PILC + 25% Ac; T3 = ARP + Zeo + 50% Ac; T4 = ARP + Zeo + 25% Ac.; T5 = BRP + PILC + 50% Ac.; T6 = BRP + PILC + 25% Ac.; T7 = BRP + Zeo + 50% Ac; T8 = BRP + Zeo + 25% Ac; T9 = MRP + PILC + 50% Ac.; T10 = MRP + PILC + 25% Ac.; T11 = MRP + Zeo + 50% Ac.; T12 = MRP + Zeo + 25% Ac. TSP = triple superphosphate; CONT = control; ARP = Araxá rock phosphate; BRP = Bayovar rock phosphate; MRP = Morocco rock phosphate; PILC = pillared clay; Zeo = zeolite.
Agronomy 10 00918 g004
Figure 5. Phosphorus leaching from phosphate fertilizers over time (a) and accumulated leached P after 60 days of incubation (b). Mean values followed by the same letter do not differ by t-test (Scott–Knott, P < 0.05). T1 = ARP + PILC + 50% Ac.; T2 = ARP + PILC + 25% Ac; T3 = ARP + Zeo + 50% Ac; T4 = ARP + Zeo + 25% Ac.; T5 = BRP + PILC + 50% Ac.; T6 = BRP + PILC + 25% Ac.; T7 = BRP + Zeo + 50% Ac; T8 = BRP + Zeo + 25% Ac; T9 = MRP + PILC + 50% Ac.; T10 = MRP + PILC + 25% Ac.; T11 = MRP + Zeo + 50% Ac.; T12 = MRP + Zeo + 25% Ac.; ARP = Araxá rock phosphate; BRP = Bayovar rock phosphate; MRP = Morocco rock phosphate; TSP = triple superphosphate; CONT = control. PILC = pillared clay; Zeo = zeolite.
Agronomy 10 00918 g005
Figure 6. Labile, moderately labile and non-labile P pools in different soil layers of the column, 0–1 (a), 1–2 (b), 2–3 (c), 3–6 (d) and 6–10 cm (e), in response to phosphate fertilizers application after 60 days. Mean values followed by the same letter do not differ by t-test (Scott–Knott, P < 0.05). ns, not significant. T1 = ARP + PILC + 50% Ac.; T2 = ARP + PILC + 25% Ac; T3 = ARP + Zeo + 50% Ac; T4 = ARP + Zeo + 25% Ac.; T5 = BRP + PILC + 50% Ac.; T6 = BRP + PILC + 25% Ac.; T7 = BRP + Zeo + 50% Ac; T8 = BRP + Zeo + 25% Ac; T9 = MRP + PILC + 50% Ac.; T10 = MRP + PILC + 25% Ac.; T11 = MRP + Zeo + 50% Ac.; T12 = MRP + Zeo + 25% Ac.; T13 = ARP (Araxá rock phosphate); T14 = BRP (Bayovar rock phosphate); T15 = MRP (Morocco rock phosphate); T16 = TSP (triple superphosphate); T17 = control. PILC = pillared clay; Zeo = zeolite.
Agronomy 10 00918 g006
Table 1. Chemical characteristics of the rock phosphates (RPs) used and total chemical composition by X-ray fluorescence, cation exchange capacity (CEC) and maximum P adsorption capacity (MPAC) of pillared clays and zeolites.
Rock PhosphatePhosphorus (P2O5)
TotalPCA 2% (1:100; w/v)H2O
%
Araxá (ARP)29.95.70.03
Bayovar (BRP)28.914.80.02
Morocco (MRP)30.09.00.08
AdditivesSiO2Al2O3K2OFe2O3MgOTiO2Na2OCECMPAC 3
%mmolc kg−1mg kg−1
Pillared clay35.723.70.26.64.00.50.04676 15527
Zeolite51.314.61.51.93.30.20.91450 231
1 Determined according to the USDA-NRCS [12]; 2 determined according to Farkaš et al. [13]; 3 determined according to Alvarez et al. [14].
Table 2. Characterization for the total P2O5, water soluble, neutral ammonium citrate + water (NAC + H2O) and 2% citric acid (PCA 2%) soluble P of phosphate fertilizers partially acidulated plus the additives pillared clay (PILC) and zeolite (Zeo).
FertilizersTreatmentPhosphorus Level (P2O5)
TotalH2ONAC + H2OPCA 2%
%
ARP + PILC + 50% acidulation120.12.67.65.5
ARP + PILC + 25% acidulation223.31.45.04.7
ARP + Zeo + 50% acidulation320.32.19.25.6
ARP + Zeo + 25% acidulation423.51.45.04.8
BRP + PILC + 50% acidulation521.73.36.98.1
BRP + PILC + 25% acidulation623.61.34.68.4
BRP + Zeo + 50% acidulation721.26.38.011.0
BRP + Zeo + 25% acidulation823.71.73.96.2
MRP + PILC + 50% acidulation921.63.66.48.9
MRP + PILC + 25% acidulation1023.71.13.67.8
MRP + Zeo + 50% acidulation1122.06.16.19.6
MRP + Zeo + 25% acidulation1224.02.23.27.4
ARP = Araxá rock phosphate; BRP = Bayovar rock phosphate; MRP = Morocco rock phosphate.
Table 3. Chemical, physical and mineralogical characteristics of the soil used in diffusion study.
GranulometryCBDOxalateMPAC
ClaySiltSandFedAldFeoxAlox
g kg−1mg kg−1
75378885.130.990.311.39157
pHP resinSH + AlCa2+Mg2+K+BSCECV
CaCl2mg dm−3mmolc dm−3%
5.24142122161.728.740.771
MPAC = maximum phosphorus adsorption capacity; CBD = citrate-bicarbonate-dithionite; Fed and Ald = iron and aluminum, respectively, extracted by the dithionite-citrate-bicarbonate method; Feox and Alox = iron and aluminum, respectively, extracted by the acid ammonium oxalate method; BS = base sum; CEC = cation exchange capacity; V = base saturation.
Table 4. Chemical, physical and mineralogical characteristics of the soil used in the column solubilization study.
GranulometryCBDOxalateMPAC
ClaySiltSandFedAldFeoxAlox
g kg−1mg kg−1
180907309.111.990.271.41295
pHOMP resinAl3+H + AlCa2+Mg2+K+BSCECmV
CaCl2g dm−3mg dm−3mmolc dm−3%
5.13<3<21193<0.912.123.11452
MPAC = maximum P adsorption capacity; CBD = citrate-bicarbonate-dithionite; Fed and Ald = iron and aluminum, respectively, extracted by the dithionite-citrate-bicarbonate method; Feox and Alox = iron and aluminum, respectively, extracted by the acid ammonium oxalate method; OM = organic matter; BS = base sum; CEC = cation exchange capacity; m = aluminum saturation; V = base saturation.
Table 5. Dry matter yield and accumulated P content in shoot and root of maize under phosphate sources partially acidulated with incorporation of pillared clays or zeolites.
TreatmentsDry Matter (g)Accumulated P (mg pot−1)RAE (%)
ShootRootShootRoot
T17.8 d4.5 b3.7 c2.6 c56.9
T24.1 e3.0 c2.1 c1.5 c26.8
T35.8 e5.6 b3.2 c4.5 b40.7
T44.4 e3.7 c2.4 c2.1 c29.3
T511.8 b6.8 a6.4 b3.6 b89.4
T65.7 e4.7 b2.8 c2.3 c39.8
T710.0 c7.0 a4.8 b6.5 a74.8
T85.9 e4.8 b3.2 c2.2 c41.5
T910.2 c7.8 a5.9 b4.8 b76.4
T104.9 e3.7 c2.7 c1.9 c33.3
T1111.3 b7.2 a4.9 b4.2 b85.4
T125.0 e4.1 c2.6 c1.6 c34.1
T130.9 f0.9 d0.5 d0.4 d0.8
T145.3 e3.9 c3.0 c1.8 c36.6
T152.1 f2.1 d1.2 d0.9 d10.6
T1613.1 a5.8 b14.3 a3.9 b100.0
T170.8 f0.6 d0.3 d0.1 d--
Means followed by the same letter in the column do not differ from each other by the Scott–Knott test at 5% probability. RAE = relative agronomic efficiency. T1 = ARP + PILC + 50% Ac.; T2 = ARP + PILC + 25% Ac; T3 = ARP + Zeo + 50% Ac; T4 = ARP + Zeo + 25% Ac.; T5 = BRP + PILC + 50% Ac.; T6 = BRP + PILC + 25% Ac.; T7 = BRP + Zeo + 50% Ac; T8 = BRP + Zeo + 25% Ac; T9 = MRP + PILC + 50% Ac.; T10 = MRP + PILC + 25% Ac.; T11 = MRP + Zeo + 50% Ac.; T12 = MRP + Zeo + 25% Ac.; T13 = ARP (Araxá rock phosphate); T14 = BRP (Bayovar rock phosphate); T15 = MRP (Morocco rock phosphate); T16 = TSP (triple superphosphate); T17 = control. PILC = pillared clay; Zeo = zeolite.

