Article

Characterizing Variation in Nitrogen Use Efficiency in Wheat Genotypes Using Proximal Canopy Sensing for Sustainable Wheat Production

1
Department of Soil Sciences and Water Resources, College of Agriculture, Al-Muthanna University, Al-Muthanna 66001, Al-Samawah, Iraq
2
Department of Agronomy and Horticulture, University of Nebraska-Lincoln, Lincoln, NE 68583, USA
3
Department of Soil and Crop Sciences, Colorado State University, Fort Collins, CO 80523-1170, USA
4
Agriculture and Agri-Food Canada, St-Jean-sur-Richelieu, QC 999040, Canada
*
Author to whom correspondence should be addressed.
Agronomy 2020, 10(6), 773; https://doi.org/10.3390/agronomy10060773
Submission received: 22 April 2020 / Revised: 27 May 2020 / Accepted: 28 May 2020 / Published: 29 May 2020

Abstract

:
Global nitrogen use efficiency (NUE) for cereal production is marginal and is estimated to be about 33%. Remote sensing tools have tremendous potential for improving NUE in crops through efficient nitrogen management as well as the identification of high-NUE genotypes. The objectives of this study were (i) to identify and quantify the variation in NUE across 24 winter wheat genotypes (Triticum aestivum L.) and (ii) to determine if the normalized difference vegetation index (NDVI) could characterize the variability in NUE across wheat genotypes. This study was conducted in 2010 and 2011 in the semi-arid climate of Northeastern Colorado across dryland and irrigated conditions. Our results indicate significant variation in the NUE among genotypes across two irrigation conditions. We observed a strong relationship between the NDVI and NUE—as PFP (partial factor productivity) and PNB (partial nitrogen balance)—across the 24 wheat genotypes under dryland conditions (average R2 for PFP and PNB = 0.84) at Feekes growth stage 11.1, for site year II. However, poor association was observed under irrigated conditions (average R2 for PFP and PNB = 0.29) at Feekes growth stage 3 to 4 for site year II. This study demonstrates the potential and limitations of active canopy sensing to successfully characterize the variability in NUE across wheat genotypes.

1. Introduction

Nitrogen (N) is an essential element for winter wheat (Triticum aestivum L.) growth and development [1,2,3] Global N fertilizer consumption has increased in recent years to meet the ever-growing need for food production [4] Meanwhile, only about 33% of the N fertilizer applied worldwide translates into grain in cereal production [5,6,7,8]; wheat remains the least efficient nitrogen user among major crops [9,10]. The remaining N applied (about 67%) represents a $15.9 billion annual loss [7] to cereal growers through leaching, gaseous release from plants, surface runoff, volatilization, and denitrification. It has been reported that N fertilizer applied to the soil that is not taken up by plants contributes to environmental problems such as the pollution of groundwater [11,12,13,14] and greenhouse gas emissions [5,9,15,16]. It is estimated that a mere 1% increase in crop nitrogen use efficiency (NUE) on a global scale would result in savings of about $234 million [7]. Improving NUE through genotype selection and/or crop management while increasing crop production and reducing environmental impact is a significant challenge for agronomists and plant breeders.
Nitrogen use efficiency is a term that indicates the relationship between the amounts of N fertilizer utilized by the crop against the amount of N fertilizer lost from the soil by various pathways as mentioned above. The NUE is affected by the ability of plants to take up N from the soil and to convert absorbed N into grain [17,18]. A review of literature indicates more than 18 different definitions of and methods of measuring NUE in cereal crops, four of which are most commonly used to calculate NUE (Supplementary Materials: Tables S1 and S2) [19,20,21]. Among the common definitions, NUE is defined as the grain yield produced per unit of N fertilizer applied, which is also referred to as the partial factor productivity (PFP) [20,22]. Likewise, NUE is also defined as the grain nitrogen content divided by the nitrogen fertilizer applied, which is also referred to as the partial nitrogen balance (PNB) [19,20]. In addition, the nitrogen uptake efficiency (UPE) is defined as the total N in aboveground biomass at maturity divided by the N applied, and the nitrogen utilization efficiency (UTE) is defined as the grain divided by the total N in aboveground biomass at maturity, which is considered as the most important component of NUE [23].
There are several NUE values reported in the literature. The NUE values may vary because of a number of factors; however, genetics and the environment are the major ones. Genetic variation in NUE was found across maize (Zea mays L.) and winter wheat genotypes [23,24,25]. Several studies have mentioned UPE as a high contributing factor to the variation observed in NUE under non-limiting N level studies in wheat [3,25,26,27]. Accordingly, Moll et al. [23] found UPE to be the main contributor to variations in NUE across maize genotypes at high N levels, whereas UTE was the main contributor to variations in NUE across maize genotypes at low N levels. By contrast, other authors [1,28] reported that differences in the NUE among durum wheat genotypes were mostly associated with differences in the UTE at non-limiting N levels. The disagreement among studies on UPE or UTE being the main contributor to variation in NUE are most likely related to differences in the groups of genotypes, the soil properties of the study sites and/or the study scales [3].
According to Barraclough et al. [24], there are two main pathways for improving NUE: (a) breeding genotypes with high NUE and (b) better N management. Breeding genotypes with high NUE traits would enable a higher recovery of N from the soil while increasing or maintaining grain yield with reduced N fertilizer application. For enhancing NUE, conventional breeding methods rely heavily on grain yield as a selection trait. However, such an approach requires a considerable amount of labor, effort and time [29]. Destructive sampling in the conventional breeding method requires plant biomass measurement at different crop growth stages, which is feasible only when a small number of samples or plots are involved [30]. Plant breeders release several new genotypes every year to improve yield and other desirable traits, which warrants more scientific studies to understand and characterize the NUE of these novel genotypes in various crop production conditions.
Remote sensing has become an important tool for measuring variability in crop canopies [31,32]. Many studies have reported the Normalized Difference Vegetation Index (NDVI) as a useful tool to collect information from crop canopies for predicting yield [33], photosynthetic efficiency [34], green biomass [35] and leaf area index [36]. Active remote sensing sensors such as Greenseeker® measure the NDVI using the light reflected from the crop canopy, and it can detect variability in biomass and N in crop canopies without the need for destructive sampling [37,38,39].
A recent publication [40] reported that the early assessment of wheat grain production using a field-based NDVI is possible at early growth stages (r = 0.89) for the purposes of plant breeding and precision nitrogen fertilization. Kefauver et al. [41] reported the use of vegetation indices to assess NUE in Barley, and they were able to explain up to 83% of the total variability in NUE using a combination of UAV and field-based measurements. Marti et al. [42] found the NDVI to be well correlated to the yield and wheat biomass at the milk-grain stage (stage 11 of the Feekes scale) [43]. Ma et al. [44] reported that the NDVI can differentiate genotypes with high and low yields. Raun et al. [35] reported a positive relationship (R2 > 0.50) between the in-season NDVI-estimated yield and measured grain yield in wheat. Likewise, Inman et al. [45] observed a positive relationship (R2 = 0.65) between the NDVI and grain yield in maize. The NUE was improved by more than 15% by using an active remote sensing (Greenseeker®)-based NDVI to better manage inputs for the wheat crop, suggesting the NDVI as a potential screening index for NUE [46,47]. Likewise, Araus et al. [48] showed that a spectral vegetation index such as the NDVI is a promising tool to screen genotypes. However, a review of literature indicates that only a few studies have been conducted in major crops [49,50,51,52,53] to assess the potential of inexpensive canopy sensing to characterize NUE. As crops respond differently to various factors of crop production such as the soil, the climate, the crop genotype, irrigation, and agronomic practices, more site-specific studies are required to fully understand the potential of proximal canopy sensors for the low-cost characterization of NUE across wheat genotypes.
The hypothesis of this study was that the NDVI measured by active sensors could identify and differentiate variation in NUE across wheat genotypes in a semi-arid climate and under two irrigation conditions. The specific objectives of this study were (i) to identify and quantify the variation in NUE across wheat genotypes and (ii) to determine if the NDVI could characterize the variability in NUE across wheat genotypes.

2. Materials and Methods

2.1. Study Sites

This study was conducted in Northeastern Colorado over two winter wheat growing seasons, 2009–2010 and 2010–2011, referred to as site years I and II, respectively, for the remainder of the manuscript. The study site was located at the USDA-ARS Limited Irrigation Research Farm, near Greeley, Colorado (latitude 40° 26′58.87″ N and longitude −104° 38′22.56″ W). Both site years were under drip irrigation, and the soils were mapped as Otera sandy loam (coarse–loamy, mixed superactive, calcareous, mesic Aridic Ustorthents) soil series with zero to three percent slope [54]. The soils were deep, well-drained and formed by eolian deposits and mixed outwash parent material and included loam and clay loam underlying material. In site year I (2009–2010), the total precipitation received during the crop-growing season from 1 October 2009 to 31 July 2010 was 292.9 mm. For site year II (2010–2011), the total precipitation received from 1 October 2010 to 31 July 2011 was 209.3 mm [55]. The total precipitation received during the two site years was higher than the ten year average precipitation of 170.6 mm for the same time periods. The previous crop was dry (pinto) beans (Phaseolus vulgaris L.) under dryland and irrigated conditions for both years.

2.2. Experimental Procedure

A global positioning system unit was used to map the field boundaries and to geo-reference the soil samples (Trimble Ag 114 GPS antennae with differential correction, CA, USA). The soil samples were collected using a systematic unaligned grid sampling design for the entire study area in both site years. Thirty soil samples were collected at two depths, 0–20 cm and 20–61 cm, at 15 locations within the 0.2 hectare study area (i.e., a sampling density of 72 samples per hectare). Several soil cores were collected and composited from each location. The soil samples were dried and sent to a commercial laboratory (Ag Source Harris Lab., Lincoln, NE) for chemical and physical soil property analysis. Particle size was determined by using the hydrometer method [56]. Soil pH was measured using a 1:1 ratio of water to soil slurry [57]. Organic matter (OM) was determined using the loss on ignition method [58]. Soil NO3-N was measured using the cadmium reduction method [59]. A summary of the soil properties for both sampling depths across the two site years is presented in Table 1.
This study was part of a large ongoing multi-disciplinary project. The experimental design for the large multi-disciplinary project was a split plot design. The site years and irrigation methods (dryland and irrigated conditions) were analyzed separately. Twenty-four winter wheat genotypes were planted under both irrigated and dryland conditions. The genotypes, listed alphabetically, were as follows:
AboveAnkorArlinAvalancheBacaBill Brown
Bond CLCO940610DanbyGoodstreakHatcherJagalene
JaggerKeotaNuDakotaPlattePrairie RedProwers 99
RipperRonLSandySnowmassTAM 112Yuma
The dimensions of the individual experimental plots were 3.7 m × 1.4 m, with six plant rows and a spacing of 22.8 cm between each row. Site years I and II were planted on 11 October 2009 and 8 October 2010, respectively, at the same rate of 197,600 seeds ha−1. Nitrogen and phosphorus fertilizers were applied prior to planting (as recommended by the Colorado State University (CSU) Guidelines [60]) on 29 September 2009 and 7 October 2010 under dryland and irrigated conditions for site year I and II, respectively. Nitrogen dry fertilizer was applied at rates of 84 and 112 kg N ha−1 as urea (46-0-0), and phosphorous dry fertilizer was applied at rates of 56 and 44.8 kg P2O5 ha−1 as mono-ammonium phosphate (11-52-0), for site year I and II, respectively. Additionally, liquid ammonium phosphate was applied at rate of 46.8 L ha−1 (10-34-0) with wheat seed as a starter. Plots were irrigated using the method prescribed by the Colorado State University Extension [61] to match the total daily evapotranspiration.
Crop biomass samples were collected five times during the growing season at various crop growth stages referred to as early spring, jointing, anthesis, mid grain filling and maturity. The early spring stage corresponds to Feekes growth stage 3 to 4 (Zadoks scale 26–29), and the jointing stage corresponds to the Feekes growth stage 6 (Zadoks scale 30–39). The anthesis stage corresponds to the Feekes growth stage 10.5 (Zadoks scale 60–69); the mid grain filling stage corresponds to the Feekes growth stage 11.1 (Zadoks scale 70–77), and the maturity stage corresponds to the Feekes growth stage 11.4 (Zadoks scale 89–92) [43]. The crop biomass samples consisted of 0.5 m row lengths acquired from each plot. Harvest biomass samples were determined with a 1 m row length and were taken from the middle of the experimental plot. Initially, we took a conservative approach of collecting 0.5 m crop row length for crop biomass. At the time of final harvest, enough rows were left, thus we collected full 1 meter rows to reduce sampling error. The biomass samples were pulled up, bagged and transferred to a cooler and stored at 4 °C until processed. The plant roots were removed, and the aboveground parts were placed into an oven to dry at about 68 °C until they reached a constant weight. Approximately ten to fifty plants were used per plot, and then the total aboveground biomass samples weighed, ground and analyzed to measure the total N in the crop tissue. The variation in the number of plants per sample across plots was due to taking a fixed length of row (0.5 m for all biomass samplings except at maturity when a 1 m length of row was sampled) as opposed to a fixed number of plants. The plots were harvested by a plot combine on 28 June on dryland and 6 July on irrigated conditions for site year I. For site year II, the plots were harvested on 28 June on dryland and 7 July on irrigated conditions to measure the grain yield, and the protein percentage in the grains (measured using a near-infrared method for protein content in whole-grain wheat) was corrected to 12% moisture.

2.3. Nitrogen Use Efficiency (NUE)

All the nitrogen use efficiency indices in this study are apparent measures of NUE. The PFP and PNB were used to assess NUE. The PFP was calculated as kg of grain per kg of N supplied [20,22]. The PNB was calculated as kg of grain N content per kg of N supplied [19,20]. Nitrogen use efficiency and related parameters are explained in Table 2 [18,20].

2.4. Canopy Sensing

Active remote sensing-based NDVI measurements were acquired using a Greenseeker® Model 505 handheld optical sensor (NTech Industries Inc., Ukiah, California, USA). The Greenseeker® sensor is referred to as a “red sensor”, and it measures the light reflected from the plant canopy to calculate the NDVI. The NDVI is calculated as:
NDVI = NIR Red NIR + Red
where Red is the reflectance in the red band (wavelengths 600 to 720 nm) and NIR is the reflectance in the near-infrared band (wavelengths 720–1300 nm) [39].
The field-of-view of the sensor is about 61 cm by 1.5 cm [62]. In-field reflectance measurements were collected by holding the Greenseeker® unit at about 90 cm above the crop canopy and walking in the center of each wheat plot. Each plot was scanned for approximately two to five seconds, collecting 20 to 50 NDVI readings. A constant height of 90 cm above the canopy was maintained at all crop growth stages. The reflectance measurements were acquired weekly between 10:00 a.m. and 2:00 p.m. on cloud-free days. Readings were collected from the early spring wheat growth stage (29 March 2010) to after the mid grain filling stage (21 June 2010) for site year I, and from 21 March 2011 to 27 June 2011 for site year II (Figure 1).

2.5. Statistical Analysis

All statistical analysis was performed in the statistical software R [63]. The difference between the two irrigation conditions across site years was assessed using ANOVA. The UPE and UTE were considered as the two main factors contributing to PFP. Similarly, the biomass production efficiency (BPE), UPE, and ratio of grain N content to aboveground biomass weight (GN/BW) were considered as the three main factors contributing to PNB [25]. The contribution to NUE of each parameter was determined by the method of Moll et al. [23].
If log PFP = Y1, log PNB = Y2, log UPE = X1, log UTE = X2, log BPE = X3, and log GN/BW = X4, then
Y1 = X1 + X2
Y2 = X1 + X3 + X4.
The proportion of the sum of squares for Yj to the related parameter (Xi) is:
C o v ( x i y j ) / S y j 2 = r x i y j × S x i / S y j
where C o v ( x i y j ) is the covariance between Yj and Xi, S y j 2 is the variance of Yj, r x i y j is the correlation coefficient between Yj and Xi, and S x i and S y j are the standard deviations of Xi and Yj, respectively.
The linear association between the NDVI and either UPE, UTE, BPE or GN/BW was determined by using Pearson’s product-moment correlation coefficient (r). Similarly, the correlation was determined between PFP or PNB and UPE, UTE, BPE and GN/BW. In addition, a power function was used to model the relationship between PFP and PNB and the NDVI:
y = A x B ,
where y is the PFP or PNB, A and B are the model parameters and x is the NDVI value. The coefficient of determination (R2) was used to explain the proportion of variability in the PFP or PNB explained by the variation in the NDVI.

3. Results

3.1. NUE across Wheat Genotypes

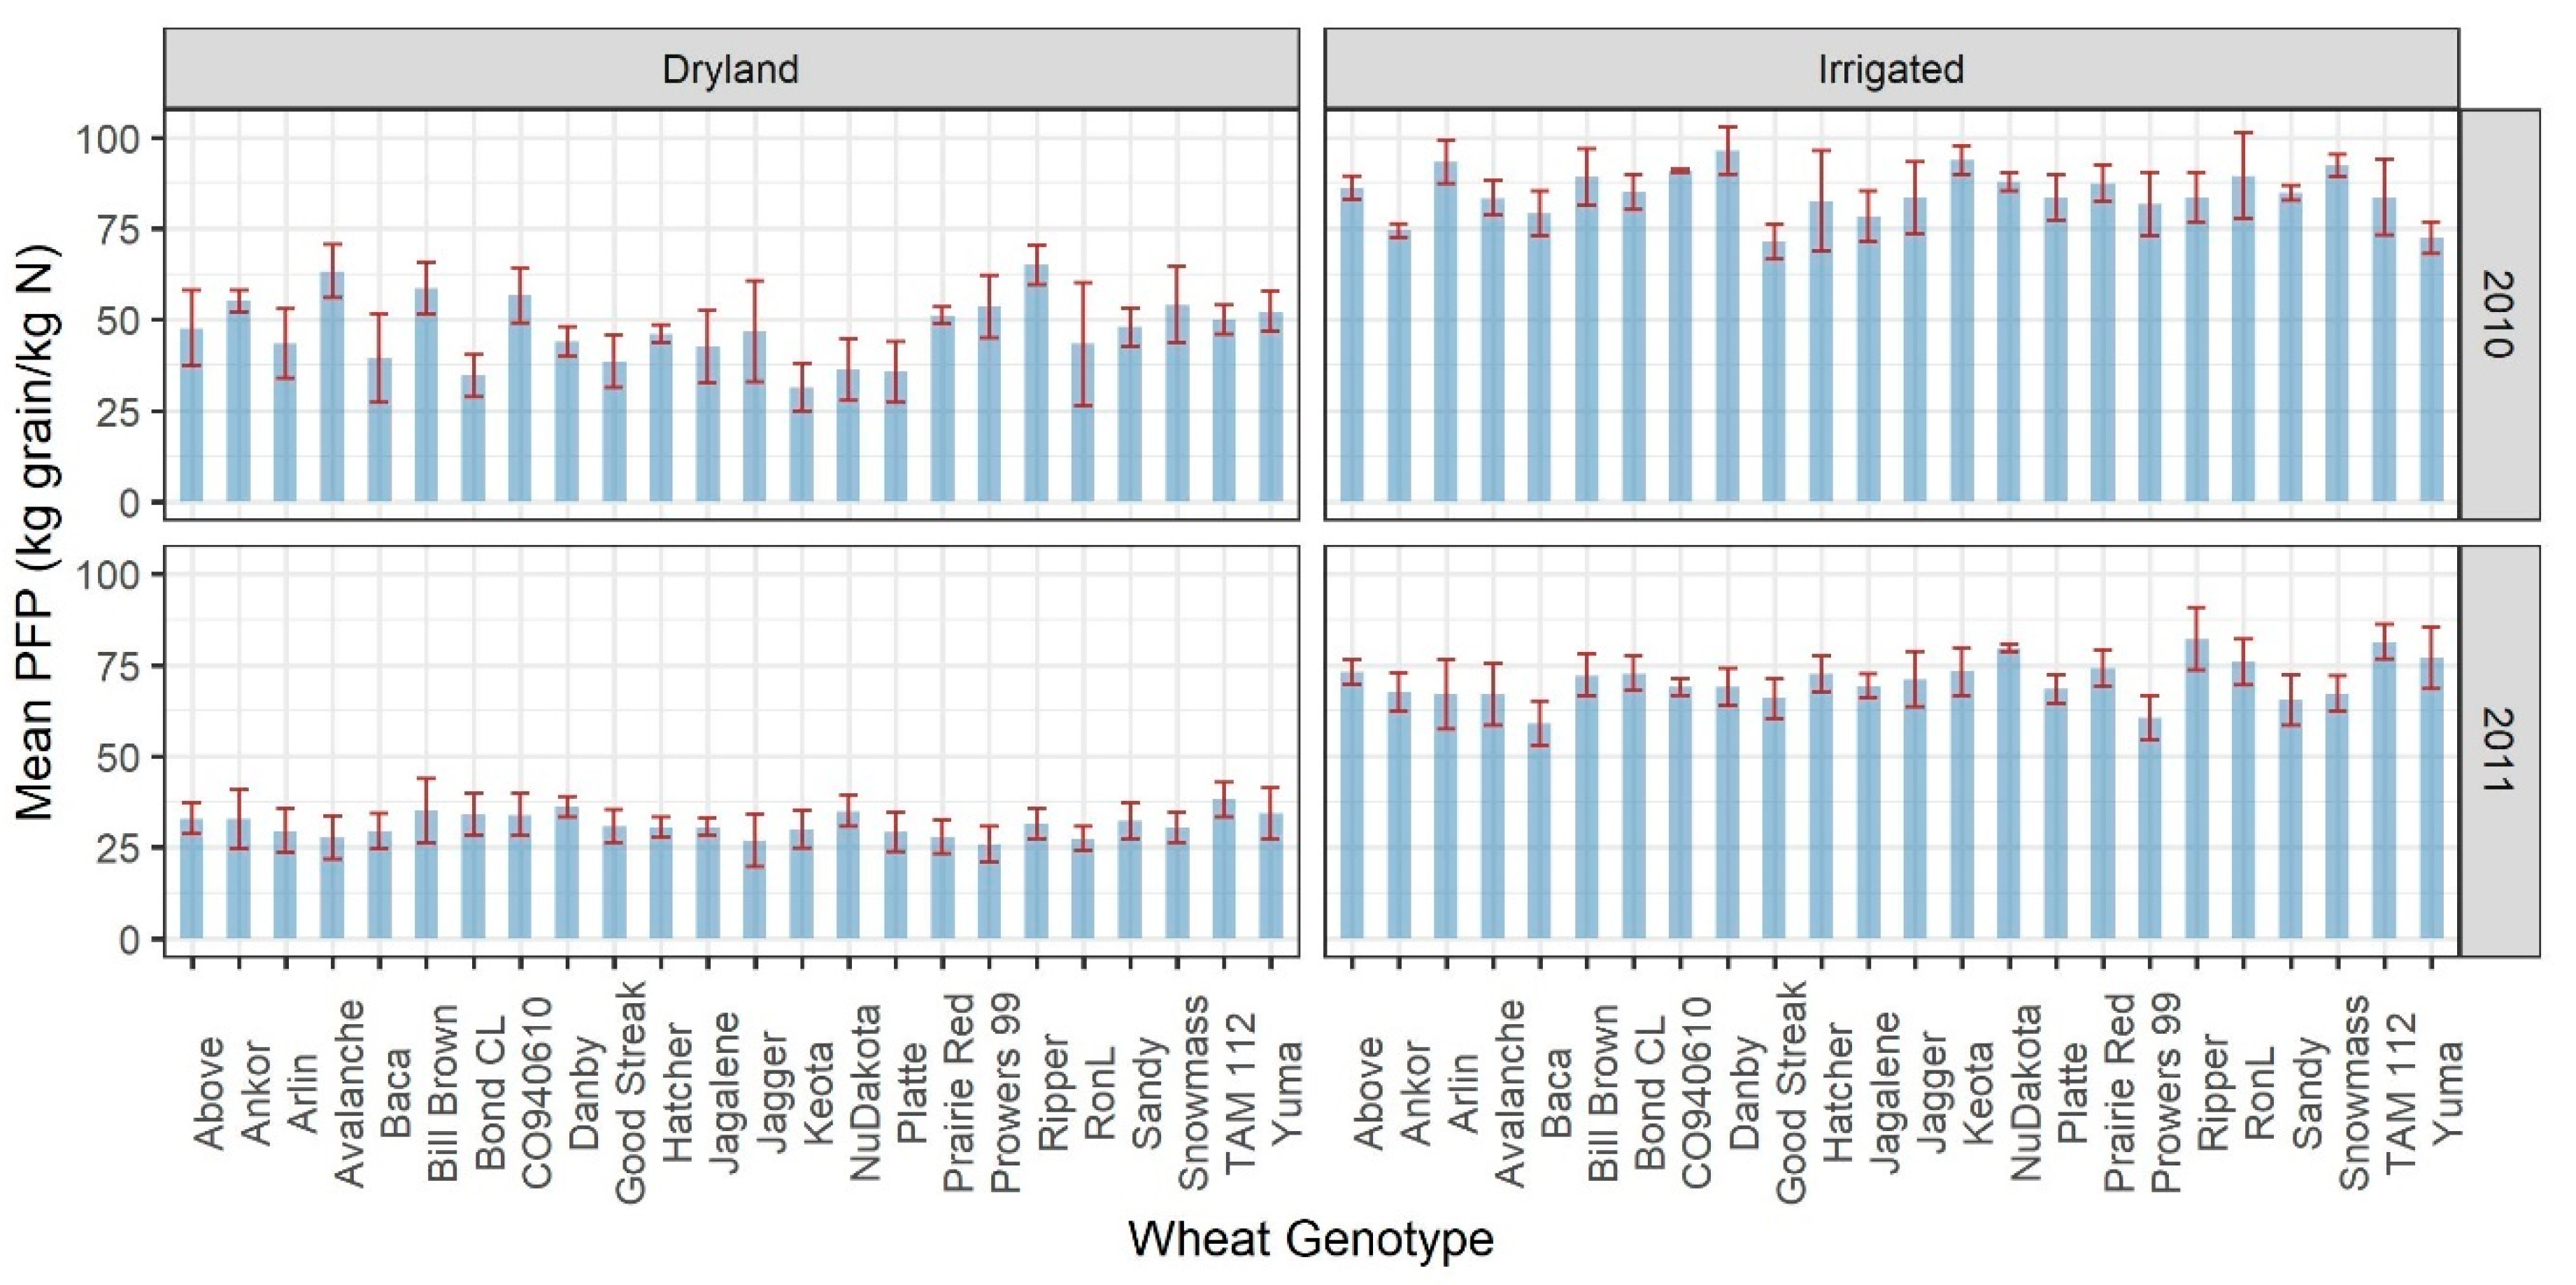
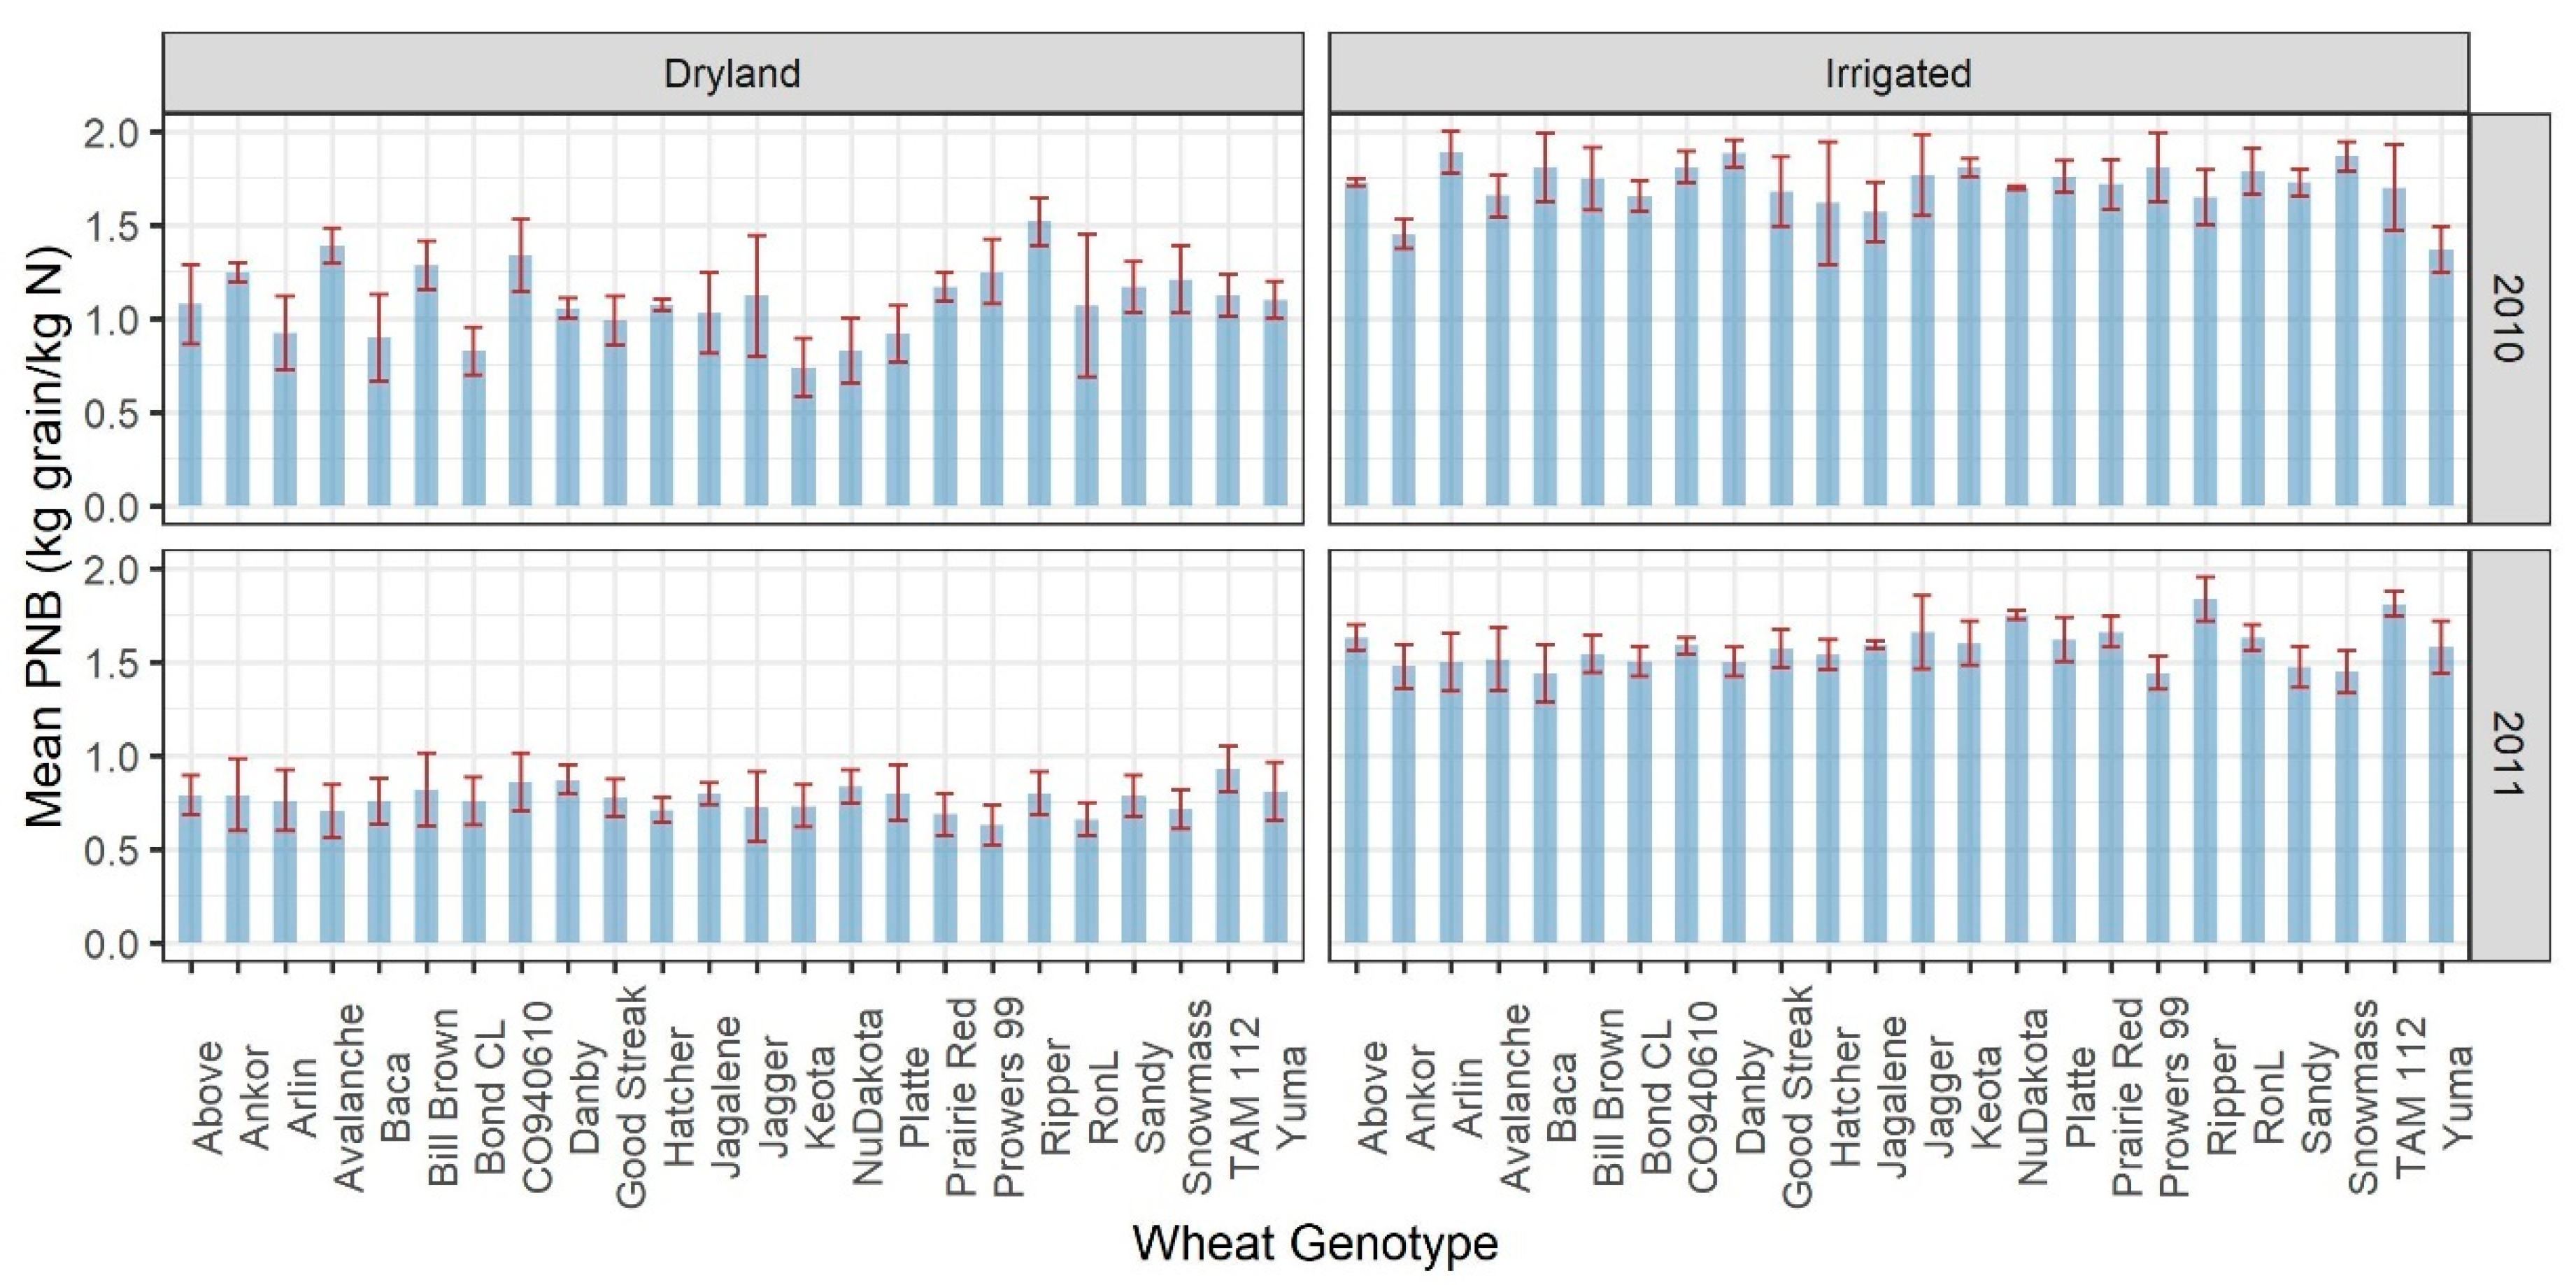
A summary of the NUE observed under two irrigation conditions across 24 wheat genotypes in this study is presented in Figure 2 and Figure 3. Under dryland conditions, the mean PFP ranged from 31.41 to 65.03 kg of grain yield per kg of N supplied (Figure 2) and the mean PNB ranged from 0.76 to 1.55 kg of grain N content per kg of N supplied (Figure 3). Under irrigated conditions, the mean PFP ranged from 71.27 to 96.38 kg of grain yield per kg of N supplied (Figure 2) and the mean PNB ranged from 1.41 to 1.94 kg of grain N content per kg of N supplied (Figure 3), at site year I. For site year II, under dryland conditions, the mean PFP ranged from 25.79 to 38.09 kg of grain yield per kg of N supplied (Figure 2) and the mean PNB ranged from 0.65 to 0.95 kg of grain N content per kg of N supplied (Figure 3). Under irrigated conditions, the mean PFP ranged from 59.06 to 82.24 kg of grain yield per kg of N supplied (Figure 2) and the mean PNB ranged from 1.47 to 1.89 kg of grain N content per kg N supplied (Figure 3).

3.2. Variation in NUE across Wheat Genotypes

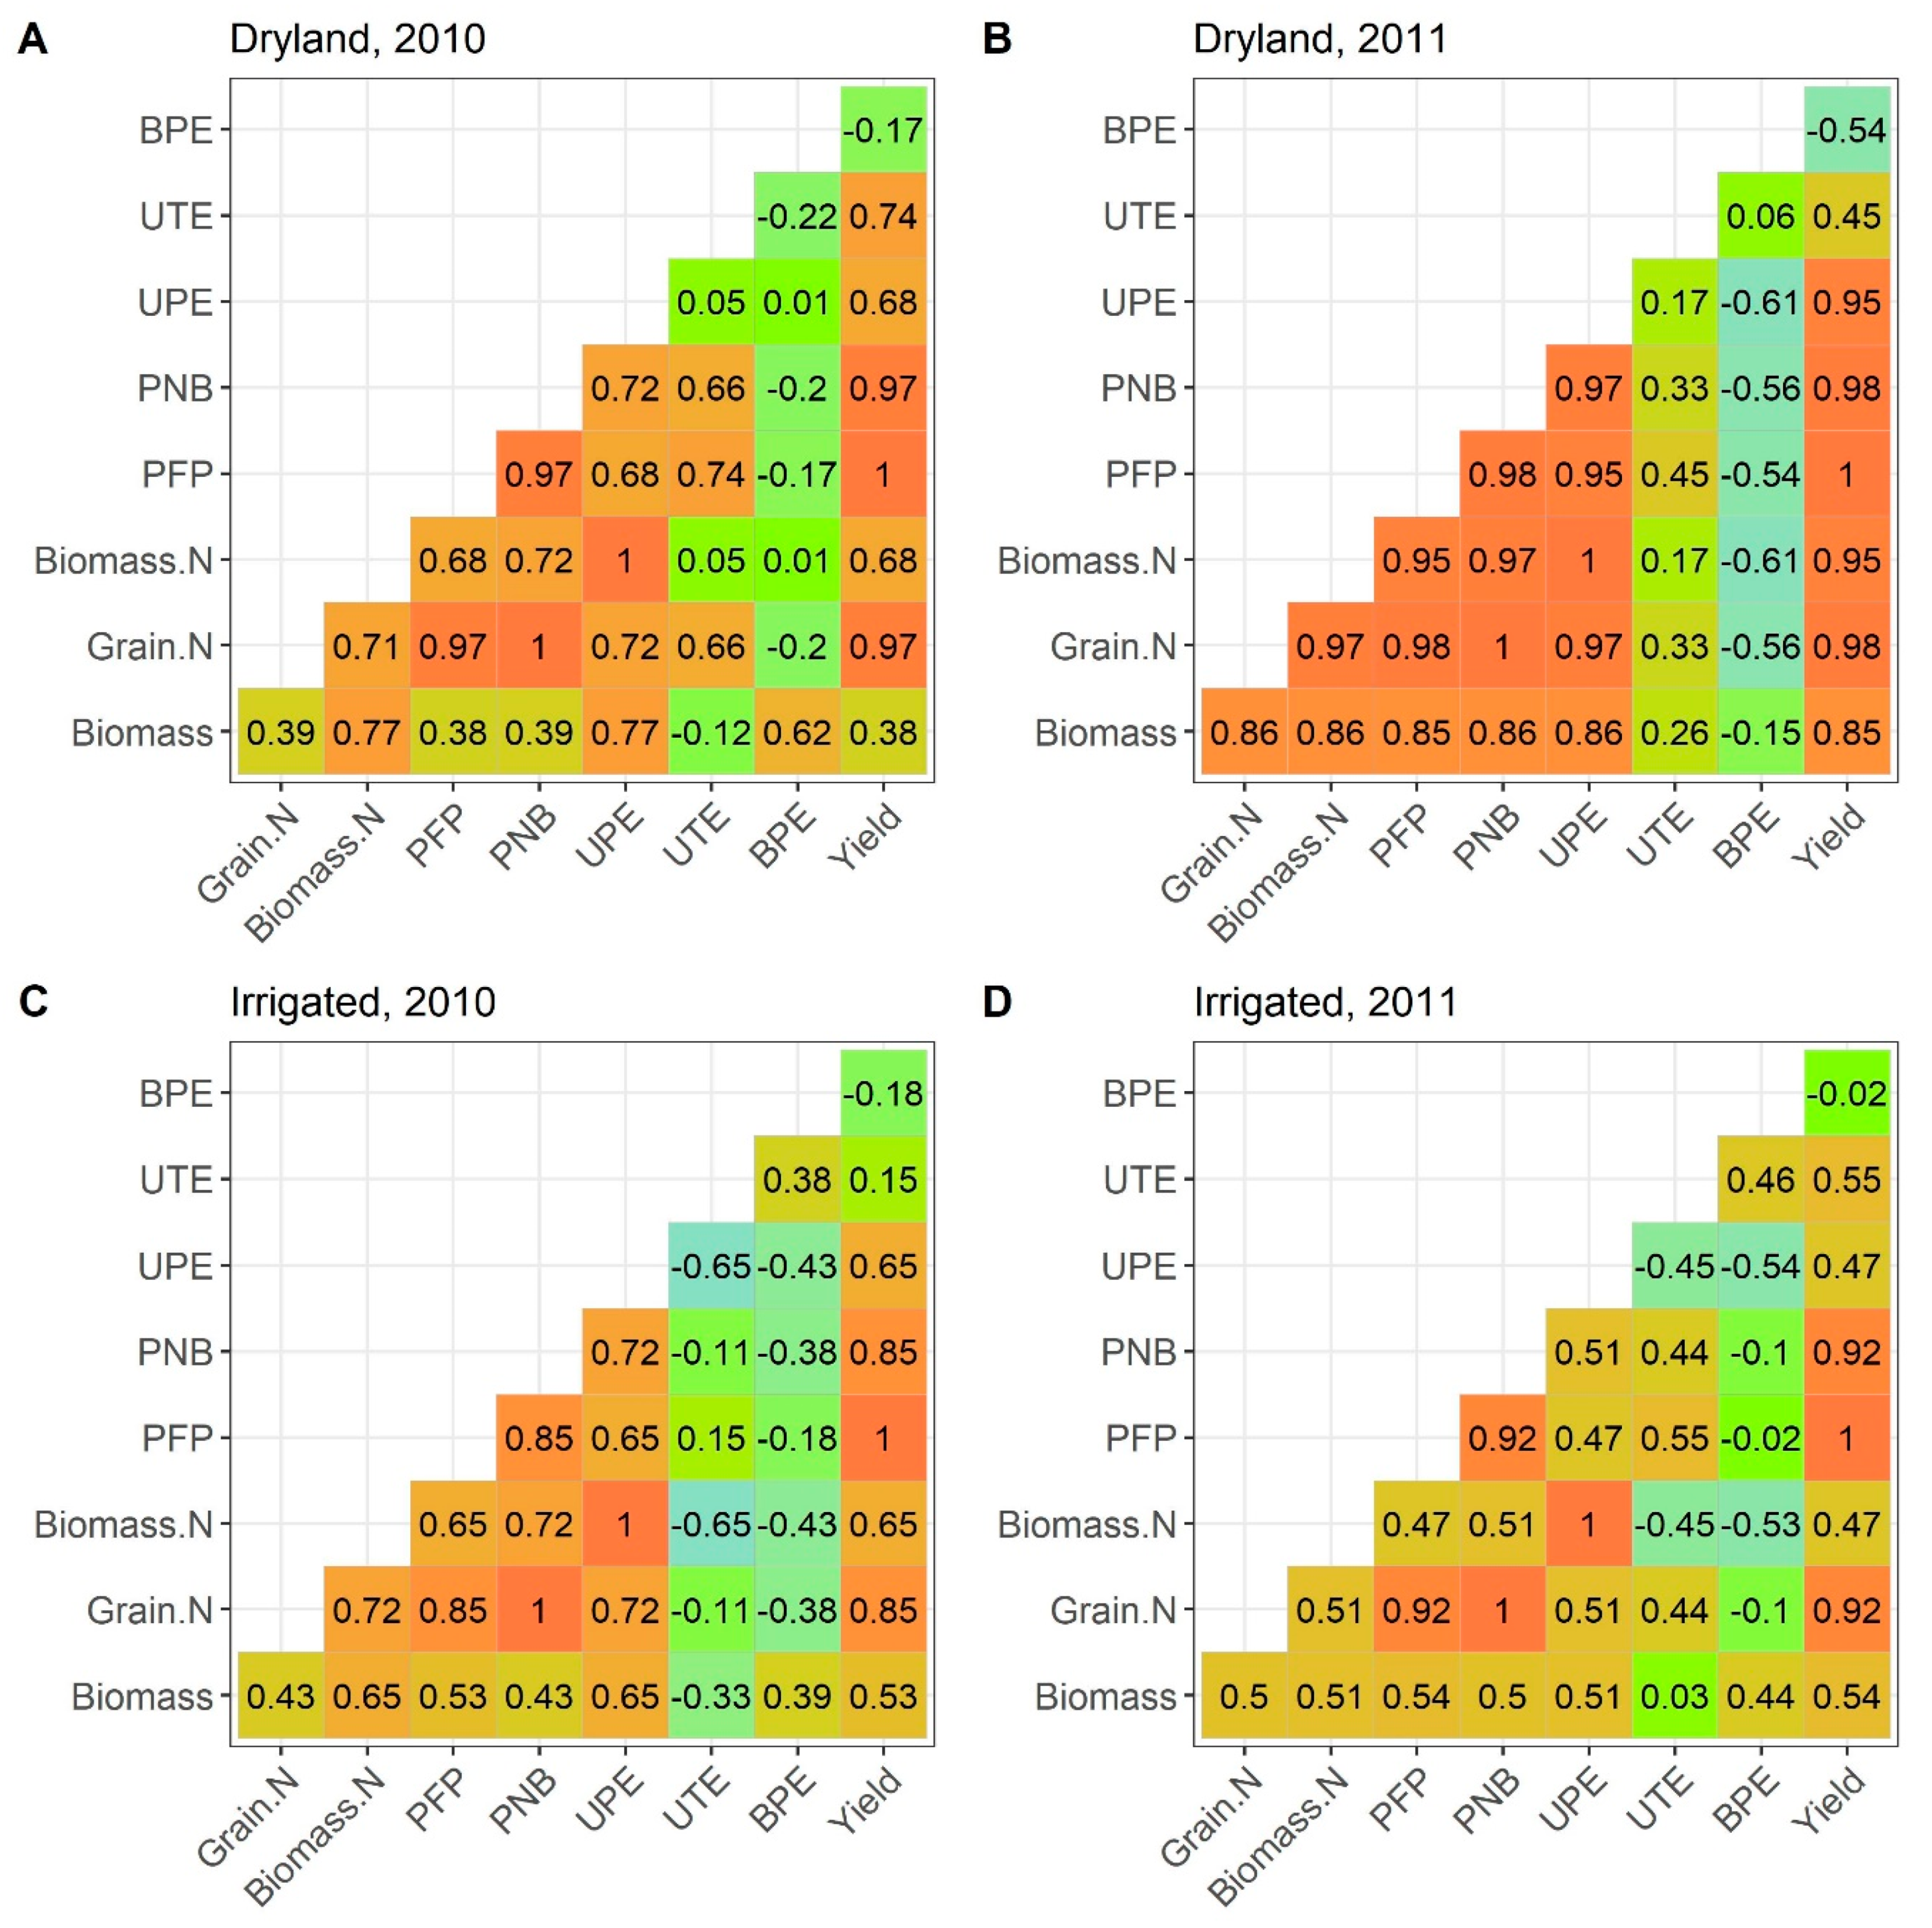
We observed a strong correlation between PFP and PNB in both irrigation conditions across site years. The correlation coefficients (r) between PFB and PNB under dryland conditions were 0.97 and 0.98 (Figure 4a,b) for site year I and site year II, respectively. Similarly, for irrigated conditions, the correlation coefficients were 0.85 and 0.92 (Figure 4c,d) for site year I and site year II, respectively.
When considering the contributions of the different NUE parameters (UTE, UPE, BPE and GN/BW), we observed different patterns between site year I and site year II and between irrigated and dryland conditions (Table 3). Our results show that UPE was the dominant factor in site year I under irrigated conditions, whereas in site year II, it was the dominant factor under dryland conditions (Table 3). Soil moisture (i.e., precipitation and irrigation) effects alone cannot explain this pattern because both patterns (i.e., UPE dominant and UPE in the same proportion as the other parameters) were observed under irrigated conditions. Similarly, the N rate effect alone cannot explain these patterns since each site year had different N rates but show both types of pattern. We observed a negative contribution of the biomass production efficiency (BPE) to the variation in PNB (Table 3). This observation was related to the negative correlation between BPE and PNB in both site years and under dryland and irrigated conditions. When there was a strong negative correlation between BPE and PNB, it translated into a negative contribution of the BPE to the variation in the PNB. The negative correlation was thus related to the intensity of the correlation between the different components of the BPE calculation. In the PNB calculation, kg of grain N is the numerator and kg of N supplied is the denominator (constant), while in BPE, kg of above ground biomass is the numerator and kg of total N in aboveground biomass at maturity is the denominator (see Table 2). We have observed that when there was a strong positive correlation between kg N in grain and kg of total N in aboveground biomass at maturity. Moreover, we observed a weaker positive correlation between aboveground biomass and total N in aboveground biomass at maturity, which translated into a stronger negative BPE contribution to PNB. Conversely, when both previously mentioned correlations were of the same intensity, this translated into a weaker negative contribution of BPE to the variation in PNB.

3.3. Characterization of NUE Variability across Wheat Genotypes Using NDVI

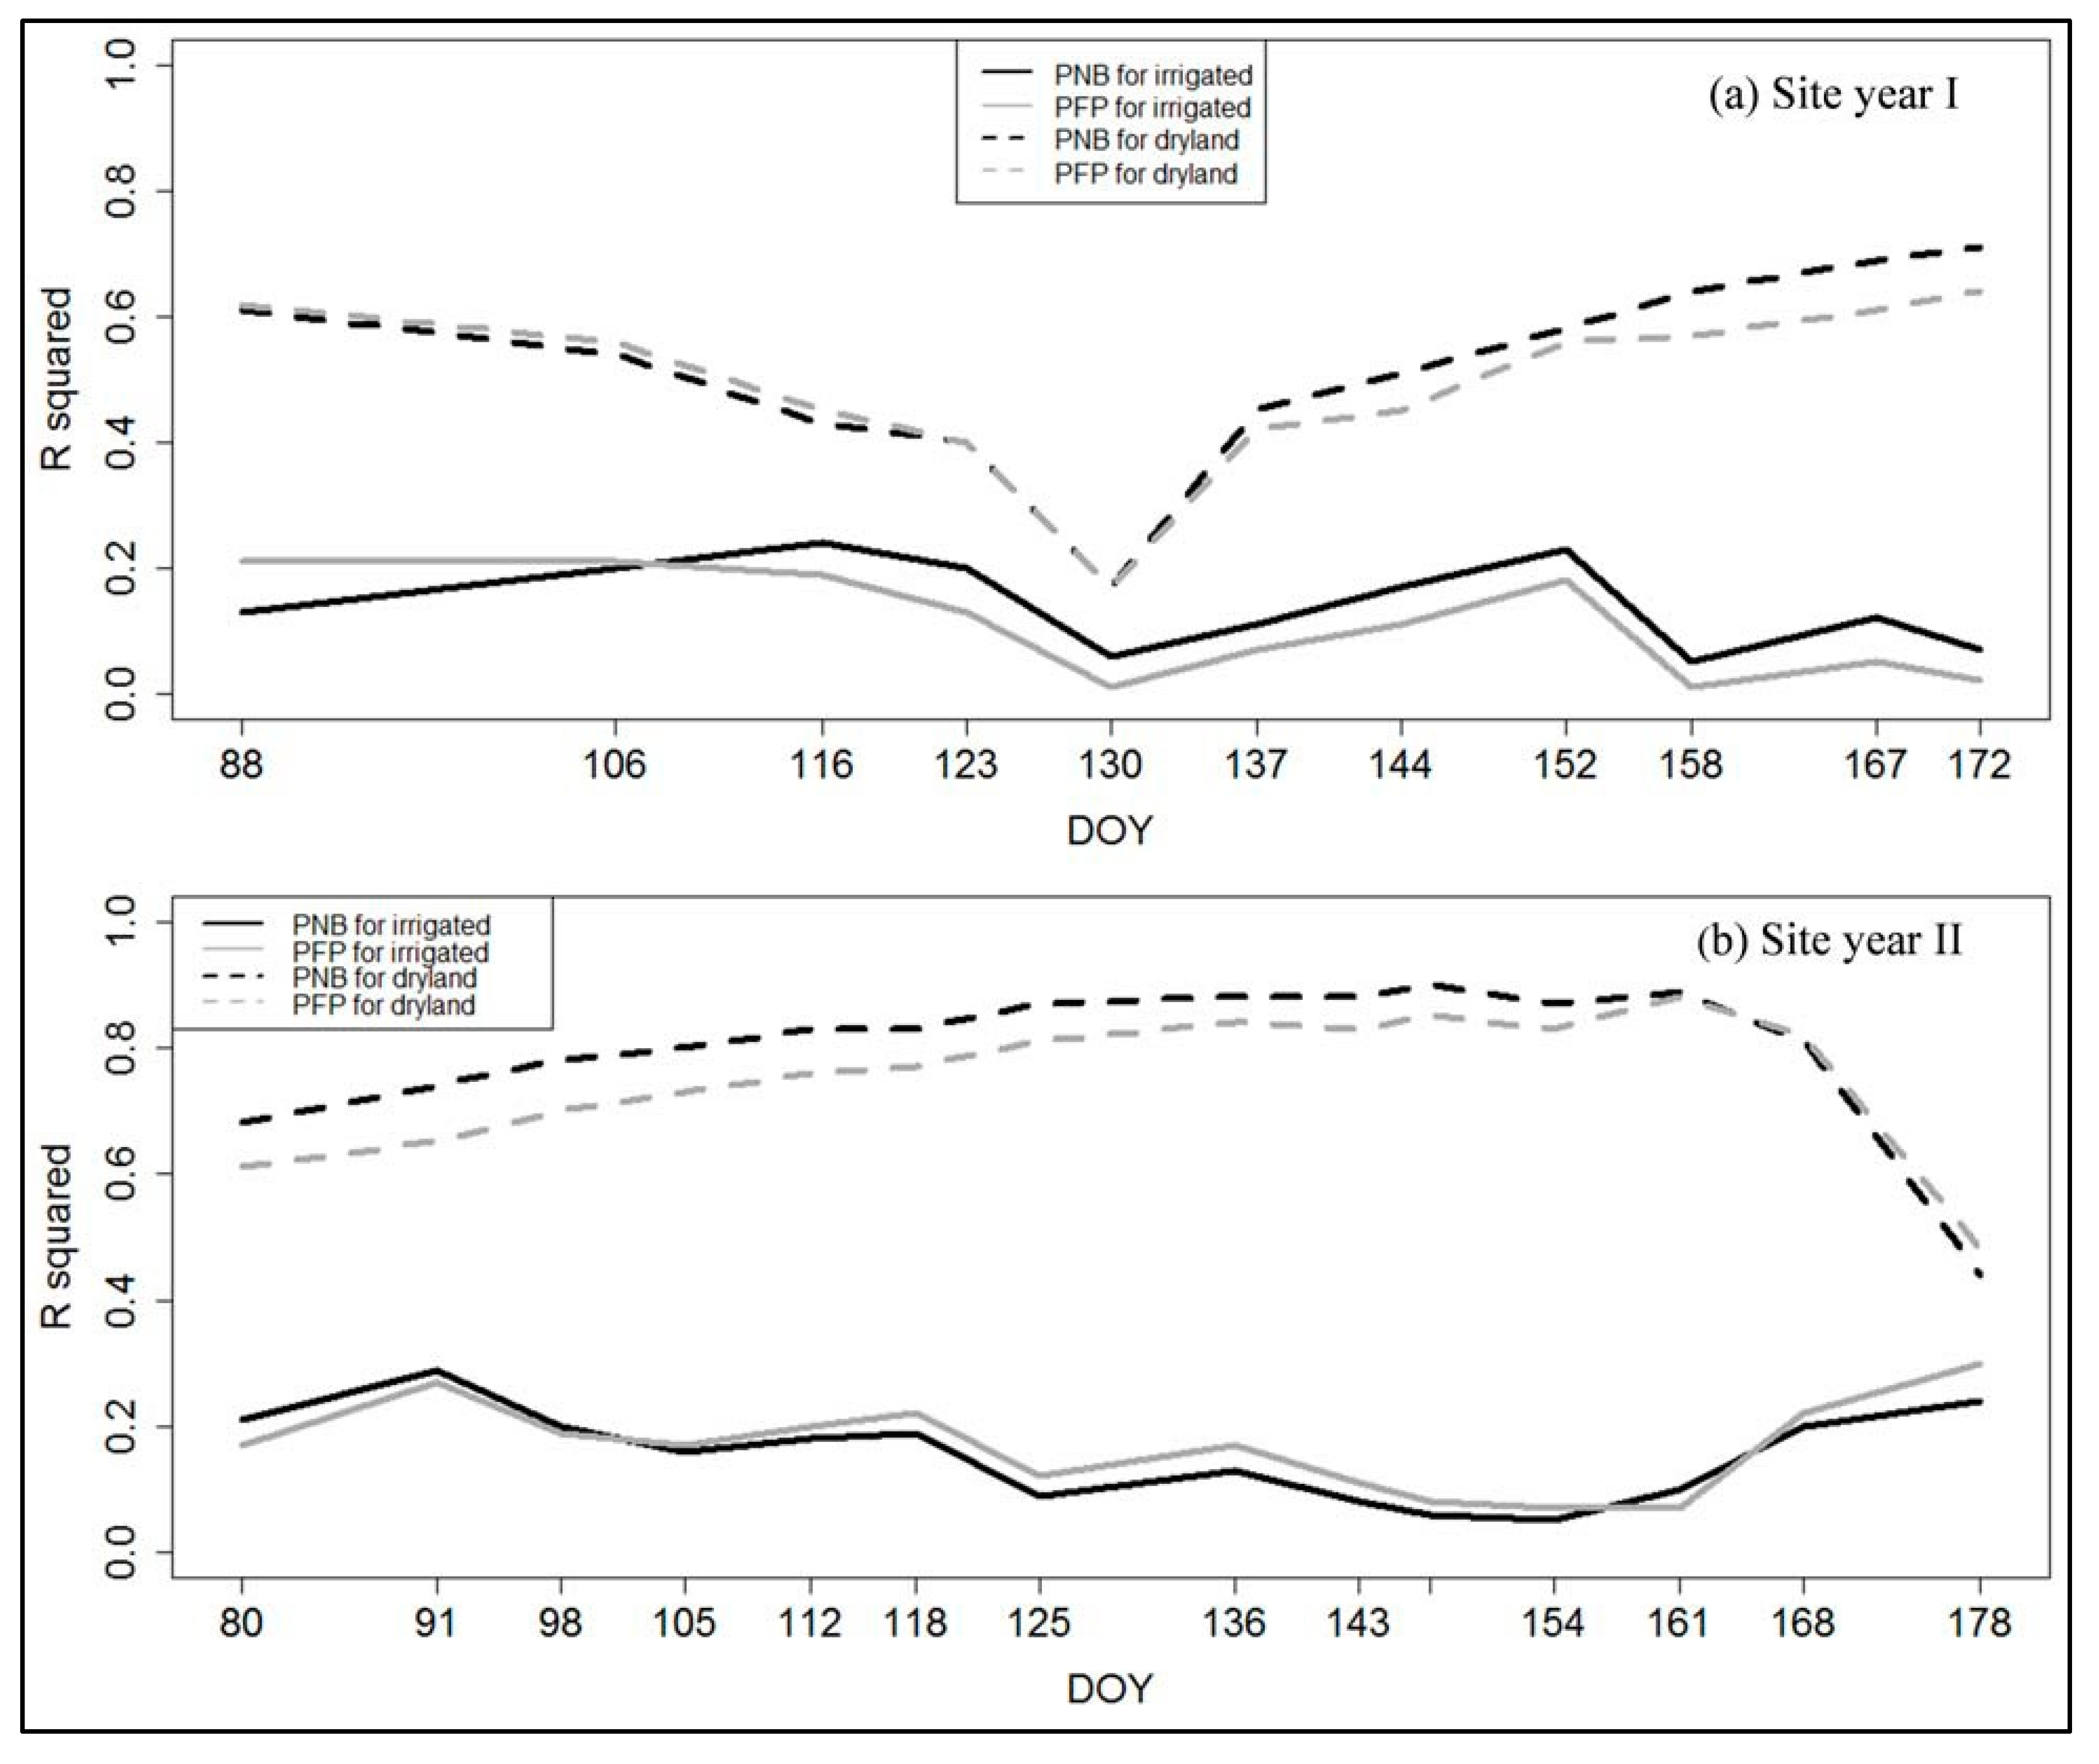
The time series plot of the coefficient of determination (R2 of the regression between the NDVI and PFP or PNB) with the day of the year (DOY) is shown in Figure 5. The time series plot of R2 for the PFP to NDVI regression and the time series plot of R2 for the PNB to NDVI regression nearly overlapped for both site years and conditions. This is consistent with the high correlation between PFP and PNB mentioned above (Section 3.2., Figure 4), and it indicates that the NDVI performed equally well in estimating PFP (based on kg of grain) and PNB (based on kg N in grain). For site year I, the highest R2 between the NDVI and NUE as PFP and PNB was observed at the mid grain filling stage, which corresponds to the Feekes growth stage 11.1 (Zadoks scale 70–77), while the lowest R2 was observed at the jointing stage, which corresponds to the Feekes growth stage 6 (Zadoks scale 30–39), under dryland conditions. For irrigated conditions, the highest R2 between the NDVI and NUE as PFP and PNB was observed at the early spring stage, which corresponds to Feekes growth stage 3 to 4 (Zadoks scale 26–29), while the lowest R2 was observed at the jointing stage, which corresponds to the Feekes growth stage 6.
For site year II, the highest R2 between the NDVI and NUE as PFP and PNB, was observed at the mid grain filling stage, which corresponds to the Feekes growth stage 11.1, while the lowest R2 was observed at the maturity stage, which corresponds to the Feekes growth stage 11.4 (Zadoks scale 89–92), under dryland conditions. For irrigated conditions, the highest R2 between the NDVI and NUE as PFP and PNB was observed at the early spring stage, which corresponds to Feekes growth stage 3 to 4, while the lowest R2 was observed at the mid grain filling stage, which corresponds to the Feekes growth stage 11.1, under irrigated conditions.

4. Discussion

4.1. NUE across Wheat Genotypes

Water is a limiting factor in wheat production, and in dryland conditions, the N fertilizer supplied to the plants was perhaps less efficiently taken up and/or utilized, resulting in lower NUE, which is in accordance with McMaster et al. [64]. However, in irrigated conditions, much higher NUE was observed, which might be attributed to a lack of moisture stress, allowing the plants to take up nitrogen more efficiently. This could have affected both the PFP and PNB, which are calculated based on N fertilizer supplied. Likewise, the PFP and PNB in site year I were significantly higher (p < 0.05) than the PFP and PNB in site year II. This can be attributed to higher rainfall and a lower N rate (i.e., 28 kg ha−1 less) in site year I. This is in agreement with Gauer et al. [65], who observed a negative relationship between the N supplied and NUE and a positive relationship between the moisture supplied and NUE, which is consistent with our findings.

4.2. Variation in NUE across Wheat Genotypes

The results showed strong correlation coefficients (r) between PFP and PNB in both irrigation conditions across site years. Van Sanford and MacKown [25] also reported that PFP was highly correlated with PNB in 25 winter wheat genotypes.
Our results thus indicate that when conditions were less conducive, the genotypes with a higher N uptake capacity achieved a higher NUE. However, when the conditions were more conducive, UPE was important in the same proportion as either UTE (for PFP) or GN/BW (for PNB) for achieving a higher NUE. These observations are consistent with the results of Dhugga and Waines and Tong et al. [26,66], who attributed the relative importance of UPE in explaining NUE variations to an increasing N rate. Our results show that N rate does not seem to be the major factor influencing the importance of UPE for the variations in NUE. Few studies have reported effects other than the N rate to explain the importance of UPE for the variations in NUE. Baresel et al. [67] observed a strong effect of the environment (location and year) on the importance of UPE for the variations in NUE. It is thus possible that even though factors such as temperature, diseases, weeds or soil fertility were not systematically monitored in this study, they could have impacted the relative importance of UPE in explaining NUE. This may explain divergent results such as the ones from Ortiz-Monasterio et al. [28], who reported that NUE was explained in large proportion by UPE at low N levels and by UTE at high N levels in wheat.
A positive correlation between kg N in grain and kg of total N in aboveground biomass was observed by Neales et al. and Cox et al. [68,69] for both low and high N rates. Additionally, a strong positive correlation between kg of aboveground biomass and kg of total N in aboveground biomass was observed by Jensen et al. [70]. In regard to the later reported correlations, this would translate into a weak BPE contribution to PNB.
In general, the correlations between NUE and parameters related to NUE (i.e., UPE, UTE, BPE and GN/BW) were proportional to their respective contributions to the variation in PFP or PNB, as shown in Table 3. This can be explained by the correlation observed between these parameters, which is part of the calculation in the method of Moll (Equation (4); Moll et al. [23]). For instance, strong significant correlation coefficients were observed between UPE and PFP; 0.75 and 0.96 for site years I and II, respectively, under dryland conditions and 0.68 and 0.50 for site years I and II, respectively, under irrigated conditions. Additionally, a high negative correlation was observed between BPE and PNB; −0.16 and −0.55 for site years I and II, respectively, under dryland conditions and −0.37 and −0.08 for site years I and II, respectively, under irrigated conditions. The same pattern was observed for the other parameters related to NUE (i.e., UTE and GN/BW). Thus, the results from the correlation were reflected in the contribution of the NUE-related parameters to the PFP or PNB variation (Table 3).

4.3. Characterization of NUE Variability across Wheat Genotypes Using NDVI

A lower coefficient of determination (R2) was observed in mid-season under dryland conditions for site year I and under irrigated conditions for both site years, possibly related to saturation in the NDVI (Figure 5). Excessive green biomass induces NDVI saturation, lowering the power of the NDVI to discern biomass variations, which might be attributed to a lower R2. The saturation of the NDVI happens when there is enough chlorophyll in the field of view of the sensor to absorb almost all (about 97%) of the red light [34,71]. The irrigated conditions produced larger amounts of biomass and thus more chlorophyll content, which led to NDVI saturation early in the season and a low R2 for both years. Additionally, the lower R2 was possibly related to differences in the crop growth conditions and the timing, rate and distribution of precipitation during the growing season [40]. In this context, a higher R2 would be expected in the earlier growth stages, before crop canopy closure. However, early growth stages corresponded to the period of the season when the variability in the NDVI was the lowest, and thus, genotypes did not show distinct variations in canopy under irrigated conditions. This is consistent with the high variability of the NDVI observed in dryland conditions as compared to the variability in the NDVI observed in irrigated conditions. More details on NDVI variability are available in Naser et al. [40]. Because of the lower variability in the NDVI, the model predicting PFP and PNB based on NDVI values showed better performance in dryland than in irrigated conditions. The low R2 in the mid-season under dryland conditions in site year I was potentially related to a large precipitation event (61.21 mm of rain over eight days from DOY 112 to DOY 120), which produced more biomass and more chlorophyll content in the absence of moisture stress symptoms. These conditions could have potentially led to NDVI saturation in the same way they did for irrigated conditions. After the precipitation event, moisture stress symptoms returned, which explains the higher R2 values after DOY 130. These observations confirm the potential of the NDVI to detect wheat genotypes with higher NUE in dryland conditions. In irrigated (or in geographic locations with sufficient precipitation) conditions and in above-average-rainfall-for-dryland conditions, the potential of the NDVI measured with the Greenseeker® sensor to detect wheat genotypes with higher NUE is limited due to the saturation of the NDVI index. In these situations, vegetation should be scanned at early and late growth stages, when the NDVI does not saturate.
Our results show that the NDVI measured by active sensors such as the Greenseeker® sensor can identify and differentiate variation in NUE across wheat genotypes. We found a high correlation between the NDVI and NUE (PFP and PNB) under dryland conditions. One of the main outcomes of this study is determining the importance of UPE in achieving higher NUE for wheat when environmental conditions are less conducive to yield, and it is less important when the environmental conditions are more conducive to yield. This information could be used to improve overall NUE via the precision nutrient management of a field showing spatial variability in yield potential. For example, with the recent advent of split planters (i.e., planters allowing the switch from one variety to another on-the-go), a farmer could decide to plant genotypes with high UPE traits in low productivity zones while planting genotypes with more balanced UPE to UTE ratio traits in the high productivity zones of the field. This is still conceptual because the environmental factors influencing the relative importance of UPE in explaining the NUE were not identified in this study. The second main outcome of this study is the determination of the limitations of the NDVI index associated with saturation for the prediction of wheat NUE. Our results have shown that the NDVI is a good index for the prediction of NUE in sparse canopies but not necessarily in dense crop canopies. Based on these results, plant breeders would benefit by using the NDVI measured from active crop canopy sensors to predict NUE in dryland conditions, but care should be taken to avoid mid-season (the between jointing stage corresponds to the Feekes growth stage 6, and the anthesis stage corresponds to the Feekes growth stage 10.5) dense canopy closure, which is driven by big rain events. We believe that NDVI measurements are not suited for irrigated conditions because high soil moisture reduces the variance among genotypes early in the season, thus reducing the discriminative power of the NDVI. Irrigated conditions also generate a dense closed canopy early in the season, as compared to growth in dryland conditions, inducing NDVI saturation and, again, reducing the discriminative power of the NDVI.

5. Conclusions

Nitrogen uptake efficiency was identified as a major source of variation among genotypes for high nitrogen use efficiency in site-years with lower yield. When overall yield was higher, the nitrogen uptake efficiency was as important as the nitrogen utilization efficiency (for partial factor productivity) or as the ratio of grain N content to aboveground biomass weight (for partial nitrogen balance). The results of this study partially supported our hypothesis that the NDVI measured by active sensors can identify and differentiate variations in nitrogen use efficiency across wheat genotypes. A strong relationship between the NDVI and nitrogen use efficiency across the 24 wheat genotypes under dryland conditions was observed. Our results suggest and recommend measuring the NDVI at the early spring stage, which corresponds to Feekes growth stage 3 to 4, or at the mid grain filling stage, which corresponds to the Feekes growth stage 11.1, under dryland conditions, as a surrogate for NUE. The results also suggest that because of saturation, the NDVI could not accurately predict nitrogen use efficiency under irrigated conditions. More research is needed on hardware (different wavebands) as well as on software (prediction model adapted to any growth stage) to improve the accuracy and versatility of the NDVI as a tool to predict wheat nitrogen use efficiency. The results from this study could have significant implications for improving nitrogen use efficiency in both irrigated and dryland conditions for sustainable wheat production.
Further research is required in order to further improve the relationship between the NDVI and NUE under different environmental conditions to overcome the limitations of NDVI saturation. For instance, the NDVI index used in this study was based on the red band (at 656 nm), which corresponds to the lowest reflectance values (about 3% of incident light) in the visible spectrum [35]. This induces saturation as soon as the sensor detects dense healthy crop canopy. It is possible that if the NDVI was based on wavebands before or after the red band, it could be more sensitive to variations in a healthy crop canopy. Hence, it is possible that an index based on another waveband (e.g., red edge around 700 nm) could potentially result in higher correlations than what we have observed in irrigated conditions. Another interesting possibility for the improvement of the NDVI’s use for NUE prediction would be to vary the parameters of the power model (i.e., the values for A and B from Equation (5)) over time (Feeks growth stages). This would provide the best model parameters to convert the NDVI into NUE at any growth stage and thus increase the versatility and accuracy of this tool.

Supplementary Materials

The following are available online at https://www.mdpi.com/2073-4395/10/6/773/s1, Table S1: Four common definitions and methods of calculating Nitrogen Use Efficiency (NUE) [19,20], Table S2: One-way ANOVA for PFP and PNB for site year 2010 and 2011 across two irrigation conditions (dryland and irrigated).

Author Contributions

R.K. was the first author´s advisor, designed the study, provided supervision for research, and input for the paper. L.L. was responsible to design the study, provide training, and outline the methodology, statistical analysis, and laboratory analyses. M.A.N. performed statistical analyses and wrote the paper. S.D. contributed by reviewing, editing, analysis reviewing, and additions to the text. All authors have read and agreed to the published version of the manuscript.

Funding

This project was partly funded by the Agricultural Experimental Station of Colorado State University, Colorado Wheat Administrative Committee, and Colorado Wheat Research Foundation and from USDA Agricultural Research Service.

Acknowledgments

The authors would like to thank the Agricultural Experimental Station of Colorado State University, Colorado Wheat Administrative Committee, Colorado Wheat Research Foundation and from USDA Agricultural Research Service, and Department of Soil and Crop Sciences for providing funded and supported this project.

Conflicts of Interest

The authors declare no conflicts of interest. The funding sponsors had no role in the design of the study, in the collection, analyses, or interpretation of data, in the writing of the manuscript, and in the decision to publish the results.

References

  1. Giambalvo, D.; Ruisi, P.; Di Miceli, G.; Frenda, A.S.; Amato, G. Nitrogen use efficiency and nitrogen fertilizer recovery of durum wheat genotypes as affected by interspecific competition. Agron. J. 2010, 102, 707–715. [Google Scholar] [CrossRef] [Green Version]
  2. Lofton, J.; Weindorf, D.; Haggard, B.; Tubana, B. Nitrogen Variability: A Need for Precision Agriculture. Agric. J. 2010, 5, 6–11. [Google Scholar] [CrossRef] [Green Version]
  3. Wang, R.; An, D.; Hu, C.; Li, L.; Zhang, Y.; Jia, Y.; Tong, Y. Relationship between nitrogen uptake and use efficiency of winter wheat grown in the North China Plain. Crop Pasture Sci. 2011, 62, 504–514. [Google Scholar] [CrossRef]
  4. Snyder, C.S. Nutrient use efficiency: Global challenges, trends, and future. In Proceedings of the Symposium “Nutrient Use Efficiency” presented by the International Plant Nutrition Institute (IPNI) at the XVIII Latin American Congress of Soil Science, San Jose, Costa Rica, 16–20 November 2009. [Google Scholar]
  5. Carlson, K.M.; Gerber, J.S.; Mueller, N.D.; Herrero, M.; MacDonald, G.K.; Brauman, K.A.; Havlik, P.; O’Connell, C.S.; Johnson, J.A.; Saatchi, S.; et al. Greenhouse gas emissions intensity of global croplands. Nat. Clim. Chang. 2016, 7, 63–68. [Google Scholar] [CrossRef]
  6. Hawkesford, M.J.; Griffiths, S. Exploiting genetic variation in nitrogen use efficiency for cereal crop improvement. Curr. Opin. Plant Biol. 2019, 49, 35–42. [Google Scholar] [CrossRef]
  7. Raun, W.R.; Johnson, G.V. Improving nitrogen use efficiency for cereal production. Agron. J. 1999, 91, 357–363. [Google Scholar] [CrossRef] [Green Version]
  8. Gupta, M.L.; Khosla, R. Precision nitrogen management and global nitrogen use efficiency. In Proceedings of the 11th International Conference on Precision Agriculture, Indianapolis, IN, USA, 15–18 July 2012. [Google Scholar]
  9. Cui, Z.L.; Zhang, H.Y.; Chen, X.P.; Zhang, C.C.; Ma, W.Q.; Huang, C.D.; Zhang, W.F.; Mi, G.H.; Miao, Y.X.; Li, X.L.; et al. Pursuing sustainable productivity with millions of smallholder farmers. Nature 2018, 555, 363–366. [Google Scholar] [CrossRef]
  10. Zorb, C.; Ludewig, U.; Hawkesford, M.J. Perspective on Wheat Yield and Quality with Reduced Nitrogen Supply. Trends Plant Sci. 2018, 23, 1029–1037. [Google Scholar] [CrossRef] [Green Version]
  11. Delgado, J.; Khosla, R.; Westfall, D.G.; Bausch, W.; Inman, D. Nitrogen Fertilizer Management Based on Site-Specific Management Zones Reduces Potential for NO3-N Leaching. J. Soil Water 2005, 60, 402–410. [Google Scholar]
  12. Huang, J.; Xu, C.C.; Ridoutt, B.G.; Wang, X.C.; Ren, P.A. Nitrogen and phosphorus losses and eutrophication potential associated with fertilizer application to cropland in China. J. Clean. Prod. 2017, 159, 171–179. [Google Scholar] [CrossRef]
  13. Smith, L.E.D.; Siciliano, G. A comprehensive review of constraints to improved management of fertilizers in China and mitigation of diffuse water pollution from agriculture. Agric. Ecosyst. Environ. 2015, 209, 15–25. [Google Scholar] [CrossRef] [Green Version]
  14. Sun, M.; Huo, Z.L.; Zheng, Y.X.; Dai, X.Q.; Feng, S.Y.; Mao, X.M. Quantifying long-term responses of crop yield and nitrate leaching in an intensive farmland using agro-eco-environmental model. Sci. Total Environ. 2018, 613, 1003–1012. [Google Scholar] [CrossRef]
  15. Goglio, R.; Smith, W.N.; Grant, B.B.; Desjardins, R.L.; Gao, X.; Hanis, K.; Tenuta, M.; Campbell, C.A.; McConkey, B.G.; Nemecek, T.; et al. A comparison of methods to quantify greenhouse gas emissions of cropping systems in LCA. J. Clean. Prod. 2018, 172, 4010–4017. [Google Scholar] [CrossRef] [Green Version]
  16. Liu, X.; Zhang, Y.; Han, W.; Tang, A.; Shen, J.; Cui, Z.; Fangmeier, A. Enhanced nitrogen deposition over China. Nature 2013, 494, 459–462. [Google Scholar] [CrossRef]
  17. Baligar, V.; Fageria, N.; He, Z. Nutrient use efficiency in plants. Commun. Soil Sci. Plant Anal. 2001, 32, 921–950. [Google Scholar] [CrossRef]
  18. Nelson, N.O.; Haverkamp, B.; Fritz, A.K. Variation in nitrogen use efficiency of winter wheat varieties. In Proceedings of the Great Plains Soil Fertility Conference Proceedings, Denver, CO, USA, 10–11 May 2012; pp. 187–192. [Google Scholar]
  19. Hawkesford, M.J. The diversity of nitrogen use efficiency for wheat varieties and the potential for crop improvement. Better Crops Plant Food 2012, 96, 10–12. [Google Scholar]
  20. Snyder, C.; Bruulsema, T. Nutrient use efficiency and effectiveness in North America: Indices of agronomic and environmental benefit. Int. Plant Nutrition Inst. 2007, 07076. [Google Scholar]
  21. Cao, Q.; Miao, Y.; Feng, G.; Gao, X.; Liu, B.; Liu, Y.; Lie, F.; Khosla, R.; Mulla, D.J.; Zhang, F. Improving nitrogen use efficiency with minimal environmental risks using an active canopy sensor in a wheat-maize cropping system. Field Crops Res. 2017, 214, 365–372. [Google Scholar] [CrossRef]
  22. Nielsen, R. N loss mechanism and nitrogen use efficiency. In Purdue Nitrogen Management Workshops; Purdue University West Lafayette: West Lafayette, IN, USA, 2006; pp. 1–5. [Google Scholar]
  23. Moll, R.; Kamprath, E.; Jackson, W. Analysis and interpretation of factors which contribute to efficiency of nitrogen utilization. Agron. J. 1982, 74, 562–564. [Google Scholar] [CrossRef]
  24. Barraclough, P.B.; Howarth, J.R.; Jones, J.; Lopez-Bellido, R.; Parmar, S.; Shepherd, C.E.; Hawkesford, M.J. Nitrogen efficiency of wheat: Genotypic and environmental variation and prospects for improvement. Eur. J. Agron. 2010, 33, 1–11. [Google Scholar] [CrossRef]
  25. Van Sanford, D.A.; MacKown, C.T. Variation in nitrogen use efficiency among soft red winter wheat genotypes. Theor. Appl. Genet. 1986, 72, 158–163. [Google Scholar] [CrossRef]
  26. Dhugga, K.S.; Waines, J.G. Analysis of nitrogen accumulation and use in bread and durum wheat. Crop Sci. 1989, 29, 1232–1239. [Google Scholar] [CrossRef]
  27. Guttieri, M.J.; Frels, K.; Regassa, T.; Waters, B.M.; Baenziger, S. Variation for nitrogen use efficiency traits in current and historical great plains hard winter wheat. Euphytica 2017, 213, 87. [Google Scholar] [CrossRef] [Green Version]
  28. Ortiz-Monasterio, R.; Sayre, K.D.; Rajaram, S.; McMahon, M. Genetic progress in wheat yield and nitrogen use efficiency under four nitrogen rates. Crop Sci. 1997, 37, 898–904. [Google Scholar] [CrossRef]
  29. Loss, S.P.; Siddique, K. Morphological and physiological traits associated with wheat yield increases in Mediterranean environments. Adv. Agron. 1994, 52, 229–276. [Google Scholar]
  30. Regan, K.; Siddique, K.; Turner, N.; Whan, B. Potential for increasing early vigour and total biomass in spring wheat, 2. Characteristics associated with early vigour. Aust. J. Agric. Res. 1992, 43, 541–553. [Google Scholar] [CrossRef]
  31. Xia, T.; Miao, Y.; Wu, D.; Shao, H.; Khosla, R.; Mi, G. Active Optical Sensing of Spring Maize for In-Season Diagnosis of Nitrogen Status Based on Nitrogen Nutrition Index. Remote Sens. 2016, 8, 605. [Google Scholar] [CrossRef] [Green Version]
  32. Yao, Y.; Miao, Y.; Cao, Q.; Wang, H.; Gnyp, M.L.; Bareth, G.; Khosla, R.; Yang, W.; Liu, F.; Liu, C. In-season estimation of rice nitrogen status with an active crop canopy sensor. IEEE J. Sel. Topics Appl. Earth Observ. Remote Sens. 2014, 7, 4403–4413. [Google Scholar] [CrossRef]
  33. Cordero, E.; Longchamps, L.; Khosla, R.; Sacco, D. Spatial management strategies for nitrogen in maize production based on soil and crop data. Sci. Total Environ. 2019, 697. [Google Scholar] [CrossRef]
  34. Aparicio, N.; Villegas, D.; Araus, J.; Casadesús, J.; Royo, C. Relationship between growth traits and spectral vegetation indices in durum wheat. Crop Sci. 2002, 42, 1547–1555. [Google Scholar] [CrossRef]
  35. Raun, W.R.; Solie, J.B.; Johnson, G.V.; Stone, M.L.; Lukina, E.V.; Thomason, W.E.; Schepers, J.S. In-season prediction of potential grain yield in winter wheat using canopy reflectance. Agron. J. 2001, 93, 131–138. [Google Scholar] [CrossRef] [Green Version]
  36. Aparicio, N.; Villegas, D.; Casadesús, J.; Araus, J.L.; Royo, C. Spectral vegetation indices as nondestructive tools for determining durum wheat yield. Agron. J. 2000, 92, 83–91. [Google Scholar] [CrossRef]
  37. Elliott, G.; Regan, K. Use of reflectance measurements to estimate early cereal biomass production on sandplain soils [barley; wheat]. Aust. J. Exp. Agric. 1993, 33, 179–183. [Google Scholar] [CrossRef]
  38. Goodwin, A.W.; Lindsey, L.E.; Harrison, S.K.; Paul, P.A. Estimating Wheat Yield with Normalized Difference Vegetation Index and Fractional Green Canopy Cover. Crop Forage Turf. Man. 2018, 4. [Google Scholar] [CrossRef] [Green Version]
  39. Inman, D.; Khosla, R.; Mayfield, T. On-the-go active remote sensing for efficient crop nitrogen management. Sensor Rev. 2005, 25, 209–214. [Google Scholar] [CrossRef]
  40. Naser, M.A.; Khosla, R.; Longchamps, L.; Dahal, S. Using NDVI to Differentiate Wheat Genotypes Productivity Under Dryland and Irrigated Conditions. Remote Sens. 2020, 12, 824. [Google Scholar] [CrossRef] [Green Version]
  41. Kefauver, S.C.; Vicente, R.; Vergara-Diaz, O.; Fernandez-Gallego, J.A.; Kerfal, S.; Lopez, A.; Melichar, J.P.E.; Molins, M.D.S.; Araus, J.L. Comparative UAV and Field Phenotyping to Assess Yield and Nitrogen Use Efficiency in Hybrid and Conventional Barle. Front. Plant Sci. 2017, 8. [Google Scholar] [CrossRef]
  42. Marti, J.; Bort, J.; Slafer, G.; Araus, J. Can wheat yield be assessed by early measurements of Normalized Difference Vegetation Index? Ann. Appl. Biol. 2007, 150, 253–257. [Google Scholar] [CrossRef]
  43. Large, E.C. Growth stages in cereals illustration of the Feekes scale. Plant Pathol. 1954, 3, 128–129. [Google Scholar] [CrossRef]
  44. Ma, B.; Dwyer, L.M.; Costa, C.; Cober, E.R.; Morrison, M.J. Early prediction of soybean yield from canopy reflectance measurements. Agron. J. 2001, 93, 1227–1234. [Google Scholar] [CrossRef] [Green Version]
  45. Inman, D.; Khosla, R.; Reich, R.; Westfall, D. Active remote sensing and grain yield in irrigated maize. Precis. Agric. 2007, 8, 241–252. [Google Scholar] [CrossRef]
  46. Raun, W.R.; Solie, J.B.; Johnson, G.V.; Stone, M.L.; Mullen, R.W.; Freeman, K.W.; Thomason, W.E.; Lukina, E.V. Improving nitrogen use efficiency in cereal grain production with optical sensing and variable rate application. Agron. J. 2002, 94, 815–820. [Google Scholar]
  47. Reynolds, M.P.; Skovmand, B.; Trethowan, R.; Singh, R.P.; van Ginkel, M. Research Highlights of the CIMMYT Wheat Program, 1999–2000; CIMMYT: Mexico City, Mexico, 2001; ISBN 970-648-069-2. [Google Scholar]
  48. Araus, J.; Casadesús, J.; Bort, J. Recent Tools for the Screening of Physiological Traits Determining Yield. In Application of Physiology in Wheat Breeding; Reynolds, M.P., Ortiz-Monasterio, J.I., McNab, A., Eds.; CIMMYT: Mexico City, Mexico, 2001; pp. 59–77. ISBN 970-648-077-3. [Google Scholar]
  49. Cao, Q.; Miao, Y.X.; Wang, H.Y.; Huang, S.Y.; Cheng, S.S.; Khosla, R.; Jiang, R.F. Non-destructive estimation of rice plant nitrogen status with Crop Circle multispectral active canopy sensor. Field Crop Res. 2013, 154, 133–144. [Google Scholar] [CrossRef]
  50. Foster, A.; Atwell, S.; Dunn, D. Sensor-based Nitrogen Fertilization for Midseason Rice Production on Southeast Missouri. Crop Forage Turf. Man. 2017, 1–7. [Google Scholar] [CrossRef] [Green Version]
  51. Xue, L.H.; Li, G.H.; Qin, X.; Yang, L.Z.; Zhang, H.L. Topdressing nitrogen recommendation for early rice with an active sensor in south China. Precis Agric. 2014, 15, 95–110. [Google Scholar] [CrossRef]
  52. Guo, B.B.; Zhu, Y.J.; Feng, W.; He, L.; Wu, Y.P.; Zhou, Y.; Ren, X.X.; Ma, Y. Remotely Estimating Aerial N Uptake in Winter Wheat Using Red-Edge Area Index from Multi-Angular Hyperspectral Data. Front Plant Sci. 2018, 9. [Google Scholar] [CrossRef]
  53. Prey, L.; Schmidhalter, U. Temporal and Spectral Optimization of Vegetation Indices for Estimating Grain Nitrogen Uptake and Late-Seasonal Nitrogen Traits in Wheat. Sensors 2019, 19, 4640. [Google Scholar] [CrossRef] [Green Version]
  54. Crabb, J.A. Soil Survey of Weld County, Colorado, Southern Part; US Department of Agriculture, Soil Conservation Service: Washington, DC, USA, 1980.
  55. USDA. CoAgMet Raw Data Access, Greeley and Greeley 4 Stations. Available online: http://climate.colostate.edu/~coagmet/rawdata_form.php (accessed on 2 October 2012).
  56. Gee, G.; Bauder, J. Particle-Size Analysis. In Methods of Soil Analysis, Part 1; Klute, A., Ed.; Agron. Monogr. 9; ASA; SSSA: Madison, WI, USA, 1986; pp. 383–411. ISBN 978-0-89118-811-7. [Google Scholar]
  57. Thomas, G.W. Soil PH and Soil Acidity. In Methods of Soil Analysis, Part 3-Chemical Methods; Sparks, D.L., Ed.; SSSA Book Ser. No. 5; SSSA; ASA: Madison, WI, USA, 1996; pp. 475–490. [Google Scholar]
  58. Heiri, O.; Lotter, A.F.; Lemcke, G. Loss on ignition as a method for estimating organic and carbonate content in sediments: Reproducibility and comparability of results. J. Paleolimnol. 2001, 25, 101–110. [Google Scholar]
  59. Mulvaney, R.L. Nitrogen-Inorganic Forms. In Methods of Soil Analysis, Part 3-Chemical Methods; Sparks, D.L., Ed.; SSSA Book Ser. No. 5; SSSA; ASA: Madison, WI, USA, 1996; pp. 1123–1184. [Google Scholar]
  60. Davis, J.; Westfall, D.W. Fertilizing Corn. Colorado State University Factsheet 0.538. 2014. Available online: https://extension.colostate.edu/docs/pubs/crops/00538.pdf (accessed on 30 January 2020).
  61. Andales, A.; Chavez, J.L.; Bauder, T.A. Irrigation Scheduling: The Water Balance Approach. Fact Sheet 4.707. Irrigation. Available online: https://extension.colostate.edu/docs/pubs/crops/04707.pdf (accessed on 30 January 2020).
  62. NTech Industries Model 500 GreenSeeker Hand Held—Optical Sensor Unit. Available online: http://nue.okstate.edu/Hand_Held/GS_HandHeld_Manual_rev_K[1].pdf (accessed on 2 October 2012).
  63. R Development Core Team. R: A Language and Environment for Statistical Computing; R Foundation for Statistical Computing: Vienna, Austria, 2010; ISBN 3-900051-07-0. Available online: http://www.R-project.org (accessed on 2 October 2012).
  64. McMaster, G.S.; Wilhelm, W.; Bartling, P.N.S. Irrigation and Culm Contribution to Yield and Yield Components of Winter Wheat. Publications from USDA-ARS/UNL Faculty. Paper 86. 1994. Available online: http://naldc.nal.usda.gov/download/16753/pdf (accessed on 3 October 2012).
  65. Gauer, L.; Grant, C.; Bailey, L.; Gehl, D. Effects of nitrogen fertilization on grain protein content, nitrogen uptake, and nitrogen use efficiency of six spring wheat (Triticum aestivum L.) cultivars, in relation to estimated moisture supply. Can. J. Plant Sci. 1992, 72, 235–241. [Google Scholar]
  66. Tong, Y.; Li, J.; Li, Z. Genotype variations for nitrogen use efficiency in winter wheat (Triticum aestivum L.). III. Factors affecting utilization efficiency of nitrogen. Acta Bot. Boreali Occident. Sin. 1999, 19, 598. [Google Scholar]
  67. Baresel, J.; Zimmermann, G.; Reents, H. Effects of genotype and environment on N uptake and N partition in organically grown winter wheat (Triticum aestivum L.) in Germany. Euphytica 2008, 163, 347–354. [Google Scholar]
  68. Neales, T.; Anderson, M.; Wardlaw, I. The role of the leaves in the accumulation of nitrogen by wheat during ear development. Crop Pasture Sci. 1963, 14, 725–736. [Google Scholar]
  69. Cox, M.C.; Qualset, C.O.; Rains, D.W. Genetic variation for nitrogen assimilation and translocation in wheat. II. Nitrogen assimilation in relation to grain yield and protein. Crop Sci. 1985, 25, 435–440. [Google Scholar] [CrossRef]
  70. Jensen, A.; Lorenzen, B.; Østergaard, H.S.; Hvelplund, E.K. Radiometric estimation of biomass and nitrogen content of barley grown at different nitrogen levels†. Int. J. Remote Sens. 1990, 11, 1809–1820. [Google Scholar]
  71. Serrano, L.; Filella, I.; Penuelas, J. Remote sensing of biomass and yield of winter wheat under different nitrogen supplies. Crop Sci. 2000, 40, 723–731. [Google Scholar] [CrossRef] [Green Version]
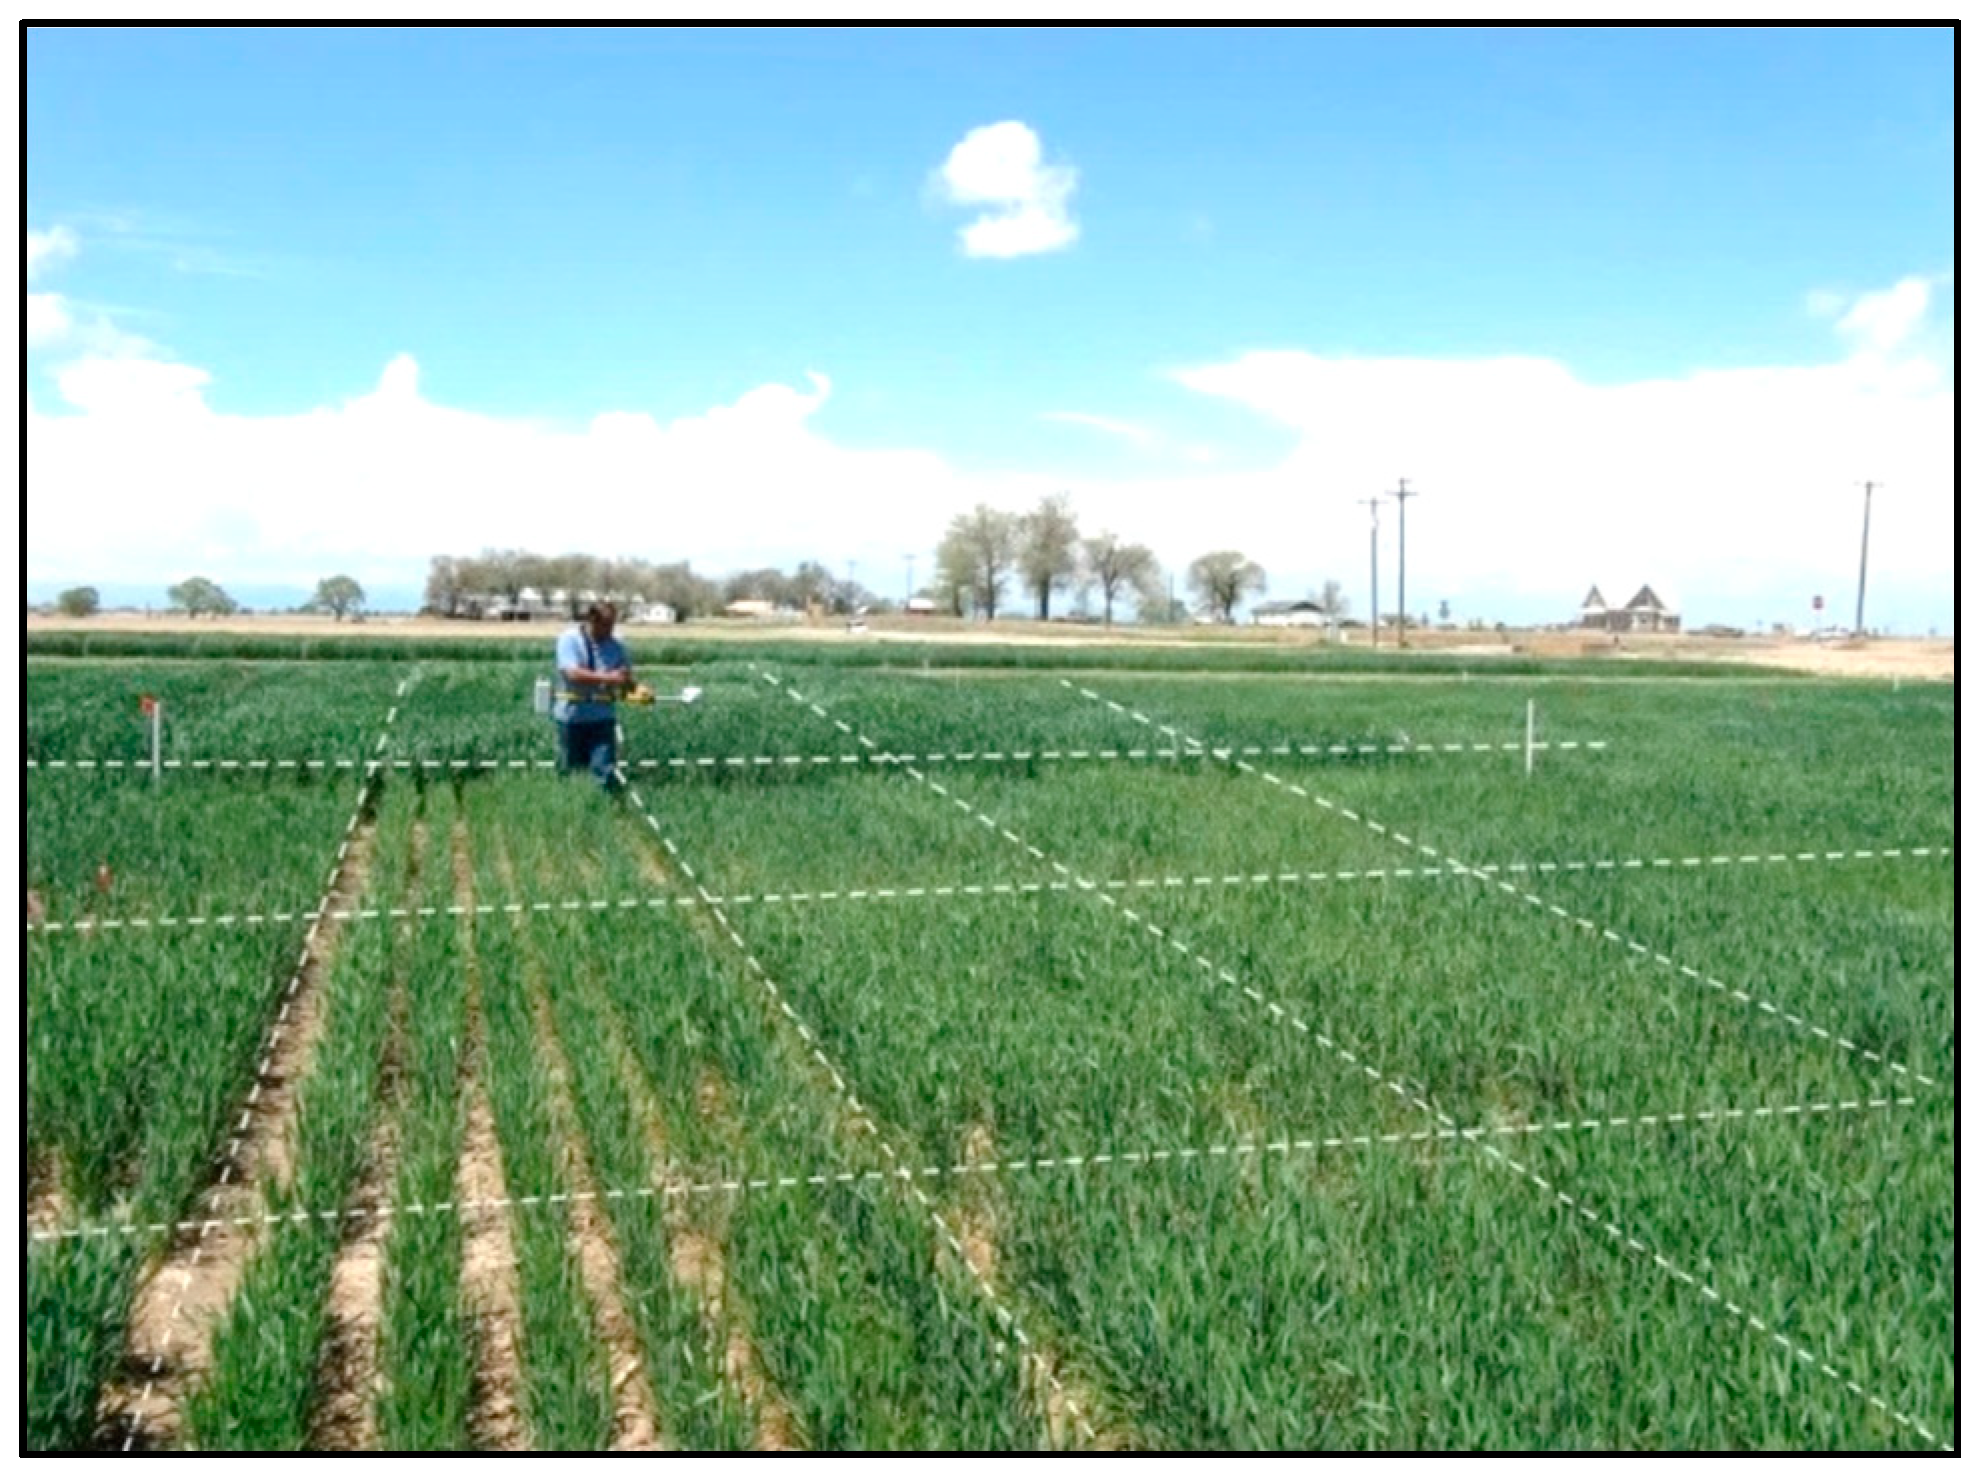
Figure 1. The normalized difference vegetation index (NDVI) readings were collecting using a Greenseeker® handheld optical sensor. Plot boundaries are highlighted with white dashed lines.
Agronomy 10 00773 g001
Figure 2. Mean nitrogen use efficiency as the partial factor productivity (PFP) across 24 winter wheat genotypes for (top-left) dryland in 2010, (top-right) irrigated conditions in 2010, (bottom-left) dryland in 2011, and (bottom-right) irrigated land in 2011. Error bars are the standard errors.
Agronomy 10 00773 g002
Figure 3. Mean nitrogen use efficiency as the partial nitrogen balance (PNB) across 24 winter wheat genotypes for (top-left) dryland in 2010, (top-right) irrigated conditions in 2010, (bottom-left) dryland in 2011, and (bottom-right) irrigated land in 2011. Error bars are the standard errors.
Agronomy 10 00773 g003
Figure 4. Correlation coefficients (r) between parameters of interest for (A) dryland, 2010; (B) dryland, 2011; (C) irrigated , 2010; and (D) irrigated conditions, 2011, across 24 wheat genotypes. Blue, green and red colors indicate negative, low and positive correlations, respectively. Biomass = total plant biomass; Grain.N = Nitrogen content in grain; Biomass.N = Nitrogen content in plant biomass; PFP = Partial factor productivity; PNB = Partial nitrogen balance; UPE = Uptake efficiency; UTE = Utilization efficiency; BPE = Biomass production efficiency.
Agronomy 10 00773 g004
Figure 5. Relationship of the R2 between the NDVI and PFP (partial factor productivity) and PNB (partial N balance) with the day of year (DOY) across 24 winter wheat genotypes under dryland and irrigated conditions for (a) site year I and (b) site year II.
Agronomy 10 00773 g005
Table 1. Summary of the soil properties for the soil samples acquired at depths of 0–20 cm and 20–61 cm.
Sampling N at EarlyN After
SiteDepths pHO.MSpringHarvestSandSiltClaySoil Texture
Year(cm) %Mg g−1Mg g−1 %
I0–20Min7.91.022.05.064.813.69.6
Mean8.01.131.07.968.416.515.1Sandy Loam
Max8.11.347.014.072.821.617.6
2–61Min7.90.911.05.060.813.611.6
Mean8.01.122.312.567.716.915.3Sandy Loam
Max8.21.340.037.072.821.617.6
Sampling N at EarlyN After
SiteDepths pHO.MFallHarvestSandSiltClaySoil Texture
Year(cm) %Mg g−1Mg g−1 %
II Min7.81.030.08.058.84.412.8
0–20Mean8.01.238.015.464.916.718.4Sandy Loam
Max8.11.554.022.070.824.430.8
Min8.00.816.04.053.23.615.2
2–61Mean8.21.022.49.861.717.720.5Sandy Loam
Max8.41.344.022.067.227.629.2
Soil NO3-N contents were determined on samples collected on March 22nd (early spring) and August 19th of 2010 (after harvest) for site year I and November 8th 2010 (at early fall) and August 22nd 2011 (after harvest) for site year II. OM = Organic matter.
Table 2. Measurements and calculations of nitrogen use efficiency and related parameters [18,20].
MeasurementAcronymCalculation (kg)
Partial factor productivityPFPGrain/N supplied
Partial N balancePNBGrain N content */N supplied
Nitrogen uptake efficiencyUPE Total   N   in   above   ground   biomass   at   maturity * *   N   supplied
Nitrogen utilization efficiencyUTE   Grain   Total   N   in   aboveground   biomass   at   maturity
Biomass production efficiencyBPE   Aboveground   biomass Total   N   in   aboveground   biomass   at   maturity
Ratio of grain N content to aboveground biomass weightGN/BWGrain N content/aboveground biomass
* Grain N content = % protein in grain ÷ conversion factor (5.7) × grain yield (kg/ha), ** Total N = grain N content (kg/ha) + plant N content (kg/ha).
Table 3. Contribution (relative contribution in regression) of parameters related to the variation in PFP and PNB.
------------Dryland-------------------------Irrigated------------
Site Year ISite Year IISite Year ISite Year II
Traits RCRCRCRC
PFPY1----
UPEX10.520.860.880.46
UTEX20.480.140.120.54
PNBY2----
UPEX10.620.910.930.60
BPEX3−0.10−0.25−0.38−0.08
GN/BW X40.480.340.470.49
RC: Relative contribution of corresponding X variable (all significant at p < 0.05). PFP = Partial factor productivity; UPE = Uptake efficiency; UTE = Utilization efficiency; PNB = Partial nitrogen balance; BPE = Biomass production efficiency; GN/BW = Grain nitrogen content/aboveground biomass.