Article

Characterization of the Transverse Distribution of Fertilizer in Coffee Plantations

by
Alan Delon Andrade
1,
Gabriel Araújo e Silva Ferraz
1,*,
Murilo Machado de Barros
2,
Rafael De Oliveira Faria
1,
Fábio Moreira da Silva
1,
Daniele Sarri
3 and
Marco Vieri
3
1
Agricultural Engineering Department, Federal University of Lavras, Cx. P. 3037, 37.200-900 Lavras, MG, Brazil
2
Institute of Technology, Rural Federal University of Rio de Janeiro, Rodovia BR-465, 23.897-000 Seropédica, RJ, Brazil
3
Department of Agricultural, Food, Environment and Forestry, University of Florence, Piazzale Delle Cascine 15, 50144 Florence, Italy
*
Author to whom correspondence should be addressed.
Agronomy 2020, 10(4), 601; https://doi.org/10.3390/agronomy10040601
Submission received: 11 March 2020 / Revised: 13 April 2020 / Accepted: 14 April 2020 / Published: 23 April 2020
(This article belongs to the Special Issue Precision Agriculture for Sustainability)

Abstract

:
Considering the impact of fertilizers on coffee production costs, the search for greater efficiency in the use of these inputs has an important role. Accordingly, the aim of the present study is to evaluate the transverse distribution of fertilizer by a centrifugal spreader in a coffee plantation and to compare two operating modes: fertilizer application on one side (FA1), or both sides (FA2) of the coffee plants. In addition, three doses (200, 300 and 400 kg ha−1) of monoammonium phosphate and three spreading disk rotation speeds (240, 375 and 750 rpm) were tested. To characterize fertilizer distribution profiles, collectors were placed under the canopy of coffee plants, and the collected fertilizer was weighed. From the data obtained, distribution profile histograms were constructed, and coefficients of variation were calculated for each treatment. Distribution profiles with higher uniformity were related to the morphologic characteristics of the coffee plants. Regarding the operating modes evaluated, FA1 presented better results with a disk rotation speed of 750 rpm (FA1-W3); FA2 produced the best results with a disk rotation speed of 240 rpm. By relating these results with information on root morphology, FA1-W3 was found to be the most appropriate application method.

1. Introduction

Coffee is one of the most important agricultural products exported and adds considerable volume of resources to the Brazilian trade balance [1]. However, coffee production processes are complex and crop management operations are costly. The effectiveness of management operations and agricultural inputs application affects the coffee yield and the quality of the final product, which is directly related to the return on investment [2,3]. Thus, optimizing the use of inputs by applying exact and accurate doses that match the real needs of the soil results in better crop development, reduced costs and reduced environmental impacts caused by the incorrect use of products, such as fertilizers and pesticides [4].
Modern agriculture leans on scientific and technological feedback to improve productivity [5]. In this role, precision agriculture stands as a powerful tool, using information and communication technology to improve decision-making processes and, consequently, optimize production [6]. With respect to the application of fertilizers and soil correctives in coffee plantations, studies have found that the interpretation of spatial variability in soil chemical characteristics–through the generation of variable rate application (VRA) recommendation maps–allows an increase in agricultural input use efficiency [7,8]. However, to perform VRA in an effective and viable manner, equipment must be developed, and specific evaluation parameters must be determined to meet the crop specifications [9]. Additionally, knowledge of the operational quality of the equipment for VRA is not widespread [10].
Regarding the methods used to evaluate this equipment, distribution uniformity is the primary indicator of the operational quality of centrifugal spreaders. The most widely used methodology for these evaluations follows the standard ISO 5690/1, described by Mialhe (1996) [11], which addresses the testing and certification of equipment for distributing fertilizers and soil correctives. However, the standard does not take into consideration the dynamics of the application operation because samplings are performed in the open field. Further, it does not consider fertilizer particle collision with the crop stems and leaves [12]. This method also does not recognize the presence of deflectors at the disk exit to direct the fertilizer, which are widely used in coffee plantations.
Studies have been performed with the aim of developing and evaluating equipment for VRA but in the scope of coffee production there are very few studies on this subject [9,13]. As these studies followed ISO 5690/1 guidelines, the caveats presented above were not considered. It is noteworthy that there is no standard method in Brazil to evaluate fertilizer distribution in the field [14]. In fact, it the need for a specific methodology for fertilizer distribution evaluation in coffee plantations is noticeable.
When evaluating equipment for distribution of fertilizers and soil correctives, several factors must be analyzed, including both operation and the external factors that affect machine performance and distribution quality related to plant needs. The study of the most appropriate location for fertilizer application is important for coffee production, as there is no consensus regarding application zone that may lead to better use by the plant. Knowledge of root morphology of coffee plants is, therefore, a useful reference. Studies on root distributions in the soil recommend that fertilizer should be applied under the coffee canopy, close to the orthotropic stem [15], where the root concentration and absorption capacity are higher [16].
Because coffee plants are bushes, equipment travels between rows and distributes products laterally under the plants. In some cases, equipment travels and applies the total recommended dose of fertilizer on only one side of the coffee plants; in other cases, it operates on both sides of the coffee plants, applying half of the recommended dose to each side. The operating mode varies among farms and the crop management plan and may significantly affect equipment performance. On the other hand, impacts of operating modes on distribution quality is not known.
Studies are therefore needed to evaluate equipment for fertilizer distribution and to determine their distribution profile, considering dynamics of field operations, different operating modes and equipment settings, equipment-plant interactions and additional factors affecting fertilizer application to the coffee plants.
The aim of the present study is to evaluate–in the field–the transverse distribution profile of a centrifugal spreader for VRA in coffee plantation, developing a specific methodology focused in this type of plant and based on the ISO 5690/1. To compare two operating modes, we used fertilizer application on one side or both sides of the coffee plants, using different product doses and different spreading disk rotation speeds.

2. Materials and Methods

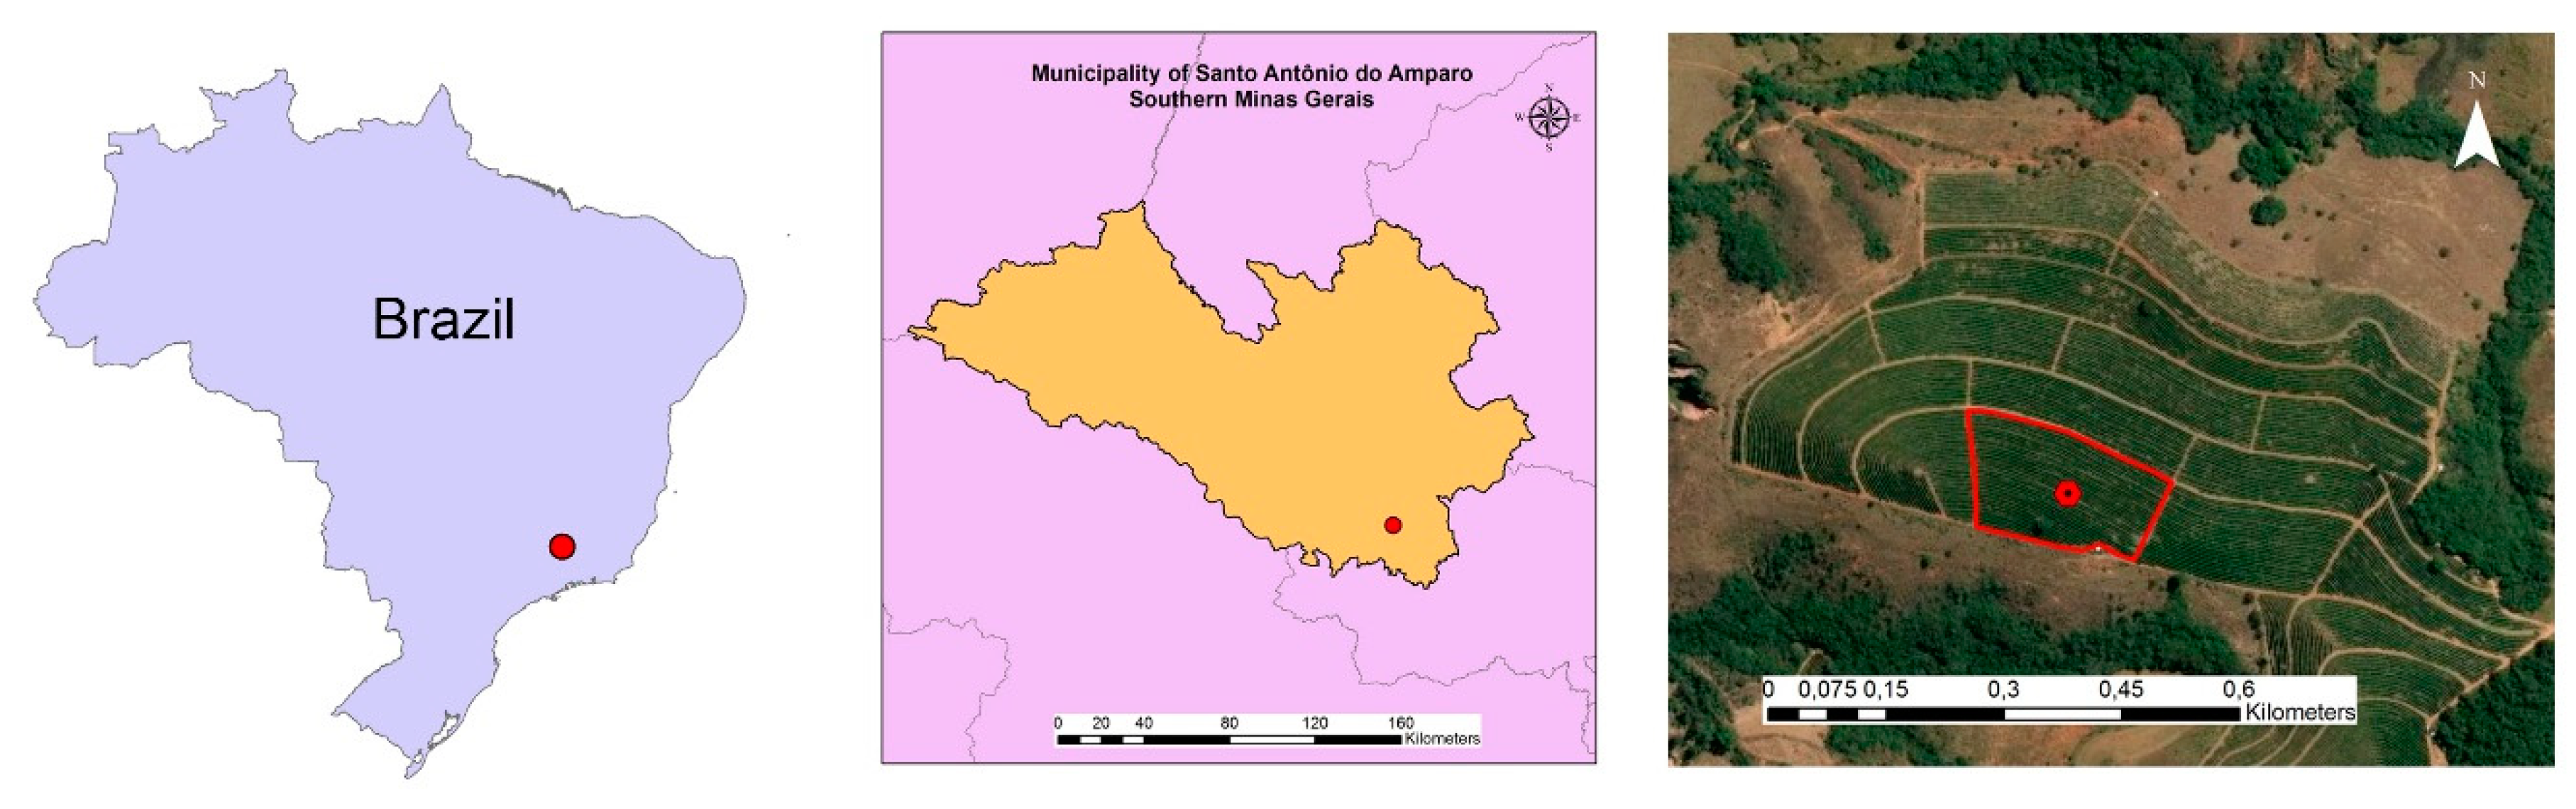
2.1. Field Characterization

The experiment was completed at Farm Samambaia, located in the municipality of Santo Antônio do Amparo, Southern Minas Gerais, Brazil, in a 3 ha field within a coffee (Coffea arabica L.) plantation of the cultivar Acaiá 479–19, with geographic coordinates 20°58′10” S and 44°53′35” W (Figure 1).
The terrain in the area delimited for the experiment is regular and flat, presenting an average ground slope of 3.95%, and a maximum slope of 8.47%, based on measurements performed at all sampling plots. The management system in the area was prearranged for mechanization with a 7 m track width, a 3.6 m line spacing and a 0.8 m plant spacing. The height of the lower plagiotropic branches and the diameter of the coffee plant canopy were manually measured at all sampling plots; the average values were 0.41 and 1.58 m, respectively.

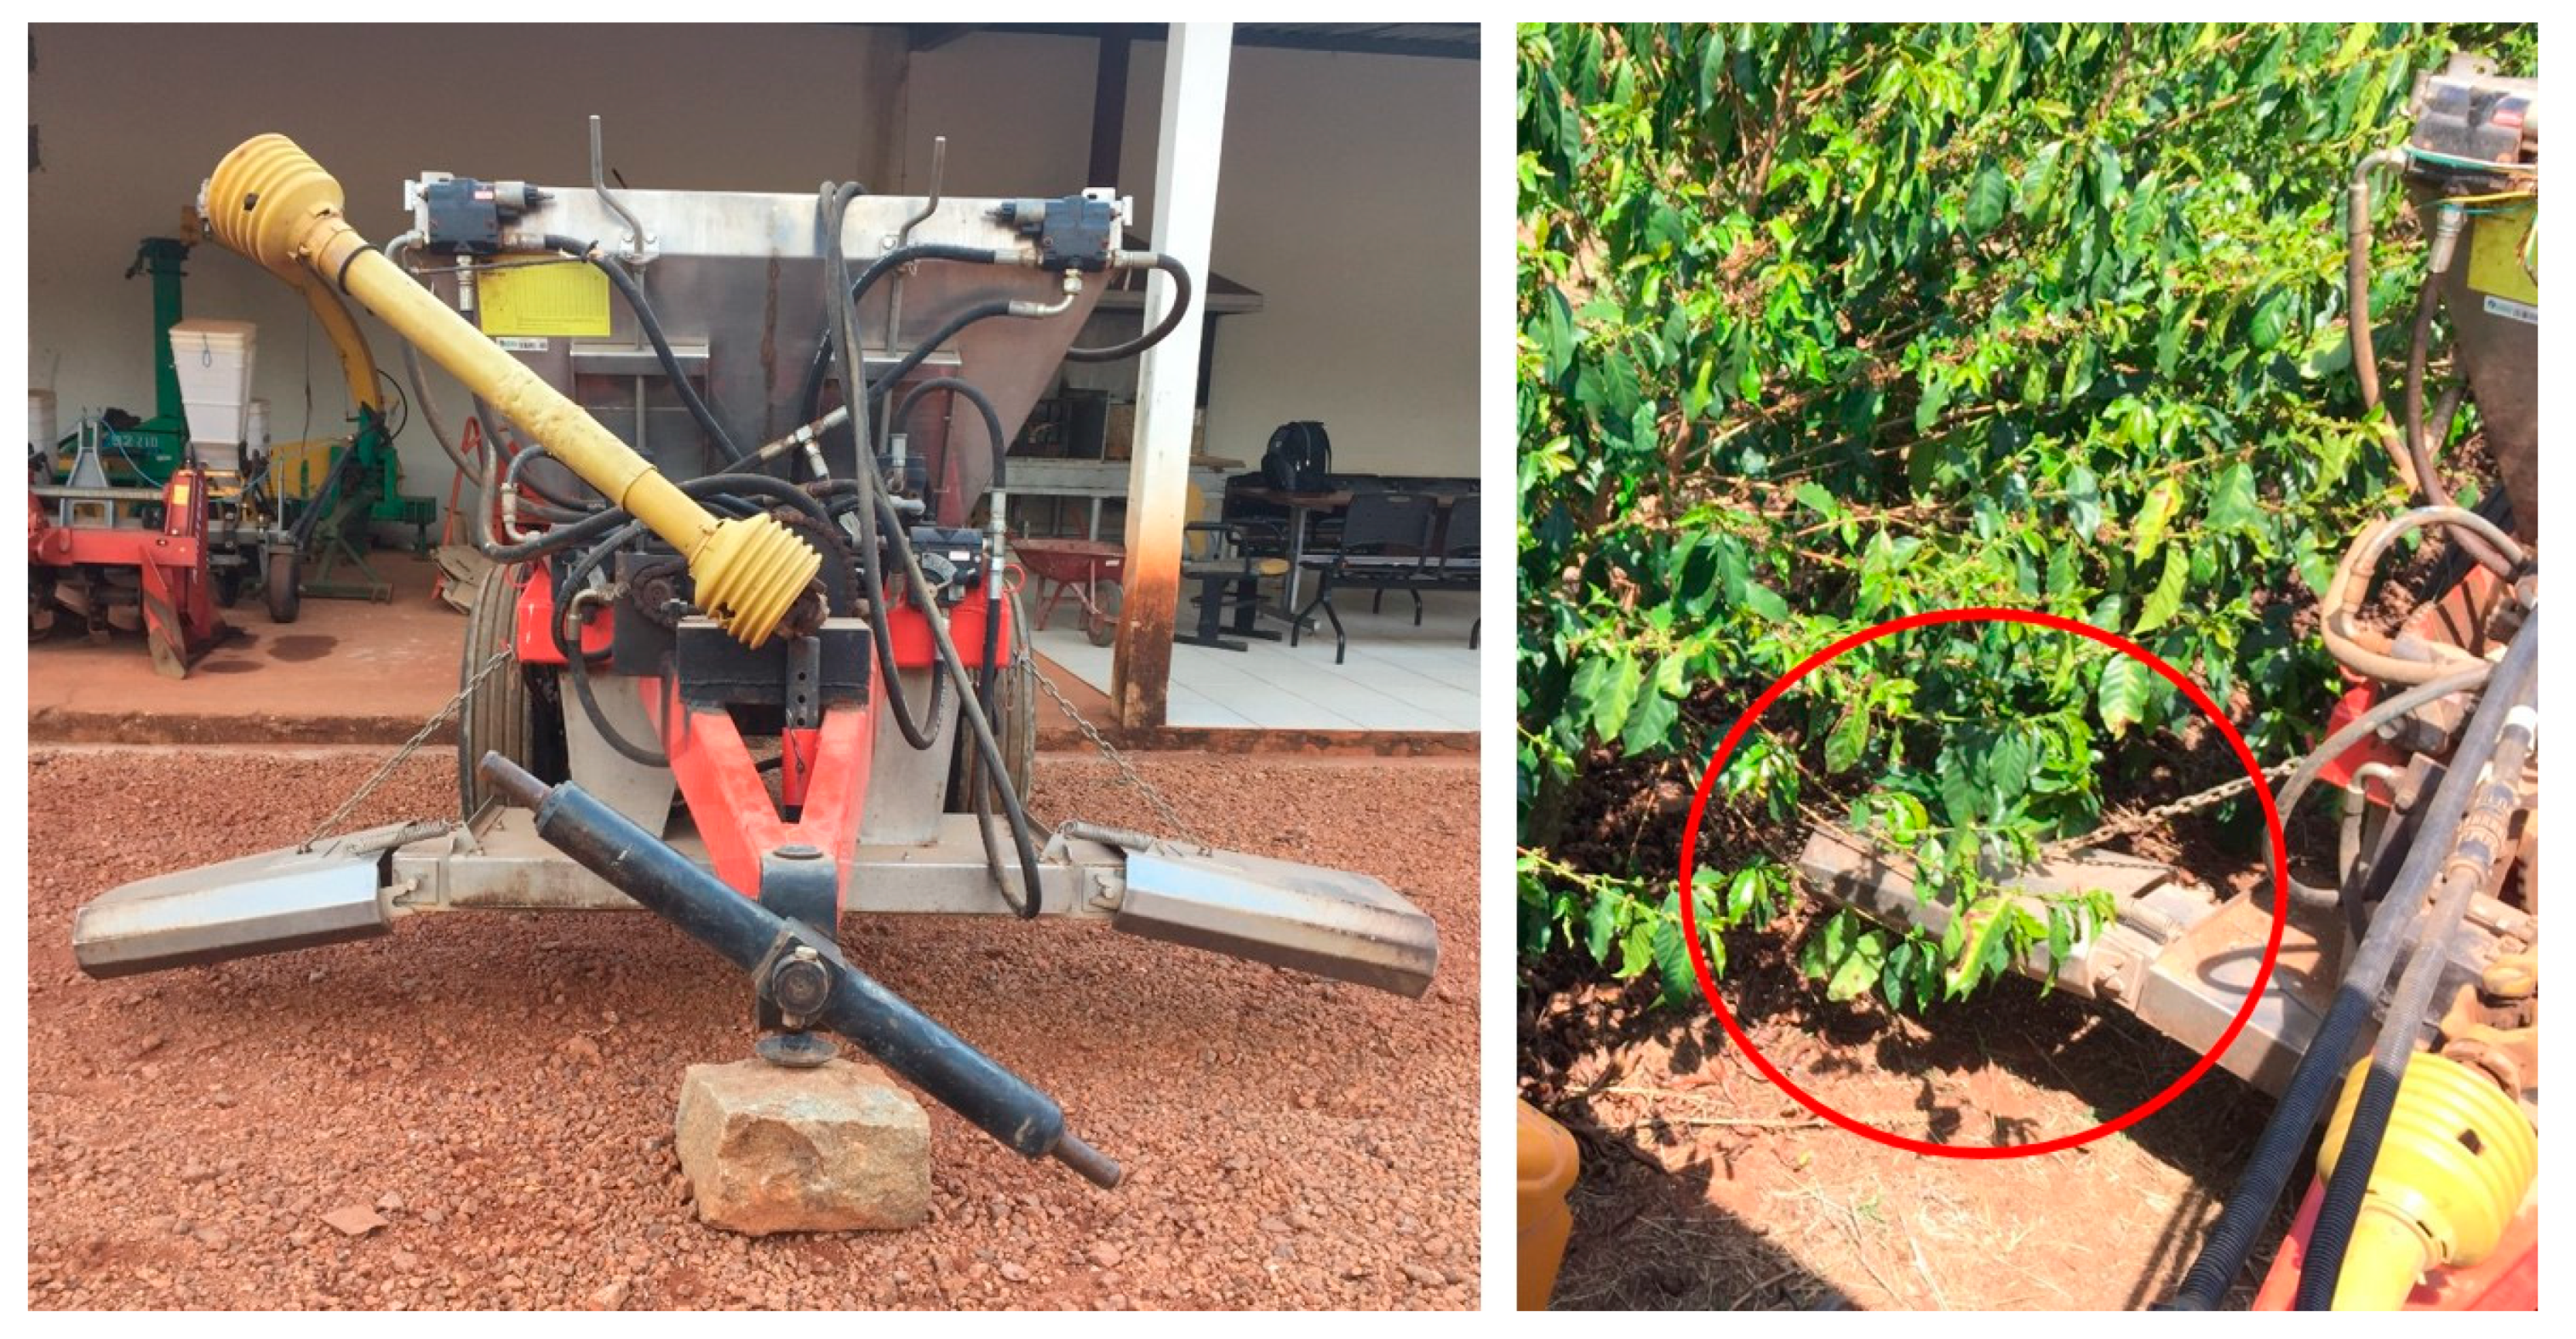
2.2. Machinery Set Specification

The machine evaluated was a spreader for the distribution of fertilizers and soil correctives, equipped with a VRA system adapted by Barros et al. (2016) [13]. The spreader had a load volume of 1.2 m3, with a length of 3.36 m, a height of 1.40 m and a total width 2.15 m including deflectors. The product dispenser mechanism consists of two independent conveying chains and manually adjusted gates. The application rate changed with variations in the conveyor speed, which is powered by hydraulic motors. In this system, the oil reaching the motors comes from a pump activated by the power take off of the tractor and the flow rate is controlled by electrohydraulic valves connected to the control system. The control system identifies the machine speed through a GNSS receiver and sends a signal to the electrohydraulic valves, aiming to maintain the pre-imposed application rate, independently of the machine speed. The distribution mechanism is composed of two horizontal disks with a 0.3 m diameter and four flaps per disk. The disks are activated individually by hydraulic motors fed by the oil flow from the tractor hydraulic system; the motor speed can be changed through a flow control valve located in the machine. The fertilizer application is directed to the planting row by lateral deflectors. In our study, the height of the external part of the deflectors was fixed at 0.23 m from the terrain for all evaluations. The machine and its interaction with the coffee plants are presented in Figure 2.
The spreader was pulled by an agricultural tractor (Valtra, model A750F, Mogi das Cruzes, Brazil) with a nominal power of 57.3 kW (78 CV) at 2300 rpm and a maximum torque of 297 N m at 1400 rpm. For all evaluations, the machinery set worked at an average speed of 1.94 m s−1 (7.0 km h−1), the speed normally used in the farm.

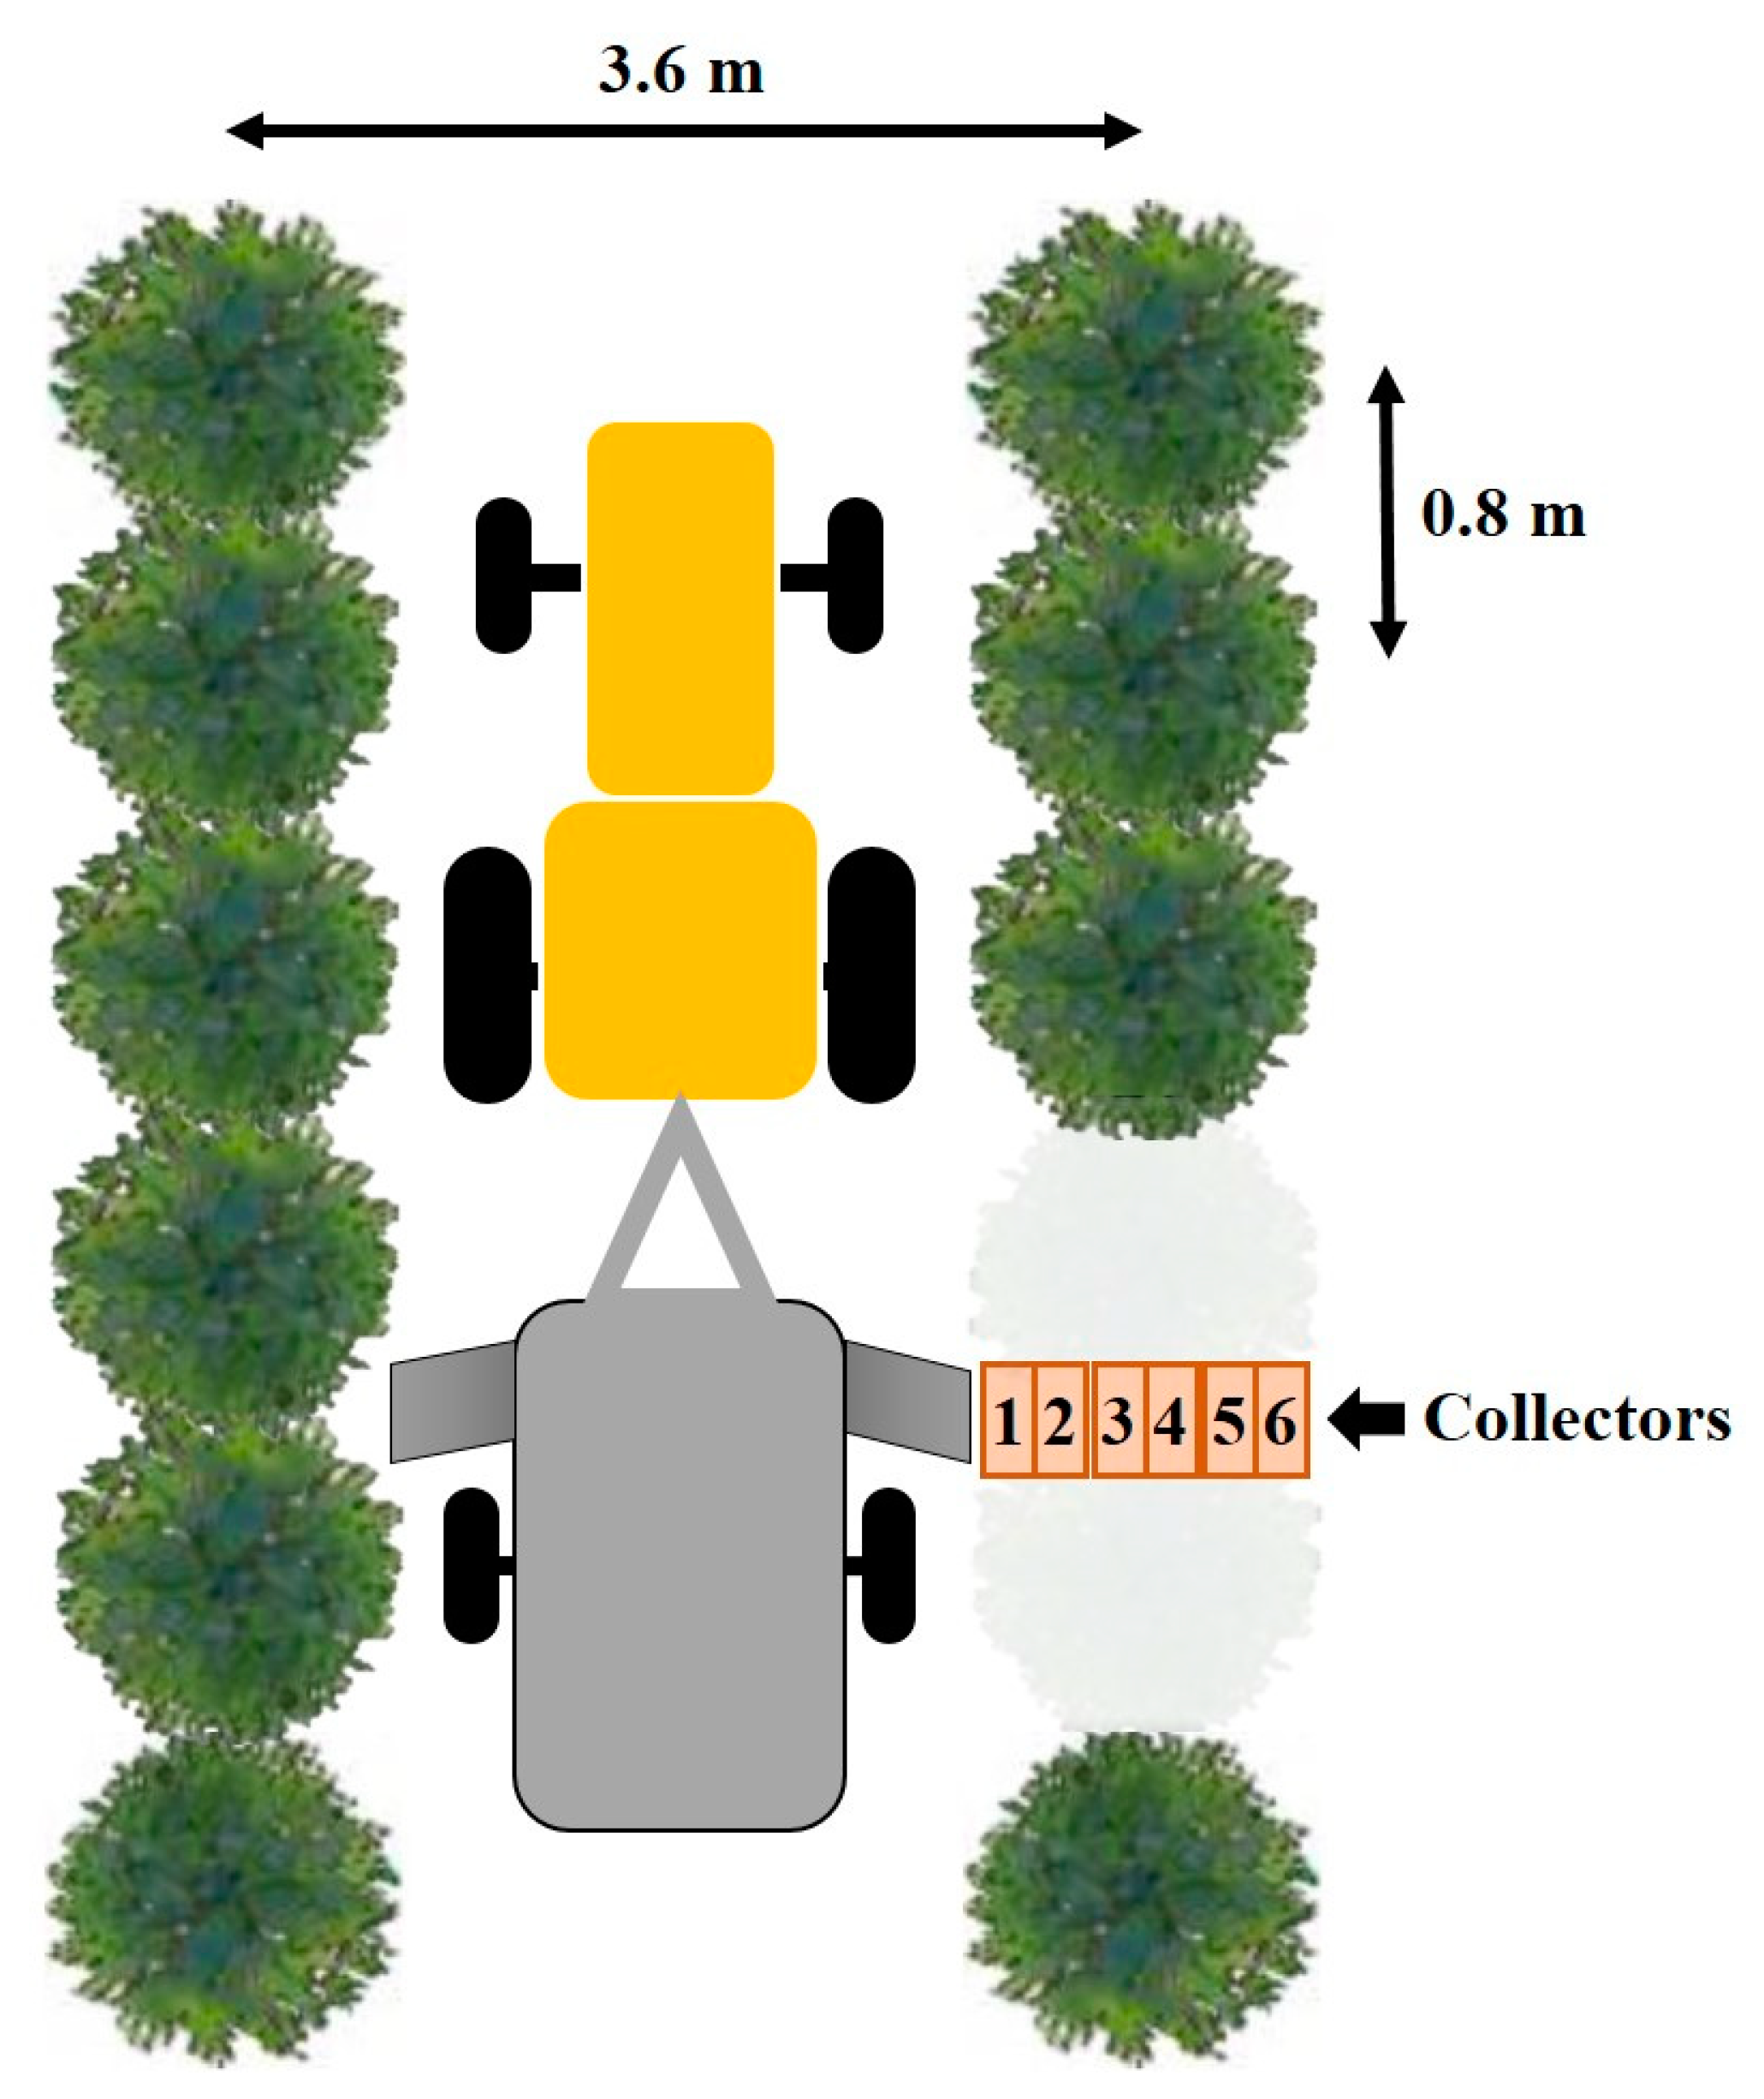
2.3. Experiment Description

The transverse distribution profile was evaluated for two different operating modes: application on only one side of the coffee plants (FA1), with the spreader set to apply the total recommended dose, or application on both sides of the coffee plants (FA2), with the spreader set to apply half the recommended dose to each side.
For standardization purposes, the plant sides were identified using the cardinal direction of the planting rows as a reference. Specifically, the plant side facing south along the planting row was designated as the “left side”; the plant side facing north was designated as the “right side”. When the fertilizer was applied only on one side of the coffee plants, the spreader traveled on the left side of the plants.
The fertilizer used was monoammonium phosphate (MAP). At the time of testing, fertilizer samples were collected for characterization according to standard ISO 5690/1. The following physical characteristics were determined: angle of repose, particle size, specific weight and moisture.
Based on the fertilizer recommendation map, three fertilizer doses were chosen to be evaluated in the experiment based on the actual demands of the area. The minimum (200 kg ha−1) and maximum (400 kg ha−1) recommended doses and an intermediate dose (300 kg ha−1) were chosen.
Three spreading disk rotation speeds were chosen for evaluation based on field observations and practical adjustments. At the lowest disk rotation speed chosen, the spreader can apply fertilizer up to 0.2 m from the deflector exit; at the intermediate speed, fertilizer can be applied from the deflector exit up to half the diameter of the coffee plant canopy (0.79 m); and at the highest speed, fertilizer can be applied up to a distance equivalent to the diameter of the coffee plant canopy (1.58 m).
The disk rotation speeds were selected with the spreader stationary by placing a canvas under the coffee plants, turning on the system and observing the distance of fertilizer application at different disk rotation speeds. Readings for the three rotational speeds that met the conditions described above were taken using a tachometer. The selected rotation speeds were 240, 375 and 750 rpm. This manner of determining the appropriate rotation speed, using the plant as a reference, is a methodological improvement of the present study.
According to standard ISO 5690/1, the climate conditions should have been satisfactory at the time of evaluation, i.e., no rainfall, relative humidity below 80% and wind speed below 2.0 m s−1. These conditions were met in the present study.
The applied product was collected using 0.5 × 0.5 m trays with a depth of 0.15 m, according to standard ISO 5690/1. Because the trays are very wide, making the analysis of the fertilizer distribution less precise, the trays were divided in the middle with a Styrofoam divider 0.02 m thick to increase data discretization for a given application width. To evaluate the effect of fertilizer interception by stems and leaves, which occurs very frequently in coffee plantations, the trays were placed under the coffee plants, covering a soil strip under the canopy projection. Three trays were used for each sampling plot, i.e., six product collectors with numbered positions, covering a total area of 1.5 m perpendicular to the traveling direction of the spreader (Figure 3). According to the adopted standardization, the collectors were numbered (1 to 6) from left to right, with three collectors on each side of the plant. Collectors 3 and 4 covered the 0 to 0.25 m strip from the coffee plant’s orthotropic stem (COS) on each side of the plant, collectors 2 and 5 covered the 0.25 to 0.50 m strip; collectors 1 and 6 covered the 0.50 to 0.75 m strip.
The product collected in the trays was placed in plastic bags previously labeled with a specific code for each treatment. The bags were kept closed until the material was weighed in the laboratory at the Federal University of Lavras, using a precision scale with a 0.001 g accuracy, model UX420H made by Shimadzu Corporation, Tokyo, Japan.

2.4. Statistical Methods

A completely randomized split-plot design was used. The variables of disk rotation speed and operating mode were randomly distributed between planting rows, and the variable of fertilizer dose was randomly distributed within the same planting row. Each treatment consisted of different combinations of the three variables, with three replicates for each treatment. Nine sampling plots were allocated to each planting row for a total of 54 plots in the entire experimental area.
Statistical analysis was performed using an analysis of variance followed by the Scott–Knott test when significant differences were observed (p ≤ 0.05). All analyses were performed using the software Sisvar®, Federal University of Lavras, Lavras, Brazil [17].
Distribution uniformity was evaluated using the coefficient of variation (CV): the application range was fixed at 1.5 m, and the lower the CV was, the more satisfactory the distribution profile. This differs from the recommendation by standard ISO 5690/1, where the CV is fixed at an appropriate value and the effective width is based on the CV. The application range was fixed at 1.5 m because this is the range covered by the collectors. This range is very similar to the coffee plant canopy diameter. In addition, regression graphs were generated for the most appropriate treatments, using the CV as a reference to compare the distribution profiles.

3. Results and Discussion

3.1. Fertilizer Physical Characterization

The fertilizer particle size analysis showed that 97.12% of the sample had particles with a diameter greater than 1.7 mm. This condition ensured that not occur the risk of fertilizer drift during application. The angle of repose was 35.38°, which allowed good outflow from the machine, according to the Brazilian Agriculture Encyclopedia (Enciclopédia Agrícola Brasileira, 1994 apud MIALHE, 1996) [11]. The fertilizer density was 0.99 g cm−3; the fertilizer moisture content was 2.55%.

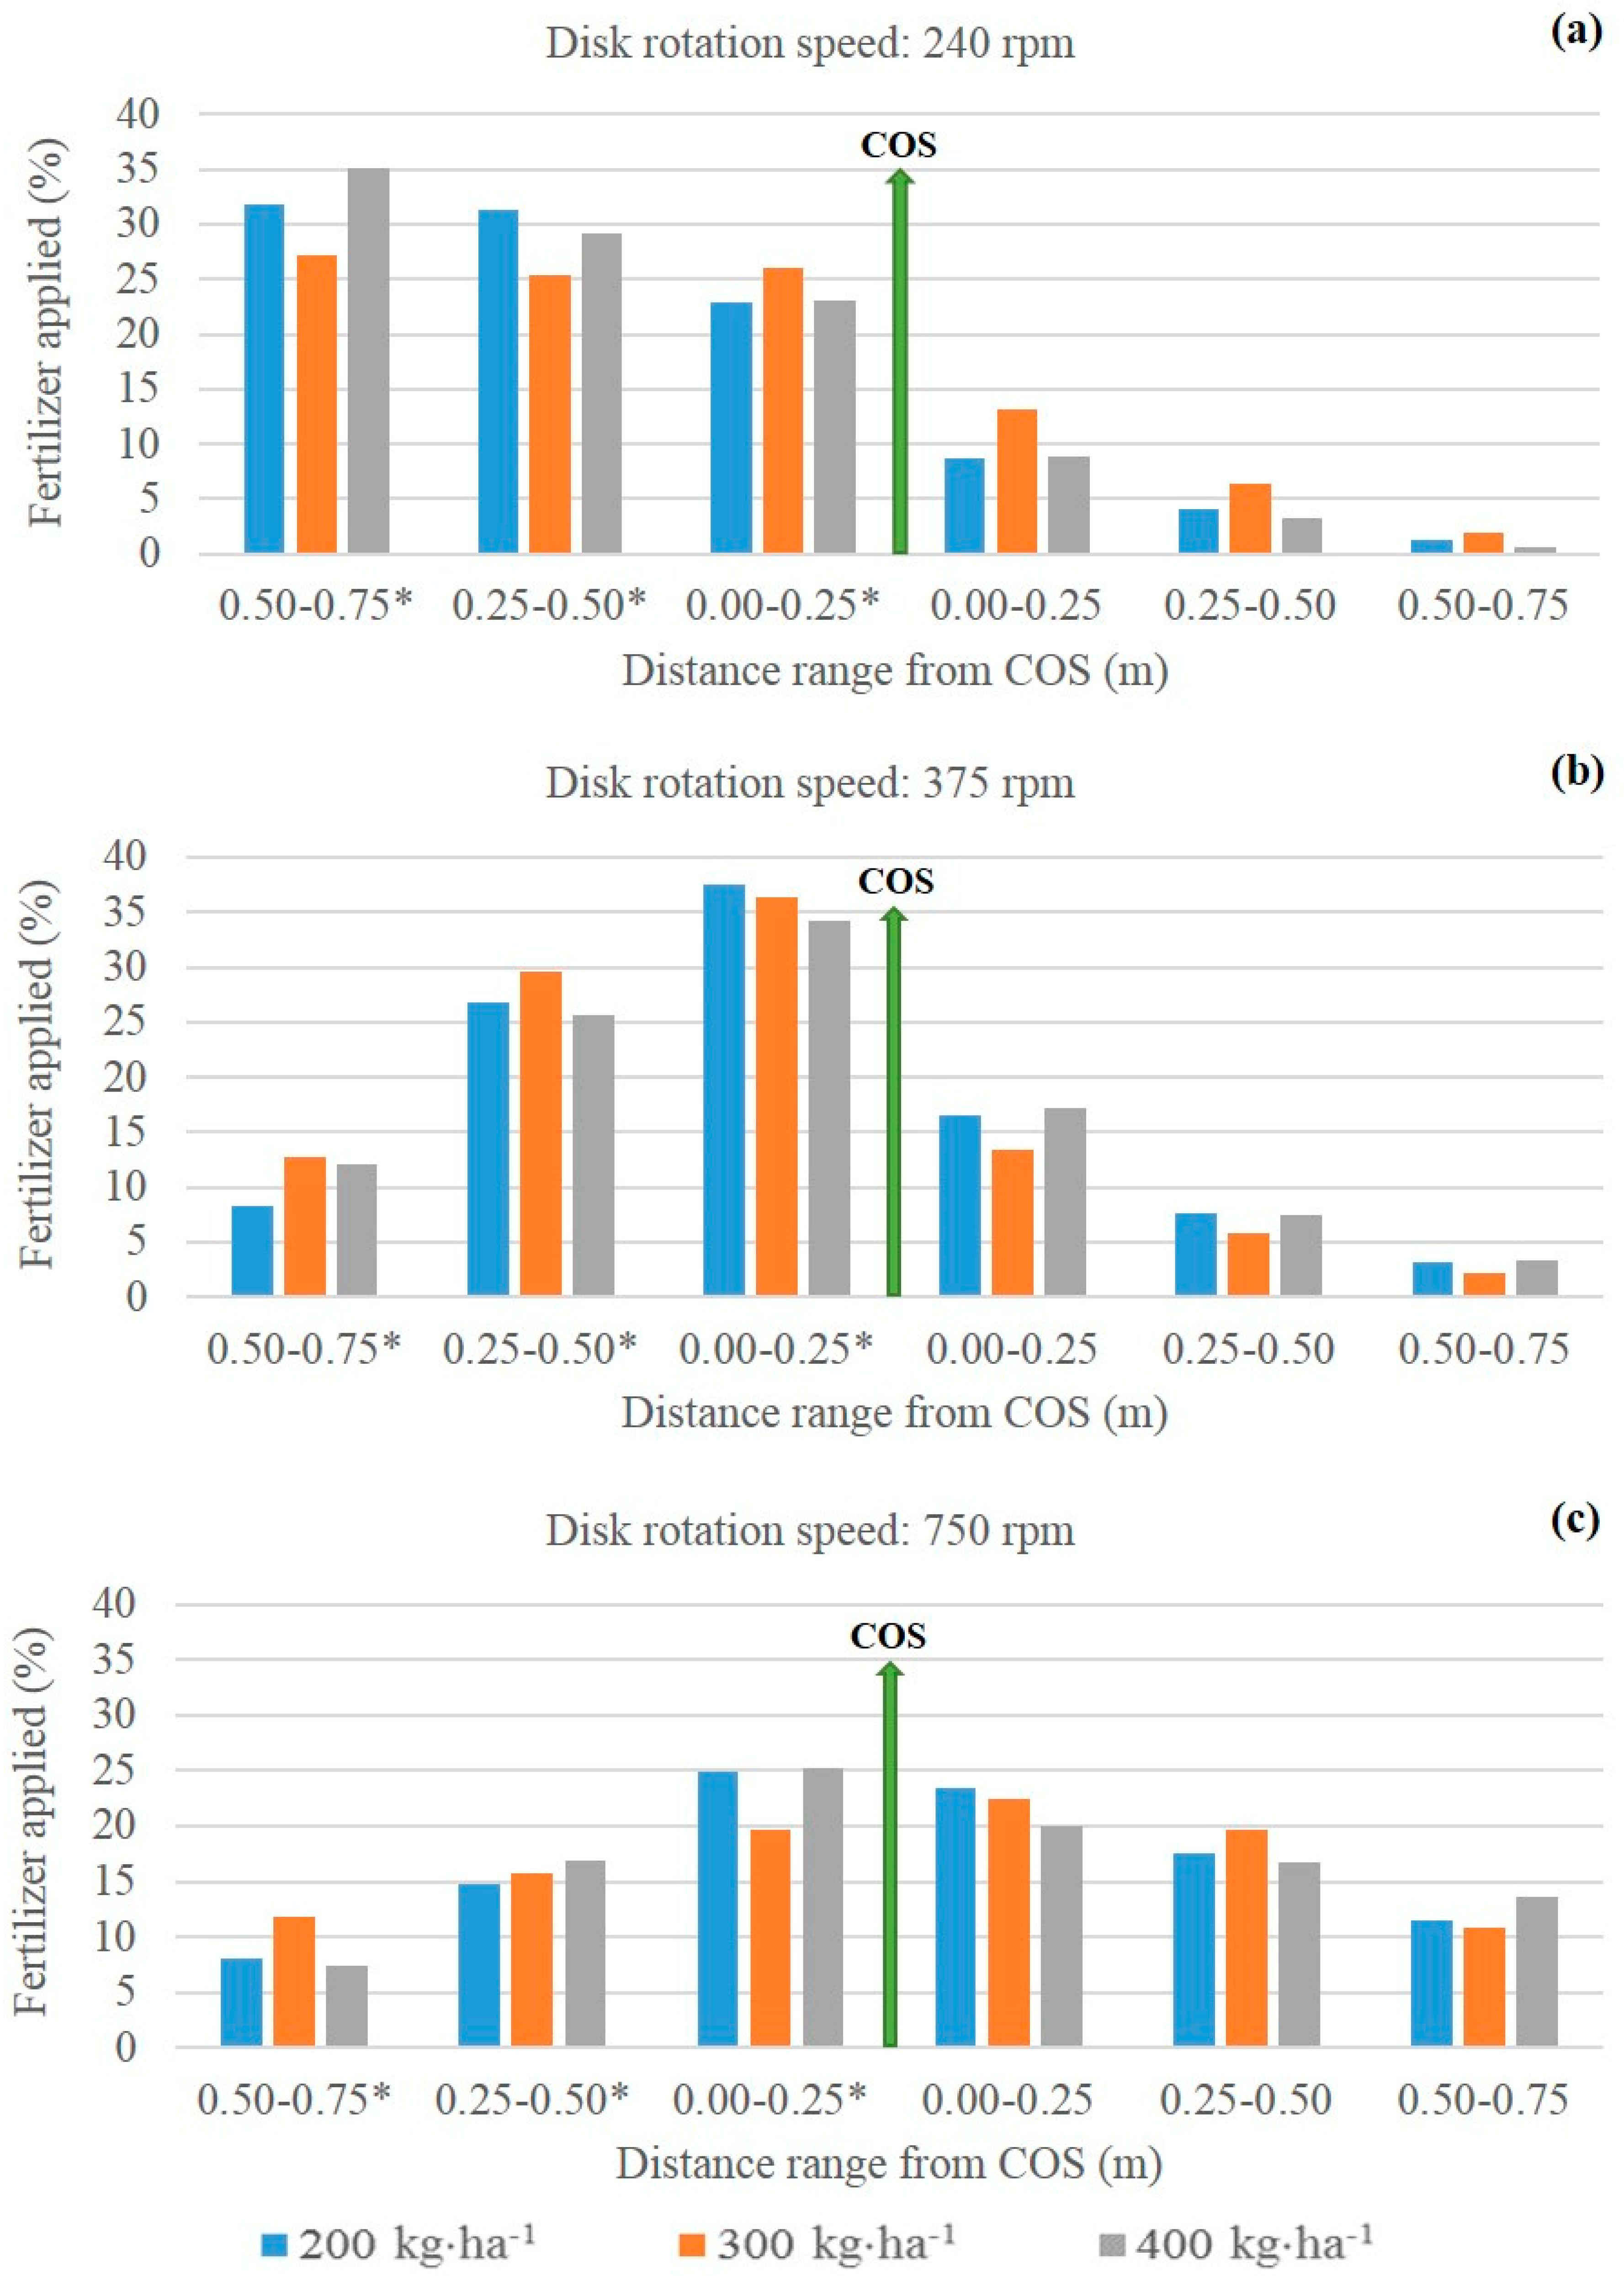
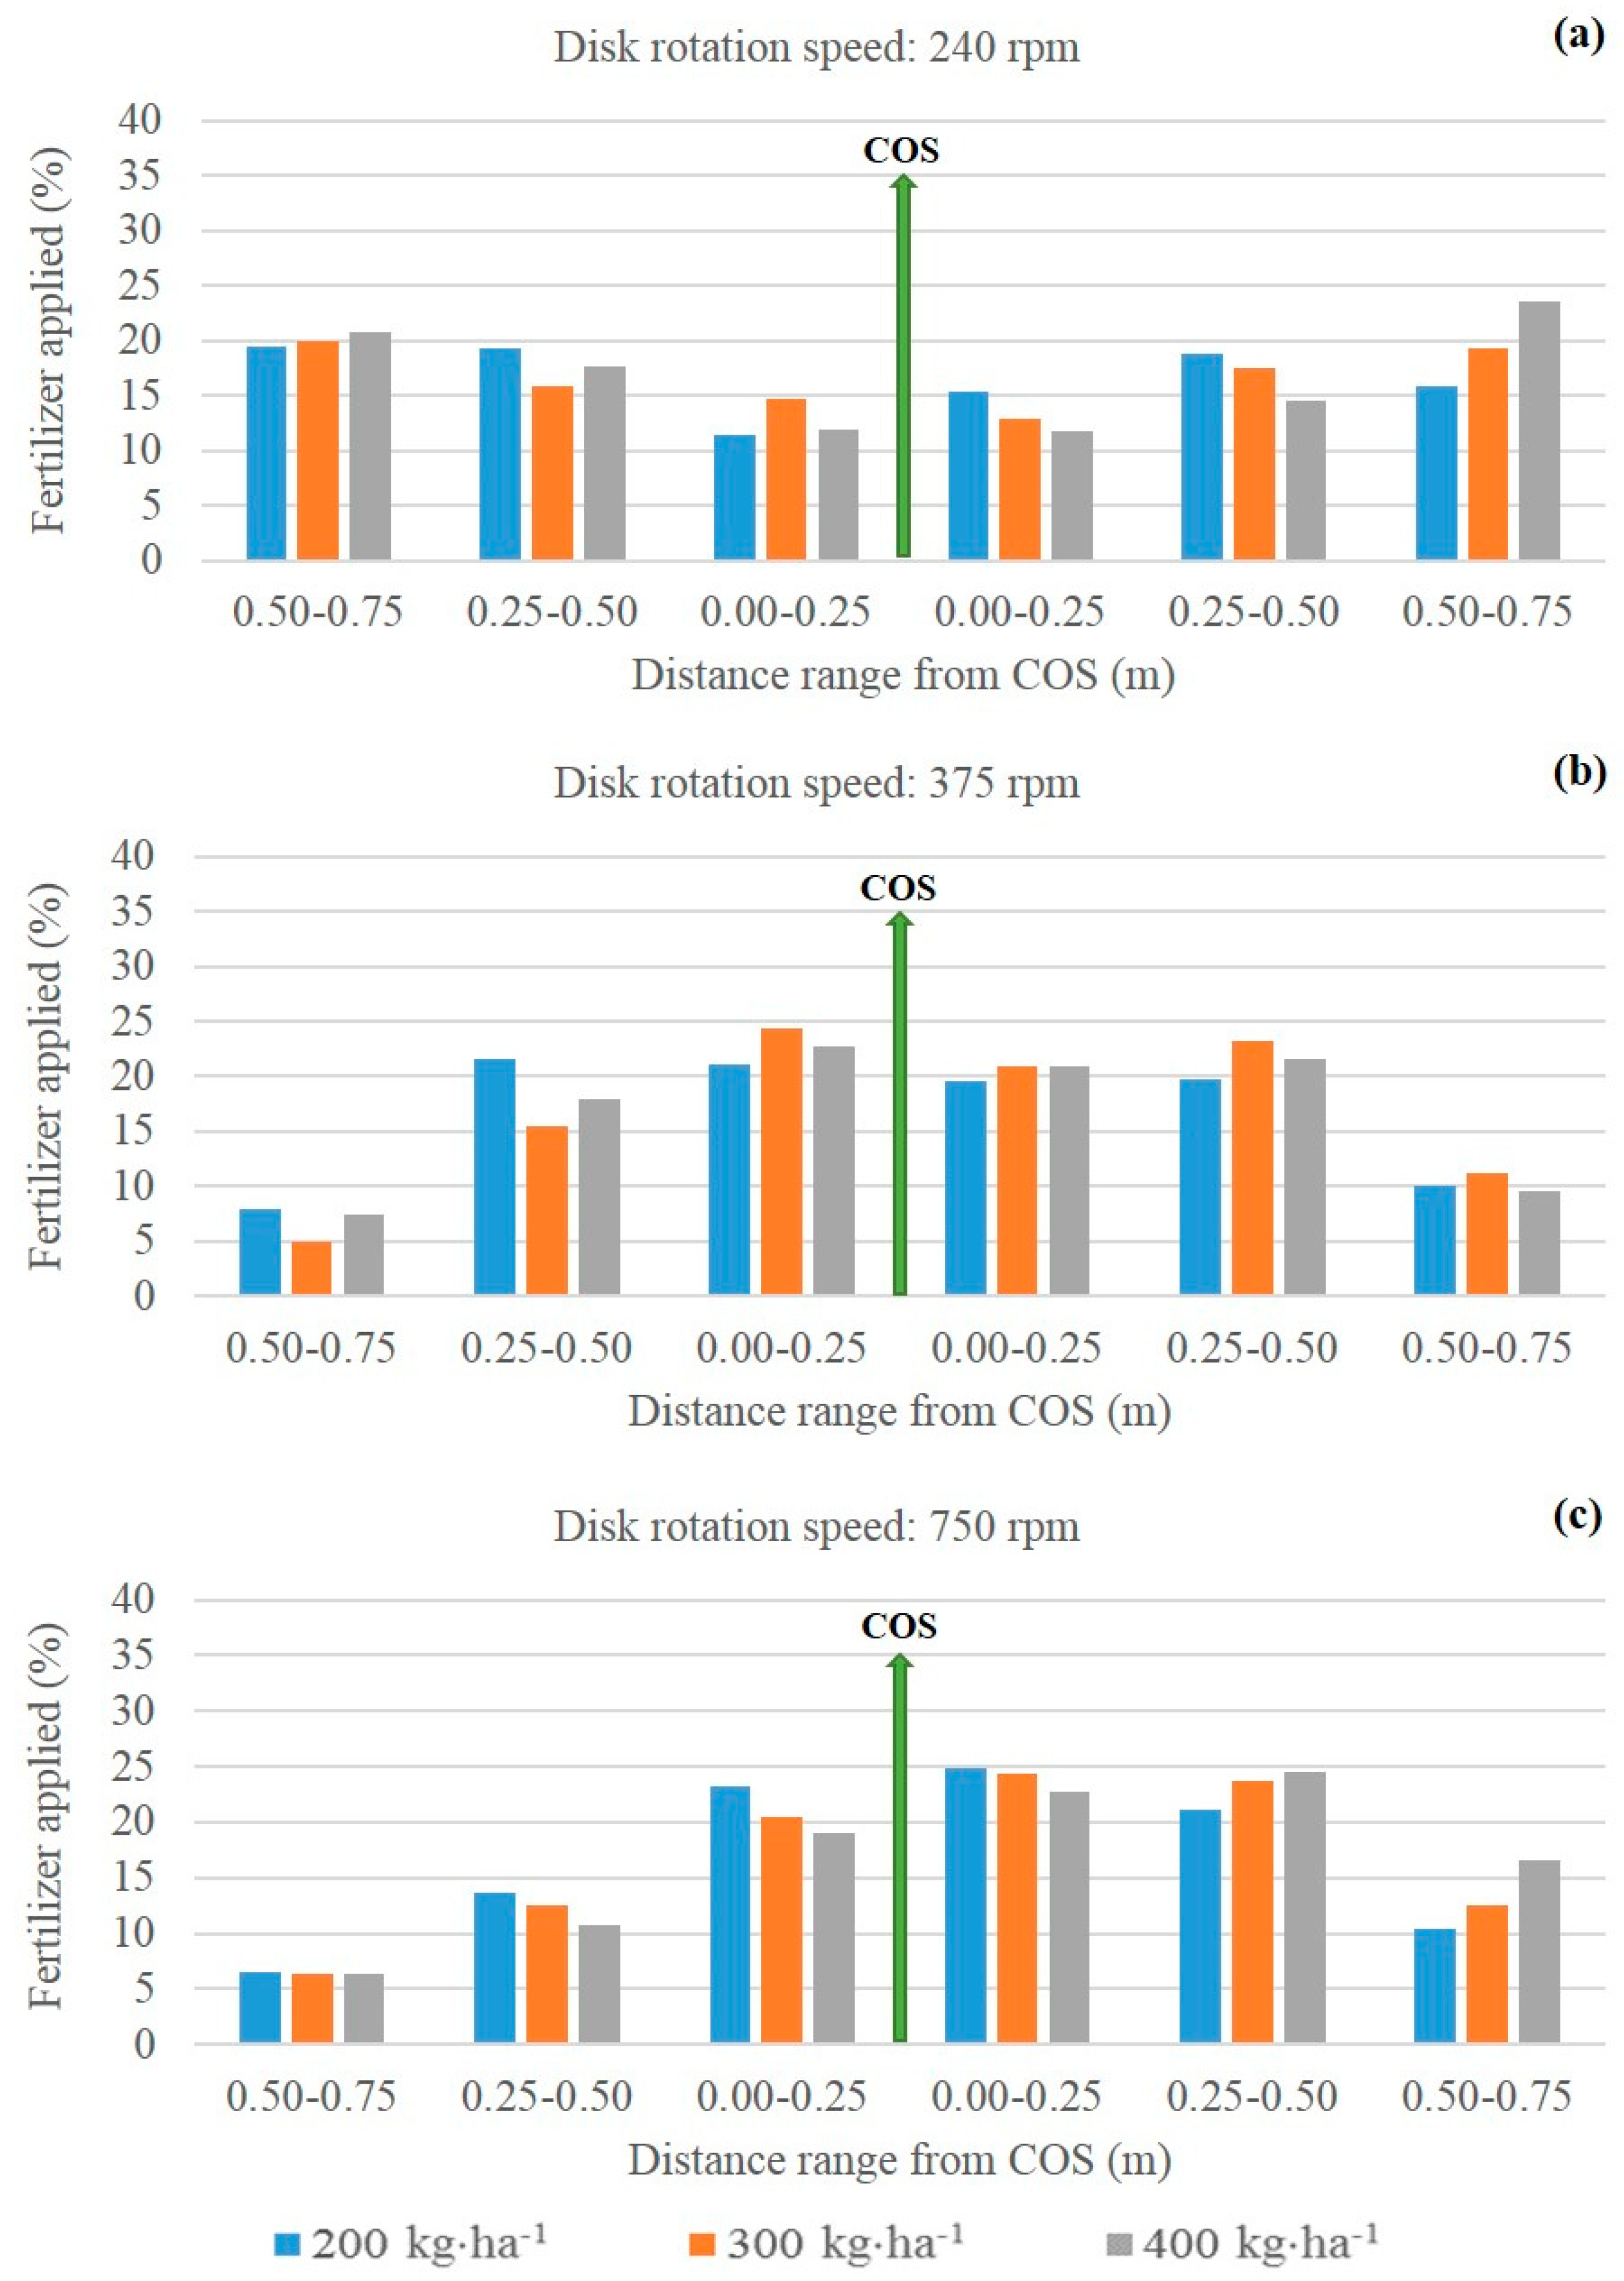
3.2. Distribution Profile
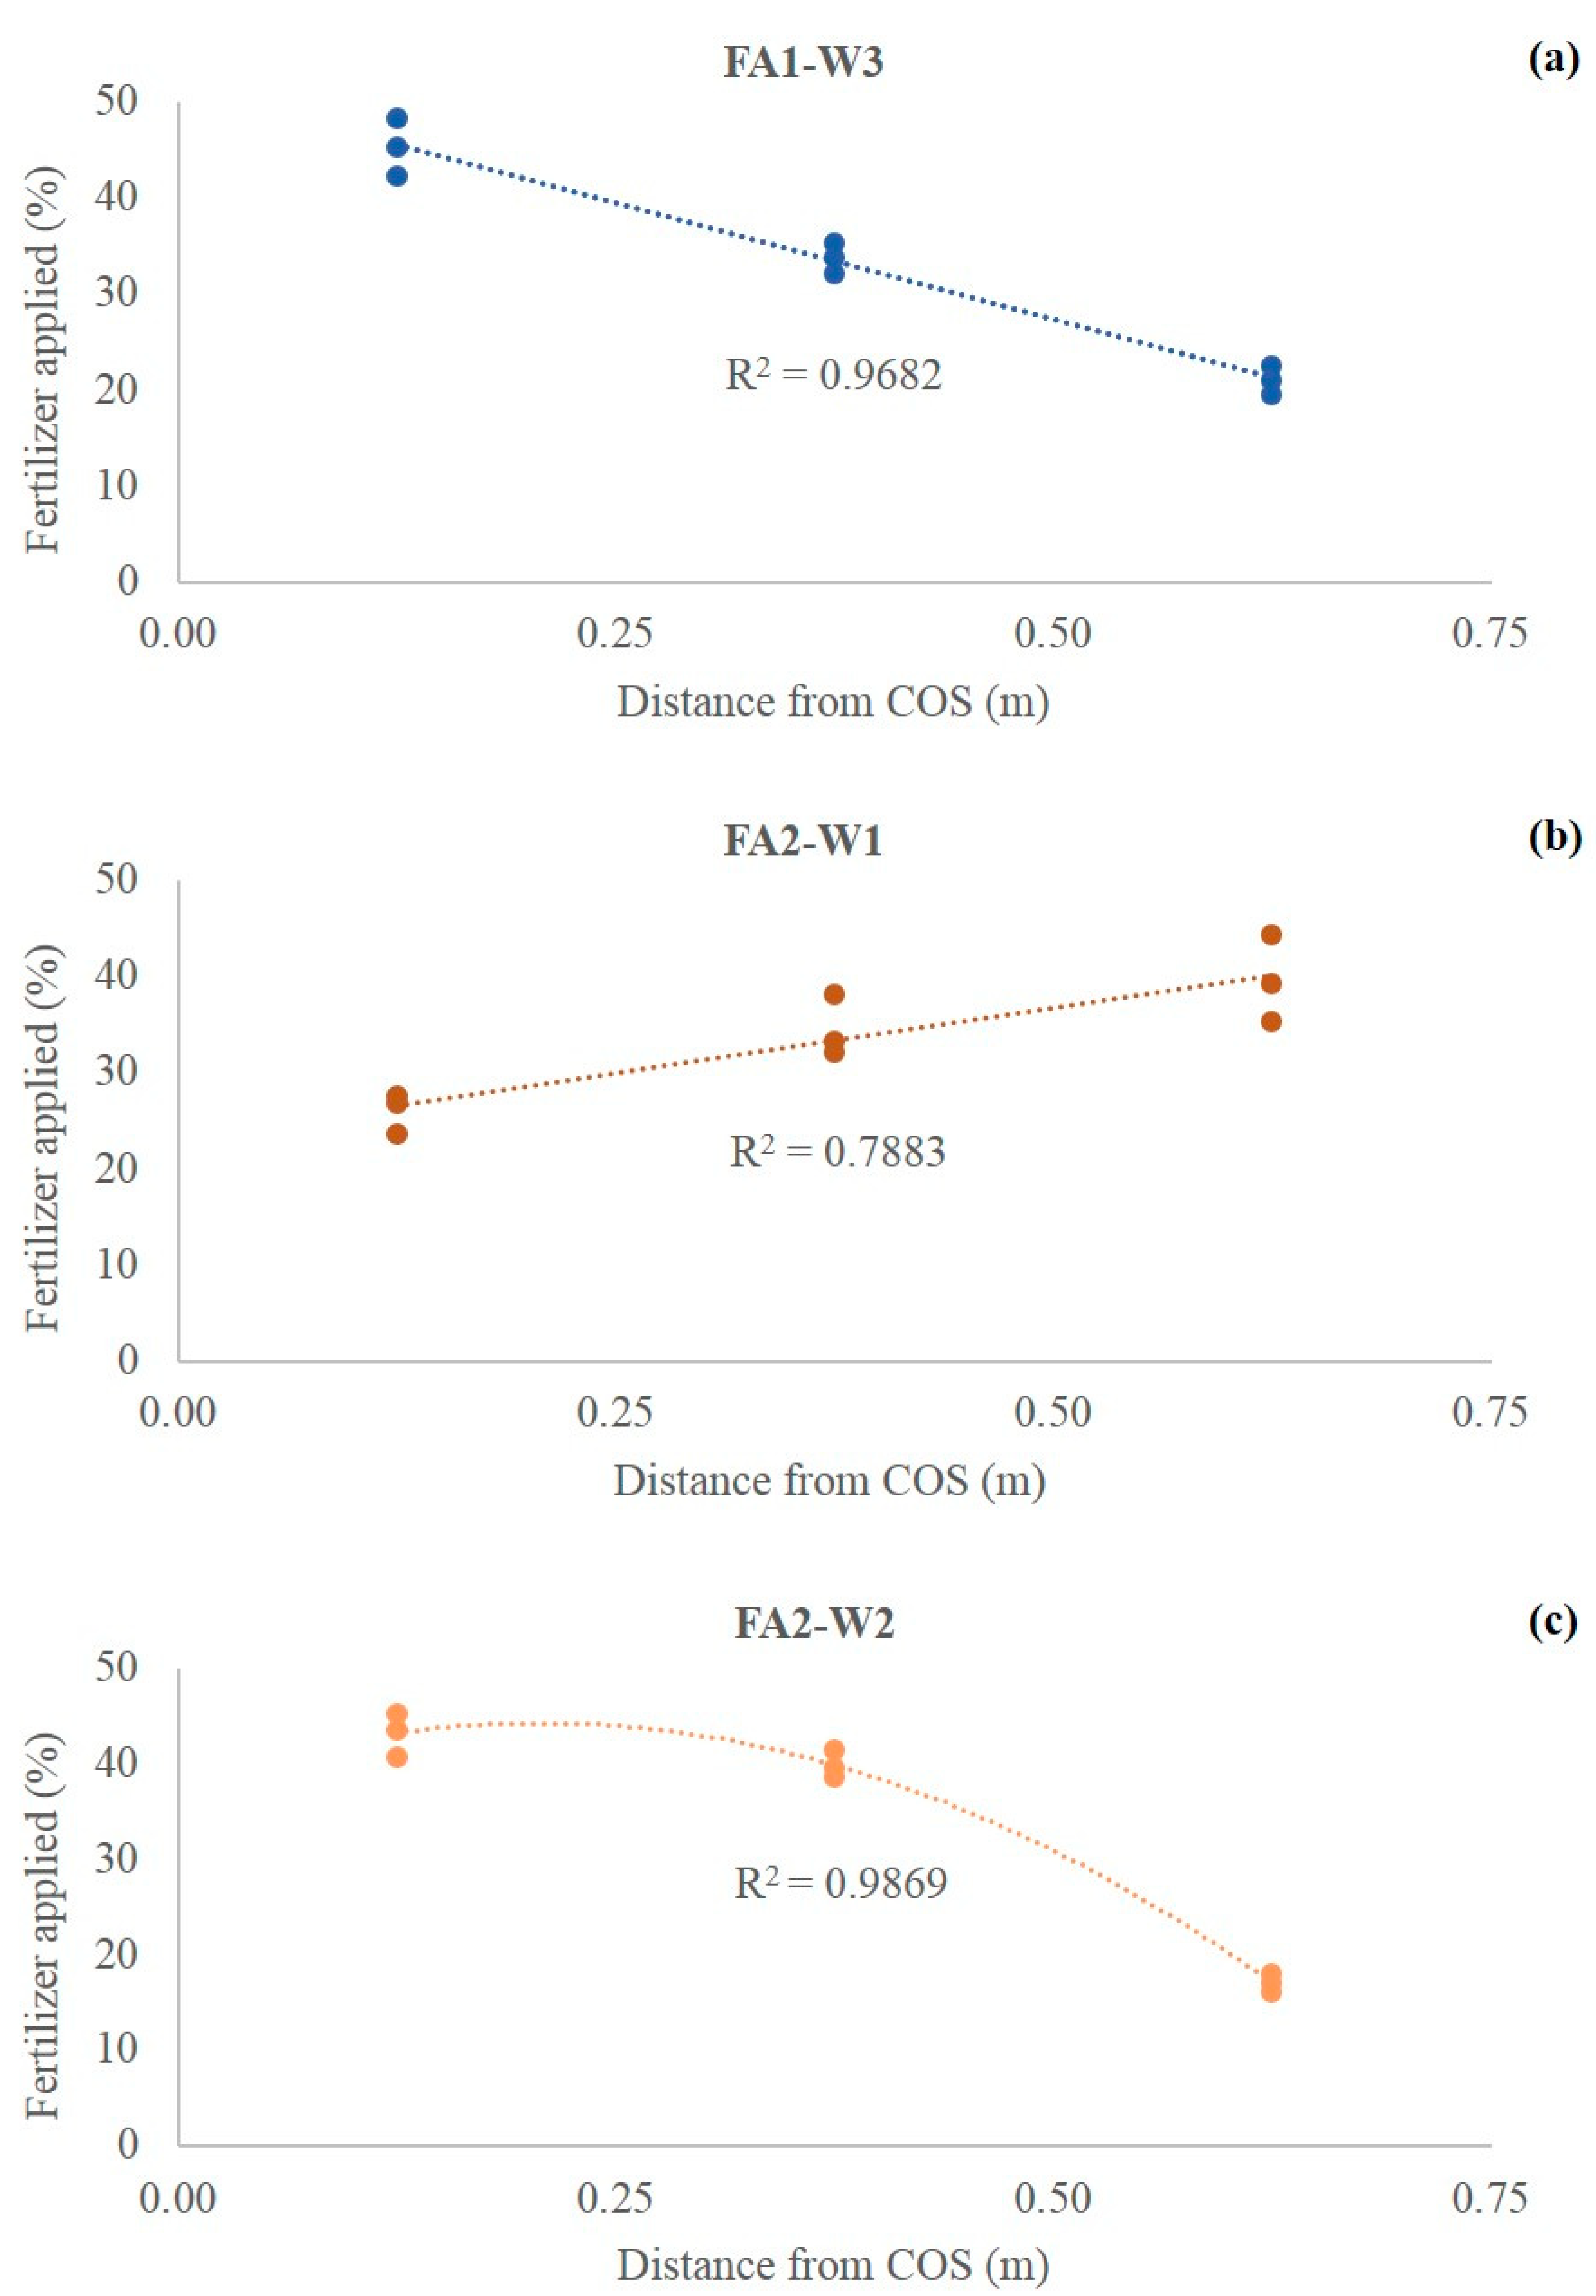
Based on the relation between the collector position and the weight of the fertilizer collected, for each treatment, histograms were constructed for the transverse distribution profile of fertilizer under the coffee plants. The distribution profile histograms for the operating mode FA1 at disk rotation speeds of 240, 375 and 750 rpm are presented in Figure 4. The analysis of the fertilizer distribution profile for each rotation speed tested revealed a displacement of the fertilizer concentration from left to right with increasing disk rotation speed. For rotation speeds of 240 rpm (Figure 4a) and 375 rpm (Figure 4b), there was a higher fertilizer accumulation on the left side of the COS, which was the side the spreader traveled. This occurred because at lower rotation speeds, the spreader tends to distribute the product over a shorter distance. In contrast, at 750 rpm (Figure 4c), the distribution profile revealed a balanced fertilizer application on both sides of the coffee plants, which is more appropriate. In addition, the fertilizer accumulation near the COS was higher for this rotation speed.
The distribution profile histograms for the operating mode FA2 are presented in Figure 5. At 240 rpm (Figure 5a), the fertilizer distribution was more uniform across the different distance ranges from the COS, although less fertilizer was applied to the strip closest to the COS. When the disk rotation speed was increased to 375 rpm (Figure 5b), the percentage of fertilizer applied closer to the COS increased. At 750 rpm (Figure 5c), the same trend of higher fertilizer application close to the COS was observed, but the right side of coffee plants received more fertilizer.
Visually, no relevant differences in the transverse distribution profiles were observed between the different fertilizer doses. Different doses had similar histograms for the same operating mode and disk rotation speed. Overall, the fertilizer distribution profile can be changed by changing the disk rotation speed, knowing that the distribution profile varies with the operating mode.
The average percentages of fertilizer applied to each side of the coffee plants for the three fertilizer doses tested are presented in Table 1. For FA1, with a disk rotation speed of 240 or 375 rpm, the fertilizer accumulation was higher on the left side of the coffee plants, as observed in the histograms. This was expected for lower disk rotation speeds, as the initial speed of the fertilizer particles is lower, which decreases the horizontal spread distance and results in fertilizer application closer to the spreader. For FA2, this accumulation should be more balanced, as the spreader applies fertilizer to both sides of the coffee plants, and there is an overlap in fertilizer application. However, at 750 rpm, the fertilizer application was higher on the right side of the plant. This may have been due to external factors such as terrain irregularities and the placement of the coffee plant stems.
Balanced application of fertilizer to both sides of the plant was observed for FA1 with a disk rotation speed of 750 rpm and for FA2 with a disk rotation speed of 240 and 375 rpm. This is the desired result because a balanced distribution favors the uniform growth of coffee roots, which creates beneficial conditions for coffee plants.

3.3. Data Analysis

According to the analysis of variance, the only significant interaction observed was for collector position and disk rotation speed. This indicates that the transverse distribution profile of the fertilizer changes with disk rotation speed, as is observed in the histograms.
The interaction between collector position and fertilizer dose was not significant, indicating that the transverse distribution profile was independent of the fertilizer dose. This is important, as the spreader can apply fertilizers at a variable rate. Therefore, when working with different recommended fertilizer doses, the only ongoing adjustment necessary for a given area would be to change the conveyor flow, which is performed automatically by the control system. This result represents an important finding because it secures that performing the disk rotation speed setting according to the methodology proposed in this study, the distribution profile remains unchanged in dynamic condition with fertilizer dose variation.
The Scott–Knott test (p ≤ 0.05) results for the interaction between collector position and disk rotation speed are presented in Table 2.
The results showed high variability in the distribution profiles related to the variation in the disk rotation speed. However, two treatments presented the same trend: FA1 at 750 rpm (FA1-W3) and FA2 at 240 rpm (FA2-W1). In both cases, the profile was symmetrical for the two sides of the coffee plants, i.e., positions 3 and 4 (0 to 0.25 m from the COS), 2 and 5 (0.25 to 0.50 m from the COS) and 1 and 6 (0.50 to 0.75 m from the COS) were not significantly different according to the Scott–Knott test at p ≤ 0.05. In addition, for treatments FA1-W3 and FA2-W1, there were only two groups of significantly different values among the six positions.
Treatment FA2 with a disk rotation speed of 375 rpm (FA2-W2) showed a similar distribution profile compared with treatment FA1-W3, except for positions 1 and 6, which were significantly different.

3.4. Fertilizer Distribution Uniformity

Considering the fertilizer distribution uniformity, the coefficient of variation (CV) of the distribution profiles is an effective indicator. The CVs for the treatments tested are presented in Table 3.
A distribution profile with CV values lower than 33% can be considered sufficiently uniform, which means it will not affect crop yield [18]. The CVs found in the present study were above this value for most treatments. However, a caveat was because the study was performed in the field and the stems and leaves of the coffee plants affected the distribution uniformity. Baio, Molin and Leal (2012) [12], comparing the transverse distribution profile of fertilizer applied in a cultivated field and in an open field, observed that the distribution uniformity could be affected by the interception of fertilizer particles by the plants. Another point to be considered is that the spreader evaluated in the present study had deflectors at the disk exit that were used to direct the fertilizer towards the soil. Although this type of equipment is often used in coffee plantations, it may have a negative effect on the distribution uniformity because the deflectors change the trajectory of the fertilizer particles.
Farret et al. (2008) [19] tested different effective widths, operational adjustments and types of applied products in an attempt to make the transverse distribution pattern more uniform and increase the effective width of a centrifugal spreader. The CV of the distribution profile increased rapidly with increasing effective width, reaching 65% for a 14 m width. Similarly, Reynaldo et al. (2016) [20] found a CV higher than 40% for the application of chlorinated urea with an effective width of 30 m. Consistent with the present study, these results show the complexity of the operation, which is affected by several factors that compromise the distribution uniformity.
Of the analyzed treatments, the most favorable was FA2-W1 with the highest CV of 26.3% for a fertilizer dose of 400 kg ha−1. Another treatment with satisfactory results was FA1-W3, as it showed a CV only slightly greater than 33% for a fertilizer dose of 200 kg ha−1. This was in accordance with the Scott–Knott test results for the two treatments (Table 2), which grouped the means for all collectors into only two groups. In addition, the distribution profile was symmetrical, which is a favorable characteristic for coffee plants. Treatment FA2-W2 may be considered acceptable because although the CVs were above 33%, the highest was 41.7%. As previously discussed, because the experiment was performed in a plantation and was affected by several external factors, slightly higher CVs were expected compared with those reported in the literature, which were obtained under controlled conditions.
It may therefore be stated that for fertilizer application on only one side of the coffee plants, the distribution uniformity was highest with a disk rotation speed of 750 rpm, whereas for fertilizer application on both sides of the coffee plants, the uniformity was highest with a disk rotation of 240 rpm, followed by a rotation speed of 375 rpm, which produced a satisfactory result.

3.5. Fertilizer Distribution Characterization in Coffee Plantation

Based on the results of the distribution uniformity, the three most satisfactory treatments (FA1-W3, FA2-W1 and FA2-W2) were selected and related to the morphologic characteristics of the coffee plants. Regression graphs were generated for the distribution profile (Figure 6), where values for the collector positions in a given range of distances from the COS were added, and the percentage of fertilizer collected was related to its distance from the COS.
A linear regression was fitted to treatments FA1-W3 (Figure 6a) and FA2-W1 (Figure 6b). However, the two treatments showed opposite distribution profiles. In the FA1-W3, the fertilizer accumulated close to the COS, while in the FA2-W1 it accumulated close to the plant border. For the two treatments, approximately 1/3 of the fertilizer was distributed on the strip between 0.25 and 0.50 m from the COS.
For treatment FA2-W2 (Figure 6c), a second order polynomial was fitted. Most of the fertilizer was therefore distributed on the strips between 0 and 0.25 m and 0.25 and 0.50 m from the COS, with a lower percentage (16.98%, on average) distributed on the strip between 0.50 and 0.75 m.
The root morphology of coffee plants were considered in this study as an indicator of fertilizer application efficiency related to the plant characteristics. In this role, Ronchi et al. (2015) [16] evaluated four coffee plant varieties (Coffea arabica L.) and stated that the root concentration and nutrient uptake capacity are higher close to the COS. Motta et al. (2006) [15] obtained similar results and recommended that, in the studied coffee plantations, the location of fertilizer application be changed from the canopy projection area to the area under the canopy.
When relating the information presented in Figure 6 with the studies on the root morphology of coffee plants, the most appropriate treatments were FA1-W3 and FA2-W2, as a higher percentage of the fertilizer was distributed close to the COS, where the roots are more concentrated.
In this context, considering the symmetry of the distribution profiles indicated by the Scott–Knott test (Table 2) and the distribution uniformity indicated by the CVs (Table 3), treatment FA1-W3 produced the best results. This is because this treatment simultaneously allows a balanced application of fertilizer between the two sides of the plant, a uniform fertilizer distribution and an application at the most appropriate location relative to coffee plant roots.

4. Conclusions

The method proposed by the present study for the evaluation of the transverse distribution of fertilizer on coffee crops was practical and efficient.
An analysis of the transverse distribution profile revealed that the most appropriate treatments were FA1-W3 and FA2-W2 because they presented symmetrical profiles and lower CVs, indicating a more uniform distribution.
When the transverse distribution profiles were related to the root morphologic characteristics of coffee plants, the most appropriate treatments were FA1-W3 and FA2-W2.
The best treatment was FA1-W3, as it produced a balanced application of fertilizer on both sides of the coffee plants, a uniform distribution profile and application of fertilizer to the most appropriate location.

Author Contributions

Conceptualization, A.D.A., G.A.e.S.F. and M.M.d.B.; methodology, A.D.A., G.A.e.S.F. and M.M.d.B., F.M.d.S.; software, A.D.A. and R.d.O.F.; investigation, A.D.A; resources, A.D.A., R.d.O.F.; data curation, A.D.A., G.A.e.S.F. and M.M.d.B.; writing–original draft preparation, all authors; writing–review and editing, all authors; funding acquisition, G.A.e.S.F., D.S., M.V. All authors have read and agreed to the published version of the manuscript.

Funding

This research received no external funding.

Acknowledgments

The main author would like to thank the Coordenação de Aperfeiçoamento de Pessoal de Nível Superior–Brasil (CAPES) for the scholarship received during the research period. The authors also would like to thank the Federal University of Lavras and the University of Florence for supporting this research.

Conflicts of Interest

The authors declare no conflict of interest.

References

  1. Rocha, H.G.; Silva, A.B.D.; Nogueira, D.A.; Miranda, J.M.; Mantovani, J.R. Mapeamento da produtividade do cafeeiro a partir de modelos matemáticos de previsão de safra. Coffee Sci. 2016, 11, 108–116. [Google Scholar]
  2. Molin, J.P.; Motomiya, A.V.A.; Frasson, F.R.; Faulin, G.D.C.; Tosta, W. Test procedure for variable rate fertilizer on coffee. Acta Sci. Agron. 2010, 32, 569–575. [Google Scholar] [CrossRef] [Green Version]
  3. Turco, P.H.N.; Esperancini, M.S.T.; Bueno, O.D.C.; Oliveira, M.D.M. Economic profitability in conventional and irrigated coffee production systems in three municipalities in the Marilia region of São Paulo, Brazil. Cienc. Rural 2017, 47, 1–7. [Google Scholar] [CrossRef] [Green Version]
  4. Dalacort, R.; Stevan, S.L. Mobile helical capacitive sensor for the dynamic identification of obstructions in the distribution of solid mineral fertilizers. Sensors 2018, 18, 3991. [Google Scholar] [CrossRef] [PubMed] [Green Version]
  5. Alameen, A.A.; Al-Gaadi, K.A.; Tola, E. Development and performance evaluation of a control system for variable rate granular fertilizer application. Comput. Electron. Agric. 2019, 160, 31–39. [Google Scholar] [CrossRef]
  6. Reyes, J.F.; Esquivel, W.; Cifuentes, D.O.R. Field testing of an automatic control system for variable rate fertilizer. Comput. Electron. Agric. 2015, 113, 260–265. [Google Scholar] [CrossRef]
  7. Ferraz, G.A.S.; Silva, F.M.; Oliveira, M.S.; Avelar, R.C.; Sales, R.S. Variabilidade espacial da dose de P2O5 e K2O para adubação diferenciada e convencional em lavoura cafeeira. Coffee Sci. 2015, 10, 346–356. [Google Scholar]
  8. Oliveira, R.B.D.; Lima, J.S.S.; Xavier, A.C.; Passos, R.R.; Silva, S.A.; Silva, A.F. Comparação entre métodos de amostragem do solo para recomendação de calagem e adubação do cafeeiro conilon. Eng. Agrícola 2008, 28, 176–186. [Google Scholar] [CrossRef] [Green Version]
  9. Barros, M.M.; Volpato, C.E.S.; Silva, F.C.; Palma, M.A.Z.; Spagnolo, R.T. Avaliação de um sistema de aplicação de fertilizantes a taxa variável adaptado à cultura cafeeira. Coffee Sci. 2015, 10, 223–232. [Google Scholar]
  10. Machado, O.D.C.; Alonçol, A.S.; Francettol, T.R.; Carpesl, D.P. Acurácia e tempos de resposta de máquinas para aplicação de defensivos agrícolas à taxa variável. Cienc. Rural 2015, 45, 440–449. [Google Scholar] [CrossRef] [Green Version]
  11. Mialhe, L.G. Máquinas Agrícolas; Ensaios & Certificação; Shekinah: São Paulo, Brazil, 1996; 722p. [Google Scholar]
  12. Baio, F.H.R.; Molin, J.P.; Leal, A.J.F. Avaliação comparativa da distribuição transversal de adubos sólidos aplicados em cobertura em culturas anuais instaladas. Biosci. J. 2012, 28, 527–536. [Google Scholar]
  13. Barros, M.M.; Volpato, C.E.S.; Silva, F.M.; Conceição, F.G.; Corrêa, D.J.; Ribeiro, L.F. Performance of a variable-rate distribution system for simultaneous fertilizer application. Rev. Bras. Eng. Agríc. Ambient. 2016, 20, 188–192. [Google Scholar] [CrossRef] [Green Version]
  14. Rosa, D.P.; Pagnussat, L.; Alves, A.; Pesini, F.; Spagnolo, R.T. Methodology to evaluate the fertilizer distribution by helical doser from seed planter. J. Exp. Agric. Int. 2019, 31, 1–7. [Google Scholar] [CrossRef] [Green Version]
  15. Motta, A.C.V.; Nick, J.A.; Yorinori, G.T.; Serrat, B.M. Distribuição horizontal e vertical da fertilidade do solo e das raízes de cafeeiro (Coffea arabica L.) cultivar Catuaí. Acta Sci. Agron. 2006, 28, 455–463. [Google Scholar] [CrossRef] [Green Version]
  16. Ronchi, C.P.; Souza-Júnior, J.M.; Almeida, W.L.; Souza, D.S.; Silva, N.O.; Oliveira, L.B.; Moura-Guerra, A.M.N.; Ferreira, P.A. Morfologia radicular de cultivares de café arábica submetidas a diferentes arranjos espaciais. Pesq. Agropec. Bras. 2015, 50, 187–195. [Google Scholar] [CrossRef] [Green Version]
  17. Ferreira, D.F. Sisvar: A computer statistical analysis system. Ciênc. Agrotec 2011, 35, 1039–1042. [Google Scholar] [CrossRef] [Green Version]
  18. Valdez, E. Determinacion y estudio de los perfiles de distribuicion de superfosfato, hiperfosfato y urea granulados, aplicados com la fertilizadora centrifuga. Agrinter 1978, 14, 1–42. [Google Scholar]
  19. Farret, I.S.; Schlosser, J.F.; Durigon, R.; Werner, V.; Knob, M. Variação da regulagem no perfil transversal de aplicação com distribuidores centrífugos. Cienc Rural 2008, 38, 1886–1892. [Google Scholar]
  20. Reynaldo, E.F.; Machado, T.M.; Taubinger, L.; Quadros, D. Distribuição de fertilizantes a lanço em função da qualidade do insumo. Energ. Agric. 2016, 31, 24–30. [Google Scholar] [CrossRef] [Green Version]
Figure 1. Farm location and field delimitation.
Agronomy 10 00601 g001
Figure 2. Machine evaluated and its interaction with coffee plants.
Agronomy 10 00601 g002
Figure 3. Scheme representing collector placement under the coffee trees.
Agronomy 10 00601 g003
Figure 4. Transverse distribution profile histograms showing the percentage of fertilizer applied to different distance ranges from the coffee plant’s orthotropic stem (COS) for application on one side of the coffee plants (FA1) at three fertilizer doses and three spreading disk rotation speeds: (a) 240 rpm; (b) 375 rpm; (c) 750 rpm. * Positions located on the side of the coffee plants where the spreader travels when applying fertilizer.
Agronomy 10 00601 g004
Figure 5. Transverse distribution profile histograms showing the percentage of fertilizer applied to different distance ranges from the coffee plant’s orthotropic stem (COS) for application on both sides of the coffee plants (FA2) at three fertilizer doses and three spreading disk rotation speeds: (a) 240 rpm; (b) 375 rpm; (c) 750 rpm.
Agronomy 10 00601 g005
Figure 6. Regression slopes for the percentage of fertilizer applied relative to the distance from the orthotropic stem of the coffee plants (COS) showing the average values for each fertilizer dose (200, 300 and 400 kg ha−1) and considering the following treatments: (a) FA1-W3, application on one side of coffee plants at a disk rotation speed of 750 rpm; (b) FA2-W1, application on both sides of coffee plants at a disk rotation speed of 240 rpm; (c) FA2-W2, application on both sides of coffee plants at a disk rotation speed of 375 rpm.
Agronomy 10 00601 g006
Table 1. Percentage of fertilizer applied to each side of the coffee plants for the two operating modes and the three spreading disk rotation speeds tested.
Disk Rotation Speed (rpm)FA1 1FA2 2
Left (%)Right (%)Left (%)Right (%)
24083.9416.0650.2649.74
37574.4025.6047.7652.24
75048.1051.9039.6960.31
1 Application on one side of coffee plants (left). 2 Application on both sides of coffee plants.
Table 2. The average fertilizer weight collected (g) at each collector position for different disk rotation speeds.
Collector PositionFA1 1FA2 2
Disk Rotation Speed (rpm)
240375750240375750
19.62 d3.84 c1.97 a5.65 b2.12 a1.32 a
28.64 d9.13 d3.46 b4.82 b5.71 c2.47 b
37.72 d11.96 e5.06 b3.55 a6.91 c4.22 c
43.19 c5.28 c4.73 b3.56 a6.27 c4.90 c
51.41 b2.33 b3.90 b4.51 b6.54 c5.08 c
60.37 a0.97 a2.63 a5.78 b3.11 b2.84 b
Values followed by the same letter within the same column are not significantly different according to the Scott–Knott test at p ≤ 0.05. 1 Application on one side of coffee plants. 2 Application on both sides of coffee plants.
Table 3. Coefficients of variation (%) of the fertilizer transverse distribution profiles for the different treatments tested.
Fertilizer Dose (kg·ha−1)FA1 1FA2 2
Disk Rotation Speed (rpm)
240375750240375750
20075.572.436.317.233.341.1
30060.273.625.815.041.739.9
40078.763.732.726.335.938.5
1 Application on one side of coffee plants. 2 Application on both sides of coffee plants.

