1. Introduction
The globalization in the floricultural sector and the leadership of the Netherlands’ floriculture system [
1] create more competition, challenging the innovation and the reorganization of the floricultural sector. The increasingly hypercompetitive markets and decreasing profit margins of nurseries have required continual analysis of production and marketing systems [
2,
3]. Thereby, some ornamental horticultural nurseries have recently started to look at flowers as food products, like a new type of vegetables [
4], both to react to the crisis in the sector by diversifying their product, but also to satisfy the increasing demand for more attractive and high quality foodstuff [
5,
6,
7]. Studies on edible flowers have been growing in recent years. There are more than 700 studies from 2011 to date, with a growing number in the last three years, showing an increasing interest in edible flowers (Scopus database).
Flowers are rich in a great variety of natural antioxidants, including flavonoids, anthocyanins, and many other compounds [
8,
9,
10]. Since many of the edible flowers contain healthy components, they have a potential to be developed as a new crop with health benefits [
11,
12,
13].
Another key success factor for the nurseries is to examine the inseparable factors of efficient input use, cost savings, enhanced product quality, and the sustainable nature of production or manufacturing practices [
3]. Nowadays, the heightened awareness of the critical trend in resource depletion and in environmental degradation impels us to constantly improve the eco − sustainability of any productive process [
14]. Currently, the evaluation of sustainability is important in the study of agricultural systems, or primary systems, which provide the raw material used in other activities [
15]. For greenhouse growers, sustainable production means applying the best management practices to enhance plant quality and reduce negative environmental impacts while sustaining or increasing profits [
3]. It can be very useful to acquire information about the sustainability of a basic production system to quantify and compare those connected to it [
15]. Moreover, in a society increasingly directed towards organic and sustainable products, with increasing focus on the environmental burden, this type of assessment could become very useful for both producers and consumers, giving additional value to the analyzed products in terms of eco − sustainability [
16,
17]. Life Cycle Assessment (LCA) is a standardized methodology for investigating the environmental impact of a product, a production process, or a system [
18,
19], by identifying and quantifying objectively and transparently inputs and outputs of energy and material usage, and their associated environmental impacts, in order to reduce them [
16,
20]. LCA application is defined by a normative reference, represented by the ISO (International Organization for Standardization) norms 14040:2006 and 14044:2018 [
15,
21].
LCA has been used to assess the production system components of various types of nursery crop groups, such as trees and shrubs [
3,
22], vegetables [
23,
24,
25], wine [
26], fruits, and berries [
27,
28,
29], to determine their respective contributions to emissions and variable costs of inputs and processes in the green industry [
22].
At present, few LCA studies have been carried out in the floricultural sector if compared to those of other agricultural products [
19,
30]. These studies analyze the greenhouse gases (GHG) emissions of the production cycles of cut flowers and ornamental plants (e.g., roses, lilies, cyclamens) [
16,
19], comparing two or more different plant production systems or nurseries, assessing different scenarios for the reduction of the environmental burdens produced by cultivation [
18,
21,
31], or to review the application of LCA in floriculture [
30]. Specific studies applying the LCA approach to edible flowers are inexistent. This paper aims to fill this gap by analyzing a model production system located in central Italy (Tuscany), and by being a partner of the project Interreg − Alcotra Antea (Innovative activities for the development of the cross − border edible flower supply chain) n. 1139, which is working on edible flowers, and one of the first and biggest realities of edible flower cultivation born and developed in the country. Two edible flowers were chosen among the most produced species:
Begonia x semperflorens − cultorum hort (commonly referred to as
Begonia semperflorens) and
Viola cornuta L. Begonias and pansies, which are often produced and consumed as edible flowers [
5]. These two annual bedding plants differ in their propagation method.
B. semperflorens was assumed to be representative of the species reproduced by cuttings, while
Viola cornuta was representative of species reproduced by seed. The analysis focused on two types of edible flower products to reveal possible differences in environmental impact over the whole production cycle: flowering potted plants and packaged flowers ready to be consumed.
This study can be considered characteristic of a small − scale floricultural production. Impact information related to the individual phases of nursery production systems gained from this work should provide growers key tools to increase production efficiency and minimize the negative environmental impacts [
2], but also help consumers to make environmentally conscious choices about edible flowers.
2. Materials and Methods
2.1. LCA Methodology
Life cycle assessment (LCA) is useful to understand which are the most impactful phases on the environment by simplifying the process [
20,
32], and allowing the evaluation of opportunities for environmental improvements over the whole life cycle [
20]. The impact that a generic product has on the environment is not only caused by the manufacturing process, but it begins at the design and ends at the conclusion of its useful life [
14].
For the LCA study, we followed four main steps [
30,
33]:
Goal and scope definition, where the goal and the scope of the study, the functional unit to which all the outcomes of the LCA are referred, and the system boundaries are identified; [
21];
Life Cycle Inventory (LCI), where the life cycle of edible flowers production is modelled, considering all the inputs and outputs [
20,
34]; this step results in a flow diagram, which contains all the unit processes, quantifying the inflows and outflows of each one of them [
14];
Life Cycle Inventory Analysis (LCIA), where the environmental relevance of all the inputs and outputs of edible flowers production is assessed [
20], so to understand how great is their contribution to the overall environmental load [
14];
Interpretation, which presents the results of the study through the Impact Categories and suggests some possible measures to reduce the burden on the environment [
20,
33].
2.2. Goal, Scope, System Boundaries, and Functional Unit
The purpose of this study was to measure different types of emissions, applying the LCA methodology, of the production process of a flowering potted plant compared to the production of packaged flowers ready to be consumed.
During the analyses of the production system, some of its inputs had to be considered as systems themselves (e.g., the production of vases or machinery). For this reason, to make possible the application of an environmental assessment method, it was necessary to set some boundaries, i.e., virtual limits to select the internal components of the system to analyze [
15]. In this study, we used the “cradle to gate” approach: it considered the product’s life, from the supply and manufacture of the raw materials, following them through all the steps of production, until the completion of the final product [
21].
The definition of a suitable functional unit is crucial for the ability of LCA methods to allow comparisons of alternative goods or services [
19]. To keep the comparison fair, the functional unit should refer to the function fulfilled by each product [
14], that for nursery studies is commonly the number of plants [
18]. However, in this specific case, it was necessary to use a unit of weight, i.e., 1 g of fresh edible flowers, in order to compare the burden caused by the production of a 12.5–25 g package of flowers with the one caused by the growth of a potted plant that can give, with multiple harvests, the same amount of flowers.
2.3. The Model System
In order to apply the LCA method, it is necessary to model the system to be studied through three steps: (1) modelling the studied system; (2) defining the boundaries of the system; (3) quantifying the involved resources [
15].
The Carmazzi’s nursery is located in the Tuscan area known as Versilia, in Italy (43°50’11.6” N; 10°16’54.1” E). Annual rainfall was 898.4 mm for the year 2018, average annual air temperature is 17.5 °C, with February being the coldest month (temperature from 4 °C to 10 °C) and August being the warmest month (temperature from 23 to 29 °C), based on values of the year 2018.
The Carmazzi floricultural company deals with purchase, cultivation, and sale of ornamental and agri − food plants. The total area of the farm is equal to 2.5 ha, and has 29 greenhouses, which cover a 1.4 ha area. The major production is represented by ornamental potted plants (1.7 ha), followed by peppers and chilies (0.85 ha), by edible flowers (0.25 ha), and other minor fruit and vegetables productions. The nursery implements organic farming on edible flowers. Moreover, it is committed to standards and good agricultural practices in order to ensure the best quality in the final product. It obtained the UNI EN ISO 9001:2015 and UNI EN ISO 14001:2015 certifications, the organic certification, and it follows a hygiene and health self − control system (HACCP—Hazard Analysis and Critical Control Point).
2.4. The Production Cycle
A production system model for greenhouse production of edible flowers was obtained through interviews with the nursery’s growers, which were especially helpful to validate the production life cycle.
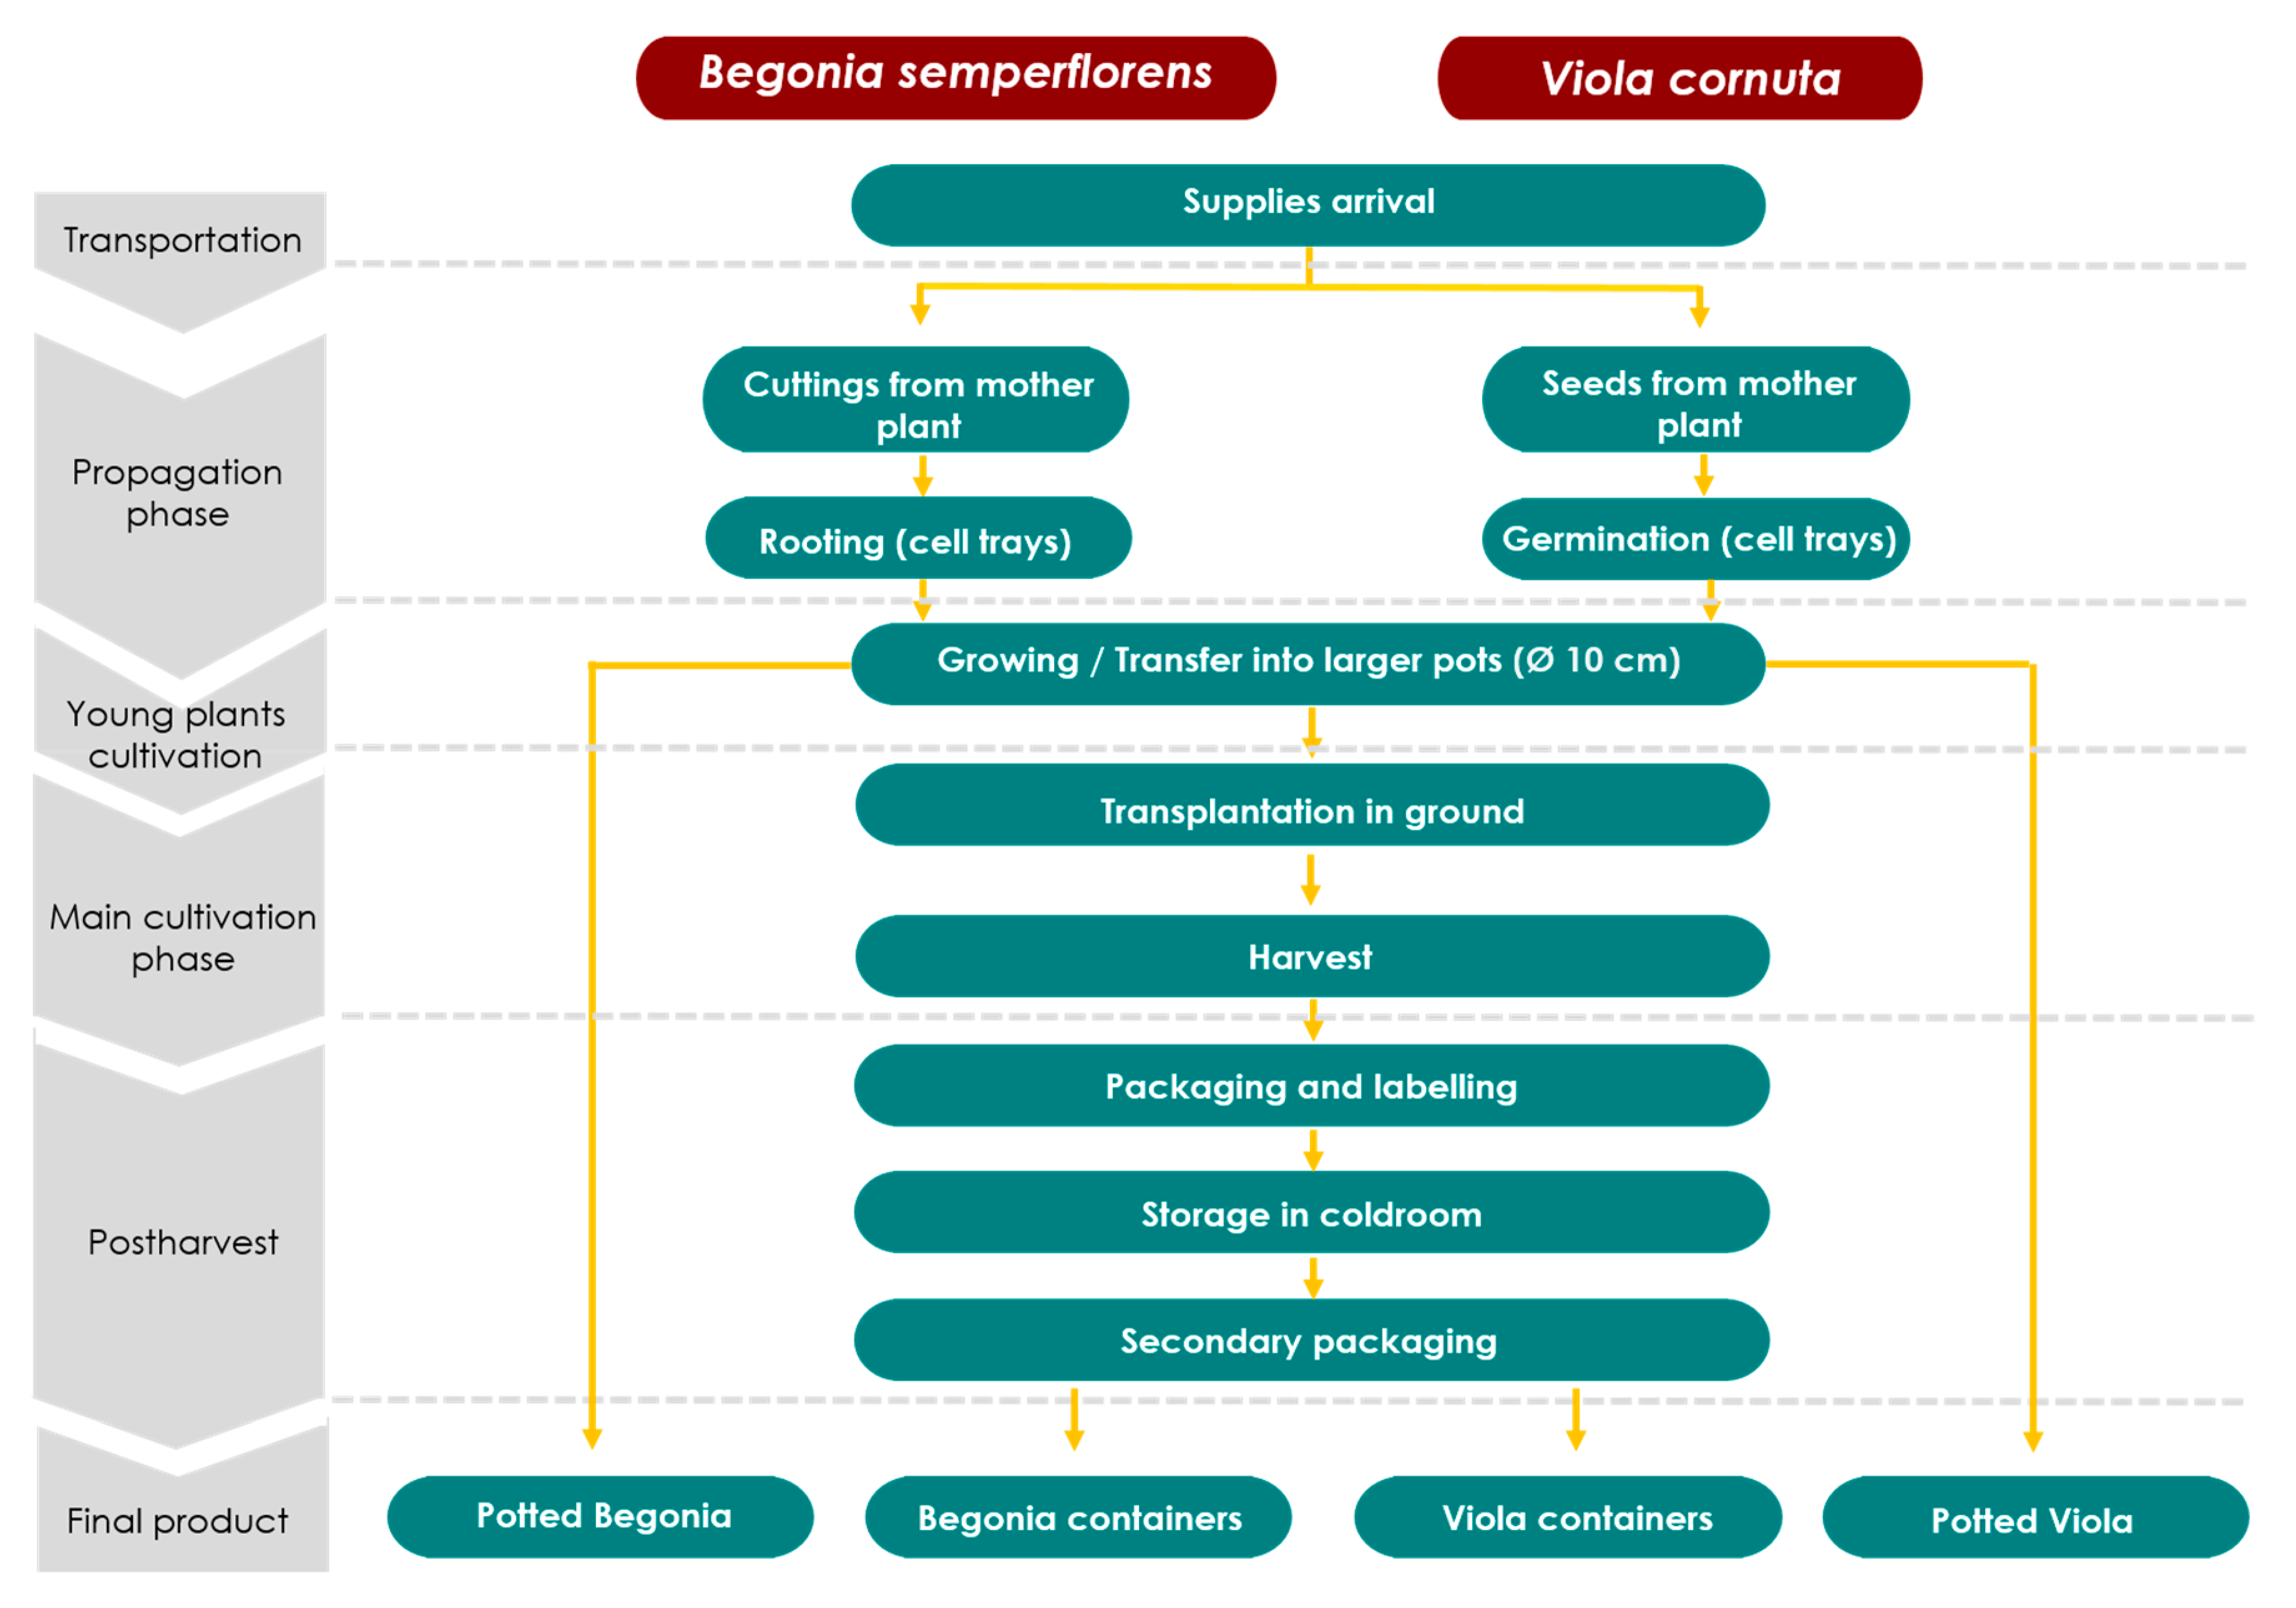
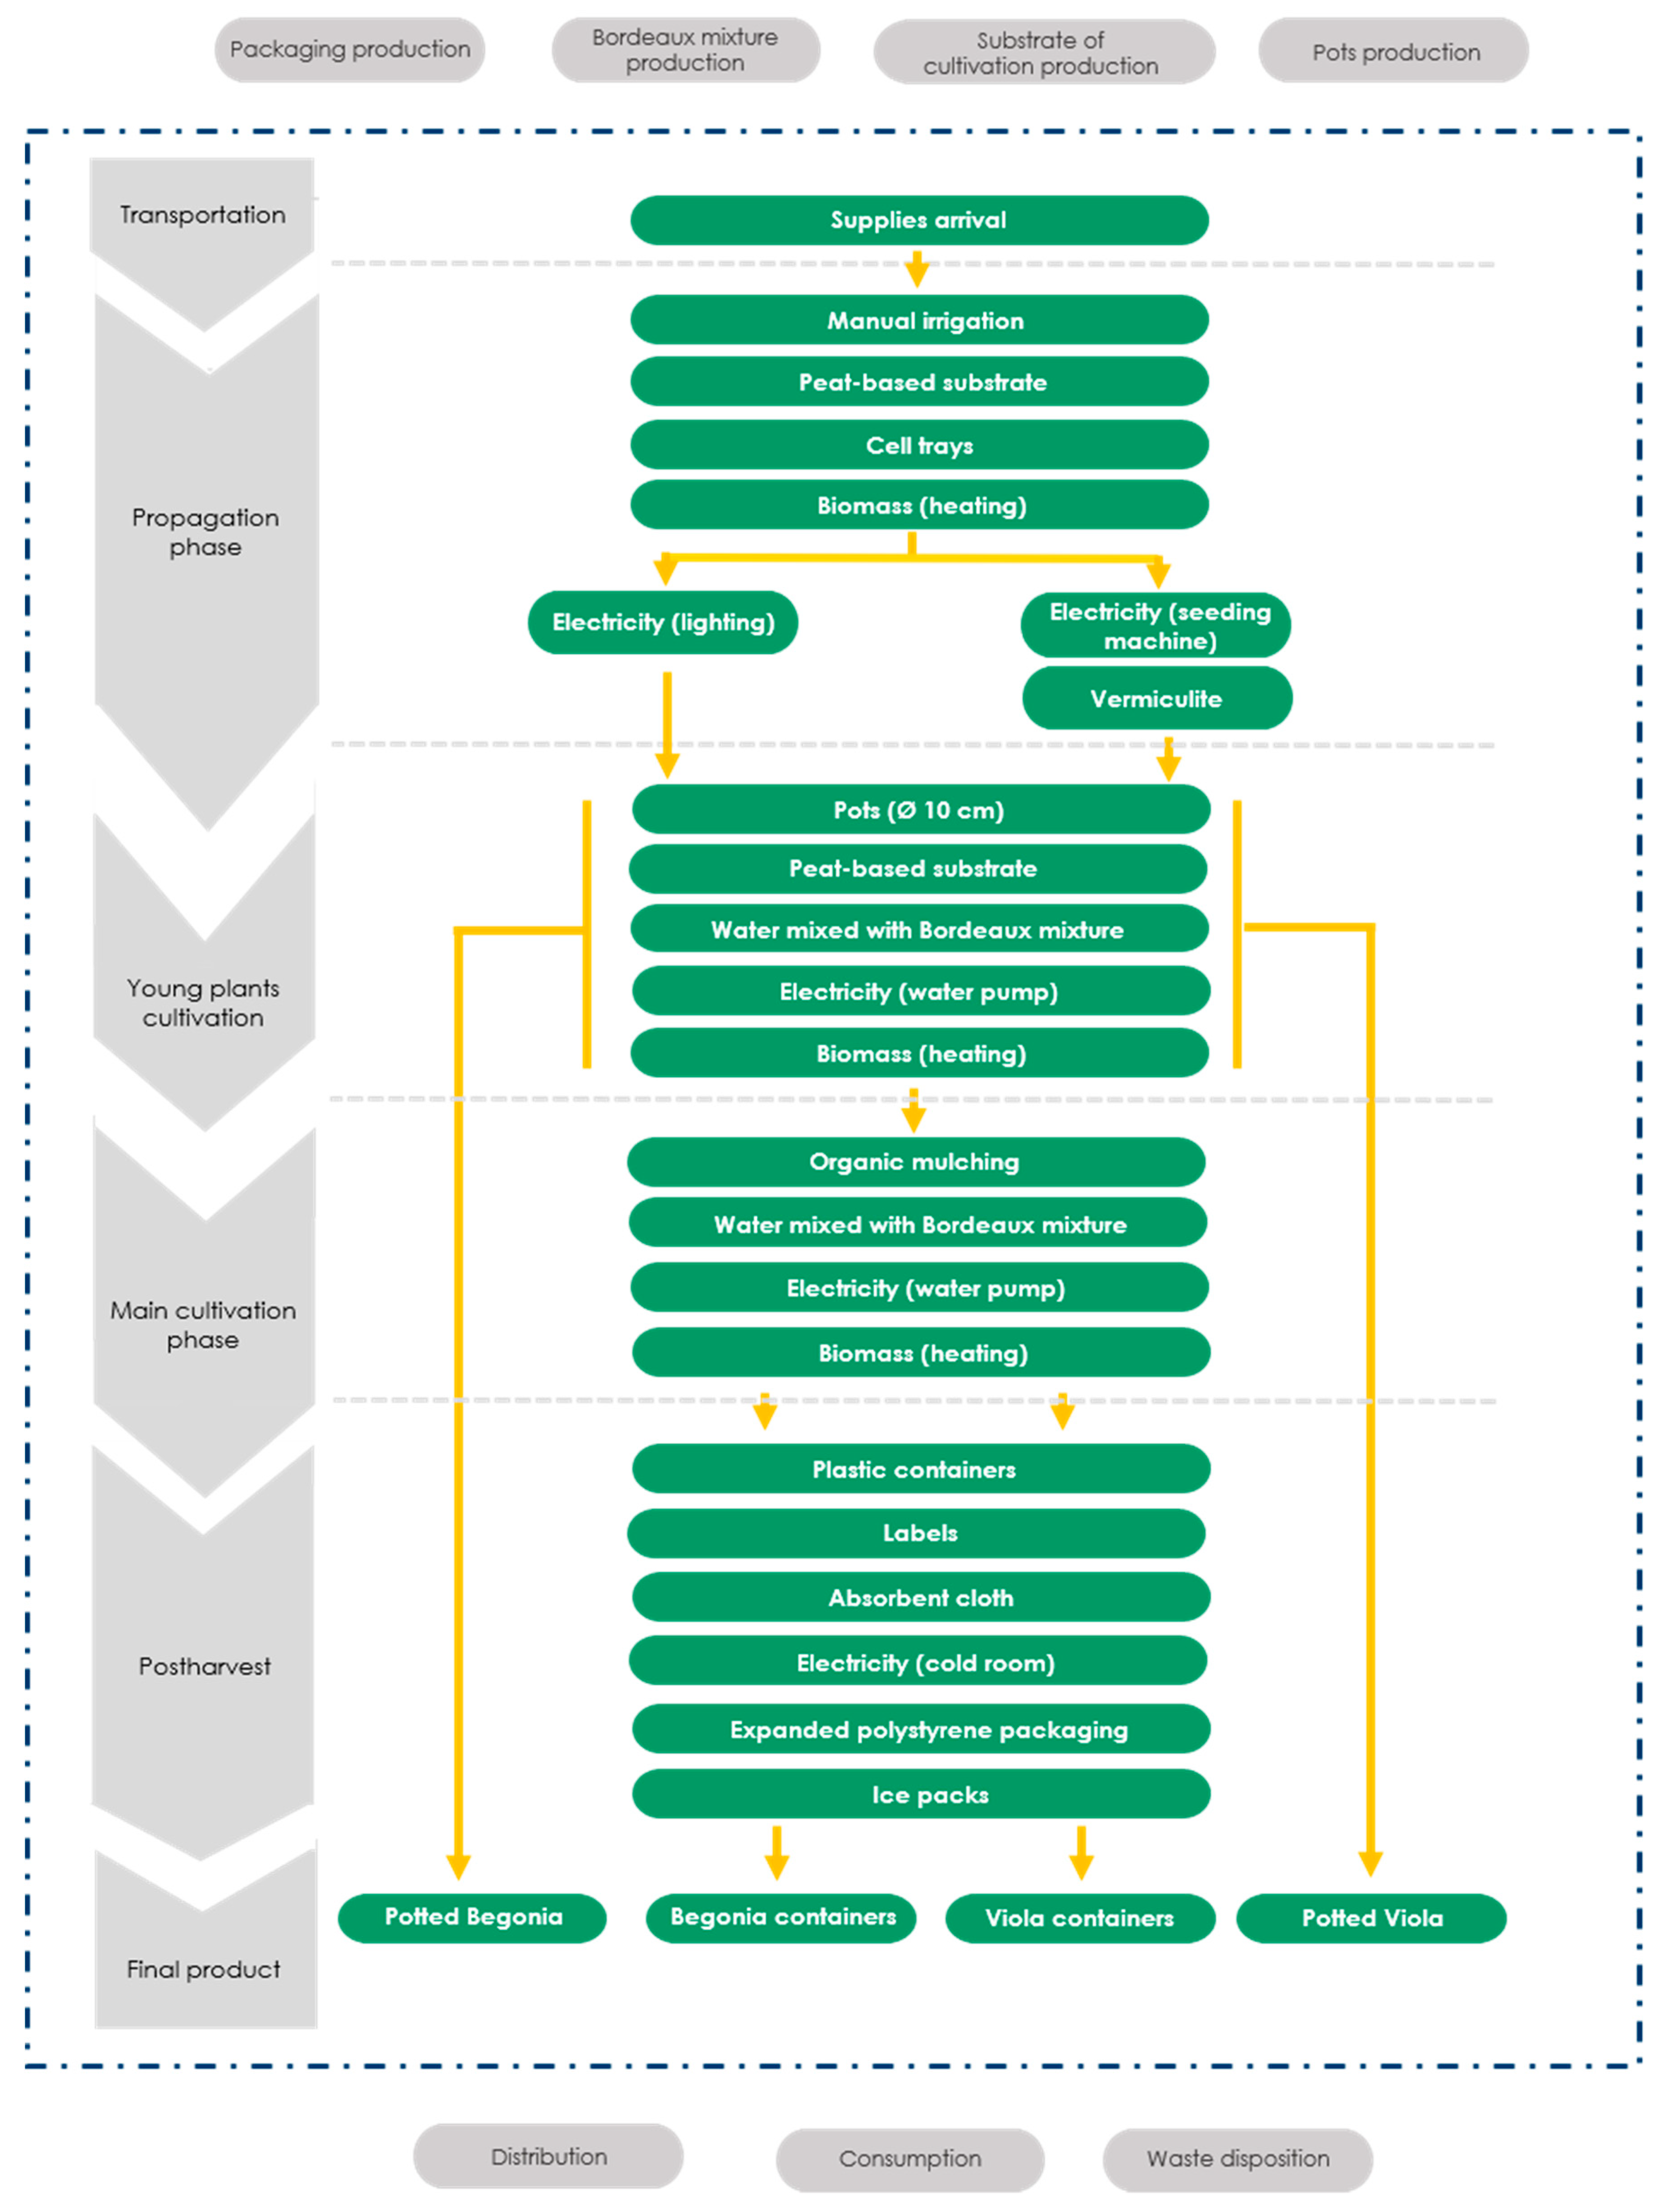
Figure 1 presents the production process, divided into several phases, while
Figure 2 shows the input and boundaries; the system model can be divided in two paths according to the species grown:
The production timeline of wax begonia flowers was assumed to consist of a total period of cultivation of 20 weeks. The mother plants were pruned and the cuttings obtained were planted in cell trays (160 cells 3 cm in diameter per tray) filled with peat − based substrate, with a container density of 106.67 plantlets/m2. The cell trays were maintained in the heated greenhouse under artificial lighting until rooting (on average 15 days). Afterwards, the 550 plantlets were maintained in the greenhouse for 8 more weeks (propagation phase). The plantlets were then transferred in pots of 10 cm in diameter, each containing 0.5 L of peat − based substrate, obtaining 400 wax begonia pots (200 total L of soil), less than the starting plantlets due to the rate of establishment (80%–90%). During 40–45 days, water mixed with a water − soluble fertilizer (i.e., Bordeaux mixture) distributed through subirrigation (flood − floor irrigation), using a 2.57 kW water pump, delivering on average 425 total L for the wax begonia plantlets.
The production timeline of viola flowers was assumed to consist of a total period of cultivation of 10 weeks. Seeds obtained from mother plants were planted through a seeding machine in cell trays filled with peat − based substrate, and covered with vermiculite (1.7 g/cell). The cell trays were maintained in the heated greenhouse to germinate for 7 weeks (propagation phase) and to obtain 17,500 plantlets. The plantlets were then transferred in larger pots obtaining 14,000 viola pots (rate of establishment of 80%–90%), for a total of 7000 L of soil. During 25–30 days, water mixed with Bordeaux mixture was distributed through subirrigation, delivering a total of 9625 L for the viola plantlets.
After this time, wax begonia and viola adult plants could follow two different ways: they could end their production cycle, remaining in pots and be sold as potted plants or they could be transplanted in the ground, with a rate of establishment higher than 95% (360 wax begonia plants and 13960 viola plants), covering on average a surface area of 100 m2 and 1000 m2 respectively. In both species, the ground was previously covered with 0.025 kg/m2 (2.5 kg for wax begonias and 25 kg for violas). Both bedding plants were maintained 15–20 days in the ground, in the heated greenhouse, before harvest. Once bloomed, flowers were manually harvested and directly transferred in large (25 g) or small (12.5 g) plastic containers (primary packaging), with a 12 × 8 cm absorbent cloth (microfiber) on the bottom to limit moisture. The large container could contain, on average, 55 fresh wax begonias flowers or 166 violas, while the small one could contain on average 27–28 fresh wax begonias or 83 violas.
Containers were then labelled in order to be traceable and kept in a cold room (0.7 kW, containing up to 1500–2000 containers) until delivery. The plastic containers were then packed in an expanded polystyrene (EPS) secondary packaging, to protect the final product during delivery: the polystyrene package (95 g) could contain on average 30 large plastic containers, with the addition of 3 or 4 dry ice packs.
2.5. Life Cycle Inventory
Life Cycle Inventory procedures were used to record all input products, equipment use, and other activities for a functional unit of 1 g of fresh flowers. The primary data of the farm’s production cycle referred to year 2018 were derived from the growers’ interviews, which were helpful to correctly allocate the various inputs and outputs for each operation, creating the Life Cycle Inventory. Primary data were inserted in the software, in order to transform them into the environmental burdens and to quantify the different impact categories. LCI consisted as follows:
Pots (polypropylene—PP): weight (g) and diameter (cm) of different pot sizes. Dimensions (cm) and number of cells per cell tray.
Pot substrate: volume (L) of peat − based substrate per each container size.
Vermiculite: amount (g) used per cell, concerning only the V. cornuta seeding phase.
Energy consumptions: it was not possible to obtain the yearly energy consumptions of the nursery, since only two species of one greenhouse were examined, out of 29 greenhouses. The consumptions calculated are related to:
Seeding machine: power (kW) multiplied with the total operating hours per productive cycle (only for the viola flowers);
Artificial lighting: daily consumption (kWh) divided by the total number of plantlets and seedling lightened, and then multiplied by the total wax begonia plantlets;
Boiler: power consumption (kWh) per each phase, referring to the actual number of viola and wax begonia’s plants. kWh were calculated in proportion to the number of plants present in each phase: 550 cell trays for wax begonias and 17,500 for violas, 400 wax begonias pots, and 14,000 violas pots, 360 wax begonias plants and 13,960 violas plants.
Biomass: amount of wood pellet (kg) used for heating the greenhouse per week and per day. This value was then divided for the total number of plants in the greenhouse, and distributed within the cultivation phases.
Water consumptions: m3 of water used at each irrigation. The calculation of the total liters’ used could only be carried out from the vase transplantation phase onwards.
Fertilizer: Bordeaux mixture (L) mixed with water, distributed from the vase transplantation phase onwards. The total amount per each irrigation operation was recomputed to obtain only the liters given to wax begonia and viola plants, in each phase.
Organic mulching: weight (kg) of mulching used per surface area (m2), concerning only the in − ground phase.
Primary packaging: weight (g) of the two plastic containers (large or small); weight (g) and size (cm) of the absorbent cloth on the bottom of the container.
Secondary packaging: weight (g) of the polystyrene secondary package; number of large or small plastic containers contained in it. Number and weight (g) of dry ice’s packs.
For the waste scenario, it was considered that most of the equipment is recycled directly in the nursery, thus not accounting for it (organic wastes are undergrounded during the milling process as fertilizer). Pots were calculated only for the potted plants, as they could not be reused by the nursery.
The information about the production of
B. semperflorens and
V. cornuta were collected in a database and then processed by a specific LCA software, SimaPro 8.5.0.0 (PRé Sustainability – The Netherlands). The life cycle model was developed defining all the single unit processes that would be subsequently joined together, to create the life cycle network. This procedure gives great flexibility to the modelling, allowing each unit process to be treated as a stand − alone entity, to be included in the life cycle whenever needed [
14].
2.6. Impact Categories
To quantify the environmental impacts, data previously collected were classified into different environmental issues of concerns as impact categories. The contribution of each emission to a certain impact category is evaluated through an equivalence factor that expresses its effects in relation with a reference parameter [
14,
35].
For this case study, four impact categories were chosen:
Global Warming Potential (GWP): GWP is used to estimate the contribution of greenhouse gases (CO
2, CH
4, N
2O, hexafluoride, etc.) to the greenhouse effect. The GWP index is defined as the cumulative radioactive forcing effect between the present moment and a selected time in the future (commonly assuming a 100 − year time horizon) caused by a unit mass of gas emitted in the present [
21,
36]. The emissions are measured in terms of the reference gas CO
2, and expressed in kg of CO
2 equivalent (CO
2 eq) [
36].
Acidification Potential (AP): acidification is a phenomenon whereby precipitation is unusually acidic (it has substandard levels of pH). It can have harmful effects on plants, aquatic animals, and infrastructure. Acid rain is caused by emissions of SO
2, NO
X, and NH
3. The AP is measured in kg of sulphur − dioxide equivalent (SO
2 eq) [
36].
Eutrophication Potential (EP): EP measures the emissions into water of phosphates and nitrates, causing an abnormal proliferation of vegetation in the aquatic ecosystem. It is expressed in kg of PO
43 − eq [
36].
Photochemical Ozone Creation Potential (POCP): photochemical ozone is formed by the reaction of volatile organic compounds and nitrogen oxides in the presence of heat and sunlight, forming the ozone in the troposphere. It is usually expressed in kg of ethylene equivalent (C
2H
4 eq) [
36].
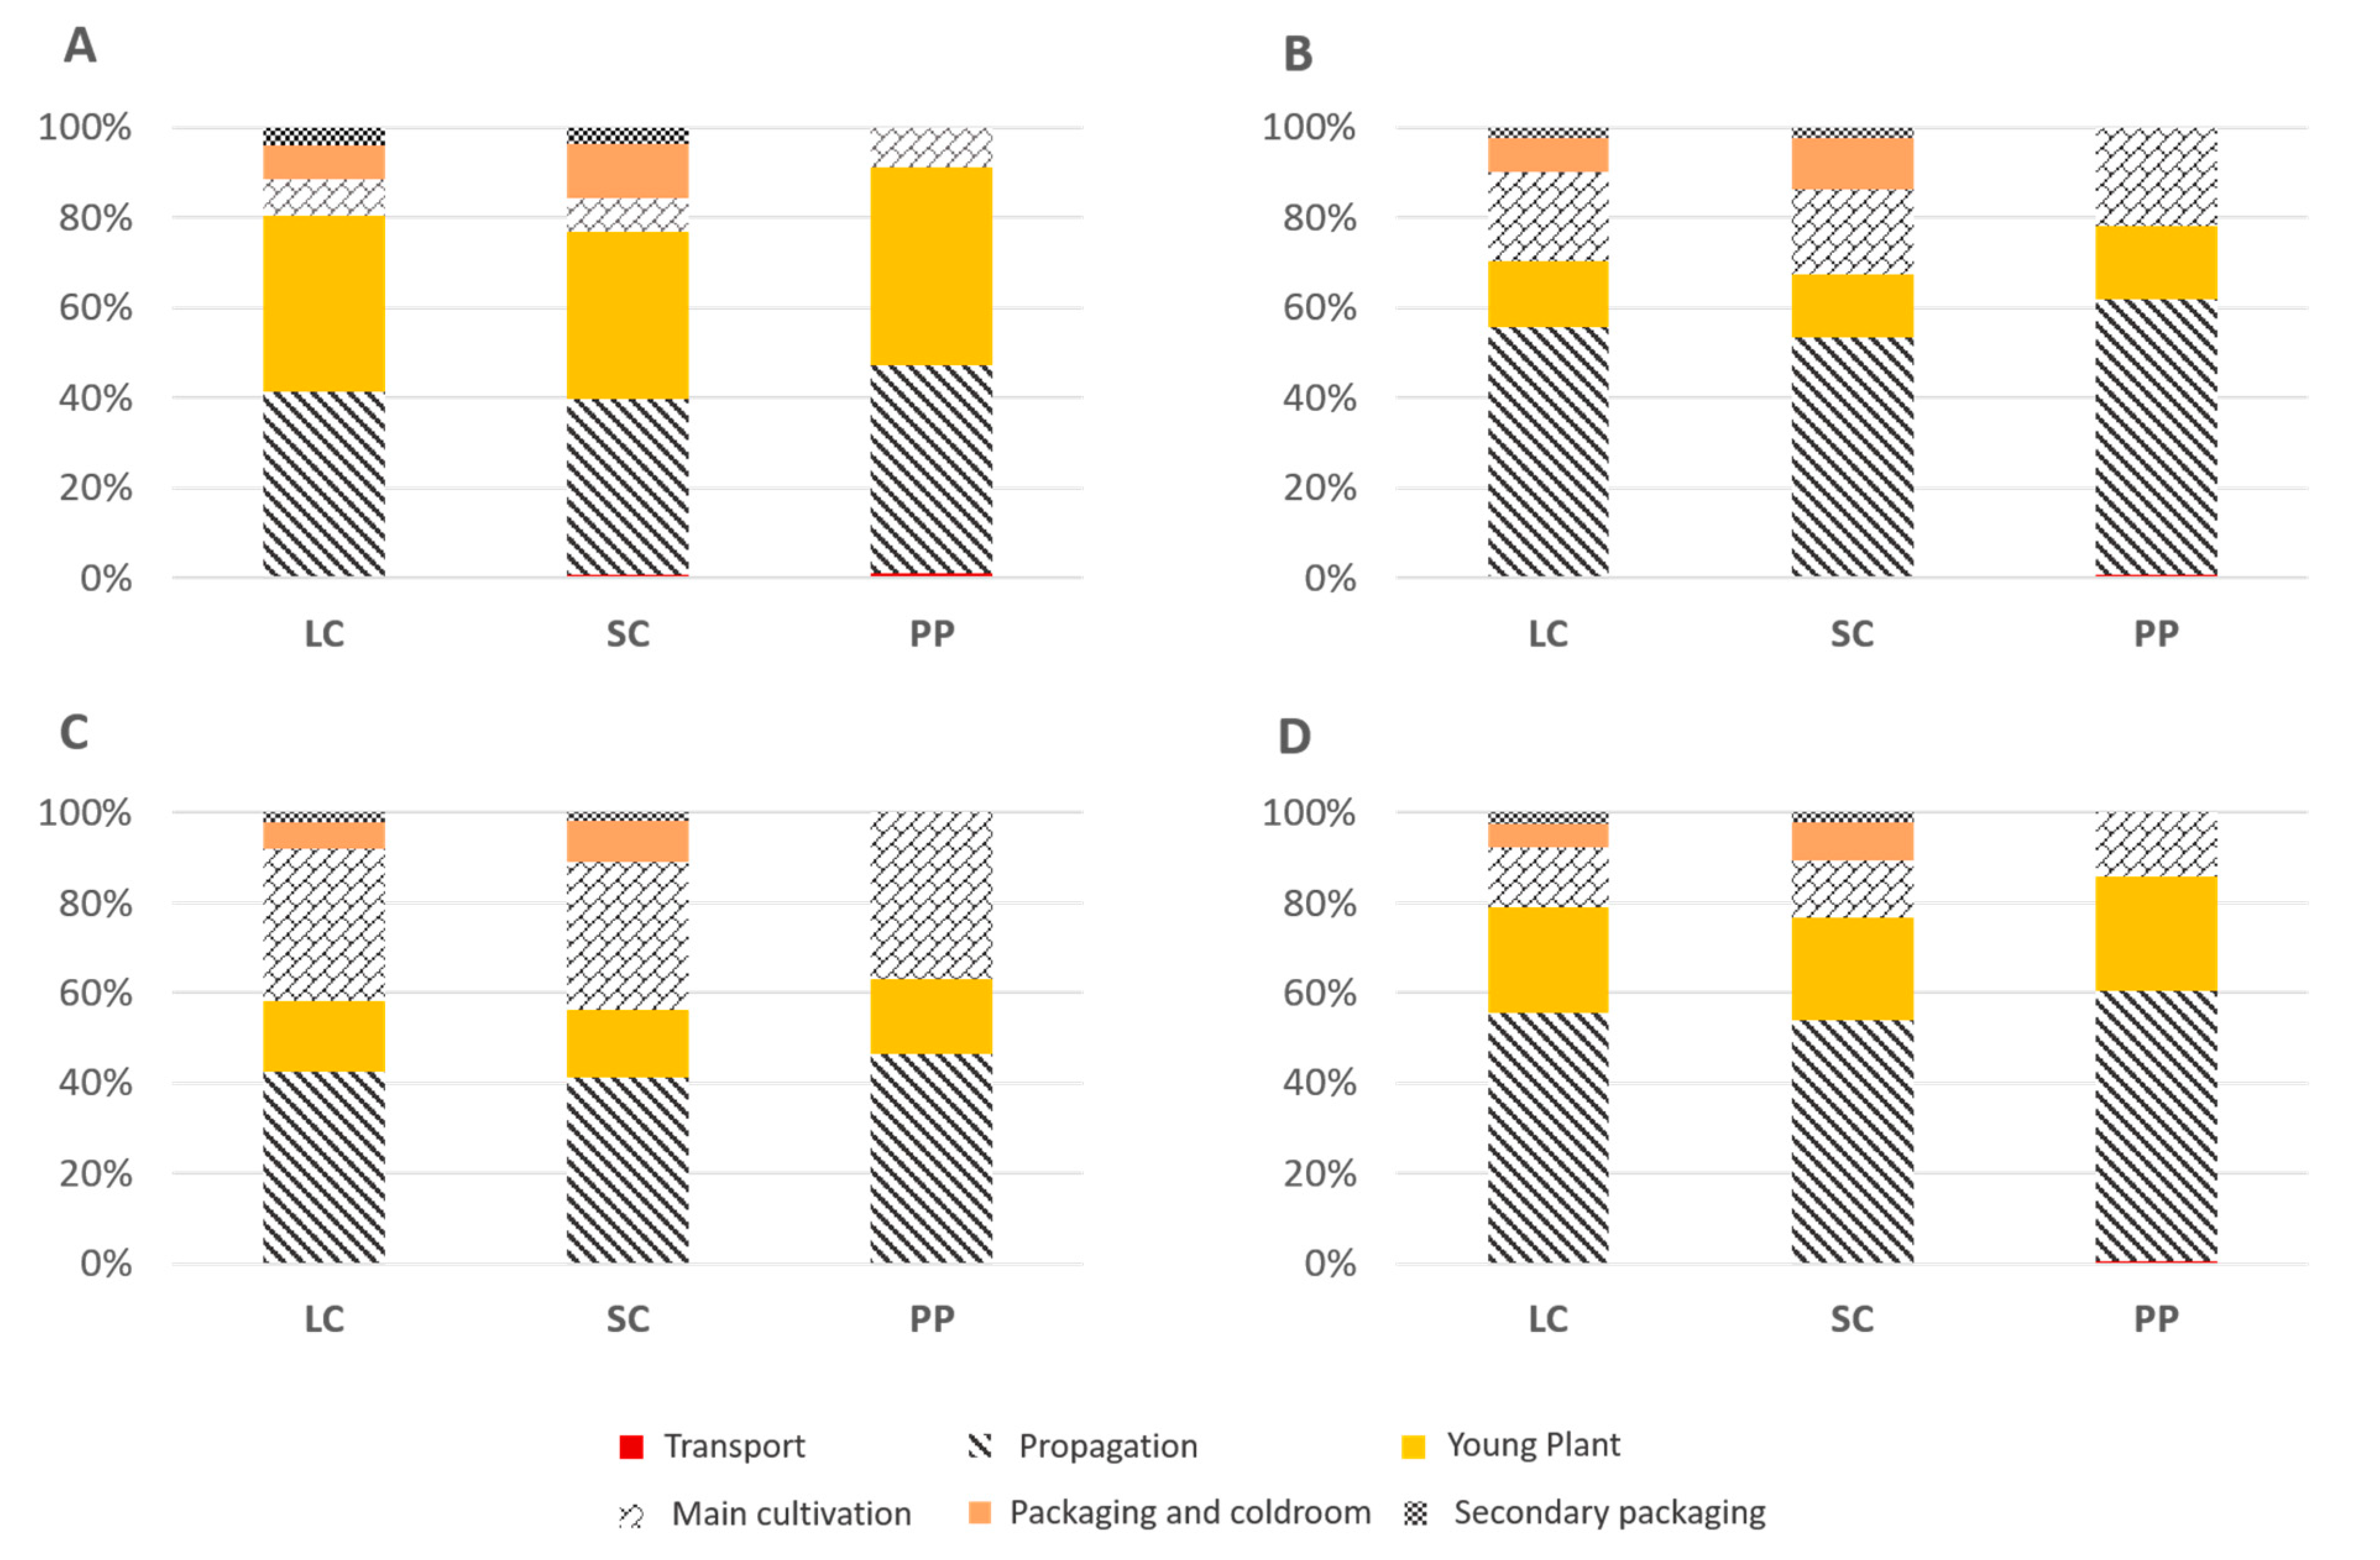
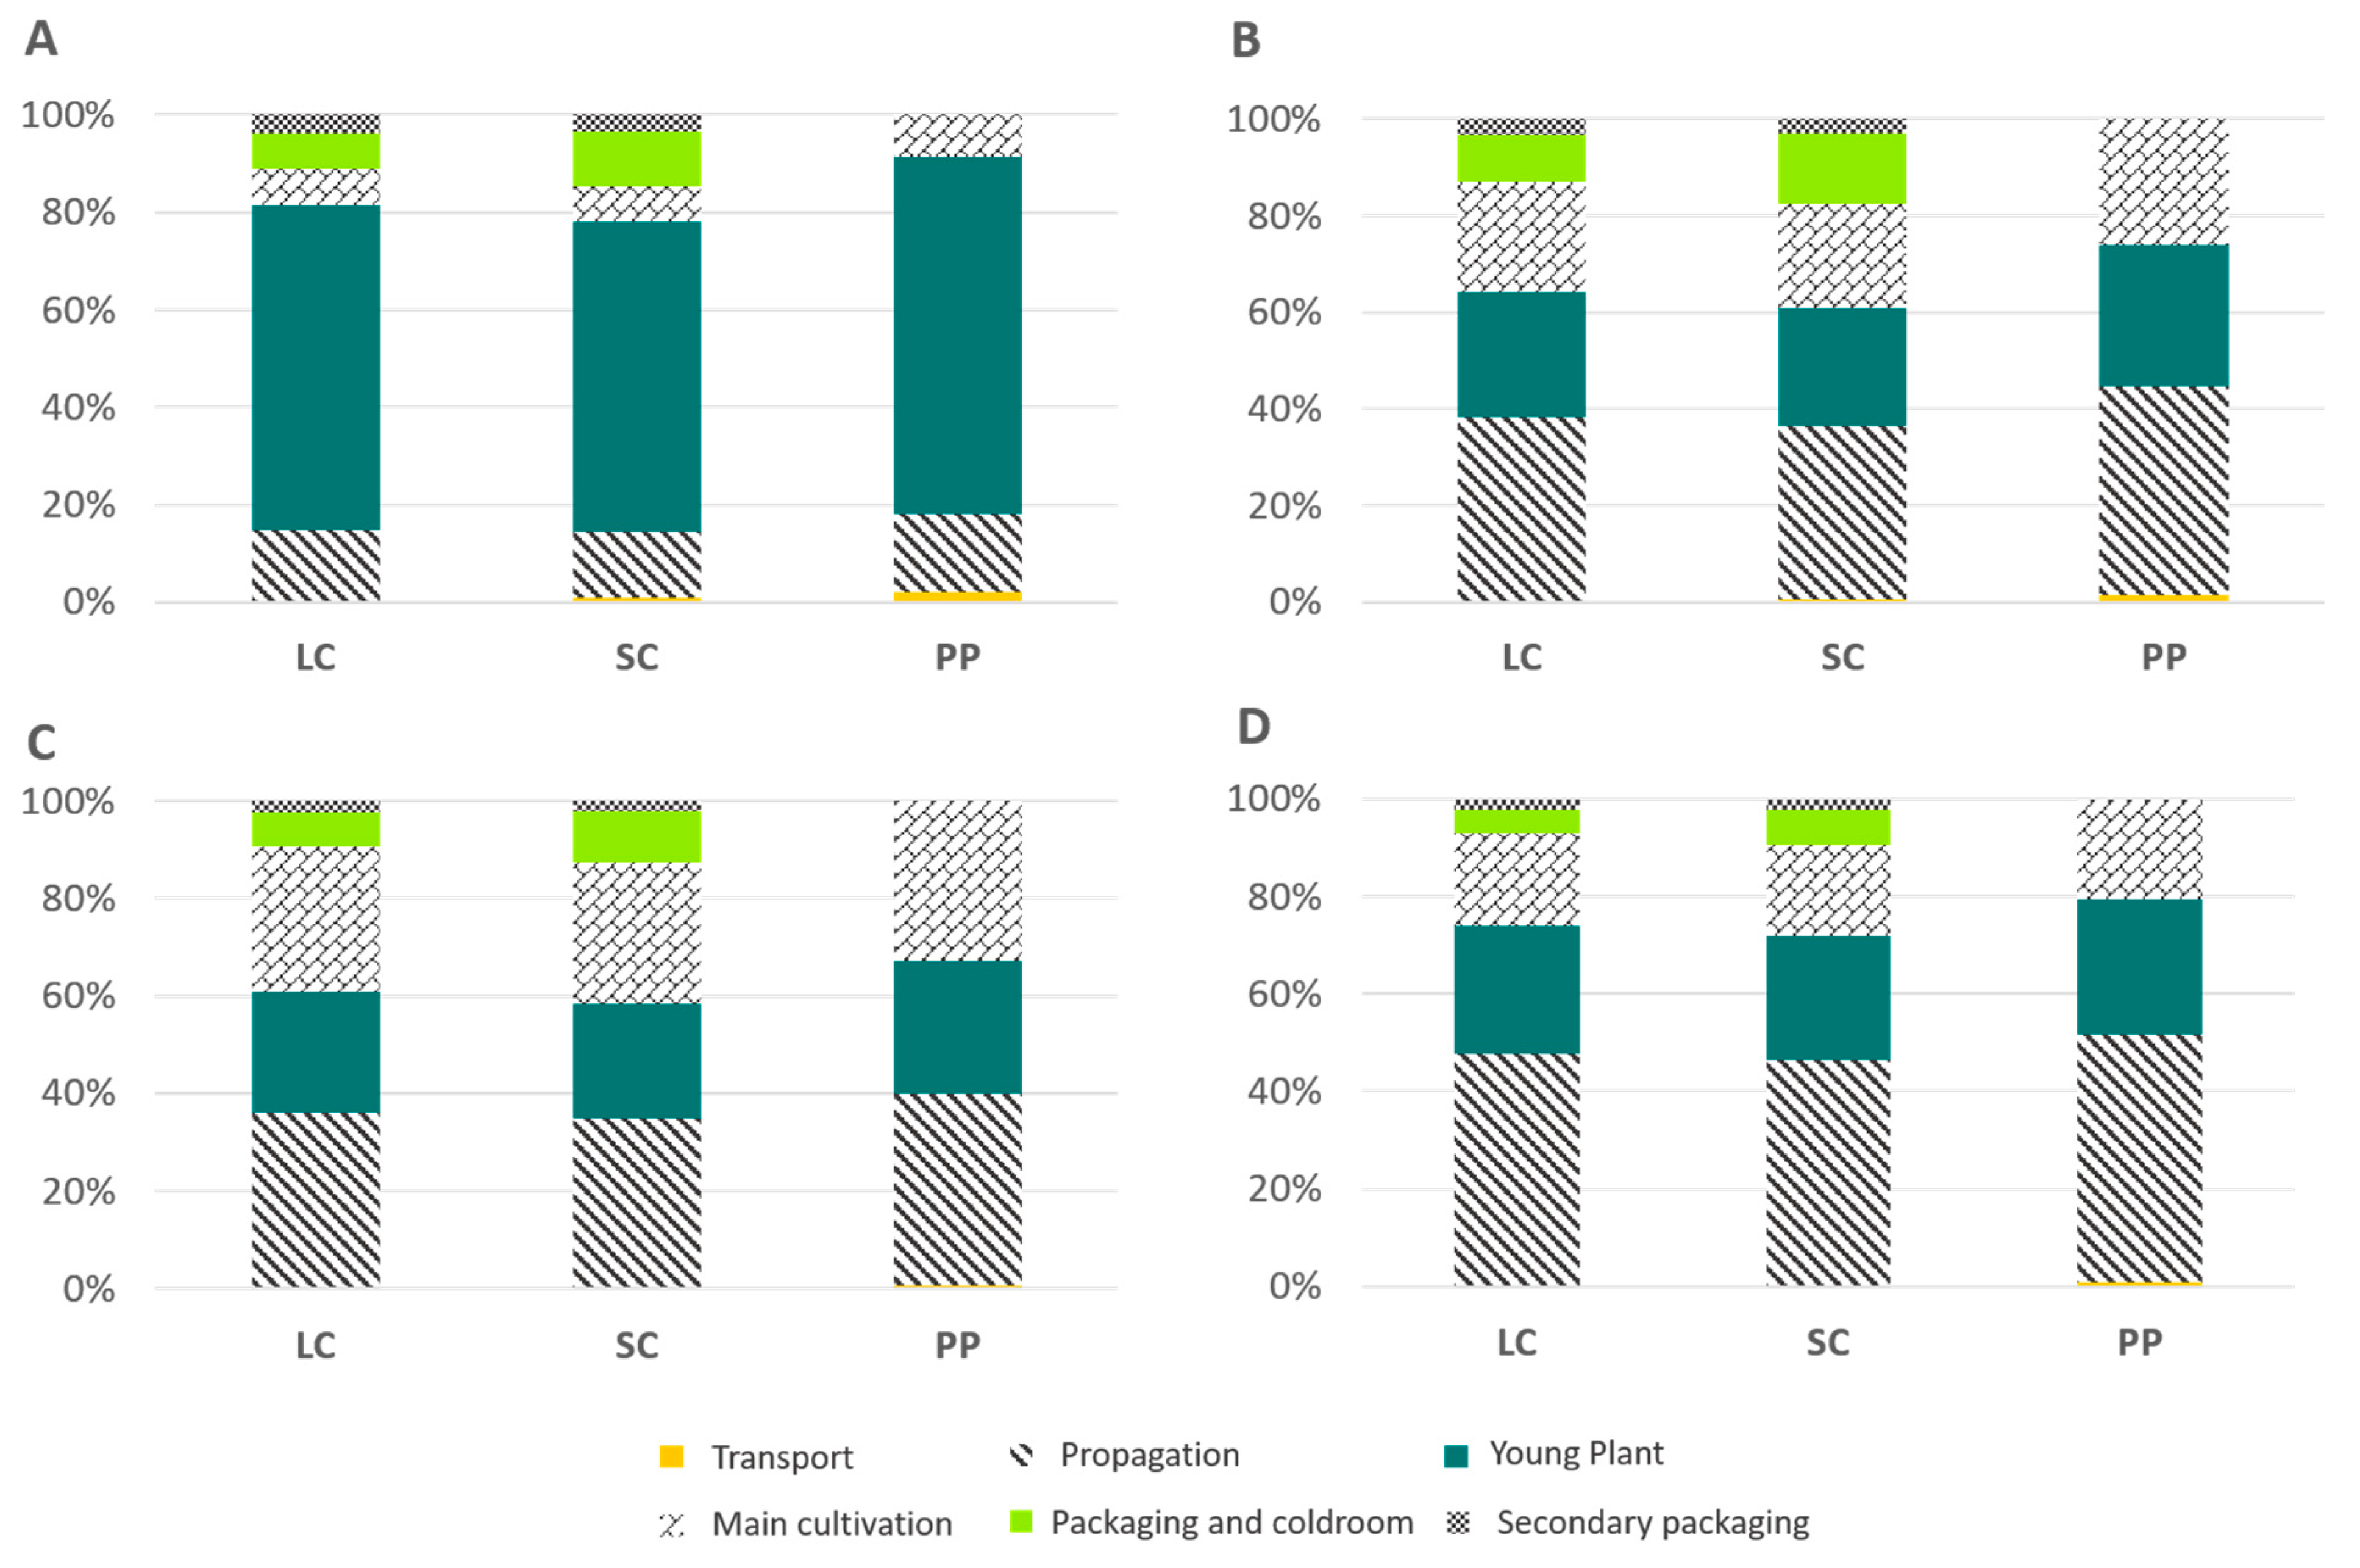
In order to have a clearer way to interpret data, each one of the two species of edible flowers was divided into three groups: (i) large container (LC) containing 25 g of flowers, (ii) small container (SC) containing 12.5 g of flowers, and (iii) potted plant (PP), producing on average 4 g of wax begonias/day for three weeks and 0.66 g of violas/day for 11 days (these data are related to a domestic environment, to simulate the production of flowers by the final consumer—data not shown).
For transport, LC and SC were packed in polystyrene boxes, in 30 or 60 units, respectively.
3. Results
Table 1 and
Table 2 show the impact values caused by the production cycle of wax begonias and violas, respectively, for each one of the four impact categories, divided in the three subgroups (LC, SC, PP).
Wax begonias’ production caused from 24.94 to 29.47 g CO
2 eq/g GWP emissions, from 1.077E − 01 to 1.249 E − 01 g SO
2 eq/g AP emissions, from 4.705 E − 02 to 5.284 E − 02 g PO
43 − eq/g EP emissions, and from 8.998 E − 03 to 1.006 E − 02 g C
2H
4 eq/g POCP emissions. Viola production caused from 26.99 to 31.25 g CO
2 eq/g GWP emissions, from 8.169 E − 02 to 9.832 E − 02 g SO
2 eq/g AP emissions, from 3.961 E − 02 to 4.527 E − 02 g PO
43 − eq/g EP emissions, and from 1.031 E − 02 to 1.134 E − 02 g C
2H
4 eq/g POCP emissions. The highest values were always obtained in SC than in PP ( + 12–18% and + 10%–20% for wax begonias and violas, respectively). Regarding
B. semperflorens, the major contributor in all four impact categories was the propagation phase, ranging (on average) from 42% to 56% (
Figure 3). The second main contributor in the GWP and POCP impact categories was the young plant cultivation phase (respectively accounting on average for 40% and 23%), while regarding AP and EP impact categories it was the main cultivation phase (respectively accounting on average for 20% and 34%). The third main contributor in the POCP index was the main cultivation phase (accounting on average for 13%), while in the AP and EP impact categories it was the young plant cultivation phase (respectively accounting on average for 14.9% and 15.6%). The third main contributor in the GWP index was the post − harvest phase, accounting on average for 15%, while the main cultivation phase accounted for 8% of the total. The post − harvest phase in the three remaining indexes (AP, EP, and POCP) ranged from 9% to 12%.
Regarding
V. cornuta, the major contributor in the GWP impact category was the young plant cultivation phase, accounting on average for 67% of the total, while in the AP, EP, and POCP impact categories it was the propagation phase (ranging on average from 36% to 48%). The second main contributor in the GWP index was the propagation phase (on average 14%), while in the AP and POCP indicators it resulted in the young plant cultivation phase (both accounting on average for 26%) (
Figure 4). The second main contributor in the EP category was the main cultivation phase (on average 30%). The third main contributor in the GWP index was the post − harvest phase (on average 12%); in the AP and POCP indicators it resulted to be the main cultivation phase (respectively accounting for 23% and 19%), while in the EP category it was the young plant cultivation phase (on average 25%). The post − harvest phase in the three remaining impact categories (AP, EP, and POCP) ranged from 8% to 15%.
The transport of supplies can be considered of minor relevance, ranging on average from 0.2% to 0.8% of the total in wax begonias (
Figure 3) and from 0.3% to 1% of the total in violas (
Figure 4).
4. Discussion
The LCA methodology was useful to assess the environmental burdens of the production cycle of two types of wax begonias and viola edible flower products, e.g., containers and potted plants.
This study did not take into account plastic greenhouse covers and containers, which however represent a significant portion of the carbon footprint for floral crops in European LCA studies [
37]. According to Stanghellini et al. [
38] and Russo and Mugnozza [
39], the plastic residues coming from the greenhouse film covering are estimated to be 1,1 t/ha/y, those coming from irrigation tubes, containers, and other construction materials are estimated to be 500 kg/ha/y. However, Russo et al. [
31] and Lazzerini et al. [
18] found that the structures of the greenhouses, with a metal life span of 20 years and plastic cover replacement every two years, have a limited effect on the environmental impacts, so that they could be eliminated in the works where they are not prior [
18,
30]. The energy consumptions of the irrigation system and of the inverter used for the pellet heating were not calculated as they were too low and not significant compared to the total consumptions of the nursery. Moreover, as the nursery produces a large assortment of plants, the real input values monitored by computers to attribute to viola and wax begonia were difficult to calculate. Human labor (manual irrigation, plant vase transplantation, ground transplantation, manual harvest) was not computable.
The selection of a functional unit based on the mass of the product was appropriate since it allowed the comparison between the two different types of final products. Since there are no previous studies on edible flowers, it was difficult to compare the results with other equivalent works. There are assessments conducted on cut flowers [
16,
30,
31], but it would not be a fair comparison, because those are ornamental flowers, not food, and many fertilizers, pesticides, and fungicides are used. Therefore, the results of this work were compared to studies on lettuce [
23,
24,
40], as it has a rapid life cycle and more attention is required for the use of fertilizers and pesticides directly on the leaves, as they will be the product ingested, such as edible flowers. It has to be said, however, that lettuce production has very high yields (on average 12.5 tons per year according to Foteinis and Chatzisymeon, [
23]), if compared to flowers production (on average 0.7 tons per year in this case study). This makes it easier for lettuce to absorb better the impacts generated by the production cycle in one year.
The life cycle inventory analysis (LCIA) results per gram of freshly harvested flowers showed that the production of V. cornuta edible flowers resulted in a higher environmental impact than the wax begonias’ one in the Global Warming Potential (GWP) and in the Photochemical Ozone Creation Potential (POCP) indicators, regardless of the type of final product. On the contrary, B. semperflorens’ production cycle showed higher values than violas in the Acidification Potential (AP) and in the Eutrophication Potential (EP) indicators, probably because there were fewer wax begonia plants in the greenhouse than viola ones, thus worse absorbtion og the nutrients in the ground, causing a slightly higher impact of wax begonias in the AP and EP categories.
In wax begonia, propagation was the most impactful phase regarding the GWP index; however, the young plant cultivation phase gave a similar contribution to the CO
2 emissions. These two phases together accounted for the 76%–80% of the environmental burden for the production of the flowers’ containers, and up to the 90% of the environmental burden for the production of the potted plants. The propagation phase resulted in the highest values also because in this stage, the wax begonia plantlets needed to be lit up at night (6 h per night), in order to facilitate rooting, thus increasing emissions, caused by the production of electricity. On the contrary, the biggest contributor to the CO
2 emissions for the viola flowers was the young plant cultivation phase, accounting itself for 63.5%–66.5% (for the production of the flowers’ containers) and 73.5% (for the potted plants’ production) of the environmental burden.
V. cornuta, actually, did not need lighting to germinate, but there were much more viola plants in the greenhouse rather than wax begonias (550 wax begonias and 17,500 violas plantlets). Thus, a high amount of plastic vases was necessary during the production cycle (even if their impact is minimal, since they are reused for two or three production cycles), especially those for the potted plants (which could not be reused and were consequently considered in the impacts’ calculation), as well as high amounts of substrate composed by peat, as already underlined by Lazzerini et al. while comparing different production systems and different nurseries [
18,
21], making the GWP index increase. Moreover, during the growth in larger vases, the plantlets received more water (which from this phase onwards was precisely accounted for, as it is regulated by an automatic system and previous irrigation was done by human labor, making it difficult to estimate the amount of water consumed) and an organic compost, which may be the reason of the major impact of this stage. Maintaining the correct temperature in the greenhouse during the cold period certainly helped to increase the environmental load because it uses biomass, which releases CO
2 when burned. However, data referred to biomass consumption for heating were uncertain, due to the variability of the outdoor temperature among years. Thus, calculations for biomass heating were cautiously done out of six months, and not out of four (the regular period of heating), because during the interview, the owners declared that, in case of very intense cold periods, the boiler can operate up to six months. Thus, we decided to consider the most impactful situation.
Comparing our results with other studies, Foteinis and Chatzisymeon [
23] found the total emissions to be 0.0013 kg CO
2 eq/g per year for the open − field production of organic lettuce, while Romero − Gámez et al. [
40] obtained a result of 0.00022 kg CO
2 eq/g per year for conventional lettuce production (in greenhouse), lower than the emissions obtained for wax begonia and viola flowers. Fusi et al. [
24] analyzed lettuce packed in plastic bags and delivered in polypropylene (PP) boxes, more similar to the type of packaging used by the nursery. They obtained emissions for 0.0027 kg CO
2 eq/g packed lettuce per year, which are still lower than edible flowers’ ones, but higher than the studies mentioned above, probably because, unlike Foteinis and Chatzisymeon [
23] and Romero − Gámez et al. [
40], they also quantified the post − harvest activities. However, Fusi et al. [
24] assessed the processing phase too, which was not present in the nursery’s production process, in conclusion, the GWP values of edible flowers resulted in being higher than those found for lettuce. Comparisons with cut flowers’ production were not possible, due to the different functional units used; however we expect the cut flowers’ values to be higher, as there are more inputs used, such as fertilizers, fungicides, insecticides, pesticides, and gasoline and electricity for machinery and plant growth regulators [
22,
30].
Regarding the AP indicator, the most impactful phase for both wax begonias and violas was the propagation; however, wax begonias showed higher values (more than 50% of the total SO2 emissions) than violas. This is probably due to the longer period needed to obtain wax begonias plantlets, thus needing more biomass heating (causing higher SO2 emissions in the air), but also to the lighting required at night.
The young plant and the main cultivation phases were similar in both B. semperflorens and V. cornuta production cycles. It is noteworthy that, in the post − harvest phase, the small container obtained higher results than the large one for both bedding plants, due to the higher amount of plastic used.
The EP indicator had a similar distribution of the environmental burdens to the Acidification Potential indicator, but it showed a major importance of the main cultivation phase, especially for
B. semperflorens, because of the leaching of nutrients caused by fertigation and mulching.
V. cornuta showed a lower EP impact probably due to the higher amount of
V. cornuta plants (13960) than
B. semperflorens (360), which can absorb the nutrients in the most efficient way. However, wax begonias and violas obtained higher results in AP and EP than those found by Romero − Gámez et al. [
40] for lettuce at different percentage of nitrogen fertilization (0%, 25%, 50%, 100%, 125%, 150%) in the greenhouse (1.4E − 03 g SO
2 eq/g and 3.1E − 04 g PO
43 − eq/g were the higher results). Fusi et al. [
24], found that a 130 g bag of fresh − cut salad had an environmental impact of 1.41E − 03 kg SO
2 eq. (also considering distribution), which is still lower than wax begonias (1.52E − 02 kg SO
2 eq/130 g) and violas (0.01 kg SO
2 eq/130 g) AP values.
POCP indicator was dominated by the propagation phase too in both species. Viola cornuta showed higher results than Begonia semperflorens, probably due to the higher number of plants produced, thus needing more resources. However, during the propagation phase, wax begonias obtained higher values, caused by the longer period necessary to obtain the plantlets, thus needing more heating than violas, and by the electricity necessary for rooting cuttings.
All the four impact categories showed low values in the transportation phase of the two species, both for containers and potted plants production. However, it has to be reported that it was not possible to assess the impact generated by the delivery of the final product to the consumer, since the nursery distributes it all over Italy, to retailers, but also to private consumers, some of whom are often occasional. Therefore, it was not possible to assume an average of km usually covered by the farm. Thereby, this stage only accounted for the transportation of the raw materials from the producers to the nursery.
5. Conclusions
This study provided information about the environmental impact of edible flowers’ production chain. The LCA analysis allowed for the quantifying of the impacts associated to large or small containers of flowers ready to be eaten, and to flowering potted plants. All indicators evaluated showed lower emissions values for the “potted plant” product (which did not include the post − harvest phases in its production cycle, thus needing less resources) than the “container” product, both for wax begonias and violas. Regarding B. semperflorens, the percentage increase from the potted plant to the flowers’ container ranged from 10% to 15% among the impact categories, while concerning V. cornuta, the percentage increase from the potted plant to the flowers’ container ranged from 8% to 17% among the impact categories.
As far as the flowers’ containers are concerned, lower impacts were obtained using the large plastic container rather than the small one: wax begonias percentage increase from the large container to the small one ranged from 3% to 5% among the impact categories, while violas percentage increase ranged from 3% to 6% among the impact categories (
Table 1 and
Table 2). Actually, 1 g of fresh flowers packed in small containers and then in polystyrene packaging showed higher values in all the four impact categories evaluated than 1 g of fresh flowers packed in large containers. Wax begonias showed lower emissions than violas in the GWP and POCP indexes, whereas violas showed lower values in the AP and EP impact categories. In order to reduce the environmental burden, some solutions can be suggested.
The production of only the large containers should be a way to reduce the emissions in the post − harvest phase (diminishing the amount of plastic used), even if probably this would not be economically sustainable for the nursery as normally the private customers prefer small containers of fresh flowers.
The nursery could increase the sale of flowering potted plants, as they require fewer resources, and there is a minor use of packaging, highly reducing the need of post − harvest treatments. Moreover, the consumer can diminish food wastes, leaving on the plant the flowers he does not need. However, a consumer who buys a potted plant can only have one flower species and a minor number of flowers to use, if compared with the variety and the grams packed in a container. Probably this solution too would not be economically advantageous for the nursery.
Bio − degradable plastic packaging could be adopted, so that the end of life could have a minor impact on the environment [
41].
One more option to reduce the impacts of the production cycle could be represented by the use of biodegradable pots. Once buried, they are subjected to biodegradation processes, turning into biomass and inorganic products [
42]. Moreover, they could accelerate the vase transplantation and ground transplantation processes, also reducing damages to roots. This solution could reduce the use of plastic vases in the propagation and in the young plant cultivation phases of both violas and wax begonias, thus reducing emissions of the impact categories. Nevertheless, some of these pots show unsuitable mechanical performances, and they are more expensive than plastic pots [
42].
Lastly, the use of biodegradable and bio − based foam for cushioning packaging instead of Expanded Polystyrene (EPS) could be another option, using renewable and more sustainable raw materials (biomass instead of fossil fuel) and reducing landfill disposal [
43].
This preliminary study did not use a “cradle to grave” approach, but once this niche market will be wider and better known, it will be interesting to quantify the impacts related to distribution of the edible flower’s product to the final consumer (private consumer or customers of Ho.Re.Ca.—Hotellerie, Restaurant, Café), consumption, conservation (with the consequent increase in refrigeration) or waste of edible flowers, and ultimate disposal of primary and secondary packaging.
In conclusion, even with access to all data usually available in a typical company, LCA of small nursery or farms remains difficult to conduct. Small nursery and farms often do not collect data for which they do not have an immediate need or legal obligation that might be a valuable asset for detailed allocation of inputs. One approach to get more or better data on small nurseries or farms can be the implementation of smartphone applications collecting data on inputs and outputs. This can help the owners and managers to manage their companies better while simultaneously providing data for research.
There are great opportunities to reduce emissions; thus, it could be interesting to enlarge this environmental analysis to the whole of the edible flower productive chain, in order to have a complete overview of this emerging type of food product. The scientific data about the environmental pressure of the different edible flower products could also help consumers to make more informed and sustainable choices.


 ,
, 


