Article

Effect of Manure and Urea Fertilization on Yield, Carbon Speciation and Greenhouse Gas Emissions from Vegetable Production Systems of Nigeria and Republic of Benin: A Phytotron Study

1
Department of Soil Science, University of Saskatchewan, Saskatoon, SK S7N 5A8, Canada
2
Department of Soil Science and Land Resources Mgt., Obafemi Awolowo University, Ile-Ife 220005, Osun, Nigeria
3
Department of Crop Production and Protection, Obafemi Awolowo University, Ile-Ife 220005, Osun, Nigeria
4
Laboratory of Hydraulics and Environment Modeling, Department of Natural Resources Management, Universite de Parakou, 03 BP: 351 Parakou, Republic of Benin
*
Authors to whom correspondence should be addressed.
Agronomy 2020, 10(3), 400; https://doi.org/10.3390/agronomy10030400
Submission received: 14 February 2020 / Revised: 5 March 2020 / Accepted: 11 March 2020 / Published: 14 March 2020

Abstract

:
Fertility management techniques being promoted in sub-Saharan Africa (SSA) seek to grow indigenous vegetables economically and sustainably. This study was conducted in a phytotron chamber and compared yield, soil carbon (C) speciation and greenhouse gas (nitrous oxide (N2O) and carbon dioxide (CO2)) emissions from SSA soils of two ecoregions; the dry savanna (lna, Republic of Benin) and rainforest (Ife, Nigeria) cultivated with local amaranth (Amaranthus cruentus) under manure (5 t/ha) and/or urea (80 kg N/ha) fertilization. Vegetable yield ranged from 4331 kg/ha to 7900 kg/ha in the rainforest, RF, soils and 3165 kg/ha to 4821 kg/ha in the dry savanna, DS, soils. Yield in the urea treatment was slightly higher compared to the manure, and manure+urea treatment, but the difference was not statistically significant. Cumulative CO2 emissions over 21 days ranged from 497.06 to 579.47 g CO2-C/kg soil/day in the RF, and 322.96 to 624.97 g CO2-C/kg soil/day in the DS, while cumulative N2O emissions ranged from 60.53 to 220.86 mg N2O-N/kg soil/day in the RF, and 24.78 to 99.08 mg N2O-N/kg soil/day in the DS. In the RF samples, when compared to the use of urea alone, the combined use of manure and urea reduced N2O emissions but led to an increase in the DS samples. ATR-FTIR analysis showed that the combined use of manure and manure+urea increased the rate of microbial decomposition in the soils of the DS, but no such effect was observed in soils of the RF. We conclude that combining manure and urea fertilization has different effects on soils of the two ecoregions, and that RF farmers can reduce agricultural N2O emissions without compromising soil productivity and yield potential.

1. Introduction

Agriculture is a major contributor to global anthropogenic greenhouse gas (GHG) emissions, primarily from the use of mineral fertilizers and manures to crop and soil systems, as well as cultivation of peatlands [1,2]. Africa currently contributes significantly to the global N2O emissions from agricultural soils [3] despite its current low average fertilizer application rates of 9 kg N ha−1; which is very low compared to 135 kg N ha−1 in Asia and 73 kg N ha−1 in Latin America [4]. N fertilization is expected to increase in sub-Saharan Africa (SSA) by up to six-fold from the current levels in this century [5,6], since agricultural productivity in SSA is limited by low soil fertility [7]. Farmers in SSA are adopting the combined use of inorganic fertilizers and manures/crop residues to increase agricultural yields [8,9] as part of a widely accepted package of practices called Integrated Soil Fertility Management (ISFM); however little research has been performed on the environmental sustainability (including GHG emissions) of ISFM practices in African agricultural systems.
Increasing N fertilizer rates is known to increase soil N2O emission and contribute towards global warming [5]. The magnitude of soil N2O emissions is dependent on factors such as N fertilization rates, N fertilizer form [10], soil properties such as aeration, C bioavailability, and N utilization efficiency [11,12]. However, many studies [9,12,13,14] have reported that combining organic and inorganic fertilizers led to a reduction in soil N2O emissions and an increase in crop yields in Mali and Zimbabwe. These studies suggested that a combination of organic fertilization with low rates of inorganic N can be used as a mitigation option for reducing N2O emissions while retaining similar crop yields. Meanwhile, organic materials have also been shown to enhance the emissions of N2O and CO2 when in combination with urea fertilizers [15,16], primarily due to the production of CO2 by the hydrolysis of urea to CO2 and ammonia, as well as stimulation of heterotrophic microbial activity [17].
Changes in land management practices and cropping systems can significantly influence nutrient cycling and GHG emissions by altering soil chemical, physical and biological properties [11,18,19,20]. Dick et al. (2008) [13] reported that 4.1% of urea added to a pearl millet field in Mali was lost as N2O within the first year, while Singh and Verma (2007) [21] estimated that 70% of current N demand by plants is supplied by inorganic fertilizers, and as much as 50–70% of it is lost from nitrification processes leading to nitrate leaching and nitrous oxide emission.
Because organic matter is so tightly coupled to GHG emissions, advanced spectroscopic techniques, such as attenuated total reflectance Fourier transform infrared (ATR-FTIR) spectroscopy that can examine changes in the chemical forms of organic compounds [22] are vital to assessing soil organic carbon (SOC) quality in cropping systems. ATR-FTIR analysis of soils uses the vibrational characteristics of organic compounds to characterize the functional group chemistry of SOC [23,24] and investigate the effect of agronomic management practices on the composition and dynamics of SOC at molecular scale in the soils [24,25,26]. Currently, we have little information on how N fertilization affects C speciation/transformation, and N2O and CO2 emissions in vegetable production systems of SSA. Therefore, understanding how C and N cycles under cultivation of indigenous vegetables on West African soils respond to the application of organic manure and fertilizer microdosing is crucial in estimating the sustainability and productivity of the soil.
Indigenous leaf vegetables such as the local amaranth (Amaranthus cruentus) are an integral part of agriculture in SSA; they contribute to human nutrition and traditional medicine and play a key role in the rural economy and family subsistence. The objective of this study is to investigate the effect of manure and fertilizer treatments on both GHG emissions and soil organic matter (SOM) speciation by determining and quantifying the impact of reduced mineral nitrogen fertilization and organic manure on vegetable yield, emission of CO2 and N2O from SSA soils cultivated with an indigenous vegetable in a controlled environment. We hypothesize that vegetable yield, C speciation and soil emissions of GHGs (CO2 and N2O) from vegetable production in SSA soils is affected by fertility management.

2. Materials and Methods

2.1. Study Sites

Soil sampling for this study was performed at two field sites - (a) Ina, Benin Republic (9° 95 N, 2°72 E) with an elevation of 380 m, annual precipitation of 1073 mm and a mean temperature of 26.5 °C and (b) Ife, Nigeria (07°29′21.9″ N 004°34′17.3″ E) with an altitude of 293 m, annual precipitation of 1317 mm and a mean temperature of 25.6 °C, was collected and used in this phytotron study. The field site at Ina is in the dry savanna (DS) ecoregion, while the site at Ife falls within the rainforest (RF) ecoregion of Nigeria. The soils were classified as Haplic Lixisols (LXha) and Plethnic Plinthosols (PTpx), for the two eco-regions respectively [27]. Lixisols are slightly acidic soils dominated by kaolinite clays, while Plinithosols are rich in iron and manganese and have a mix of kaolinite, quartz and other minerals [27], both soil types are coarse textured. Representative soil samples were collected systematically from 10 spots on each field following a ‘W’ pattern and at 20 m intervals between each spot from field sites in both ecoregions using a soil auger up to a depth of 20 cm and homogenized into one composite sample. Soils were air dried, collected in plastic bags and shipped to the University of Saskatchewan for the phytotron experiment.
The soils were randomly distributed into different pre-designed treatments soil pots (0.15 m in diameter and height) in equal volumes, mixed with manure (for the treatments requiring manure), cultivated with the local amaranth (Amaranthus cruentus) grown from seed in the phytotron. The growth chambers were set for 16 h at 25 °C (day) and 8 h at 18 °C (night), relative humidity was approximately 55(±5)%. The experimental pots consisted of a control (C) treatment, manure (M) treatment, Manure + 80 kg N/ha (M80) treatment, No manure + 80 kg N/ha (O80) treatment and an empty soil pot microdosed (with 80 kg N/ha) without any vegetables (S80). N was applied as urea, and cattle manure was applied at 5 t/ha, and it contained 4.5% C, 0.33% N, and 0.21% P by weight. The experimental pots were arranged in a randomized complete block design and replicated 3 times for the two ecozones (i.e., DS and RF).
Soil samples were collected before planting and after harvest, air-dried, sieved (>2 mm), and analyzed for particle size, pH, EC, total N, total P, total organic C, and C FTIR using standard methods. The vegetables were grown for 45 days after emergence. Particle size analysis was done using the hydrometer method [28], pH was measured in triplicate using a glass electrode in a 2:1 water:soil suspension, with 10 mL of water and 5 g of soil [28]. The TOC was analyzed using triplicate 0.25 g of very fine (<250 µm particle size) samples on an automated C632 LECO analyzer (LECO © Corporation, 1987) with a preset combustion temperature of 1100 °C. Low C standard reference materials was used for calibration and a quality control sample was measured after every 20 samples. Total N and P were measured in triplicate using the H2SO4–H2O2 acid block digestion method of Thomas et al. (1967). Digests were then allowed to cool to room temperature, diluted and analyzed on a Folio AA3 auto-analyzer. A standard soil of known concentration of N was used for quality control.

2.2. Measurement of GHG Emissions

The GHG experiment was conducted under controlled conditions in the phytotron. Gas samples were collected at 0, 1, 2, 3, 4, 5, 8, 14 and 21 days after planting from the experimental pots to determine total N2O and CO2 emissions. Air samples were collected from the headspace of the soil pot using a 30 mL gas-tight syringe at time 0 and then at 60 min (the chambers did not have fans to circulate the air, so we assumed that the air would equilibrate after 60 min). The collected air samples were transferred to a pre-evacuated 12-mL Exetainer vial (Labco Inc.; Ceredigion, UK) that was then analyzed via gas chromatography to determine the total concentrations of N2O and CO2 in the headspace samples. Ambient air samples were collected, and the ambient air temperature inside the chambers was also recorded. Total concentrations of N2O and CO2 in the headspace gas were determined using a Scion 456-GC gas chromatograph equipped with an electron capture detector (ECD) for the determination of N2O and a thermal conductivity detector (TCD) for the determination of CO2. To avoid ‘pulsing’ or the ‘Birch effect’ [29], soil pots were watered to 50 (±4)% water filled pore space at most 12 h before gas samples were taken. The N2O and CO2 emissions was calculated as the product of the increase in N2O and CO2 concentration above ambient air and the volume of the headspace divided by the time the headspace was sealed and the soil surface area.

2.3. FTIR Spectroscopy

Speciation of SOC for the finely ground soil samples was investigated using ATR-FTIR spectroscopy using a Bruker Optics Equinox 55 FTIR spectrometer equipped with a Mercury Cadmium Teluride (MCT) detector and single bounce PlatinumIR ATR accessory with diamond coated ZnSe optics. Spectra were collected by averaging 128 scans at 4 cm−1 resolution over a spectral range of 4000–400 cm−1 and were background corrected by using the spectrum of the empty ATR crystal with ambient air as reference. The 1800–900 cm−1 region was considered for the analysis of C functional groups in this study; the spectral region between 900 to 400 cm−1 was excluded due to being dominated by vibrations of soil minerals [30], while the bands between 2700 and 1800 cm−1 were excluded because the information attributable to organic matter is masked by C-C stretching of the diamond ATR crystal and noise from CO2. Similarly, the bands at about 3600–3000 cm−1 are strongly influenced by water content [31] and were excluded as they may vary between the analyzed soil samples. Baseline correction of the spectra was performed using OPUS (ver. 6.5, Bruker Optik GmbH, Ettlingen, Germany) spectral processing software package. As there is a strong overlap among the bands of organic functional groups, individual bands were resolved by spectral deconvolution using a series of Gaussian curves fit on the Fityk software package (version 1.2.1) [32] as described in Dhillon et al. (2017) [24]. Spectral deconvolution was performed on a total of 39 samples from RF and DS ecoregions.
The curve parameters were constrained to ensure equal FWHM (full width at half maximum) of the curves. Individual spectral band identification was performed by using the available knowledge of characteristic infrared peak positions of soil organic compounds as reported in the literature, and the peaks were fitted as shown in Figure 1. Peaks were excluded from further analysis when not present in ≥5 samples. The relative absorbance intensity (rA) of the deconvoluted bands was calculated by dividing the area of individual bands within the 1800–900 cm−1 wavenumber region (i.e., 1000, 1100, 1160, 1430, 1540, 1600, 1640 cm−1) with the sum of total area of all the bands in this region (e.g., A1540 = A1540/Σ A(1000–1640 cm−1)). Arithmetic means of the relative intensities of the absorption bands for three soil samples, collected from each soil pot, were calculated for each band to obtain the representative relative intensities of the bands for all samples. The relative intensity of the bands depends on the amount of absorbing functional groups, and it was used as a semi-quantitative estimate of the relative proportion of C functional group within each soil sample, such that high absorption intensity indicates high content of the corresponding functional group and vice versa [33].

2.4. Statistical Analysis

IBM Statistical Package of Social Sciences (SPSS Inc.) statistics v.26 was used to perform repeated measure analysis of variance (ANOVA) to determine the significance of treatment and interaction effect on vegetable yield, soil chemical properties, and gas measurements. Tukey’s Least-significant difference (LSD) test at a probability level of p ≤ 0.05 was used for post-hoc comparison of individual treatments within the ecoregions. Pearson correlation was used to determine the relationship between spectral bands and soil chemical properties.

3. Results

3.1. Soil pH and Vegetable Yield

Vegetable yield and soil pH for control and fertilizer treatments for the soil samples of both ecoregions are shown in Figure 2a,b respectively. RF samples generally had a significantly lower pH except for O80 and S80 (Figure 2b; Table 1 and Table 2), and significantly higher vegetable yield (Figure 2a) compared to the DS samples. The pH ranged from 4.7 to 5.5 in the RF soil samples and 4.5 to 6.1 in the DS soil samples for different fertilizer treatments (Figure 2b). In soils of both ecoregions, soil pH was significantly affected by treatment (Table 2). In the RF samples, all treatments increased soil pH compared to the control, with the increment in pH highest in the urea treatment, O80 (Figure 2b). In the DS samples, the M and M80 treatments significantly increased soil pH, while the treatments which received urea only maintained (O80) or reduced (S80) soil pH compared to the control treatment (2b).
Soil pH was significantly reduced after harvest in the DS samples for all treatments except S80, while in the RF samples, the difference in soil pH after harvest was not statistically significant (p = 0.243). Yields ranged from 4330 kg/ha to 7900 kg/ha in the RF, and 3165 kg/ha to 4821 kg/ha in the DS (Figure 2a). Note that S80 has no yield because no vegetable was seeded into that treatment. While the yield difference between the RF and DS ecoregions was significant (Table 2), statistical analysis showed that all treatments that received some sort of N fertilization, either manure, urea or both, yielded significantly better than the control in both ecoregions (Figure 2a). In samples from both ecoregions, vegetable yield was highest in the treatment that received only urea, O80, followed by the treatment that received both urea and manure (M80), and the treatment that received only manure (M). However, the yield differences between the M, O80 and M80 treatments was not significant.

3.2. Soil N, P and organic C content

Total N concentrations ranged from 0.12 to 0.22% in the RF samples and 0.07 to 0.10% in the DS samples. Total P concentrations ranged from 0.06 to 0.08% in the RF and 0.04 to 0.06% in the DS, while organic C concentrations ranged from 1.66 to 1.87% in the RF and 0.55 to 0.63% in the DS (Table 1). The difference in the total N, P and organic C concentrations between the ecoregions is statistically significant (Table 1). Within the ecoregions, statistical analysis found no significant treatment and time effect on total N, P and organic C concentrations, indicating that the addition of urea and/or manure does not significantly increase N, P, and organic C concentrations in this system and at the rates applied. However, in the DS samples, treatment effect on organic C concentrations was significant (Table 2), with the single addition of manure increasing the organic C concentration, while the combined addition of manure+urea M80, maintained the current level of organic C concentration (Table 1). The urea treatments, O80 and S80, saw a decline in organic C concentration (Table 1).

3.3. GHG Emissions

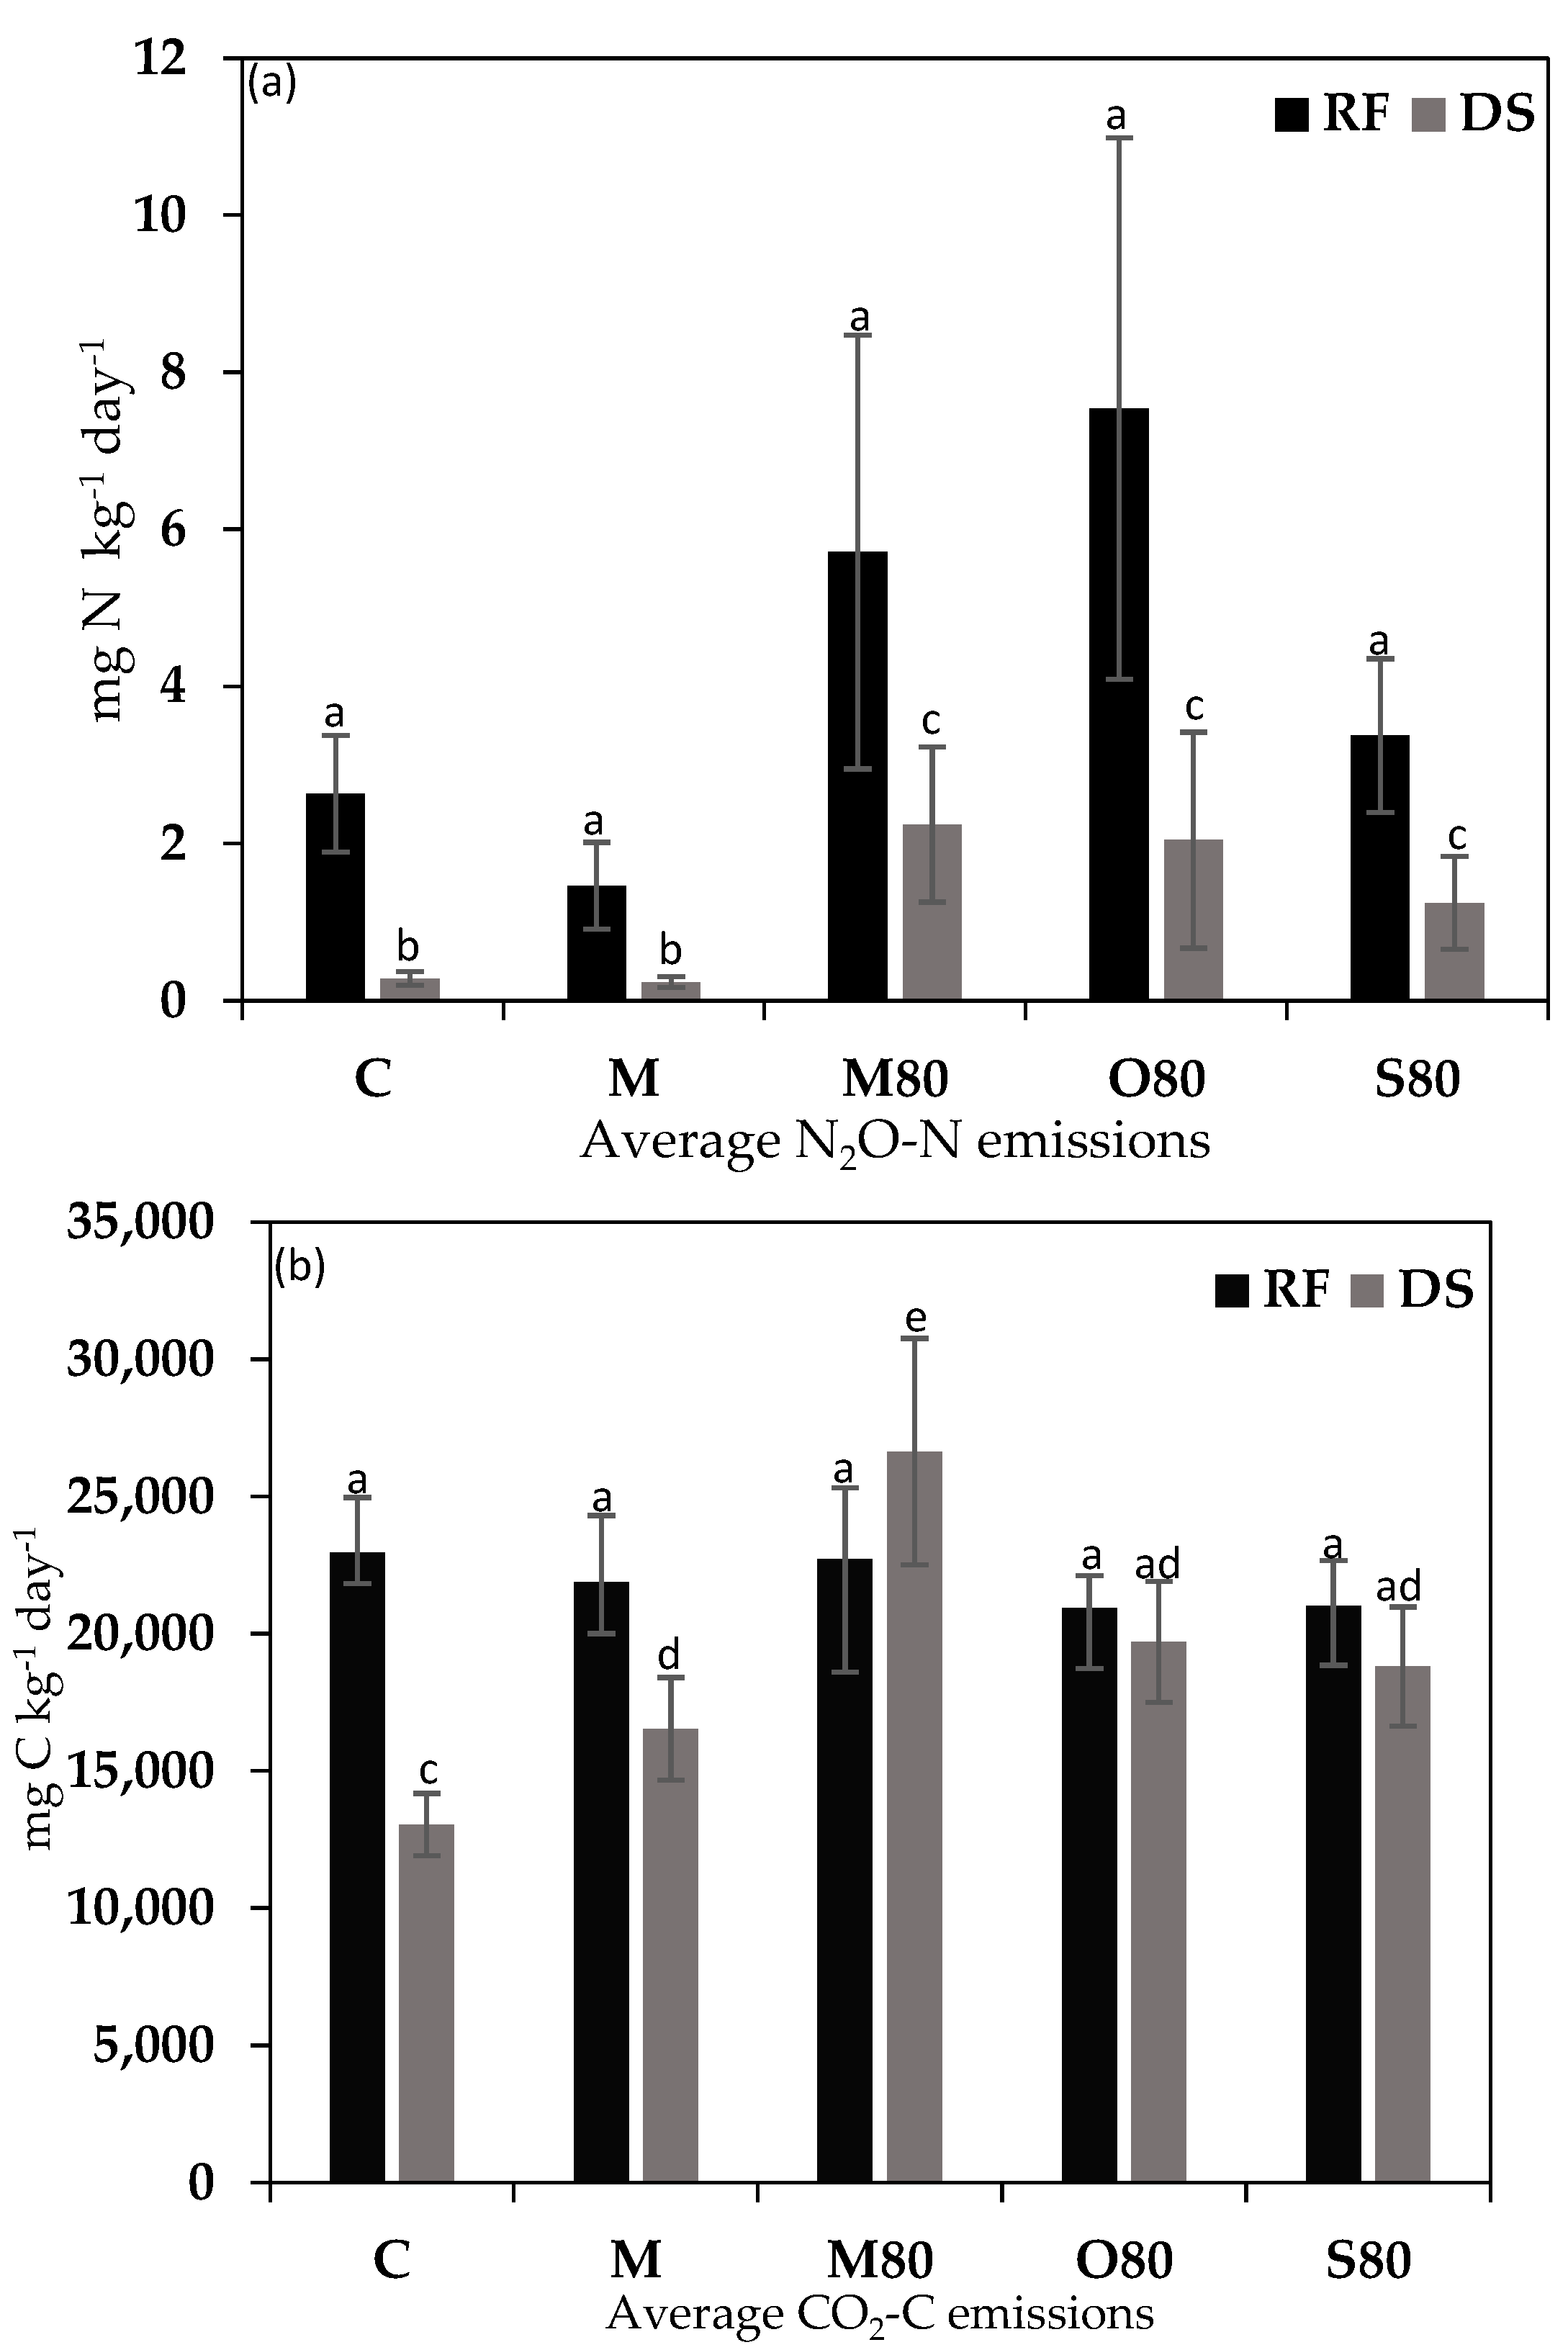
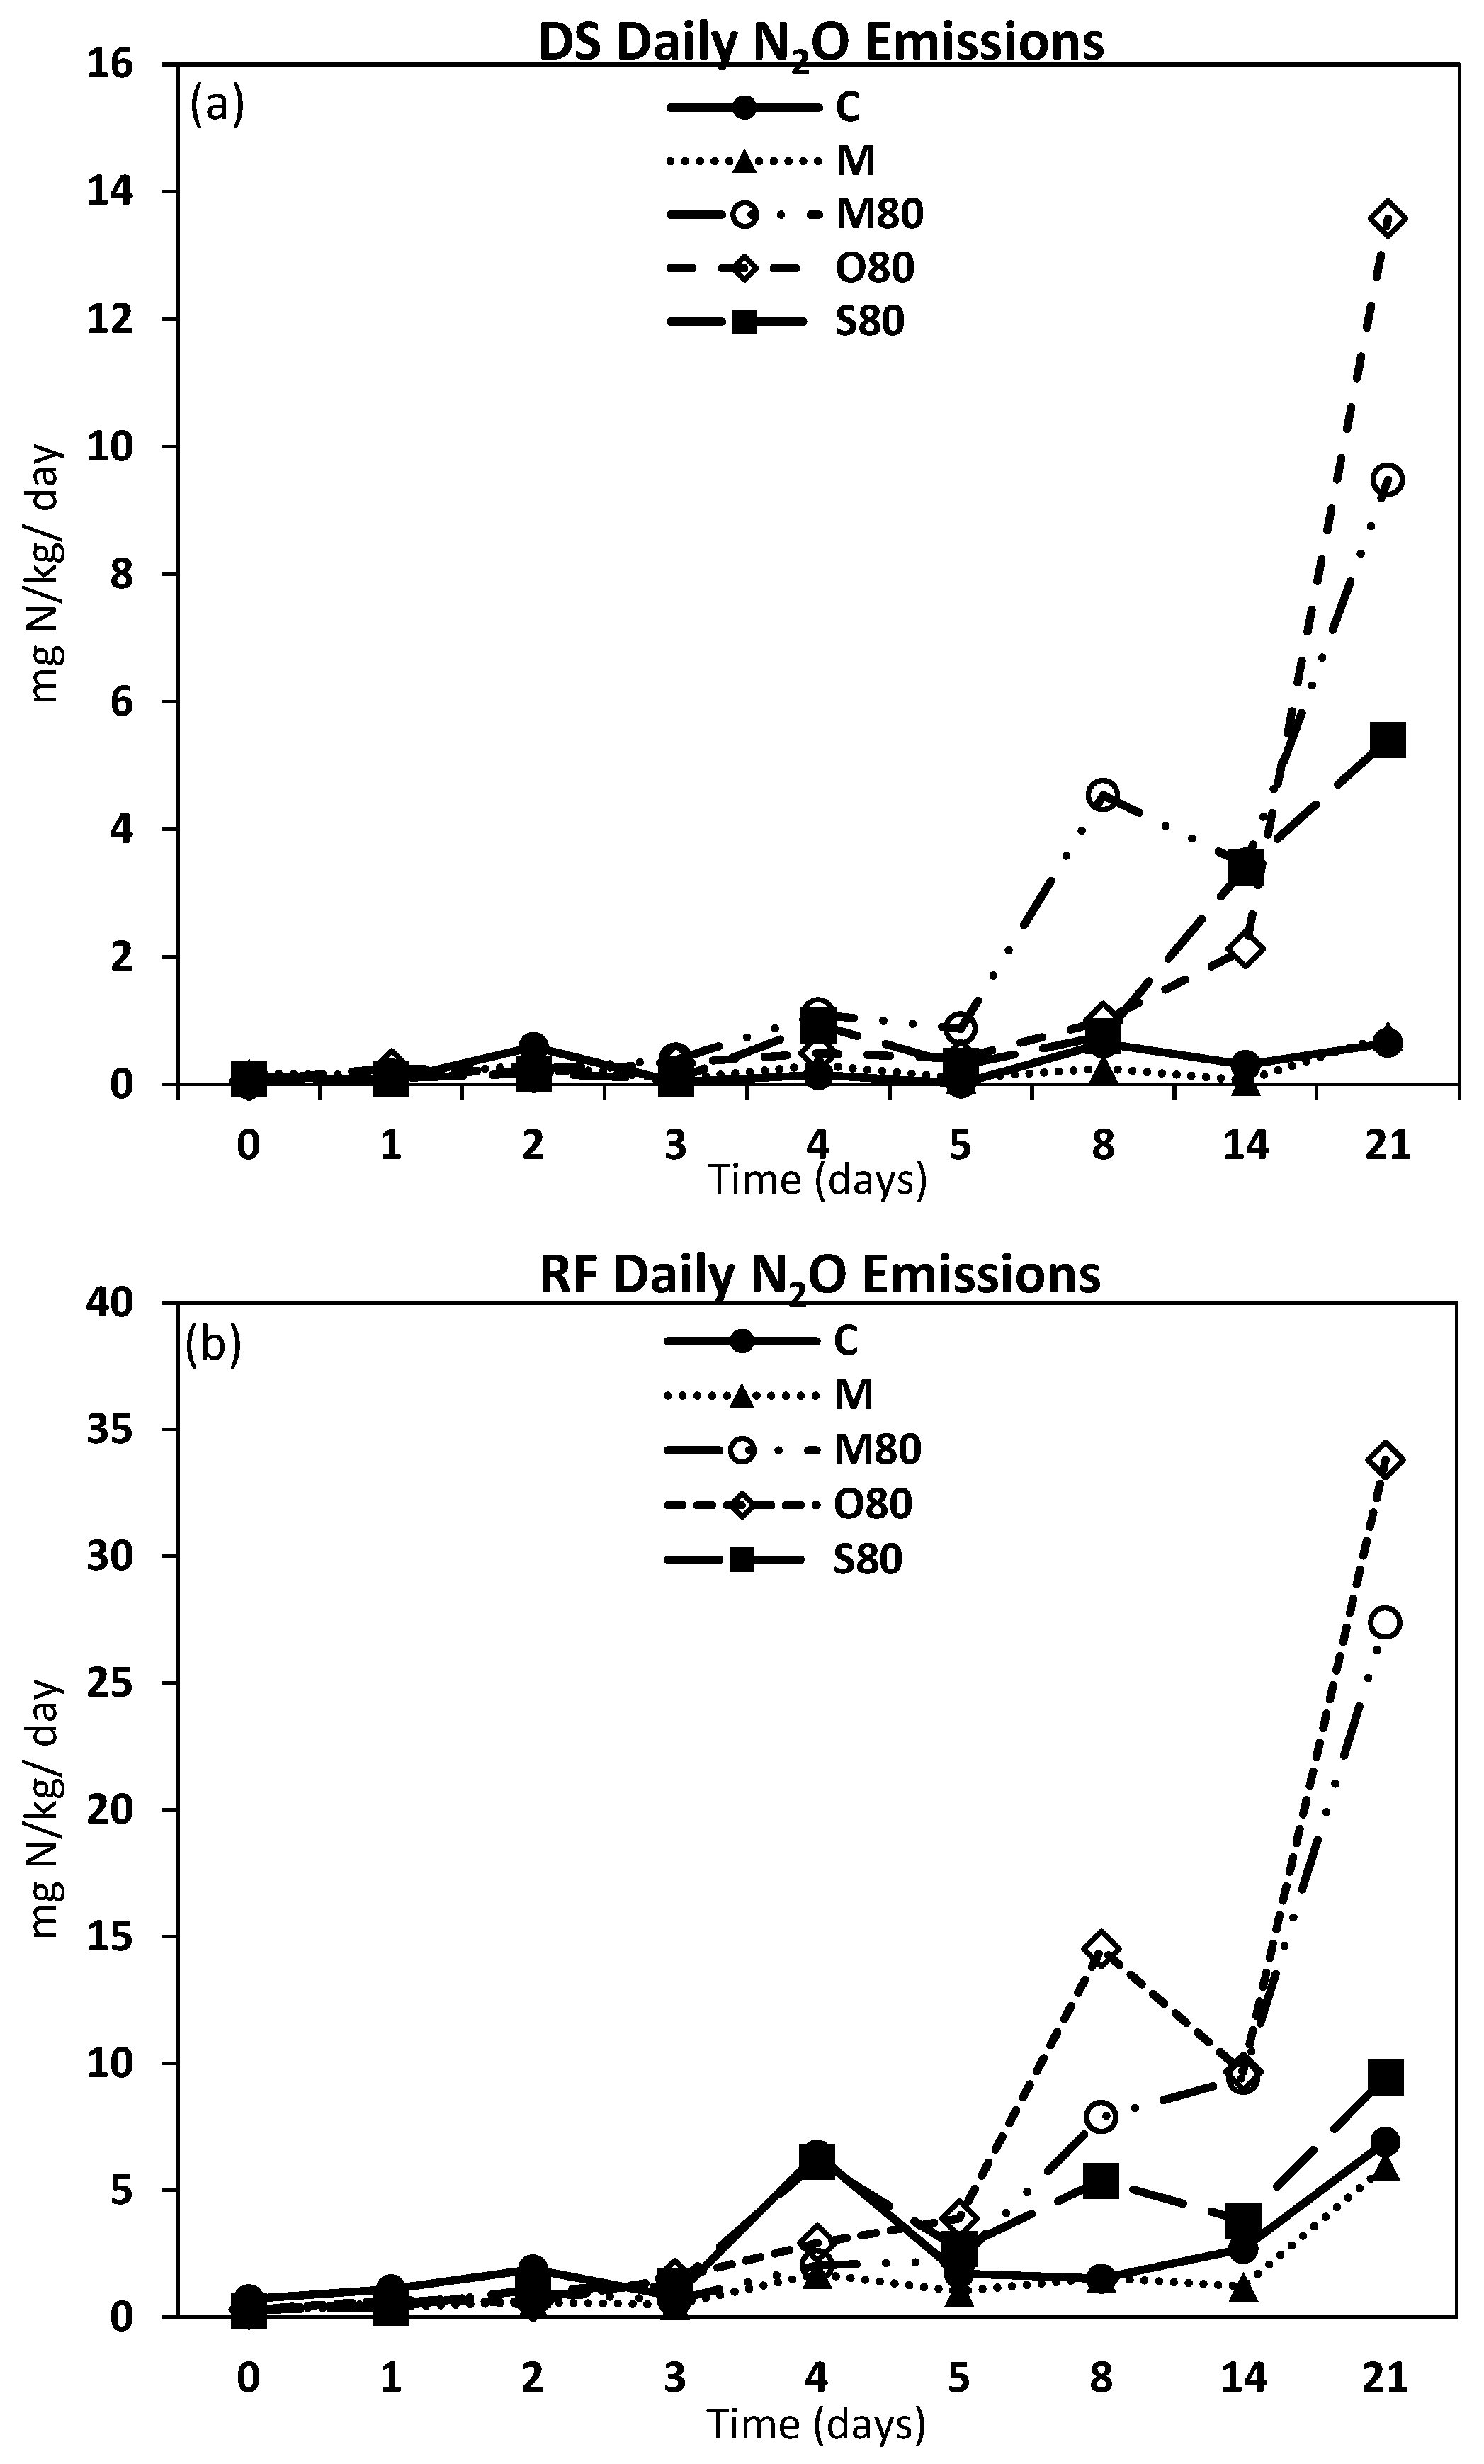
Daily N2O emissions ranged from 0.012 to 13.58 mg N/kg/day in the DS (Figure 3a), and in the RF, ranged from 0.27 mg to 33.80 N/kg/day (Figure 3b). In both ecoregions, daily N2O emissions were higher in treatments that received urea and manure+urea than in the controls, C or manure treatment which had the lowest emissions in both ecoregions (Figure 3a,b). When we averaged the total emissions of each treatment by ecoregion over the 21 days, in the DS, the treatment that received manure (0.24 mg N/kg/day), had a lower daily N2O emission than the manure + urea, M80, treatment (2.24 mg N/kg/day) which was nine times as much as the manure treatment emissions, while the urea treatment, O80 (2.04 mg N/kg/day) was more than eight times the emissions of the manure alone (Figure A1a). In the RF, the manure + urea, M80, treatment (5.71 mg N/kg/day) had a lower N2O emissions than the urea treatment, O80, (7.54 mg N/kg/day), and nearly tripled the emissions from the control, C, (2.64 mg N/kg/day). However, the difference in the daily N2O emissions between the M80 and O80 was not statistically significant (Figure A1a). N2O emissions in both ecoregions was lowest in the C and M treatments, (Figure A1a,b).
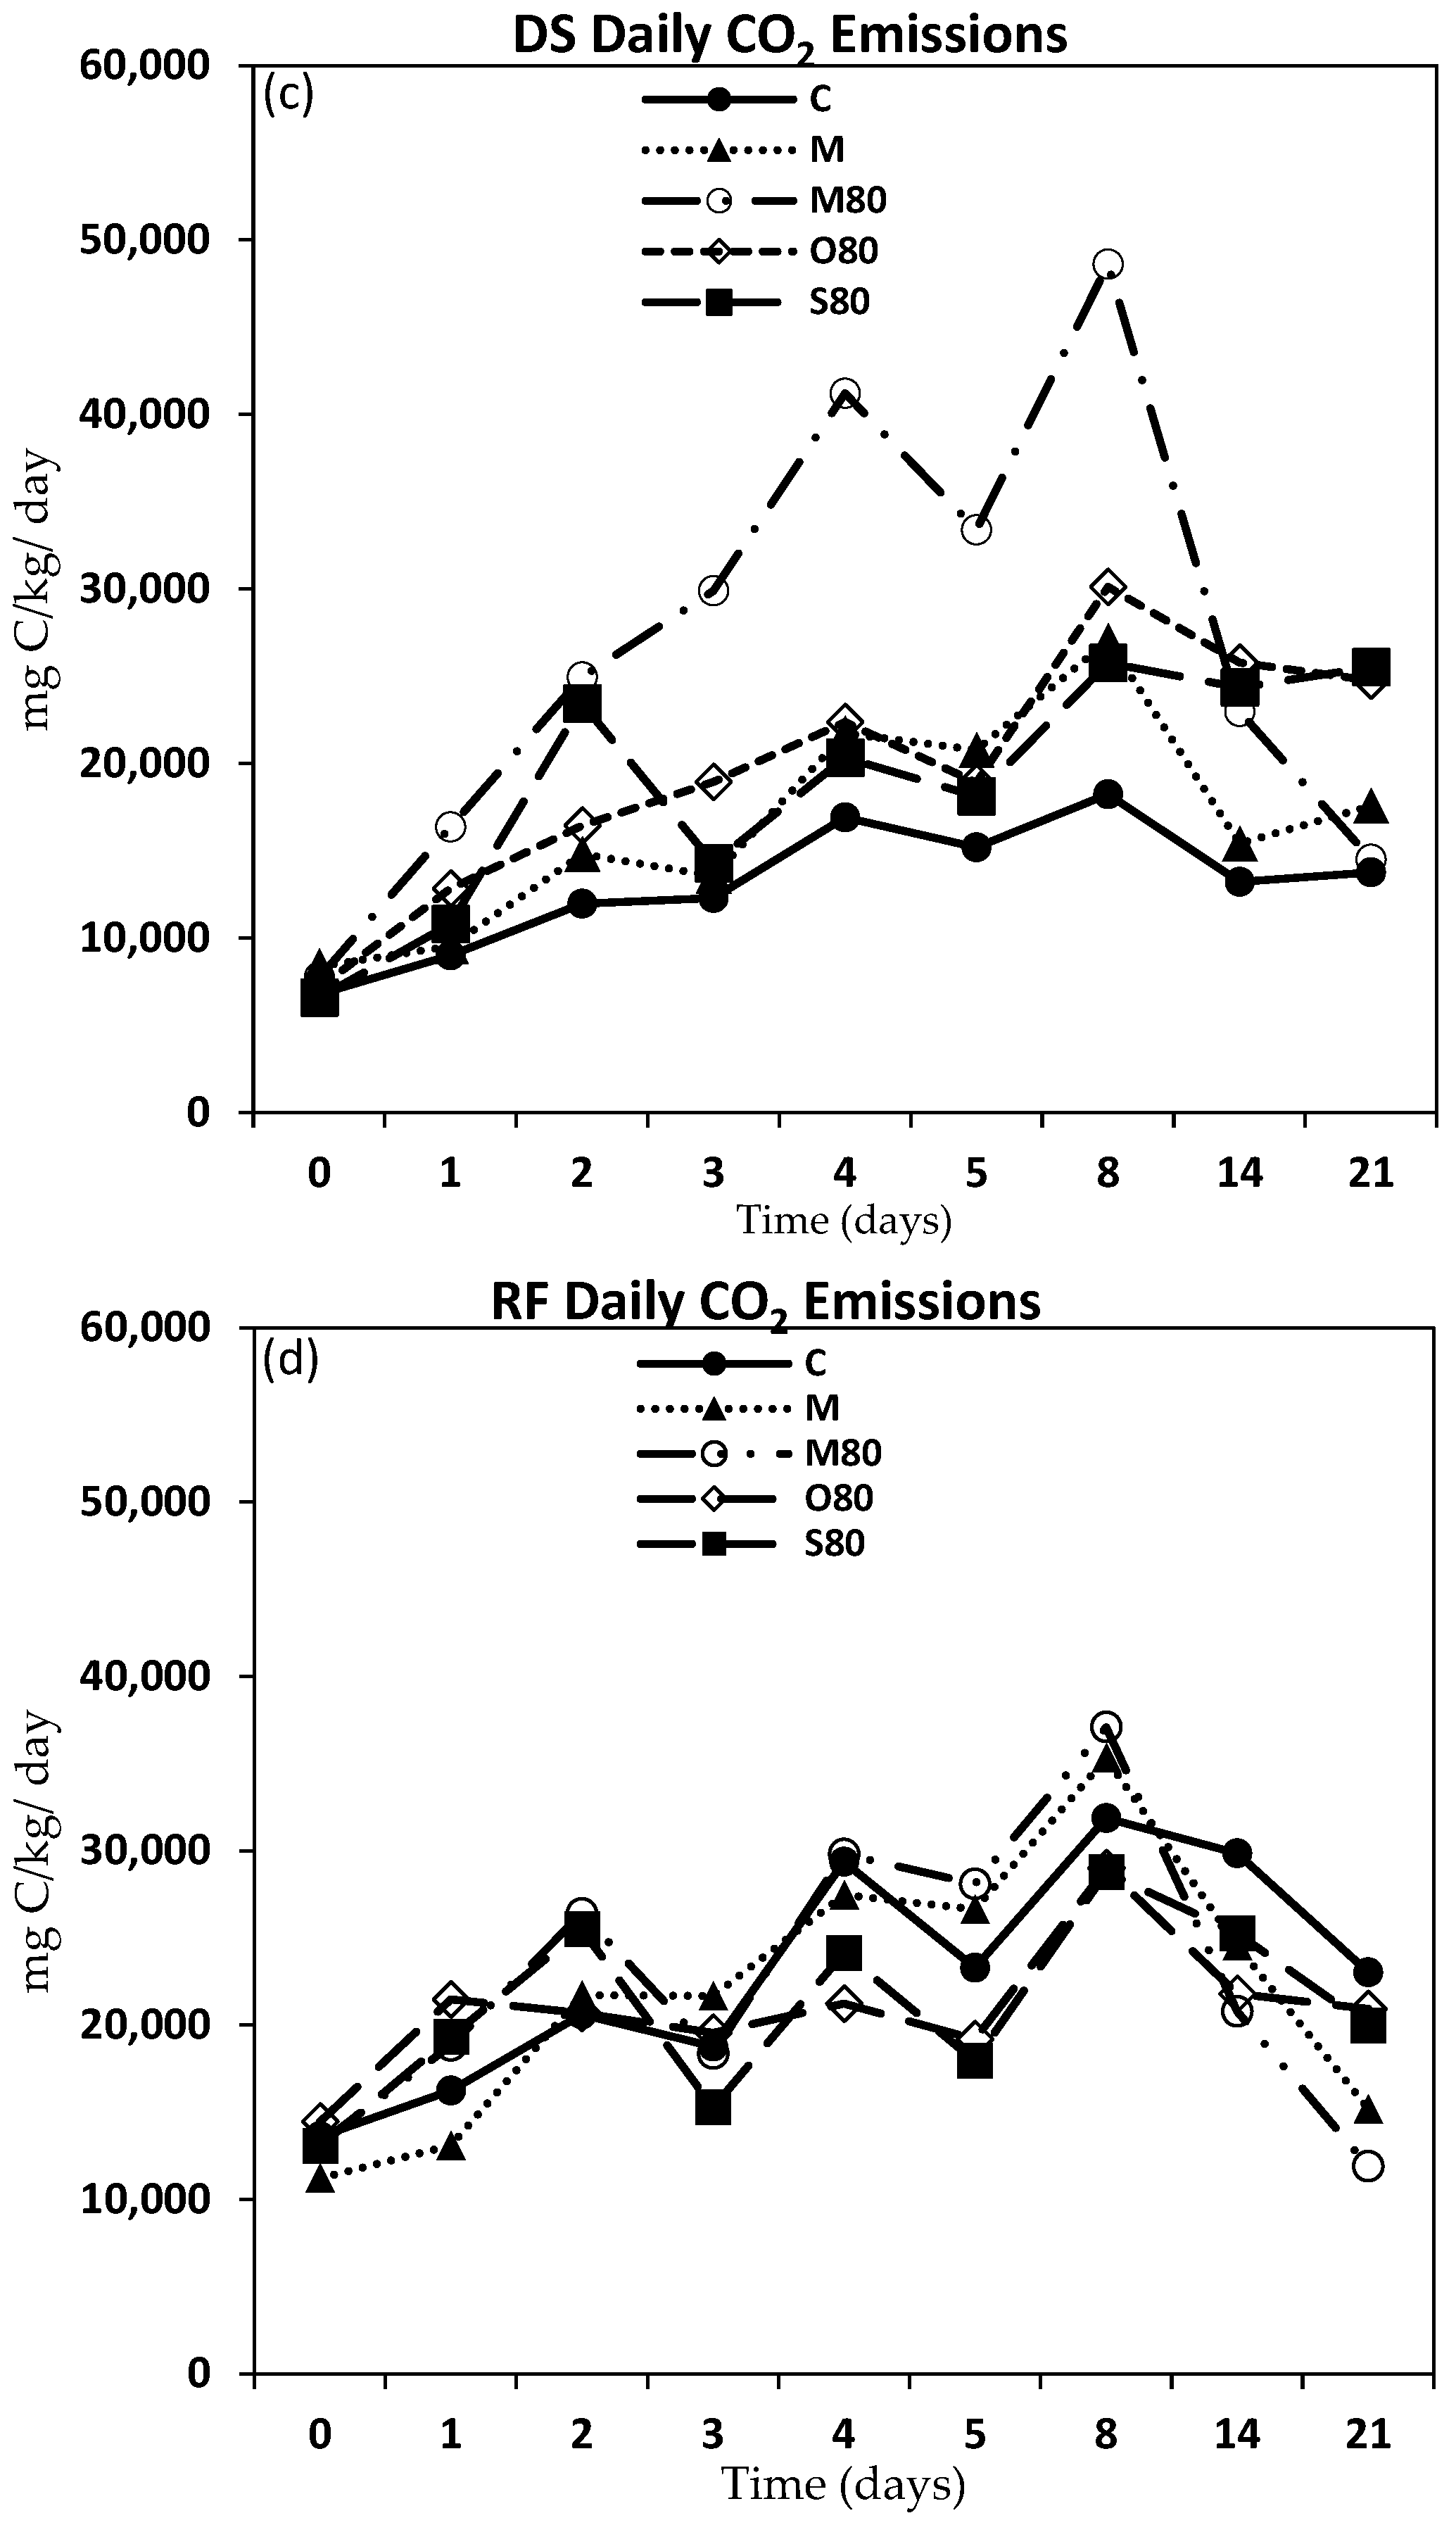
Daily CO2 emissions ranged from 6.59 to 48.62 g C/kg/day in the DS, (Figure 3c), compared to the RF, which ranged from 11.23 to 37.10 g C/kg/day (Figure 3d). When we averaged the total emissions of each treatment by ecoregion over the 21 days, in the RF soils, CO2 emissions increased from O80 (20.94 g C/kg/day) < S80 (21.03 g C/kg/day) < M (21.88 g C/kg/day) < M80 (22.73 g C/kg/day) < C (22.98 g C/kg/day). In the DS, CO2 emissions followed the order M80 (26.63 g C/kg/day) < O80 (19.71 g C/kg/day) < S80 (18.80 g C/kg/day) < M (16.54 g C/kg/day) < C (13.04 g C/kg/day) (Figure A1b).
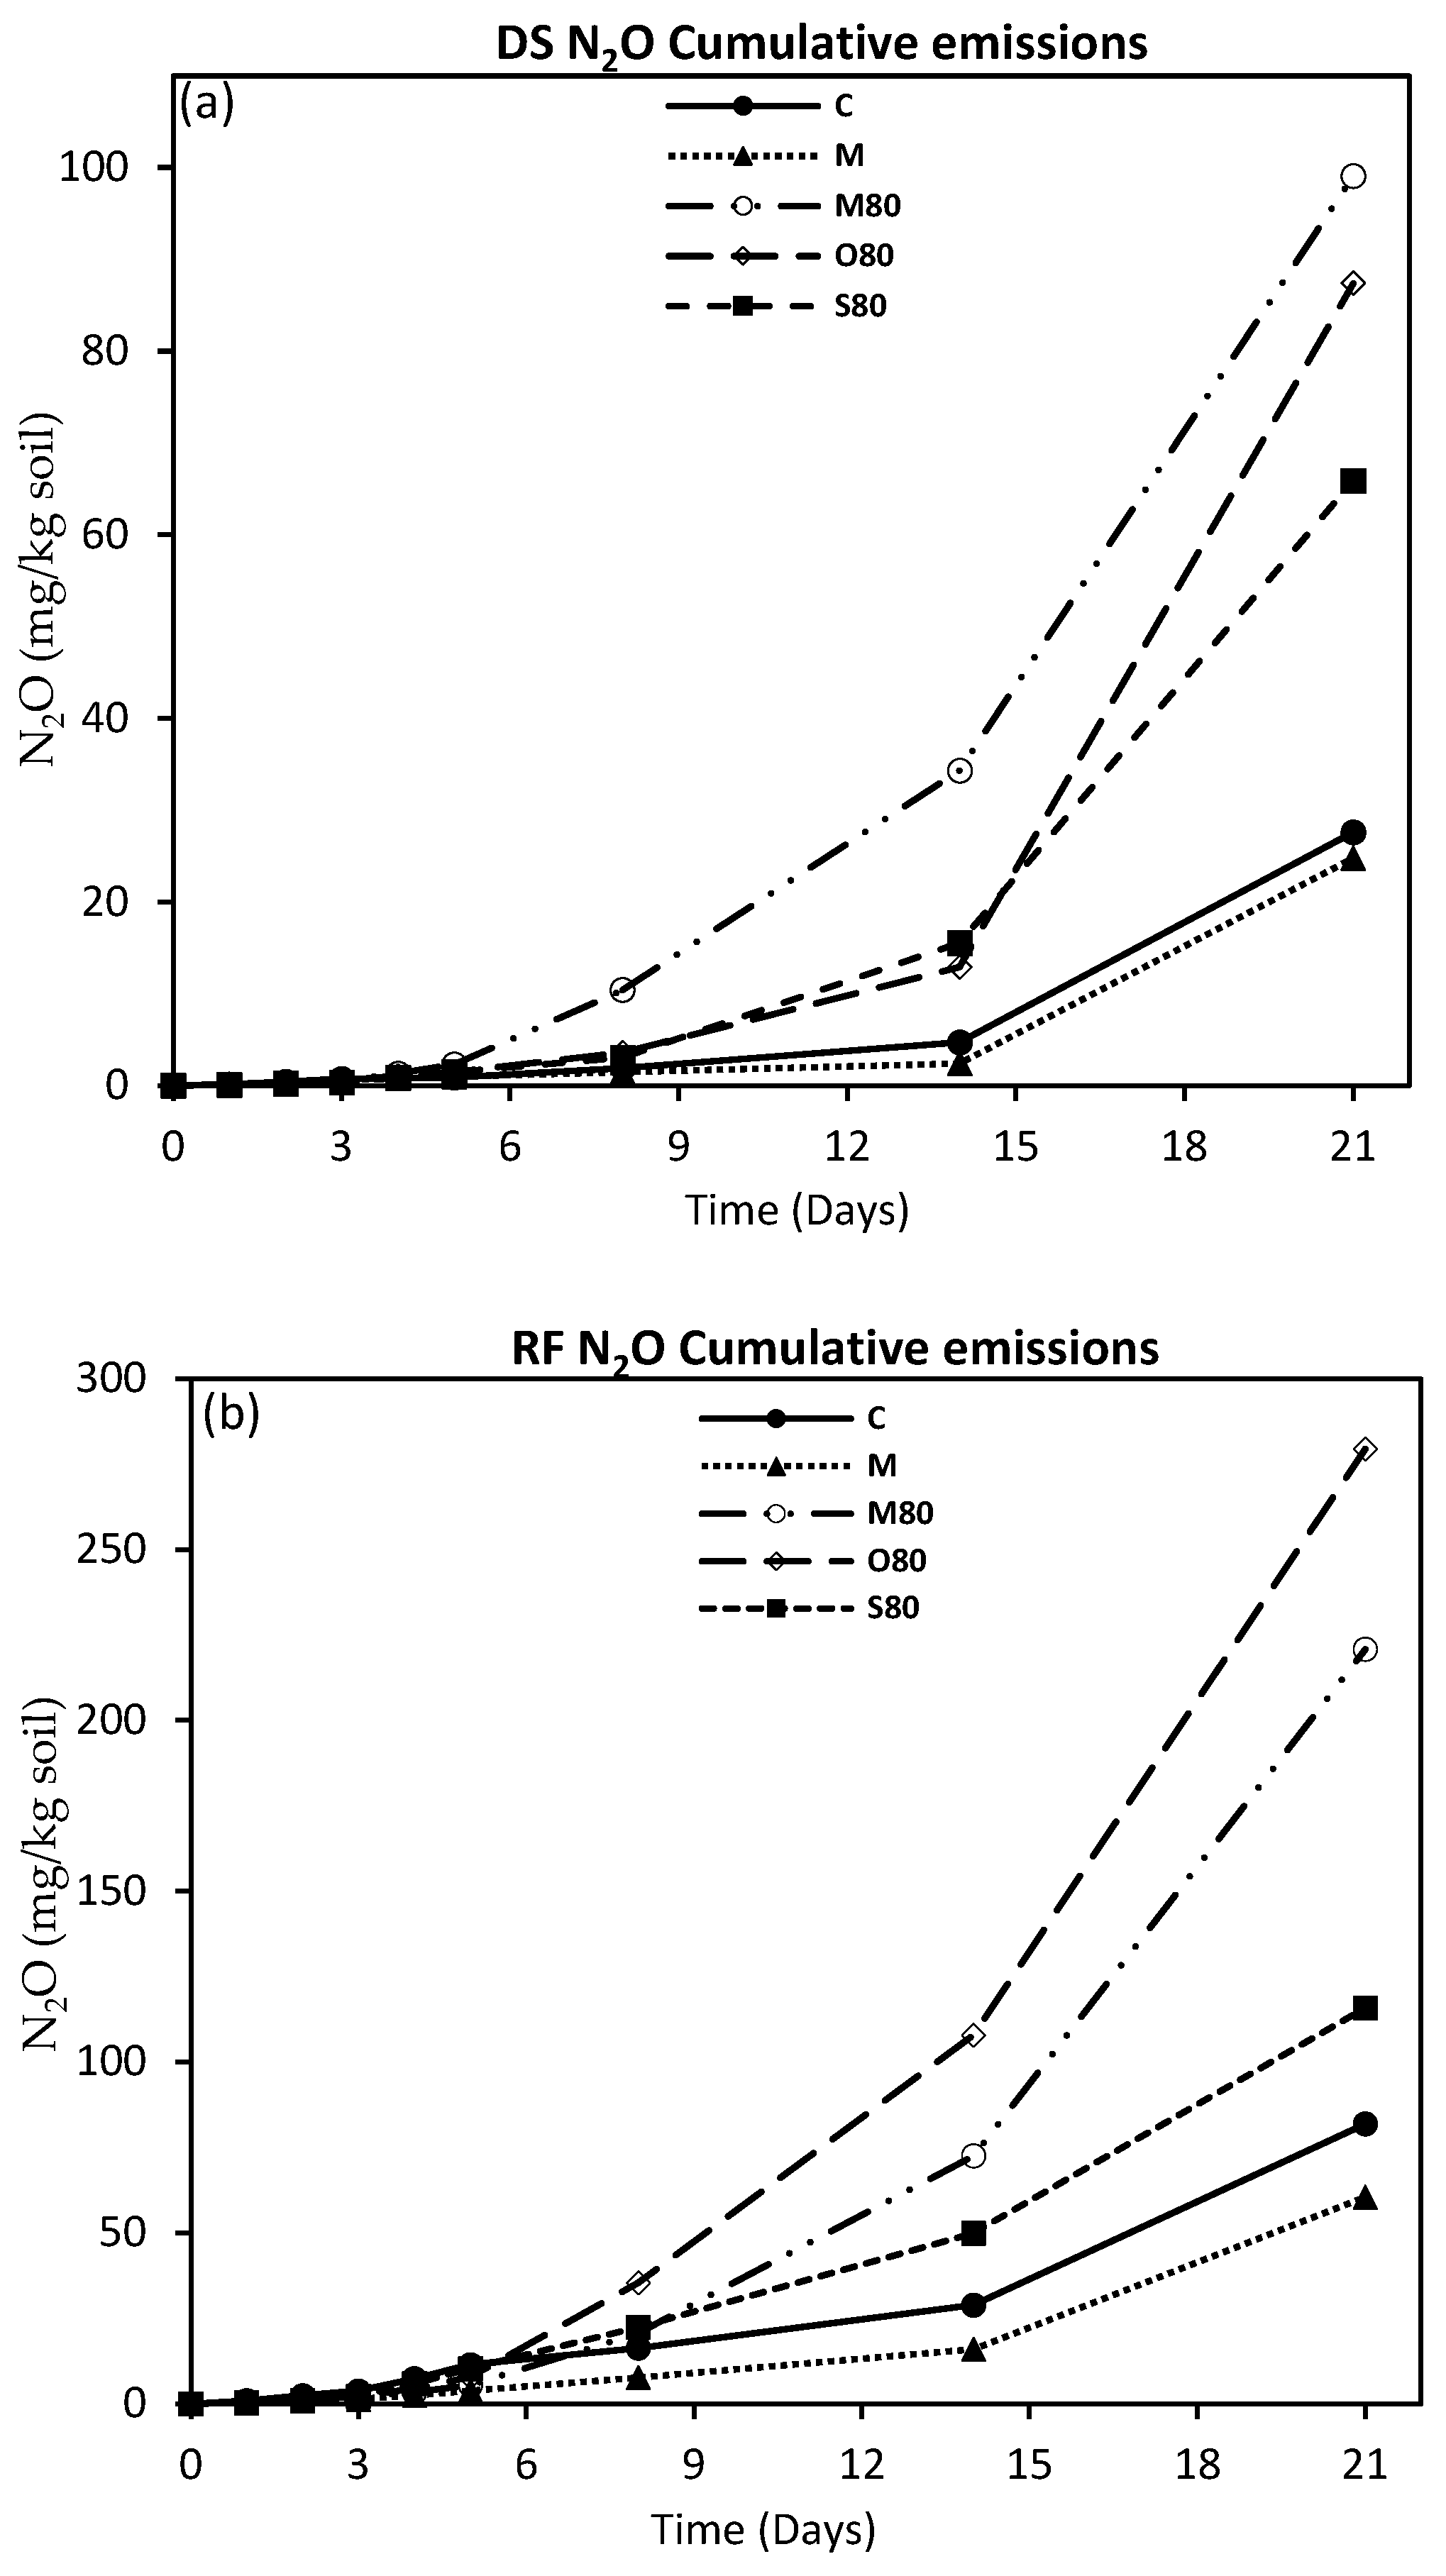
Cumulative N2O emission ranged from 24.78 to 99.08 mg N/kg soil in the DS (Figure 4a) (Figure 4b), and 64.53 to 279.54 mg N/kg soil in the RF and was higher in the RF than in the DS. In the RF, cumulative N2O emission was highest in the urea treatment, O80 (279.54 mg/kg soil N), followed by the manure + urea treatment, M80 (220.86 mg N/kg soil), the S80, C and M had 115.81, 81.94, and 60.53 mg N/kg soil respectively (Figure 4b). In the DS, M80 (99.08 mg N/kg soil) had the highest cumulative N2O emission, followed by the urea treatment, O80 (87.39 mg N/kg soil), the S80, C and M had 65.89, 27.59, and 24.78 mg N/kg soil respectively (Figure 4a). In both ecoregions, the manure treatment had the least cumulative N2O emission and was even lower than the control (Figure 4a,b).
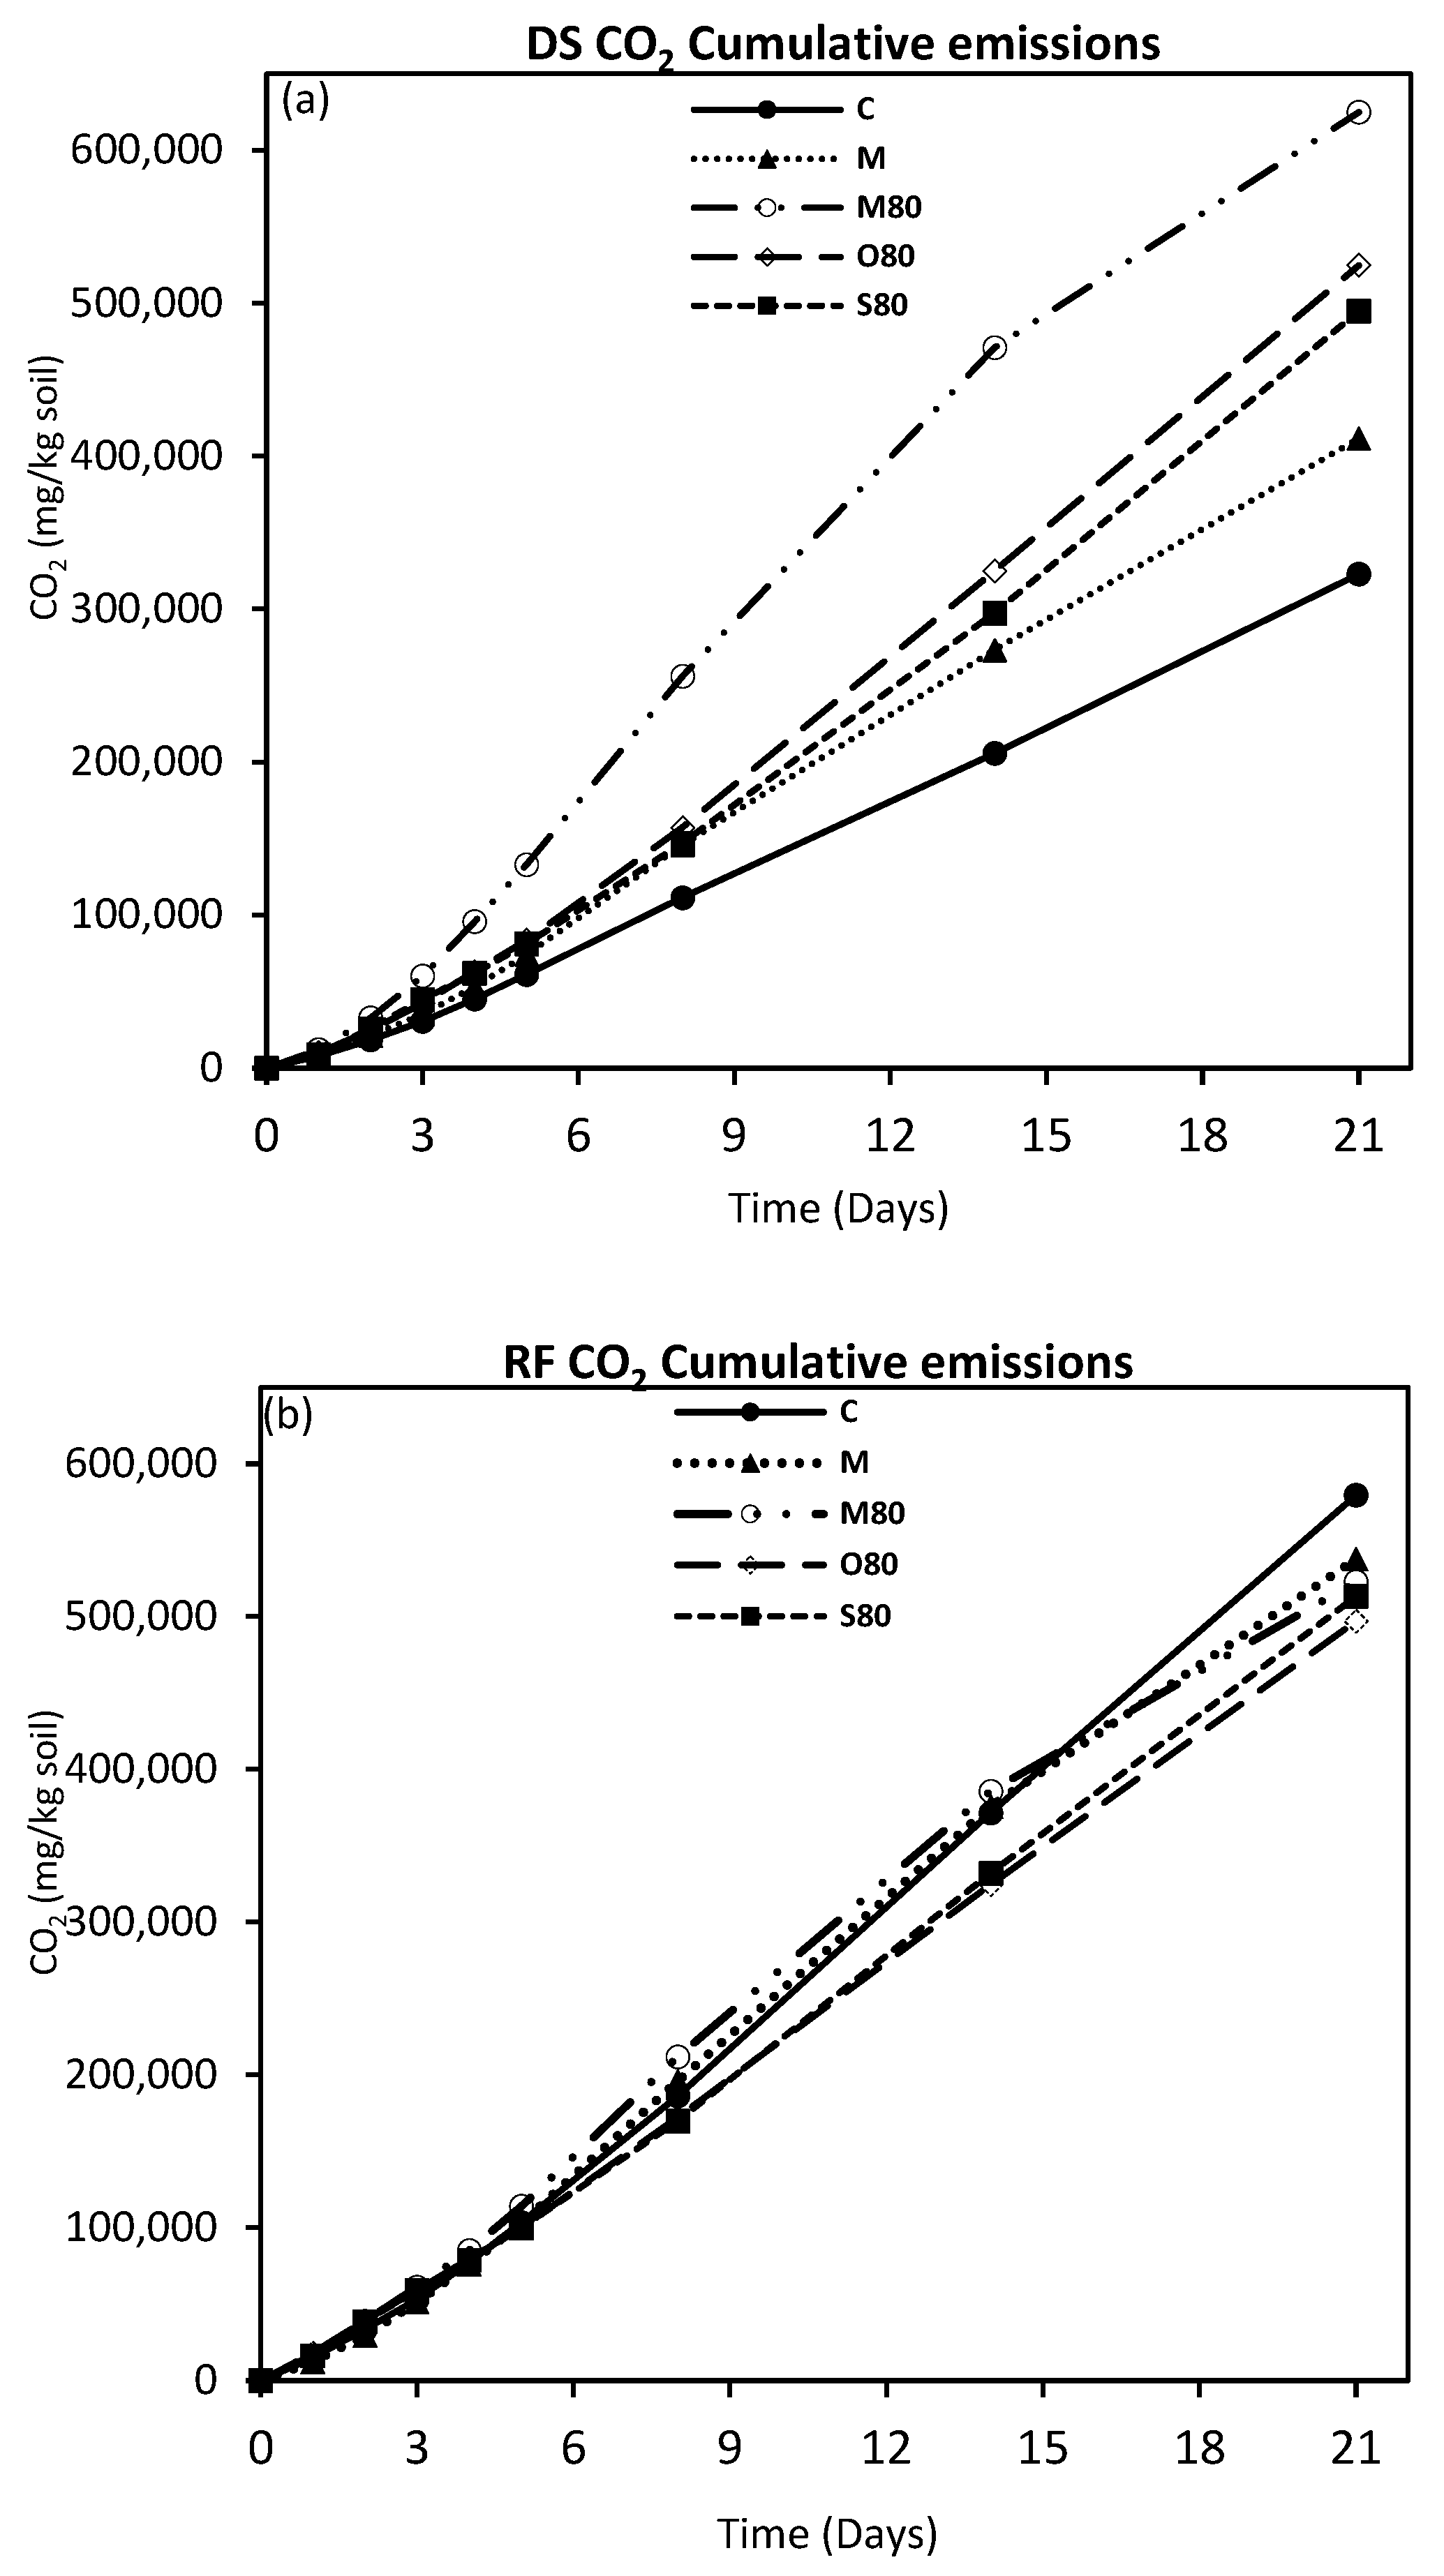
Cumulative CO2 emission ranged from 322.96 to 624.97 g C/kg soil in the DS, and 497.06 to 579.47 g C/kg soil in the RF (Figure 5b) (Figure 5a). In the RF, cumulative emission was highest in the control, C (579.47 g C/kg soil), followed by the manure, M (537.60 g C/kg soil), manure + urea, M80 (522.91 g C/kg soil), soil pot, S80 (513.12 g C/kg soil) and it was least in the urea treatment, O80 (497.06 g C/kg soil) (Figure 5b). In the DS, cumulative CO2 emission was highest in the manure + urea, M80 (624.97 g C/kg soil), followed by the urea treatment, O80 (524.72 g C/kg soil), soil pot, S80 (494.88 g C/kg soil), the manure, M (411.61 g C/kg soil), and the control, C (322.96 g C/kg soil) which had the least cumulative (Figure 5a) CO2 emission.

3.4. ATR-FTIR Spectroscopy

The relative abundance of different C functional groups (Table A1 and Table A2) was estimated using the relative intensities of the ATR-FTIR bands. While the FTIR bands did not show statistically significant differences amongst the fertilizer treatments, there were similar trends amongst the FTIR bands of related C functional groups. In the DS samples, the bands at 1430, 1540, 1600 and 1640 cm−1 had the highest relative absorbance in the manure+urea (M80) treatment, followed by the manure (M) treatment (Figure 6). In contrast, the bands at 1000, 1100 and 1160 cm−1 showed higher relative absorbance in urea treated samples (S80, O80 and M80) (Figure 6c). The absorbance band near 1640 cm−1 is attributed to C=O stretching of carboxylates and conjugated ketones, as well as to aromatic C (C=C) stretching [24,34,35], while the band at 1430 cm−1 is assigned to aliphatic (C-H) bending of CH2 and CH3 groups [34,35]. The band around 1600 cm−1 is assigned to amide N-H bends and C=N stretching of amides [34]. The absorbance band at 1540 cm−1 is assigned to aromatic C-H and C=C vibrations [36]. The bands at 1160-1000 cm−1 are assigned to C-O-C and C-OH stretch of polysaccharides, polysaccharide-like compounds [35] or of other groups such as alcohols, ether and esters [37,38]. Thus, processed C forms such as aromatic-C, aliphatic-C and carboxylic-C showed higher abundance in manure-treated samples (M and M80), while the polysaccharide-derived C forms are of higher abundance in urea-treated samples (S80, O80 and M80) in the DS samples.
In the RF samples, the 1640 cm−1 band had the highest relative absorbance in the control and the manure treatments, and followed by the urea treated samples (S80 and O80), with the M80 treatment having the least relative absorbance (Figure 7a). For the 1430 cm−1 band, the S80 treatment had the highest relative absorbance, with the C and M, and M80 and O80 having identical absorbance (Figure 7b). For the band at 1000 cm−1, the urea treated samples (S80 and O80) had the highest relative absorbance (Figure 7a), followed by the C and M treatments, which had similar relative absorbance, and the M80 treatment having the least relative absorbance. Unlike the DS samples, the samples in RF soils did not show repeatable trends between the fertilizer treatments.
A correlation analysis found the bands at 1430, 1540, 1600 and 1640 cm−1 to be positively correlated with soil pH in the DS. While in the RF, there was a negative correlation between the bands and total N. There was also a negative correlation between the 1000 cm−1 band with SOC in both the DS and RF (Table 3).

4. Discussion

4.1. Soil pH and Vegetable Yield

The lower pH of RF soils (Figure 2a,b) may be related to that soil having a higher Fe- or Al-related clay content than the DS soils [27,39], while the decrease in pH observed in soils of the DS after harvest (Table 1) may be caused by rhizosphere acidification due to organic acids or root exudates released by the vegetable. The significantly better vegetable yield measured in the RF soils over the DS (Figure 2a; Table 2) may also be attributed to the RF soils being able to retain nutrients better than the DS soils due to their higher clay content [39], and the higher inherent organic C, N and P nutrient levels of the RF soils than the DS soils (Table 1).
The yield response observed in all treatments receiving N, either in the form of manure and/or urea in both ecoregions (Figure 2a) strongly suggests that N is limiting in these soils. We also found that vegetables will respond to any form of N addition, and the magnitude of the yield response will be influenced by the bioavailability of N and potential soil retention (as determined by soil organic matter content and soil structural properties). The urea treatment, O80 which marginally (but not significantly) out yielded the manure+urea treatment M80, and manure treatment M, in soils of both ecoregions (Figure 2a) provides strong evidence for this. These yield findings further continue the discussion on what the best fertility management practice might be for SSA crops. For example, Mando et al. (2005) [40] reported that manure addition led to greater sorghum yield than urea addition in the Sudano-Sahel region, Tovihoudji et al. (2017) [41] reported that maize yield increases in Northern Benin were greater for the urea treatment, and followed by manure compared to the unfertilized control, while Detchinli and Sogbedji (2015) [42] recommended a combination of mineral fertilizer and farm yard manure to sustain enhanced maize crop productivity and profitability. In this study, urea fertilization had no significant vegetable yield advantage over the combined use of manure and urea, and manure alone. Thus, our results suggest that vegetable response to mineral and/or organic fertilization may be more site (ecoregion) specific.

4.2. GHG Emissions

Average daily N2O emissions increased in response to urea and/or manure addition in soils of both ecoregions (Figure A1a). In the DS soils, average daily N2O emissions (Figure A1a) and cumulative N2O emissions (Figure 4b) were lowest in the manure treatment and when manure was used in combination with urea, it increased the average daily N2O emissions in these soils (Figure A1a), and the cumulative N2O emissions, which was highest in the manure+urea treatment M80 (Figure 4b) of the DS samples. This suggests that the combined use of manure and urea slightly amplified cumulative N2O emissions in the DS samples. We know that N2O emissions are significantly influenced by interactions with other factors such as clay content and soil structure [43,44], As such, it is possible that the low SOC (Table 1) and poor structural properties of the DS soils [27,39] provided minimal protection for the N content in the soil, including the manure, and resulted in high N losses. It is also possible that these soils have a threshold of N they can retain, and once N applied exceeds soil-holding capacity, N losses increases, as found by Malhi et al. (2006) [45] where N2O emissions increased when fertilized N levels exceeded 80 kg N ha−1, or by Kachanoski et al. (2003) [46] which reported increases in soil N2O emissions at N levels above 100 kg N ha−1. If this is the case, incorporating plant residue and practicing minimal or no tillage may help improve the soils ability to retain more N [45].
The combined application of manure+urea suppressed average daily N2O emissions in the RF soils when compared to emissions from the urea fertilization alone (Figure A1a), the cumulative N2O emission was highest in the urea treatment and lowest in the manure treatment (Figure 4a), with the combined use of manure and urea slightly suppressing cumulative N2O emissions when compared to emissions from urea fertilization alone. This is consistent with other N2O emissions studies from SSA such as Nyamadzawo et al. (2017) [9] in soils from Zimbabwe with very low N content cultivated with maize and wheat, which had lower N2O emissions in plots amended with a combination of inorganic N and manure and manure alone compared to soils amended with inorganic N. Dick et al. (2008) [13] also reported that combining organic manure and urea emitted significantly less N2O in soils of Mali cultivated in a cereal-legume rotation than urea alone. Vallejo et al. (2005) [47] in a study conducted on low organic C agricultural soil in Spain also reported that the application of organic fertilizers reduced emissions of N2O, when compared to emissions from soils only treated with urea.
The lower cumulative N2O emissions in soils amended with manure can be attributed to N immobilization and slow release of mineral N [48]. It could also be that the addition of manure, a low soil C input favors complete denitrification to N2 and therefore reduces N2O emissions, or that the simultaneous addition of easily available C and N to an already deficient soil was more efficiently immobilized by the existing microbial biomass than when N alone was applied. Also, the application of manure, a low soil C input, implies a reduced energy source for microbial processes such as denitrification, while the low soil N means there is low substrate to drive both nitrification and denitrification which are responsible for the production of N2O [49]. Peng et al. (2011) [50] suggested that N2O emitting pathways compete for N with assimilatory N immobilization by both microbes and plants, and that it is only when N applied to soil exceeds microbial immobilization and plant N demand that N2O emissions increase. We propose that, in this study, additional N was likely taken up by the vegetable, leaving low amounts of N available for microbial use and loss as N2O.
In the DS soils, there was no significant difference between the average daily CO2 emissions of C, M and M80, and the urea treatment, O80, suppressed daily CO2 emissions in these soils (Figure A1b), but the manure+urea treatment, M80, amplified the emission of CO2, having a higher cumulative CO2 emission than the urea treatment, O80, and manure treatment, M (Figure 5b). This suggests that the combination of manure and urea in soils of this ecoregion increases CO2 emissions under current vegetable production system. This increment in the cumulative CO2 emissions in the manure+urea treatment may be linked to increase in the rate of decomposition and/or microbial metabolism, and is also linked to the manure+urea treatment, M80, having the highest rate of cumulative N2O emission (Figure 4b) as additional N from the manure further lowers the C:N ratio and drives decomposition forward [13], or could also be as a result of the stimulation of the activity of heterotrophic microbes caused during the hydrolysis of urea [17] thereby producing more CO2. In the RF soils, although not statistically significant, daily CO2 emissions were lowest in the urea treatment than they were in the manure+urea treatment, manure treatment and control (Figure 3b) this suggests that any form of N addition to soils of this ecoregion may lead to a decrease in CO2 emissions, and that the magnitude of the decrease is highest for mineral fertilization than for manure fertilization possibly because the addition of manure is likely introducing microbes to the soil, hence increasing CO2 emissions via microbial respiration.

4.3. Treatment Effect on SOC Composition

ATR-FTIR absorbance bands in soils of both ecoregions showed identical peak positions, indicating similar molecular C composition of SOM in soils of both ecoregions. The lack of any significant main and/or treatment effects limits our ability for comparison to just the observed trends.
The highest relative abundance of 1640 and 1430 cm−1 bands in the manure+urea, M80, treatment of the DS samples (Figure 6a,b) suggests that the combined use of manure and urea is increasing the proportion of the processed C species including aliphatic-C, aromatic-C and carboxylic-C forms in the DS samples. This observation is also supported by the lower abundance of the 1000 cm−1 band in the manure treatment and manure+urea treatment in the DS (Figure 6c) samples suggesting that the combined use of manure and urea leads to lower abundance of labile polysaccharide C species due to their higher rate of decomposition in this treatment. This increased rate of decomposition observed in the DS samples that received both manure and urea may be because the DS samples are more N deficient than the RF samples (Table 1), and as a result of the increased N input, microbial decomposition rate is increased. In the RF samples however, we observed that the combined use of manure and urea had a lower relative absorbance at the 1640 cm−1 band (Figure 7c), and similar relative absorbance at the 1430 cm−1 band with the urea treatment, O80. This suggests that the combined use of manure and urea did not increase the rate of microbial decomposition in the RF samples.

5. Conclusions

Our analysis of the soils of both ecoregions showed that the combined use of manure and urea acted differently in the RF and DS soils in terms of regulating microbial activity, C speciation and GHG emissions. We found that the combined use of manure and urea increased the rate of decomposition in the DS samples, thus, increasing the proportion of the processed C species including aliphatic-C, aromatic-C and carboxylic-C forms in the DS samples, while no such effect on decomposition was observed in the RF samples. We also found that the combined use of manure and urea led to an increase in cumulative CO2 and N2O emissions in the DS soils, but suppressed both emissions in the RF when compared to urea alone. These results agree with the trends shown in FTIR results, which showed higher abundance of processed C forms in the M80 treatment, thus indicating higher degree of microbial breakdown, which may be linked to higher cumulative CO2 and N2O emissions. The RF soils do not show any such trends in FTIR bands indicating that addition of manure+urea affected microbial decomposition differently in RF and DS soil samples. Our results also show that the RF soils had a higher vegetable yield than the DS soils, with the urea, manure, and manure+urea treatment showing no significant difference in vegetable yield.
We found that by combining manure and urea, RF farmers can reduce agricultural emissions without compromising productivity, dispelling any concerns that the combined use of manure and urea may result in relatively lower vegetable yields in the short-term. While we are not able to estimate the GHG footprint of urea production, combining urea with manure will have a positive impact on total GHG emissions without affecting yields. It is clear from this study that even the low organic matter sandy soils of SSA can be significant sources of CO2 and N2O, and that fertility management to optimize yield, build/maintain soil productivity and mitigate greenhouse gas emission will differ by ecoregion, soil type and maybe even crop.

Author Contributions

D.O., P.B.I.A., O.A. and D.P. were responsible for the funding acquisition, project administration, provision of resources and technical information; A.O. and D.P. conceptualized the study; A.O. was responsible for the methodology and writing of the original manuscript; A.S. and G.D. helped with the gas and FTIR analysis respectively; G.D., A.S. and D.P. reviewed, edited and validated the manuscript. All authors have read and agreed to the published version of the manuscript.

Funding

This research was funded by International Development Research Centre, IDRC, project number 107983, through the Canada International Food Security Research Fund (CIFSRF) of the Government of Canada through Foreign Affairs, Trade and Development Canada. The authors are extremely grateful.

Acknowledgments

The authors thank all technical support staff for their significant contributions throughout the research, particularly members of the Environmental Soil Chemistry research group and the Prairie Environmental Agronomy Research Laboratory at the University of Saskatchewan.

Conflicts of Interest

The authors declare no conflict of interest.

Appendix A

Table A1. The abundance of different C functional groups in the soil samples before planting (BP) as estimated using the absorbance intensities of the ATR-FTIR bands.
Band (cm−1)1000110011601430154016001640
Dry Savanna
C
M1.0230.8110.2490.0070.0200.0360.034
M800.8031.3120.4630.0070.0120.0360.030
O800.8890.5350.1180.0080.0200.0320.043
S800.8770.5780.1570.0080.0210.0410.055
Rainforest
C0.7080.7370.2660.0050.0070.0200.021
M0.6890.7190.2450.0030.0060.0170.017
M800.7840.9610.3660.0020.0090.0240.020
O801.1560.5580.2020.0010.0040.0080.012
S800.000 1.4060.4750.0040.0090.0300.025
C = control, M = manure treatment, M80 = Manure + 80 kg N/ha, O80 = No manure + 80 kg N/ha S80 = soil pot with 80 kg N/ha without any vegetables. C spectra for DS soils is excluded due to heavy noise interference.
Table A2. The abundance of different C functional groups in the soil sample after harvest (AH) as estimated using the absorbance intensities of the ATR-FTIR bands.
Band (cm−1)1000110011601430154016001640
Dry Savanna
C0.6020.7160.2650.0020.0060.0190.014
M0.5820.6670.2780.0060.0130.0330.028
M800.6290.7380.2880.0120.0170.0460.038
O800.6971.0580.3750.0050.0110.0310.026
S800.6231.0160.3690.0040.0080.0220.022
Rainforest
C0.9051.0690.3640.0050.0200.0390.043
M0.8870.8370.2330.0050.0160.0290.039
M800.8240.7720.2520.0040.0140.0300.033
O800.9960.6920.2310.0040.0170.0310.037
S800.9800.6330.1940.0060.0180.0290.037
C = control, M = manure treatment, M80 = Manure + 80 kg N/ha, O80 = No manure + 80 kg N/ha S80 = soil pot with 80 kg N/ha without any vegetables.
Figure A1. Mean (n = 3) daily emissions of (a) N2O and (b) CO2 from four cropping treatments on Rainforest, RF, and Dry Savanna, DS, soils averaged over the 21 days. C = control, M = manure only treatment, M80 = Manure + 80 kg N/ha, O80 = No manure + 80 kg N/ha S80 = soil pot microdosed with 80 kg N/ha without any vegetables.
Agronomy 10 00400 g0a1

References

  1. Smith, P.; Martino, Z.; Cai, D. Agriculture. In Climate Change 2007: Mitigation; Metz, B., Davidson, O.R., Bosch, P.R., Dave, R., Meyer, L.A., Eds.; Contribution of Working Group III to the Fourth Assessment Report of the Intergovernmental Panel on Climate Change, Cambridge University Press: Cambridge, UK; New York, NY, USA, 2007. [Google Scholar]
  2. Snyder, C.S.; Bruulsema, T.W.; Jensen, T.L.; Fixen, P.E. Review of greenhouse gas emissions from crop production systems and fertilizer management effects. Agric. Ecosyst. Environ. 2009, 133, 247–266. [Google Scholar] [CrossRef]
  3. Blandford, D.; Hassapoyannes, K. The role of agriculture in global GHG mitigation. In OECD Food, Agriculture and Fisheries Papers; No. 112; OECD Publishing: Paris, France, 2018. [Google Scholar] [CrossRef]
  4. Vitousek, P.M.; Naylor, R.; Crews, T.; David, M.B.; Drinkwater, L.E.; Holland, E.; Johnes, P.J.; Katzenberger, J.; Martinelli, L.A.; Matson, P.A.; et al. Nutrient imbalances in agricultural development. Science 2009, 324, 1519–1520. [Google Scholar] [CrossRef]
  5. Bouwman, A.F.; Boumans, L.J.M.; Batjes, N.H. Emissions of N2O and NO from fertilized fields: Summary of available measurement data. Glob. Biogeochem. Cycl. 2002, 16, 6:1–6:13. [Google Scholar] [CrossRef]
  6. Nziguheba, G.; Palm, C.A.; Berhe, T.; Denning, G.; Dicko, A.; Diouf, O.; Diru, W.; Flor, R.; Frimpong, F.; Harawa, R.; et al. The African green revolution: Results from the millennium villages project. In Advances in Agronomy; Academic Press: San Diego, CA, USA, 2010; Volume 109, pp. 75–115. [Google Scholar]
  7. Sanchez, P.A. Soil fertility and hunger in Africa. Science 2002, 295, 2019–2020. [Google Scholar] [CrossRef] [Green Version]
  8. Alliance for a Green Revolution in Africa (AGRA). Building on the New Momentum in African Agriculture: AGRA in 2008; Alliance for a Green Revolution in Africa: Nairobi, Kenya, 2009. [Google Scholar]
  9. Nyamadzawo, G.; Shi, Y.; Chirinda, N.; Olesen, J.E.; Mapanda, F.; Wuta, M.; Wu, W.; Meng, F.; Oelofse, M.; de Neergaard, A.; et al. Combining organic and inorganic nitrogen fertilisation reduces N2O emissions from cereal crops: A comparative analysis of China and Zimbabwe. Mitig. Adapt. Strateg. Glob. Chang. 2017, 22, 233–245. [Google Scholar] [CrossRef]
  10. Mosier, A.; Kroeze, C.; Nevison, C.; Oenema, O.; Seitzinger, S.; van Cleemput, O. Closing the global atmospheric N2O budget: Nitrous oxide emissions through the agricultural nitrogen cycle. (OECD/IPCC/IEA Phase II Development of IPCC Guidelines for National Greenhouse Gas Inventories). In Dissipation of N from the Human N-cycle, and Its Role in Present and Future N2O Emissions to the Atmosphere; Int. Workshop: Oslo, Norway, 1997; p. 4. [Google Scholar]
  11. Ruser, R.; Flessa, H.; Russow, R.; Schmidt, G.; Buegger, F.; Munch, J.C. Emission of N2O, N2 and CO2 from soil fertilized with nitrate: Effect of compaction, soil moisture and rewetting. Soil Biol. Biochem. 2006, 38, 263–274. [Google Scholar] [CrossRef]
  12. Chirinda, N.; Carter, M.S.; Albert, K.R.; Ambus, P.; Olesen, J.E.; Porter, J.R.; Petersen, S.O. Emissions of nitrous oxide from arable organic and conventional cropping systems on two soil types. Agric. Ecosyst. Environ. 2010, 136, 199–208. [Google Scholar] [CrossRef]
  13. Dick, J.; Kaya, B.; Soutoura, M.; Skiba, U.; Smith, R.; Niang, A.; Tabo, R. The contribution of agricultural practices to nitrous oxide emissions in semi-arid Mali. Soil Use Manag. 2008, 24, 292–301. [Google Scholar] [CrossRef]
  14. Efthimiadou, A.; Bilalis, D.; Karkanis, A.; Froud-Williams, B. Combined organic/inorganic fertilization enhance soil quality and increased yield, photosynthesis and sustainability of sweet maize crop. Australian J. Crop. Sci. 2010, 4, 722. [Google Scholar]
  15. Huang, Y.; Zou, J.; Zheng, X.; Wang, Y.; Xu, X. Nitrous oxide emissions as influenced by amendment of plant residues with different C:N ratios. Soil Biol. Biochem. 2004, 36, 973–981. [Google Scholar] [CrossRef]
  16. Johnson, J.M.F.; Franzluebbers, A.J.; Weyers, S.L.; Reicosky, D.C. Agricultural opportunities to mitigate greenhouse gas emissions. Environ. Pollut. 2007, 150, 107–124. [Google Scholar] [CrossRef] [PubMed]
  17. Serrano-Silva, N.; Luna-Guido, M.; Fernández-Luqueño, F.; Marsch, R.; Dendooven, L. Emission of greenhouse gases from an agricultural soil amended with urea: A laboratory study. Appl. Soil Ecol. 2011, 47, 92–97. [Google Scholar] [CrossRef]
  18. Ramirez, K.S.; Craine, J.M.; Fierer, N. Consistent effects of nitrogen amendments on soil microbial communities and processes across biomes. Glob. Chang. Biol. 2012, 18, 1918–1927. [Google Scholar] [CrossRef]
  19. Tan, H.; Barret, M.; Mooij, M.J.; Rice, O.; Morrissey, J.P.; Dobson, A.; Griffiths, B.; O’Gara, F. Long-term phosphorus fertilisation increased the diversity of the total bacterial community and the phoD phosphorus mineraliser group in pasture soils. Biol. Fertil. Soil. 2013, 49, 661–672. [Google Scholar] [CrossRef] [Green Version]
  20. Fraser, T.; Lynch, D.H.; Entz, M.H.; Dunfield, K.E. Linking alkaline phosphatase activity with bacterial phoD gene abundance in soil from a long-term management trial. Geoderma 2015, 257, 115–122. [Google Scholar] [CrossRef]
  21. Singh, S.N.; Verma, A. The potential of nitrification inhibitors to manage the pollution effect of nitrogen fertilizers in agricultural and other soils: A review. Environ. Pract. 2007, 9, 266. [Google Scholar] [CrossRef]
  22. Artz, R.R.; Chapman, S.J.; Robertson, A.J.; Potts, J.M.; Laggoun-Défarge, F.; Gogo, S.; Comont, L.; Disnar, J.R.; Francez, A.J. FTIR spectroscopy can be used as a screening tool for organic matter quality in regenerating cutover peatlands. Soil Biol. Biochem. 2008, 40, 515–527. [Google Scholar] [CrossRef]
  23. Lehmann, J.; Solomon, D. Organic carbon chemistry in soils observed by synchrotron-based spectroscopy. In Developments in Soil Science; Elsevier: Amsterdam, The Netherlands, 2010; Volume 34, pp. 289–312. [Google Scholar]
  24. Dhillon, G.S.; Gillespie, A.; Peak, D.; Van Rees, K.C. Spectroscopic investigation of soil organic matter composition for shelterbelt agroforestry systems. Geoderma 2017, 298, 1–13. [Google Scholar] [CrossRef]
  25. Solomon, D.; Lehmann, J.; Kinyangi, J.; Liang, B.; Schäfer, T. Carbon K-edge NEXAFS and FTIR-ATR spectroscopic investigation of organic carbon speciation in soils. Soil Sci. Soc. Am. J. 2005, 69, 107–119. [Google Scholar] [CrossRef]
  26. Solomon, D.; Lehmann, J.; Kinyangi, J.; Amelung, W.; Lobe, I.; Pell, A.; Riha, S.; Ngoze, S.; Verchot, L.; Mbugua, D. Long-term impacts of anthropogenic perturbations on dynamics and speciation of organic carbon in tropical forest and subtropical grassland ecosystems. Glob. Chang. Biol. 2007, 13, 511–530. [Google Scholar] [CrossRef]
  27. Jones, A.; Breuning-Madsen, H.; Brossard, M.; Dampha, A.; Deckers, J.; Dewitte, O.; Gallali, T.; Hallett, S.; Jones, R.; Kilasara, M.; et al. Zougmoré. In Soil Atlas of Africa; European Commission, Publications Office of the European Union: Luxembourg, France, 2013; p. 176. [Google Scholar]
  28. Carter, M.R.; Gregorich, E.G. Soil Sampling and Methods of Analysis, 2nd ed.; CRC Press, Taylor & Francis Group: Boca Raton, FL, USA, 2008. [Google Scholar]
  29. Birch, H.F. The effect of soil drying on humus decomposition and nitrogen availability. Plant Soil 1958, 10, 9–31. [Google Scholar] [CrossRef]
  30. Haberhauer, G.; Feigl, B.; Gerzabek, M.H.; Cerri, C. FT-IR spectroscopy of organic matter in tropical soils: Changes induced through deforestation. Appl. Spectrosc. 2000, 54, 221–224. [Google Scholar] [CrossRef]
  31. Ellerbrock, R.H.; Gerke, H.H.; Bachmann, J.; Goebel, M.O. Composition of organic matter fractions for explaining wettability of three forest soils. Soil Sci. Soc. Am. J. 2005, 69, 57–66. [Google Scholar] [CrossRef]
  32. Wojdyr, M. Fityk: A general-purpose peak fitting program. J. Appl. Crystallogr. 2010, 43, 1126–1128. [Google Scholar] [CrossRef]
  33. Ellerbrock, R.H.; Höhn, A.; Gerke, H.H. Characterization of soil organic matter from a sandy soil in relation to management practice using FT-IR spectroscopy. Plant Soil 1999, 213, 55–61. [Google Scholar] [CrossRef]
  34. Calderón, F.; Haddix, M.; Conant, R.; Magrini-Bair, K.; Paul, E. Diffuse-reflectance Fourier-transform mid-infrared spectroscopy as a method of characterizing changes in soil organic matter. Soil Sci. Soc. Am. J. 2013, 77, 1591–1600. [Google Scholar]
  35. Parikh, S.J.; Goyne, K.W.; Margenot, A.J.; Mukome, F.N.; Calderón, F.J. Soil chemical insights provided through vibrational spectroscopy. In Advances in Agronomy; Academic Press: San Diego, CA, USA, 2014; Volume 126, pp. 1–148. [Google Scholar]
  36. Bornemann, L.; Welp, G.; Amelung, W. Particulate organic matter at the field scale: Rapid acquisition using mid-infrared spectroscopy. Soil Sci. Soc. Am. J. 2010, 74, 1147–1156. [Google Scholar] [CrossRef]
  37. Janik, L.J.; Merry, R.H.; Forrester, S.; Lanyon, D.; Rawson, A. Rapid prediction of soil water retention using mid infrared spectroscopy. Soil Sci. Soc. Am. J. 2007, 71, 507–514. [Google Scholar] [CrossRef]
  38. Janik, L.J.; Skjemstad, J.; Shepherd, K.; Spouncer, L. The prediction of soil carbon fractions using mid-infrared-partial least square analysis. Aust. J. Soil Res. 2007, 45, 73–81. [Google Scholar] [CrossRef] [Green Version]
  39. Olaleye, A.; Oyedele, D.; Akponikpe, P.; Kar, G.; Peak, D. Molecular Scale Studies of Phosphorus Speciation and Transformation in Manure Amended and Microdose Fertilized Indigenous Vegetable Production Systems of Nigeria and Republic of Benin. Soil Syst. 2020, 4, 5. [Google Scholar] [CrossRef] [Green Version]
  40. Mando, A.; Bonzi, M.; Wopereis, M.C.S.; Lompo, F.; Stroosnijder, L. Long-term effects of mineral and organic fertilization on soil organic matter fractions and sorghum yield under Sudano-Sahelian conditions. Soil Use Manag. 2005, 21, 396–401. [Google Scholar] [CrossRef]
  41. Tovihoudji, P.G.; Akponikpè, P.I.; Agbossou, E.K.; Bertin, P.; Bielders, C.L. Fertilizer microdosing enhances maize yields but may exacerbate nutrient mining in maize cropping systems in northern Benin. Field crop. Res. 2017, 213, 130–142. [Google Scholar] [CrossRef]
  42. Detchinli, K.S.; Sogbedji, J.M. Yield performance and economic return of maize as affected by nutrient management strategies on ferralsols in coastal western Africa. Eur. Sci. J. 2015, 11, 27. [Google Scholar]
  43. Potter, C.S.; Matson, P.A.; Vitousek, P.M.; Davidson, E.A. Process modeling of controls on nitrogen trace gas emissions from soils worldwide. J. Geophys. Res. Atmos. 1996, 101, 1361–1377. [Google Scholar] [CrossRef]
  44. Rees, R.M.; Wuta, M.; Furley, P.A.; Li, C. Nitrous oxide fluxes from savanna (miombo) woodlands in Zimbabwe. J. Biogeogr. 2006, 33, 424–437. [Google Scholar] [CrossRef]
  45. Malhi, S.S.; Lemke, R.; Wang, Z.H.; Chhabra, B.S. Tillage, nitrogen and crop residue effects on crop yield, nutrient uptake, soil quality, and greenhouse gas emissions. Soil Tillage Res. 2006, 90, 171–183. [Google Scholar] [CrossRef]
  46. Kachanoski, R.G.; O’Halloran, I.; Rochette, P. Site-Specific Application of Fertilizer N for Reducing Greenhouse Gas Emissions; Climate Change Funding Initiative in Agriculture; Canadian Agri-Food Research Council: Ottawa, ON, Canada, 2003. [Google Scholar]
  47. Vallejo, A.; García-Torres, L.; Díez, J.A.; Arce, A.; López-Fernández, S. Comparison of N losses (NO−3, N2O, NO) from surface applied, injected or amended (DCD) pig slurry of an irrigated soil in a Mediterranean climate. Plant Soil 2005, 272, 313–325. [Google Scholar] [CrossRef]
  48. Mapanda, F.; Wuta, M.; Nyamangara, J.; Rees, R.M. Effects of organic and mineral fertilizer nitrogen on greenhouse gas emissions and plant-captured carbon under maize cropping in Zimbabwe. Plant Soil 2011, 343, 67–81. [Google Scholar] [CrossRef] [Green Version]
  49. Chapuis-Lardy, L.Y.D.I.E.; Wrage, N.; Metay, A.; Chotte, J.L.; Bernoux, M. Soils, a sink for N2O? A review. Glob. Chang. Biol. 2007, 13, 1–17. [Google Scholar] [CrossRef]
  50. Peng, Q.; Qi, Y.; Dong, Y.; Xiao, S.; He, Y. Soil nitrous oxide emissions from a typical semiarid temperate steppe in inner Mongolia: Effects of mineral nitrogen fertilizer levels and forms. Plant Soil 2011, 342, 345–357. [Google Scholar] [CrossRef] [Green Version]
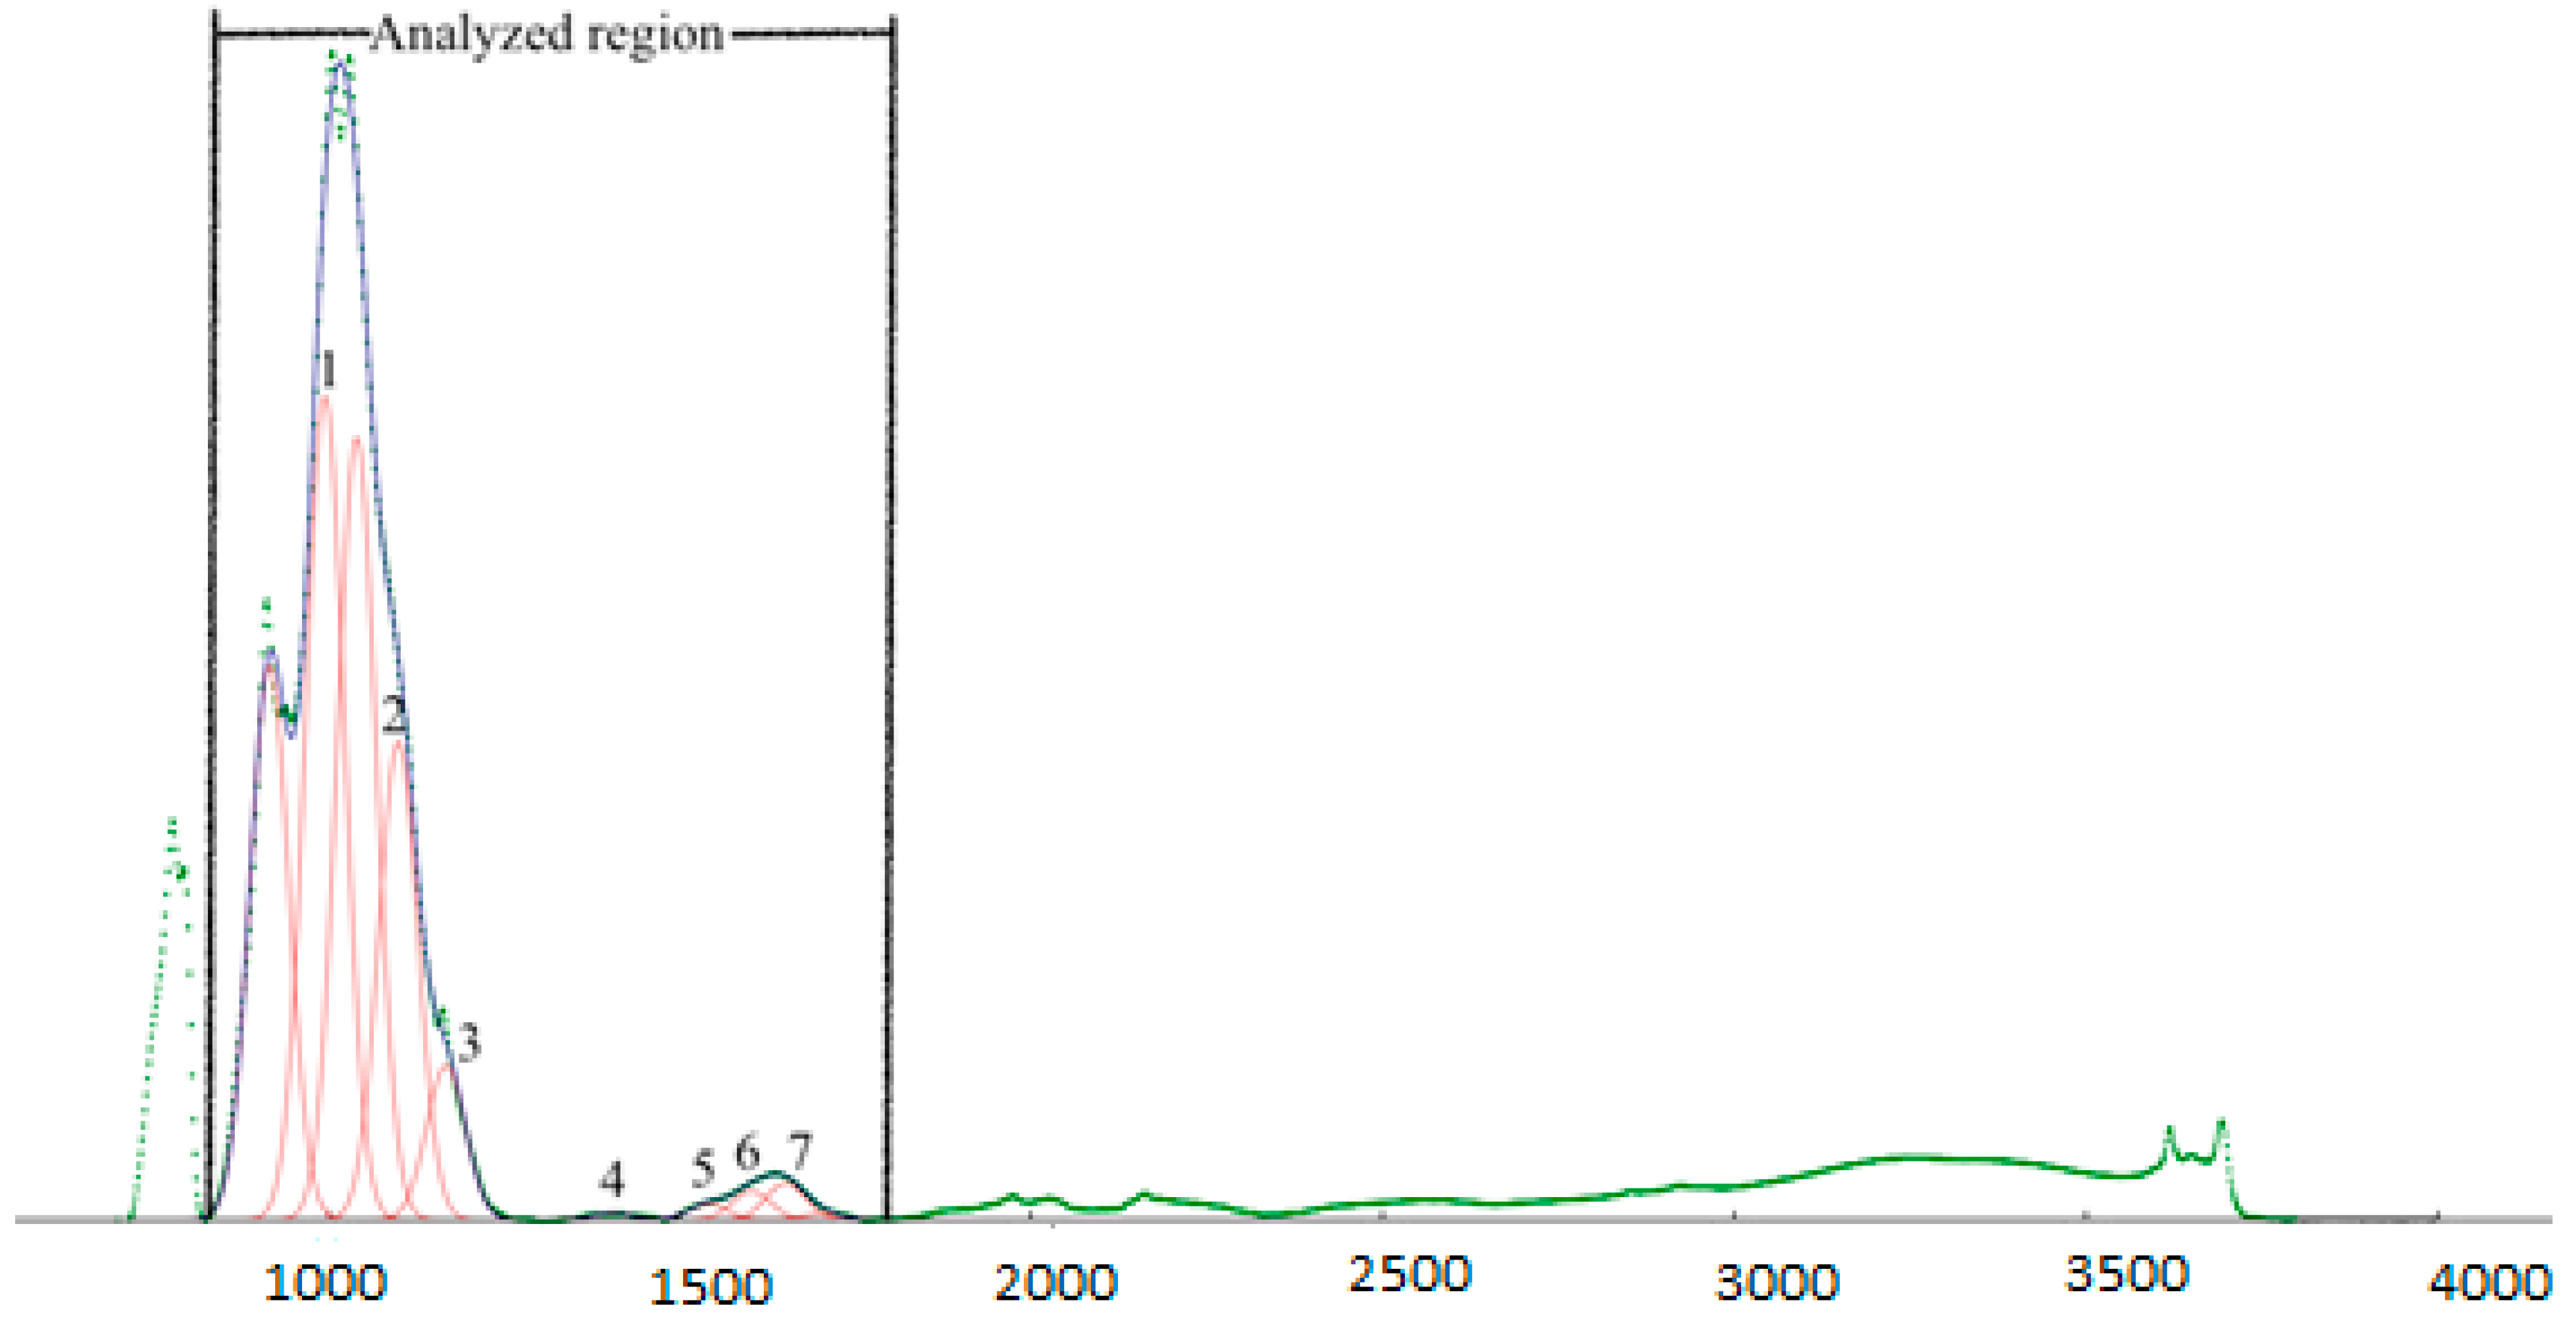
Figure 1. A representative ATR-FTIR spectra of whole soils showing the fitted Gaussian peaks representing the major C functional groups within the wavenumber range of 900–1800 cm−1. Peaks are identified as follows: 1—1000 cm−1, 2—1100 cm−1, 3—1160 cm−1, 4—1430 cm−1, 5—1540 cm−1, 6—1600 cm−1, 7—1640 cm−1.
Agronomy 10 00400 g001
Figure 2. Treatment effect on (a) Yield and (b) soil pH of the Rainforest, RF, and Dry Savanna, DS, soils. C = control, M = manure treatment, M80 = Manure + 80 kg N/ha, O80 = No manure + 80 kg N/ha S80 = soil pot microdosed with 80 kg N/ha without any vegetables. Bars with different letter(s) for each site are significantly different at p < 0.05. (n = 3).
Agronomy 10 00400 g002
Figure 3. Mean (n = 3) daily emissions by treatments of N2O from the (a) Dry Savanna, DS and (b) Rainforest, RF soils and of CO2 from the (c) Dry Savanna, DS and (d) Rainforest, RF soils. C = control, M = manure treatment, M80 = Manure + 80 kg N/ha, O80 = No manure + 80 kg N/ha S80 = soil pot microdosed with 80 kg N/ha without any vegetables.
Agronomy 10 00400 g003aAgronomy 10 00400 g003b
Figure 4. Cumulative N2O emissions from four cropping treatments on (a) Dry Savanna, DS, and (b) Rainforest, RF, soils. C = control, M = manure treatment, M80 = Manure + 80 kg N/ha, O80 = No manure + 80 kg N/ha S80 = soil pot microdosed with 80 kg N/ha without any vegetables. (n = 3).
Agronomy 10 00400 g004
Figure 5. Cumulative CO2 emissions from four cropping treatments on (a) Dry Savanna, DS, and (b) Rainforest, RF, soils. C = control, M = manure treatment, M80 = Manure + 80 kg N/ha, O80 = No manure + 80 kg N/ha S80 = soil pot microdosed with 80 kg N/ha without any vegetables.
Agronomy 10 00400 g005
Figure 6. Mean (n = 3) relative absorbance intensities of (a) 1640 cm−1 (b) 1430 cm−1 and (c) 1000 cm−1 ATR-FTIR bands identified for dry savanna soils after harvest. C = control, M = manure treatment, M80 = Manure + 80 kg N/ha, O80 = No manure + 80 kg N/ha S80 = soil pot with 80 kg N/ha without any vegetables.
Agronomy 10 00400 g006
Figure 7. Mean (n = 3) relative absorbance intensities of (a) 1640 cm−1 (b) 1430 cm−1 and (c) 1000 cm−1 ATR-FTIR bands identified for rainforest soils after harvest. C = control, M = manure treatment, M80 = Manure + 80 kg N/ha, O80 = No manure + 80 kg N/ha S80 = soil pot with 80 kg N/ha without any vegetables.
Agronomy 10 00400 g007
Table 1. Carbon content, pH, total phosphorus and total nitrogen concentrations of soil samples by ecoregion and treatment. Values are Mean (standard error). (n = 3). C = control, M = manure treatment, M80 = Manure + 80 kg N/ha, O80 = No manure + 80 kg N/ha S80 = soil pot microdosed with 80 kg N/ha without any vegetables. BP = Before planting, AH = After harvest.
TreatmentpHTotal P (%)Organic C (%)Total N (%)
BPAHBPAHBPAHBPAH
Rainforest
C4.7 (0.02)4.7 (0.02)0.08 (0.003)0.07 (0.001)1.75 (0.04)1.81 (0.05)0.20 (0.01)0.12 (0.02)
M5.2 (0.02)5.0 (0.02)0.07 (0.002)0.07 (0.002)1.70 (0.01)1.80 (0.08)0.21 (0.02)0.20 (0.03)
M804.9 (0.04)5.2 (0.04)0.07 (0.006)0.07 (0.002)1.66 (0.09)1.84 (0.05)0.18 (0.01)0.20 (0.05)
O805.9 (0.06)5.2 (0.05)0.07 (0.002)0.06 (0.002)1.87 (0.02)1.84 (0.02)0.22 (0.03)0.22 (0.02)
S804.8 (0.05)5.2 (0.03)0.06 (0.006)0.07 (0.002)1.81 (0.03)1.71 (0.11)0.13 (0.01)0.16 (0.03)
Dry Savanna
C5.5 (0.06)5.2 (0.05)0.04 (0.001)0.04 (0.002)0.56 (0.01)0.58 (0.02)0.08 (0.01)0.08 (0.01)
M6.4 (0.04)5.8 (0.04)0.04 (0.001)0.04 (0.001)0.62 (0.01)0.63 (0.01)0.10 (0.01)0.08 (0.01)
M806.3 (0.007)5.8 (0.02)0.04 (0.001)0.04 (0.001)0.56 (0.01)0.56 (0.01)0.09 (0.01)0.10 (0.02)
O805.6 (0.06)5.3 (0.06)0.04 (0.001)0.04 (0.001)0.62 (0.02)0.60 (0.02)0.08 (0.01)0.10 (0.01)
S804.4 (0.06)4.7 (0.02)0.06 (0.006)0.04 (0.001)0.57 (0.01)0.55 (0.01)0.09 (0.01)0.07 (0.01)
Table 2. P-value results of an ANOVA on organic carbon, pH, total nitrogen and phosphorus and yield (significant differences, i.e., p ≤ 0.05 are in bold).
pHTotal POrg. CTotal NYield
Rainforest
Treatments0.0020.2080.4320.1050.018
Time0.2430.5330.2120.487
Treatments*Time0.0120.0980.3270.299
Dry Savanna
Treatments0.0020.6070.0060.6070.005
Time0.0060.8160.9960.816
Treatments*Time0.0030.3940.5380.394
Table 3. Pearson correlation coefficients between the relative intensity of absorbance of ATR-FTIR bands, soil pH and nutrient concentrations for Dry Savanna and Rainforest soils. **, correlation is significant at the 0.01 level (2-tailed). *, correlation is significant at the 0.05 level (2-tailed).
B1000B1100B1160B1430B1540B1600B1640
Dry Savanna
pH−0.111−0.418−0.3590.597 *0.644 **0.613 *0.516 *
Total P0.0030.0350.011−0.044−0.038−0.0740.016
Org C−0.558 *0.1140.146−0.0920.0920.0510.010
Total N0.225−0.193−0.3000.008−0.123−0.068−0.125
Rainforest
pH0.067−0.407−0.419−0.125−0.267−0.543 *−0.289
Total P−0.0590.019−0.0450.259−0.0530.0630.183
Org C−0.534 *0.3400.389−0.541 *−0.445−0.264−0.577 *
Total N−0.2270.0510.062−0.528 *−0.620 *−0.625 *−0.556 *