Article

Influence of Tillage Systems, and Forms and Rates of Nitrogen Fertilizers on CO2 and N2O Fluxes from Winter Wheat Cultivation in Oklahoma

by
Tanka P. Kandel
1,*,
Prasanna H. Gowda
2 and
Brian K. Northup
3
1
Noble Research Institute, LLC, 2510 Sam Noble Parkway, Ardmore, OK 73401, USA
2
USDA-ARS Southeast Area. 141 Experiment Station Road, Stoneville, MS 38776, USA
3
Forage and Livestock Production Research Unit, USDA-ARS Grazinglands Research Laboratory, El Reno, OK 73036, USA
*
Author to whom correspondence should be addressed.
Agronomy 2020, 10(3), 320; https://doi.org/10.3390/agronomy10030320
Submission received: 29 January 2020 / Revised: 17 February 2020 / Accepted: 21 February 2020 / Published: 26 February 2020
(This article belongs to the Section Soil and Plant Nutrition)

Abstract

:
Cultivation of winter wheat under reduced tillage systems is increasing in the U.S. Southern Great Plains. Likewise, there is revived interest for including summer legumes in monocultures of winter wheat as green sources of nitrogen (N). This study investigated the influence of tillage systems (no- and conventional tillage), and source and rates of N fertilizer (0, 45 and 90 kg N ha−1 yr−1 in inorganic N fertilizer, and cowpea as green manure) on emissions of carbon dioxide (CO2) and nitrous oxide (N2O) from winter wheat cultivation. The study was conducted within a long-term field experiment initiated in 2011, at upland and bottomland sites near El Reno, Oklahoma during the 2016–2017 growing season of winter wheat. The experiment was conducted site-wise as split-plots in a completely randomized design, with N treatment as main plots and tillage system as subplots. Thus, there were a total of eight treatment combinations with three replicated plots (4 m × 10 m) in each combination in both sites. Net ecosystem exchange (NEE) of CO2 was measured by a closed chamber connected to an infra-red gas analyzer, and fluxes were partitioned to gross primary production (GPP) and ecosystem respiration (ER). Heterotrophic soil respiration (SR) was measured on bare soil spots. Fluxes of N2O were measured with an opaque closed chamber system with a portable gas analyzer. Dynamics of canopy CO2 fluxes (NEE, GPP and ER) were similar between tillage systems, while canopy CO2 fluxes increased with rate of N fertilization. Canopy CO2 fluxes from cowpea and an unfertilized control were similar, and the lowest, due to poor growth of winter wheat compared to the N fertilized treatments. Fluxes of N2O approximated zero from all treatments throughout the study and no response of N fertilizer or tillage system was seen. In conclusion, the results from this study indicated that canopy fluxes of CO2 from winter wheat are controlled by forms and rates of N fertilizers rather than tillage systems.

1. Introduction

Winter wheat (Triticum aestivum L. em Thell.) is the primary annual crop grown in the US Southern Great Plains (SGP). For example, winter wheat was planted on 1.82 million hectares of land in Oklahoma in 2017, producing 2.68 million tons of grain [1]. Winter wheat is planted between September and October in the SGP, depending on the intended usage as pasture for grazing, dual-purpose (fall through winter grazing plus end of season grain harvest), or grain crop. In general, winter wheat cultivated as a forage crop is planted early (September), and later if planted for grain production.
Regardless of crop usage, a 3–4 month period of summer fallow exists in continuous monocultures of winter wheat, to conserve limited and sporadic amounts of precipitation as soil moisture to support winter wheat [2]. However, legumes could be grown during the summer to serve as sources of green N for winter wheat [3]. The use of annual legumes as cover crops during summer represents one of a series of systems of intensified production [3,4,5] that may improve efficiencies in use of available soil water in the SGP [6], increase soil carbon (C), suppress weed populations, and reduce nutrient runoff or leaching [7].
In the SGP, winter wheat is primarily cultivated with conventional tillage, though different systems of reduced tillage are increasing in use to conserve soil moisture, increase soil aggregation, and decrease erosion [8,9]. As tillage influences soil physical, chemical, biological and environmental conditions, emissions of CO2 and N2O from soils can be influenced by tillage systems [10,11]. In general, systems of reduced tillage contribute to decreased soil emissions of CO2 and increased soil organic carbon (SOC) over the long term [12]. Tillage operations induce large peaks of soil respiration due to increased soil aeration and increased contact of crop residues with soil [13]. In contrast, no-till systems avoid such tillage-induced emissions and delay decomposition of residues, but can have higher rates of soil respiration for longer periods due to increased availability of carbon substrates and soil moisture [14].
Increased soil efflux of N2O and CO2 are expected after inclusion of legume-based cover crops in cropping systems applied to winter wheat, due to increased soil pools of C and N. However, the dynamics and magnitude of these fluxes largely depend on quality and quantity of biomass provided by the cover crop at termination [15]. Additionally, environmental conditions in the soil, such as temperature and moisture, control C and N mineralization and thereby CO2 and N2O fluxes from decomposing green manures [16]. Legume-based cover crops grown during the summer period of monocultures of winter wheat in the SGP are generally terminated 1–2 months prior to planting of winter wheat, to save soil moisture which is the critical factor for winter wheat production in the region [17]. Additionally, the rates of N fixation by legumes decrease after flowering, so delayed termination may not add significant amounts of N inputs to the system. Alternatively, early-terminated legumes with less structural components can mineralize rapidly after termination, and the mineralized nutrients may be more efficiently transferred to winter wheat. However, if proper synchronization between N mineralization from green manures and uptake by the recipient crop is not achieved, yields of winter wheat may decrease and emissions of N2O increase outside the growth period of winter wheat [18].
Although interest for conservation agricultural practices such as no-till and legume green manures is increasing in the US SGP, there is limited information on influence of these managements on fluxes of CO2 and N2O from winter wheat cropping system in this region. Therefore, in this study, we tested the influences of tillage system, rates of applied N fertilizers and cowpea as a legume green manure on canopy and soil fluxes of CO2 and soil fluxes of N2O during a growing period of winter wheat cultivated in the US SGP. Fluxes of CO2 and N2O were monitored in a side-by-side small-plot experiment using closed chamber methods. The working hypotheses were: (i) fluxes of CO2 and N2O from winter wheat cultivation would be lower from no-till than from conventional tillage; (ii) Fluxes of CO2 and N2O would increase with increasing rates of inorganic N fertilizer; and (iii) Fluxes of CO2 and N2O would be greater from plots cultivated with cowpea as a cover crop than unfertilized control plots.

2. Materials and Methods

2.1. Study Site and Soil Properties

The study was conducted at USDA-ARS Grazinglands Research Laboratory at two sites near El Reno, OK, USA. The sites were defined as components of upland and bottomland areas of the North Canadian River drainage basin [19]. The predominant soil type in upland site (35°32′45″ N, 98°00′44″ W; 421 m elevation) was a Norge silt loam (fine-silty, mixed, thermic, Udic Paleustolls) which is moderately well drained with 1%–3% slope. The topsoil (0–15 cm) had average total organic carbon (TOC) of 1.39%, total N content of 0.11%, and resulting C/N of 12.6. The predominant soil type in bottomland site (35°34′21″ N, 98°02′12″ W; 411 m elevation) was Dale silt loam (fine-silty, mixed, thermic, Pachic Haplustolls) with 0%–1% slope (USDA-NRCS, 1999). At the bottomland site, the average TOC of the topsoil 1.31%, while total N content of 0.10% and the C/N ratio was 13.1.

2.2. Experimental Design

The experiment was conducted as a split-plot in a completely randomized design, on a site basis. Nitrogen (inorganic and organic) treatments were the main plots which included two rates of inorganic fertilizers (45 and 90 kg N ha−1) applied at planting of winter wheat as dry urea, an annual summer legume green manure (cowpea; Vigna unguiculata L.) as a N source, and an unfertilized control. These main plots were split into subplots of two tillage systems; no-till (NT) and conventional tillage (CT). The CT system applied in this study was undertaken to mimic best management practices applicable to conventional tillage, including: fewest operations possible to prepare soil for planting and weed control; leave residues and roughness on soil surface to minimize erosion. Thus, there were a total of 8 treatment combinations (tillage-N source) with 3 replicated plots (4 m × 10 m) per combination on both sites.

2.3. Agronomic Management

The field experiment was initiated in 2011 as a long-term (>10 years) study, to define the effects of different green N crops on winter wheat-based systems (plant biomass, soil nutrients, water balance) of production. The current experiment on fluxes of CO2 and N2O was conducted during the 2016–2017 growing season (October through May) of winter wheat, which was oriented from the start of the summer period of (June) 2016, to the wheat harvest in the following May 2017. In 2016, wheat was harvested on 10 June. The CT plots were tilled (disked once, rototilled once) on 13 June. Cowpea seeds (cv. Red Ripper) inoculated with a Bradyrhizobium strain were planted on 15 June at 2.5 cm depth with sowing rate of 35 kg ha−1. Cowpea was fertilized with 100 kg ha−1 di-ammonium phosphate (DAP; 18% N, 46% P2O5, 0% K2O) on 17 June. DAP fertilizer was used as the P source, as P-only fertilizer was not available to producers in the regions. Therefore, 18 kg inorganic N ha–1 were applied to the cowpea plots.
Weeds in NT plots were controlled with spraying Roundup® herbicide as a 1% glyphosate (N-(phosphonomethyl) glycine) solution at planting (16 June 2016) and termination of cowpea (11 August 2016). Cowpea cultivated under the NT system was terminated on 17 August by shredding biomass and spraying the stubble. Cowpea cultivated under CT system was terminated two days later by disking (once) and roto-tilling (once). Prior to termination, total aboveground biomass yield of cowpea was determined by drying biomass harvested from 0.4 m × 0.4 m quadrats from each plot. The biomass was dried at 60 °C to constant weight in a forced-draft oven. Biomass N concentration was determined by a flash combustion method (Model VarioMacro; Elementar Americas, Inc., Mt. Laurel, NJ, USA). Amount of N per hectare in aboveground cowpea biomass was calculated as a product of dry biomass yield and N concentrations. The 45-N and 90-N plots were fertilized on 21 September and winter wheat (cv. Jagger) was sown in all plots on 22 September 2016. Winter wheat was harvested on 31 May 2017.
Crop management applied to the experimental plots in the previous years (2011–2015) followed similar timing and application rates as in the current study year. All weed control application to the NT plots was undertaken with herbicide. Tillage operations on CT plots were conducted only for planting of wheat and cowpea, and other applications required for weed control were largely herbicide applications. On CT plots, weeds during the fallow periods were primarily controlled with herbicide, though tillage was used in cases where weed populations were large, or had achieved stages of maturity where control with herbicides was less effective. Although the CT system used mechanical disturbance of soil to prepare seedbeds or control weeds, all tillage operations were restricted to the upper 0.20 m of the soil profile. Crop residues and surface roughness were present on the soil surface throughout the fallow periods during summer, which are common requirements for best management practices for CT systems.

2.4. Measurement and Calculation of N2O Fluxes

Fluxes of N2O were measured using a closed chamber method. A PVC collar (0.65 × 0.65 m) was inserted to 0.10 m depth in all plots (n = 24 for both sites) on 27 September (five days after planting of wheat). The collars remained intact throughout the measurement periods. Fluxes were generally measured at two-week intervals until the harvest of winter wheat.
The collars had a 0.04 m wide outer rim that was aboveground and parallel to the soil surface to support the top chamber used for flux measurement. Fluxes were measured by placing an opaque (white color) chamber (0.70 × 0.70 × 0.41 m3) on the collars. Chamber headspace air was continuously mixed by a small battery-driven fan. Concentrations of N2O and CO2 was determined by a portable Fourier transform infrared (FTIR) based analyzer (DX4040; Gasmet Technology Oy, Helsinki, Finland) that was connected to the chamber through 3 mm inlet and outlet tubing. The chamber was enclosed for 8 min during each measurement and concentrations were recorded at 40 s intervals.
Fluxes were calculated by linear regression using the MATLAB® (MathWorks, Inc., Natick, MA, USA) routine of Kutzbach et al. [20]. The first few records after chamber enclosure were discarded as dead-band based on visual inspection of the CO2 concentrations recorded simultaneously with N2O concentrations. Fluxes of N2O were assumed to be zero when probability of linear regression was insignificant (p > 0.05).

2.5. Measurements of Canopy and Soil CO2 Fluxes

Canopy fluxes of CO2 were measured using a closed transparent Plexiglas chamber with similar dimension as the opaque chamber used to measure N2O flux. The chamber included sensors for temperature and photosynthetically active radiation (PAR), and a fan to mix headspace air. Concentrations of CO2 and H2O was determined by a portable infrared gas analyser (EGM-5; PP Systems, Amesbury, MA, USA) that was connected to the chamber through 3 mm inlet and outlet tubing. The gas analyser recorded all the measurements at 1 s intervals. On each measurement date, fluxes were measured consecutively at all collars under both ambient light and darkened conditions. At first, net ecosystem exchange (NEE) of CO2 was measured at ambient light for 1 min with the fully transparent chamber. Then the chamber was covered with a white cloth to block 100% PAR for ecosystem respiration (ER) flux measurements for 1 min after plant adaptation to dark conditions for 1 min.
Soil respiration (SR) fluxes were measured using a plant and root exclusion method [21] on cylindrical PVC cores (diameter, 0.10 m; height, 0.30 m) inserted to 0.28 m soil depth. A core was inserted in all plots at about 1 m distance from the collar installed for measurements of canopy CO2 and N2O fluxes. The cores were inserted between two rows of winter wheat after germination. Growth of weeds was rarely seen inside the cores, and those encountered were removed by hand before SR measurements. Fluxes were measured using an EGM-5 gas analyzer connected to a cylindrical (height, 0.15 m; diameter, 0.10 m) chamber (model SRC-2; PP Systems). During the flux measurements, the chamber was enclosed for 60 seconds and CO2 concentrations were recorded at 1 s intervals with the first 10 s of measurements discarded as a dead-band.
Fluxes of CO2 were measured at midday between 9:30 and 13:00. Measurements were generally taken at regular intervals of two weeks. For measurements of canopy CO2 fluxes, a Plexiglas chamber extension with similar dimensions as the top chamber was used when the height of crops exceeded chamber height. Fluxes of CO2 were calculated by linear regression using the MATLAB® routine by Kutzbach et al. [20]. The first 10 s of recordings after chamber deployment were discarded as a dead-band.

2.6. Measurements of Environmental Variables

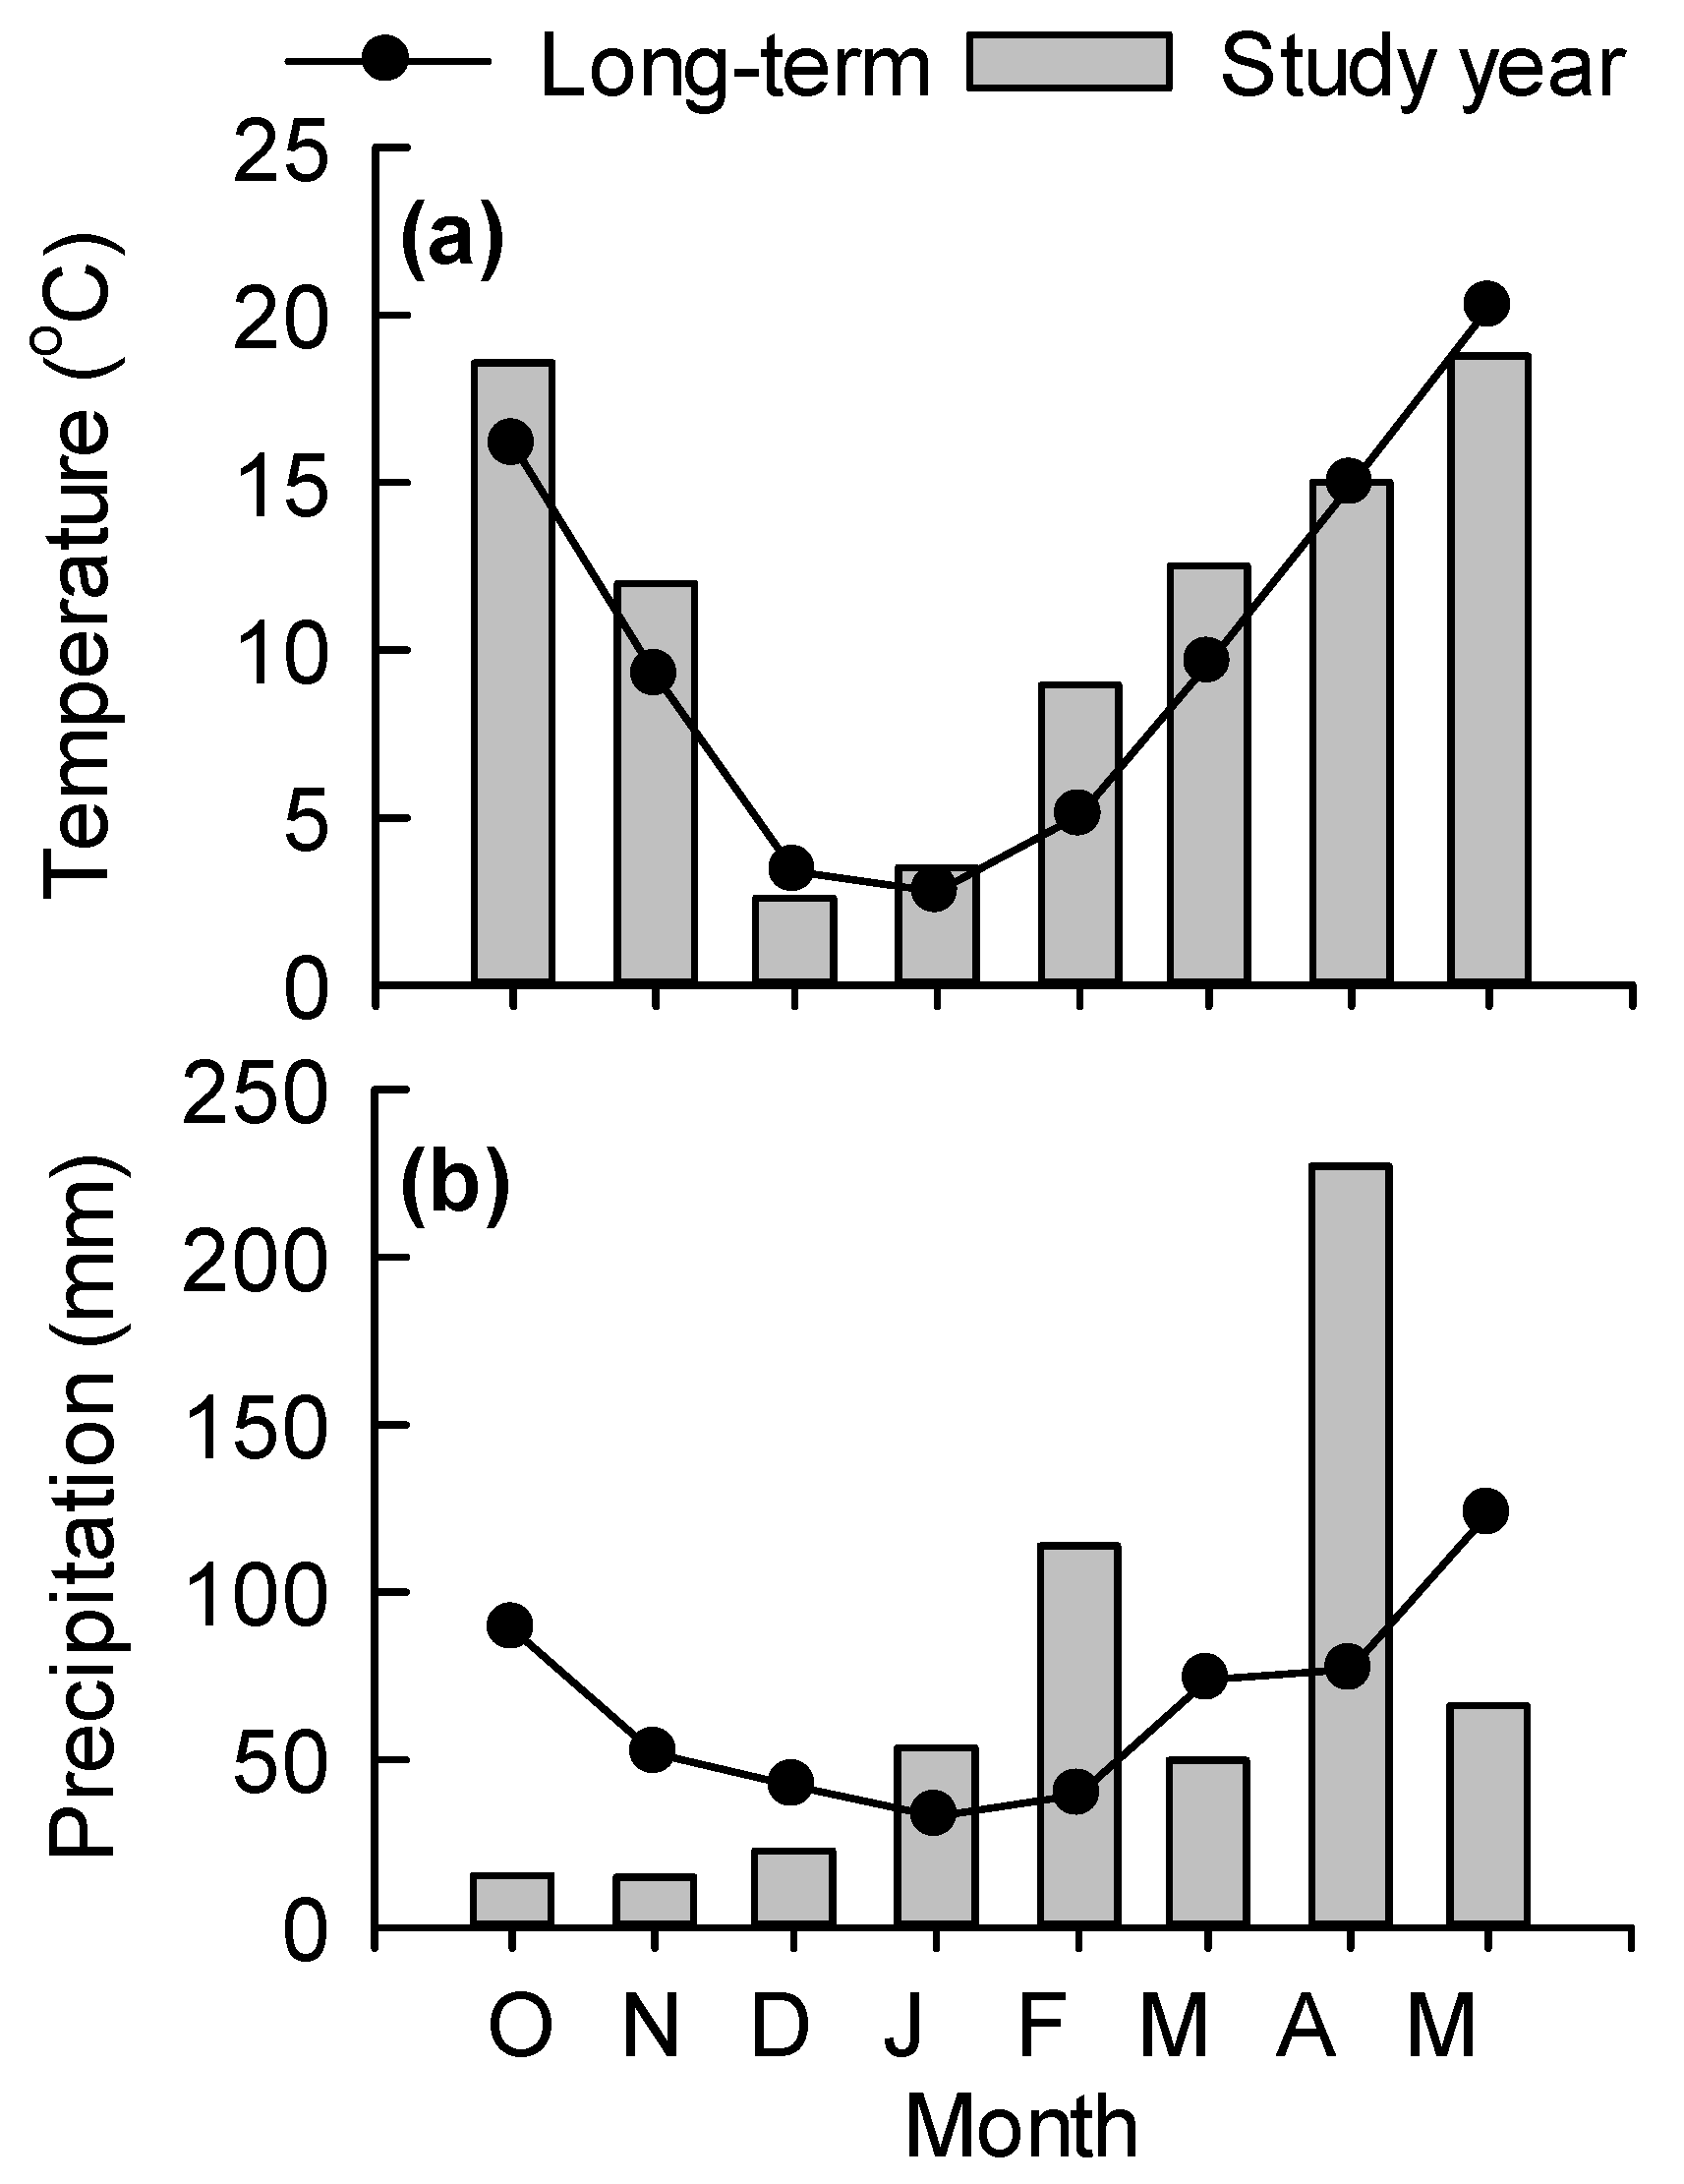
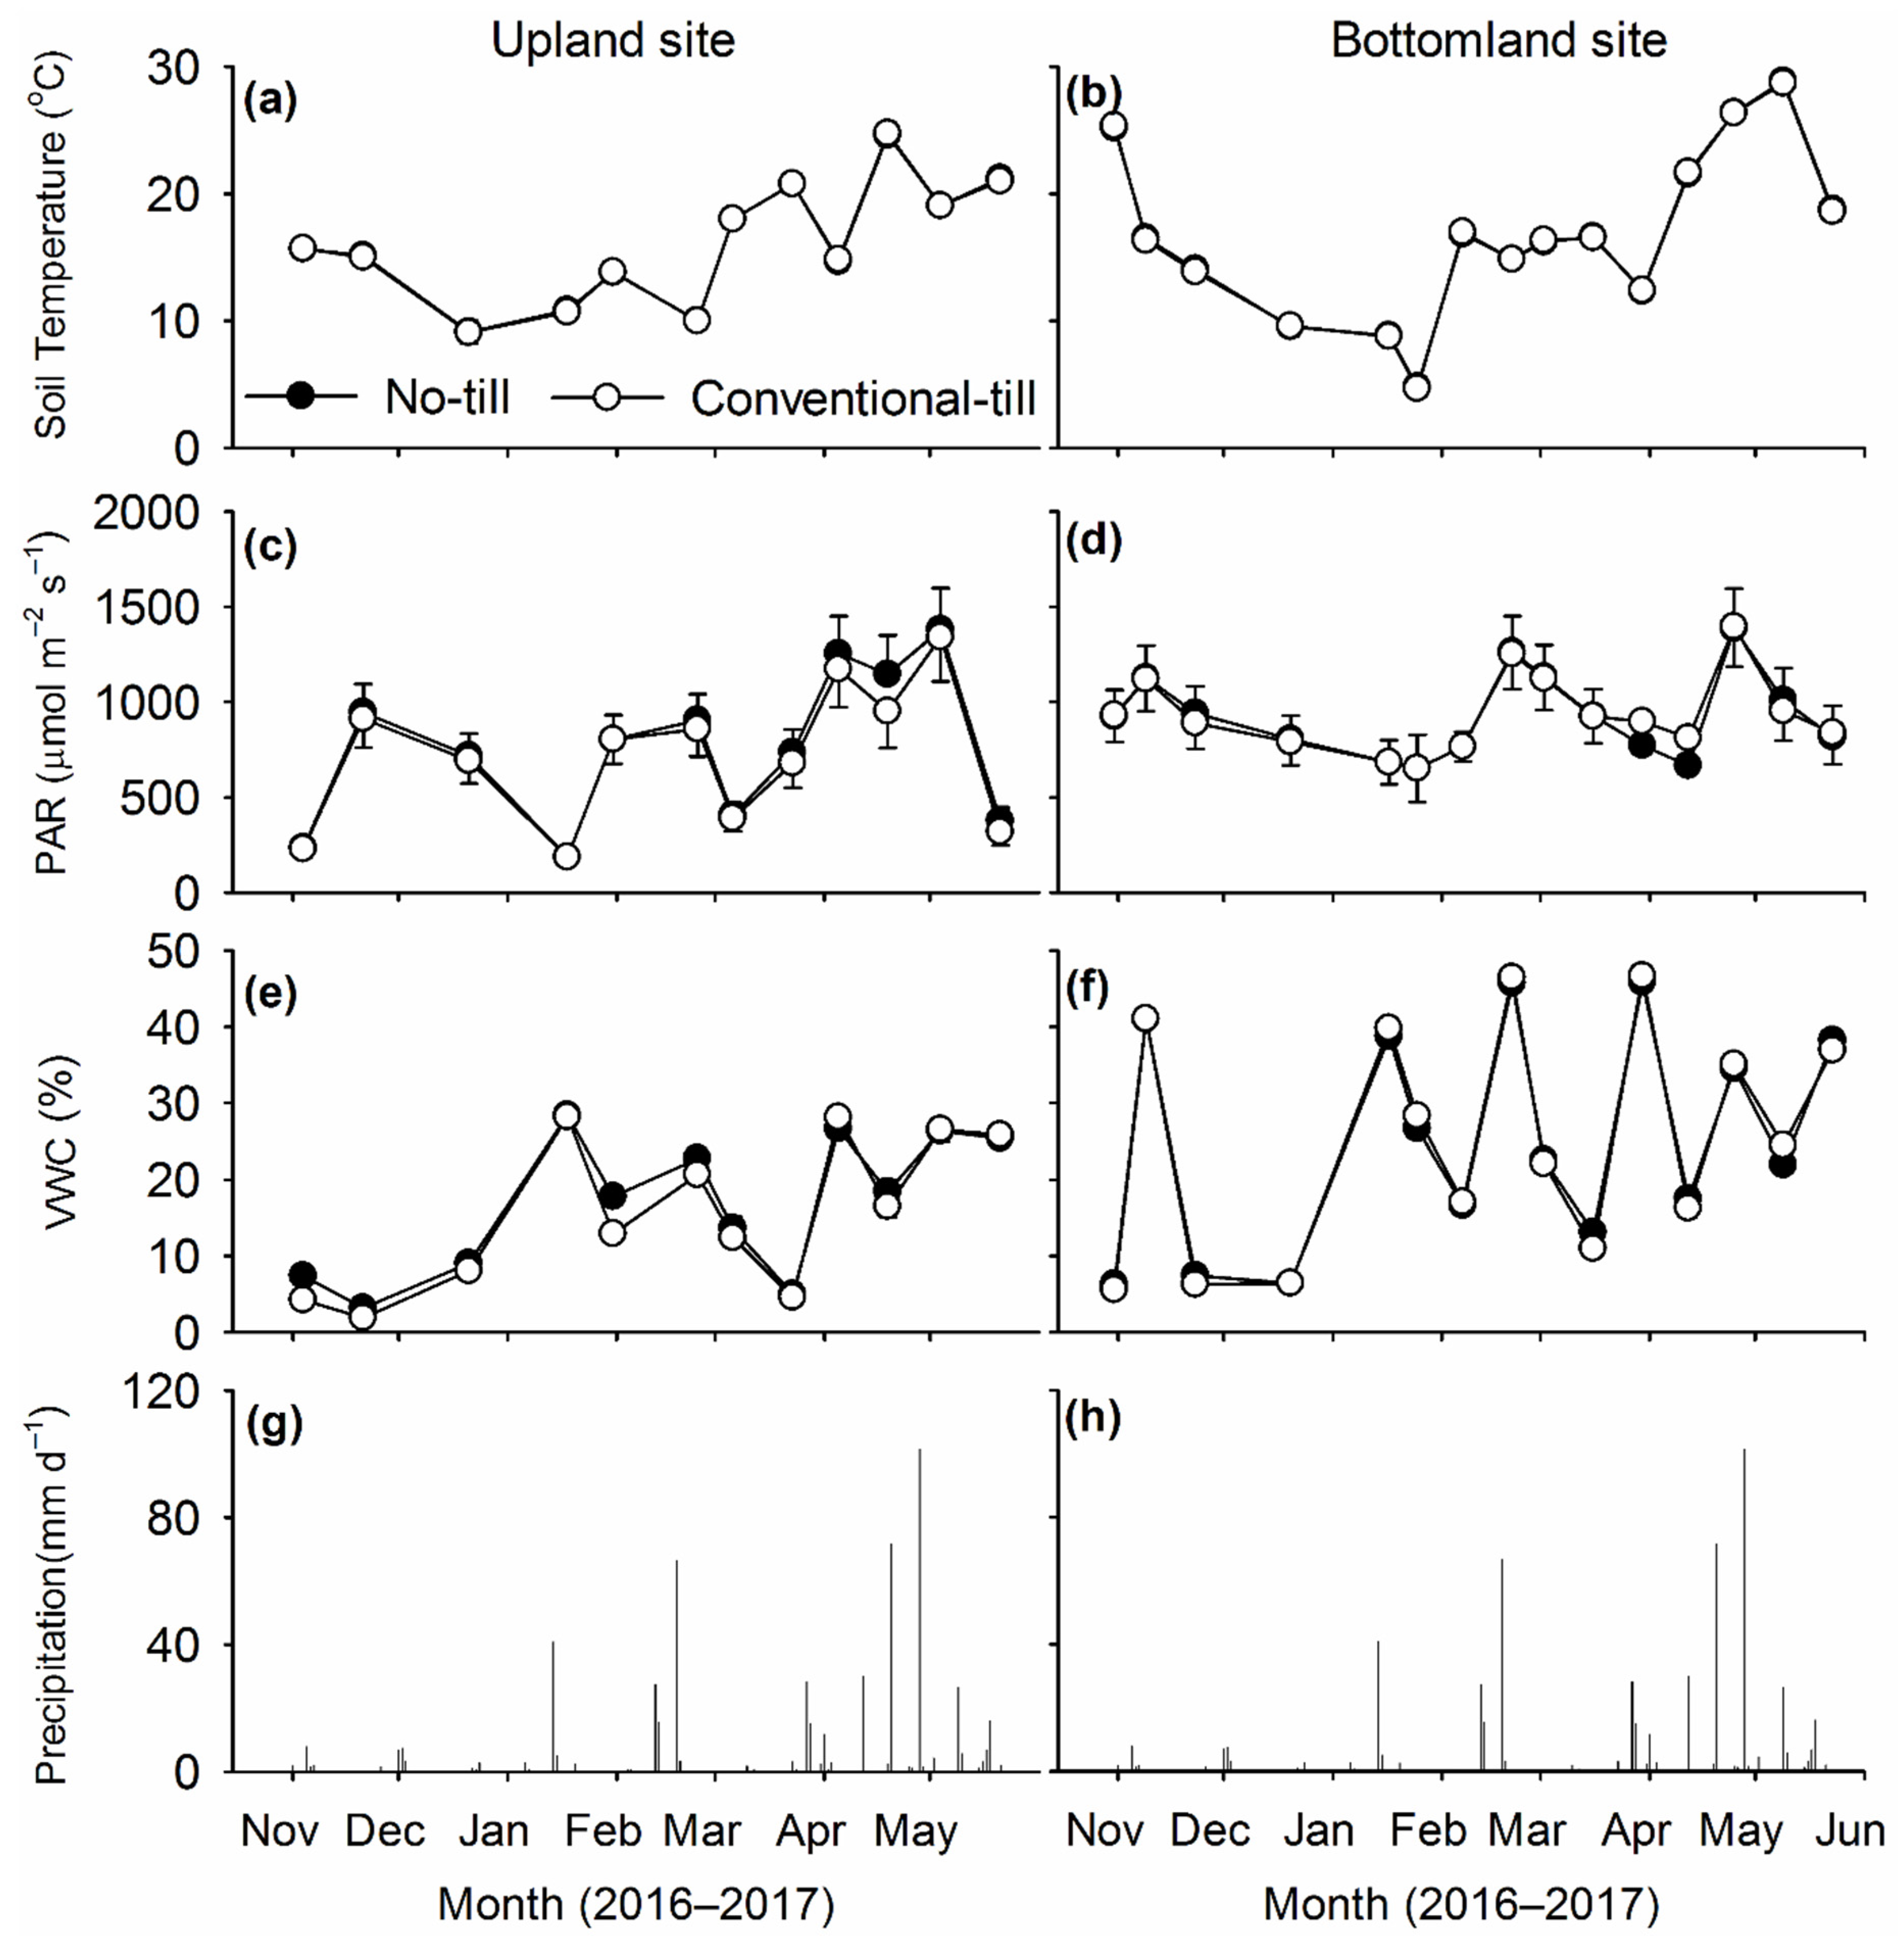
Volumetric water content (VWC) and temperature at the soil surface (0–5 cm) were measured outside each collar at flux measurement using Stevens® Hydra Probe® soil moisture sensors (Stevens Water Monitoring Systems, Inc., Portland, OR, USA). Air temperature during chamber enclosure and precipitation measurements during the study period were obtained from a weather station (Oklahoma Mesonet, Oklahoma Climatological Survey) roughly 1 km from the study site.

2.7. Measurements of Soil Mineral N Concentration

Soil samples (0–0.15 m) were taken from all plots on 2 dates (1 October 2016 and 1 May 2017) to determine concentrations of mineral N [nitrate (NO3) and ammonium (NH4+)] during early and late growth of winter wheat. Two soil cores (diameter, 0.02 m) were taken from each plot at both soil sampling dates and subsequently pooled to form a composite sample. A subsample (10 g) was extracted in 1.0 M KCl and concentrations of NO3 and NH4+ were analyzed by flow injection method (Timberline Instruments, Boulder, CO, USA).

2.8. Statistical Analysis

Measurements from the subplots receiving combinations of tillage system and N treatments in each site are presented as average and standard errors unless otherwise stated. The effects of tillage system and N treatment were analysed by analysis of variance (ANOVA) using a PROC GLIMMIX in SAS software (SAS Inc., Cary, NC, USA). Since the fluxes were not measured on the same days on the two sites, statistical analyses were individually applied to data from each site. For pairwise comparisons, Fisher’s LSD method was used at 5% level.

3. Results

3.1. Climate and Soil Conditions

Average air temperature during the growing season of winter wheat during the study year was 1.3 °C higher than the long-term (1981–2010) average of 11.5 °C (Figure 1a). In particular, air temperature during early growth of winter wheat (October–November) was 2.6 °C higher than the long-term averages. Additionally, air temperature during February–March was 3.4 °C higher than the long-term air temperatures in those months.
Total precipitation received during the 2016–2017 growing season of wheat (563 mm) was slightly greater (34 mm) than the long-term average of 529 mm (Figure 1b). However, precipitation was not well distributed through the growing season. Only 53 mm precipitation was recorded during October–December, which was 130 mm below the long-term average of 183 mm for those months. In contrast, precipitation received during February and April 2017 was higher than the long-term averages.
Soil temperature at 0–5 cm depth was similar for both systems of tillage, which ranged from 0 to 20 °C during flux measurements (Figure 2a,b). Likewise, the average PAR in a measurement date was similar for both systems of tillage. As the measurements were undertaken under sunny, partially cloudy or overcast conditions, large difference in PAR in the successive measurement dates were frequently recorded (Figure 2c,d). As expected, soil VWC increased after rainfall events and declined during dry spells (Figure 2e–h). Dynamics and magnitude of soil VWC was mostly similar under both tillage systems throughout the study periods.

3.2. Measured CO2 Fluxes

3.2.1. Influence of Tillage System

Influence of measurement date in NEE was significant on both sites, as NEE increased during the active period of growth, and remained close to zero during winter (Figure 3a,b, Table 1 and Table 2).
During spring, the mid-day NEE peaked to −204 kg CO2-C ha−1 day−1 before losing sink strength due to decreased photosynthesis with increasing levels of plant maturity. Average measured NEE across N treatments (absolute values) were significantly higher under CT system than NT on the upland site, but tillage system did not influence NEE rates on the bottomland site (Table 1 and Table 2).
The dynamics of GPP mostly followed patterns similar to NEE. Mid-day GPP reached −245 kg CO2-C ha−1 day−1 in mid-November (Figure 3c,d). Thereafter, GPP rates declined as the plants underwent dormancy during winter. During spring, mid-day GPP peaked at −267 kg CO2-C ha−1 day−1 before losing sink strength due to decreased photosynthesis with increasing level of plant maturity. Influence of tillage system was significant on GPP in both sites, with higher GPP rates observed for CT on the upland site and NT on the bottomland site. However, these differences represented differences of only 8%–12% (Table 1 and Table 2).
The dynamics of ER mostly mirrored the dynamics of GPP (Figure 3e,f). Mid-day ER reached 68 kg CO2-C ha−1 day−1 in November 2016. Thereafter, ER rates declined as the plants underwent dormancy during winter and temperature declined. During spring, the mid-day ER increased to 97 kg CO2-C ha−1 day−1, then declined due to senescence of plants, despite increased temperatures. The influence of tillage system was significant on ER at both sites, with higher ER rates observed from CT on upland site and from NT on the bottomland site. However, the difference was only ~10% on both sites (Table 1 and Table 2).
The dynamics of SR mostly followed temperature, since fluxes remained low in winter and increased in the spring (Figure 3g,h). Unlike ER fluxes, SR rates did not decline during April–May 2017 since SR did not have plant component. The main effect of tillage on SR was not significant on the upland site, but NT system had significantly higher SR on the bottomland site, albeit the difference was minimal (Table 1 and Table 2).

3.2.2. Influence of N Treatments

Nitrogen treatment had greater influence on NEE, GPP and ER fluxes than tillage system, due to strong growth responses of winter wheat to available N (Figure 4; Table 1 and Table 2). Rates of NEE generally increased with increased rates of N fertilizer both in autumn and spring (Figure 4a,b). However, the dynamics and magnitude of NEE fluxes were similar under both the 0-N and cowpea treatments. The dynamics of GPP under N-treatments mostly followed similar patterns as NEE (Figure 4c,d). Rates of GPP mostly increased with increased rates of N fertilization. However, dynamics and magnitude of GPP fluxes were similar under both 0-N and cowpea treatments. The dynamics of ER under N-treatments mostly mirrored dynamics of GPP (Figure 4e,f). Rate of ER mostly increased with increased rates of N fertilization, with dynamics and magnitude of ER fluxes similar under the 0-N and cowpea treatments. Influence of N-treatment was not significant for SR rates on both sites (Figure 4g,h; Table 1 and Table 2).

3.2.3. Proportion of Soil Respiration to Ecosystem Respiration

Overall, averaged SR represented about 31% of ER on the upland (13.4 out of 43.2 kg CO2-C ha−1 day−1) and 21% of ER on the bottomland (8.3 of 38.8 kg CO2-C ha−1 day−1) sites (Figure 5). Proportion of SR to ER was low during October–December when winter wheat was growing rapidly. In winter, when growth of winter wheat declined, ER dropped sharply and the gap between ER and SR remained less. When wheat started rapid growth in early-Spring, ER increased more rapidly than SR, and thus, the proportion of SR to ER remained low. In April, ER rates dropped rapidly and proportion of SR to total ER increased as winter wheat reached senescence.

3.3. Measured N2O Fluxes and Mineral-N Concentrations

Fluxes of N2O remained close to zero from all treatment combinations throughout the study (Figure 6).
Since emissions from all treatments were low throughout the study period, influence of tillage system and N treatments, and their interactions were not observed. Soil NH4+ concentration was not influenced by tillage and fertilizer managements on both soil sampling dates in both sites (Figure 7a). Overall soil NH4+ concentration was low (<15 mg NH4+-N kg soil−1) throughout the study period.
Unlike NH4+, soil NO3 concentration was influenced by N fertilizer treatments during October 2016 sampling in both sites (Figure 7b). Soil NO3 concentration during the October 2016 sampling was greater in 90-N treatment than other treatments on the upland site. On the bottomland site, the concentrations were similar in 45-N and 90-N treatments. Soil nitrate concentrations were low (<5 mg NO3-N kg soil−1) for all treatment-site combinations during May 2017 sampling and influences of tillage and N-treatments were not significant.

4. Discussion

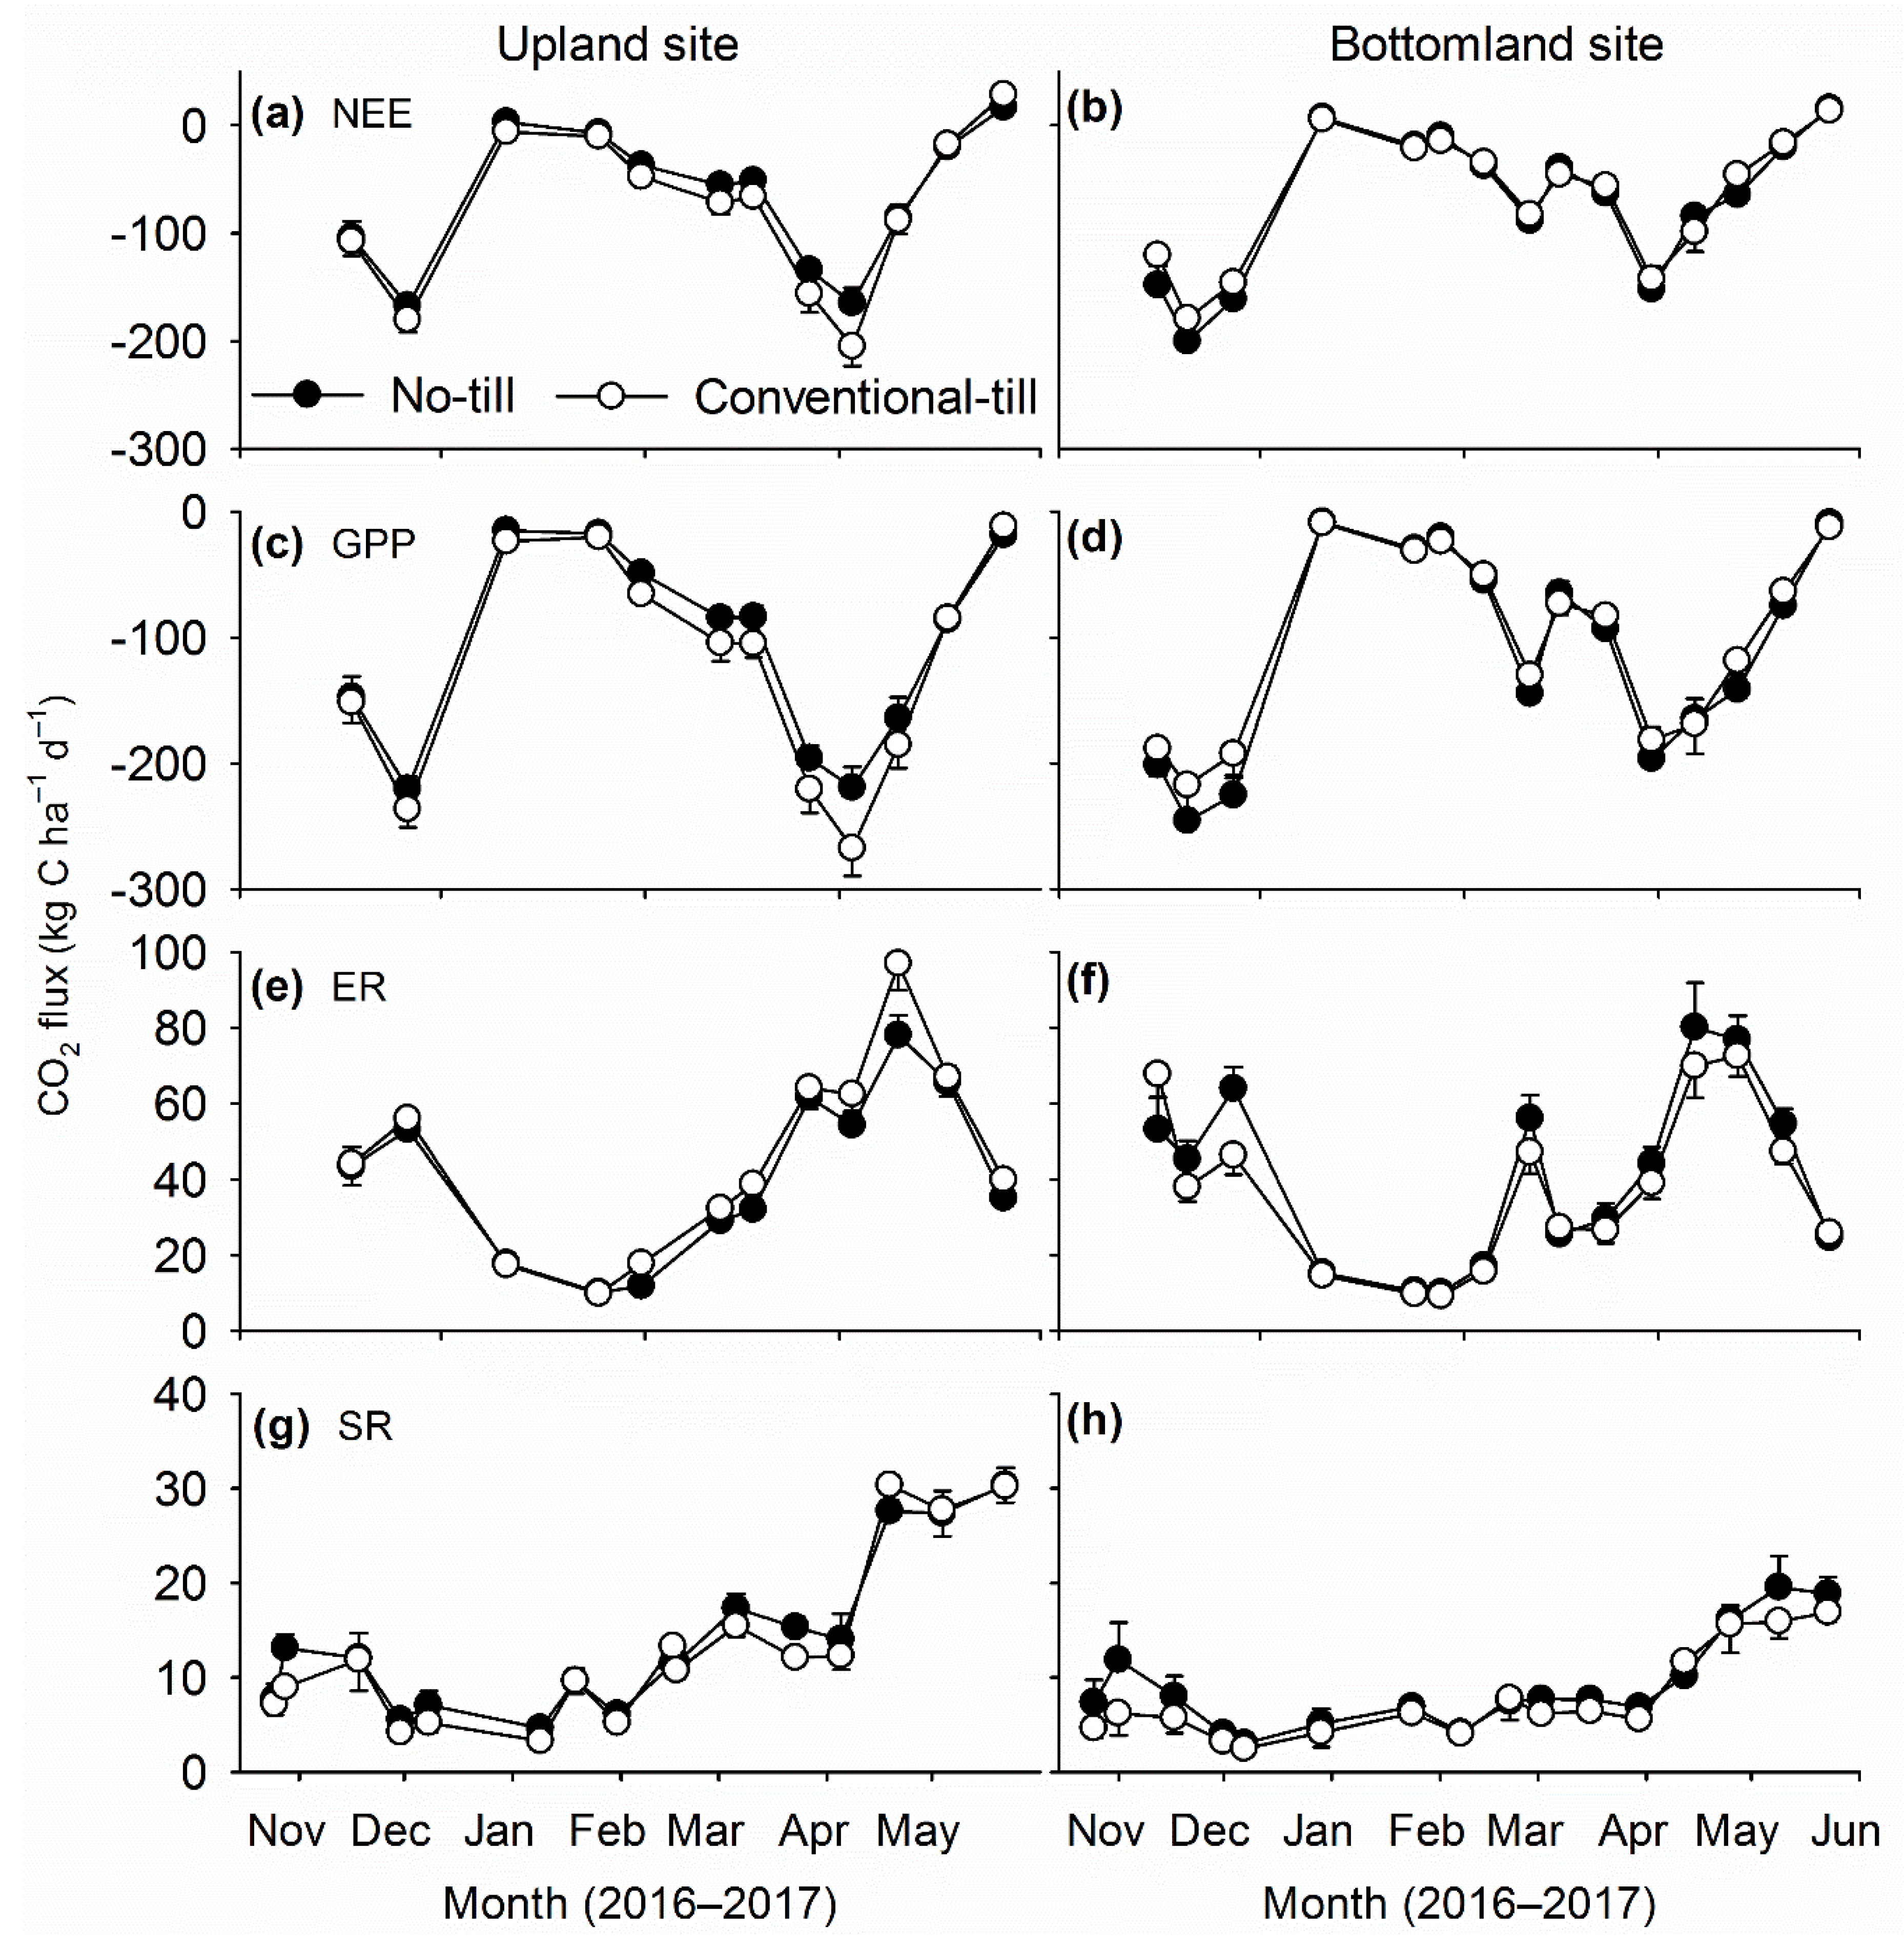
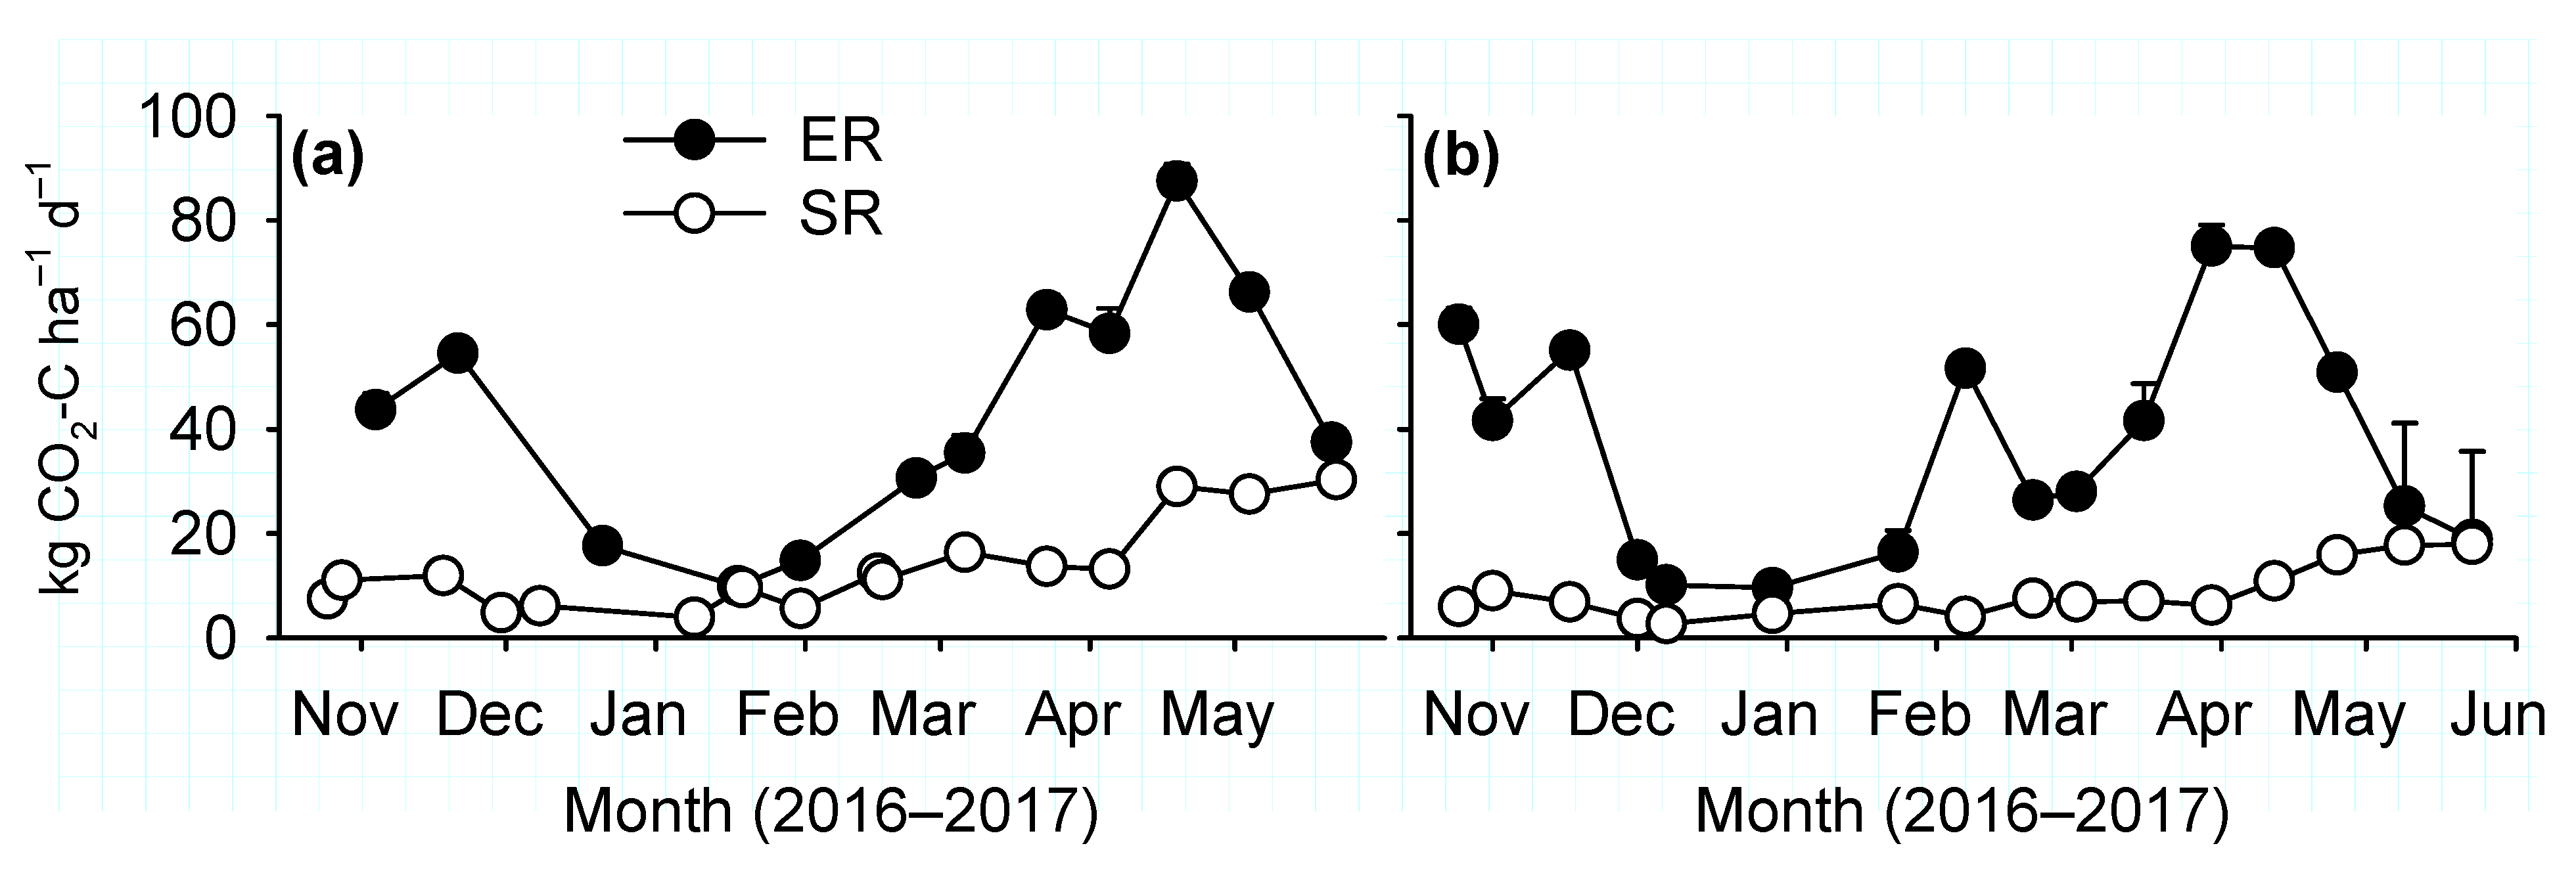
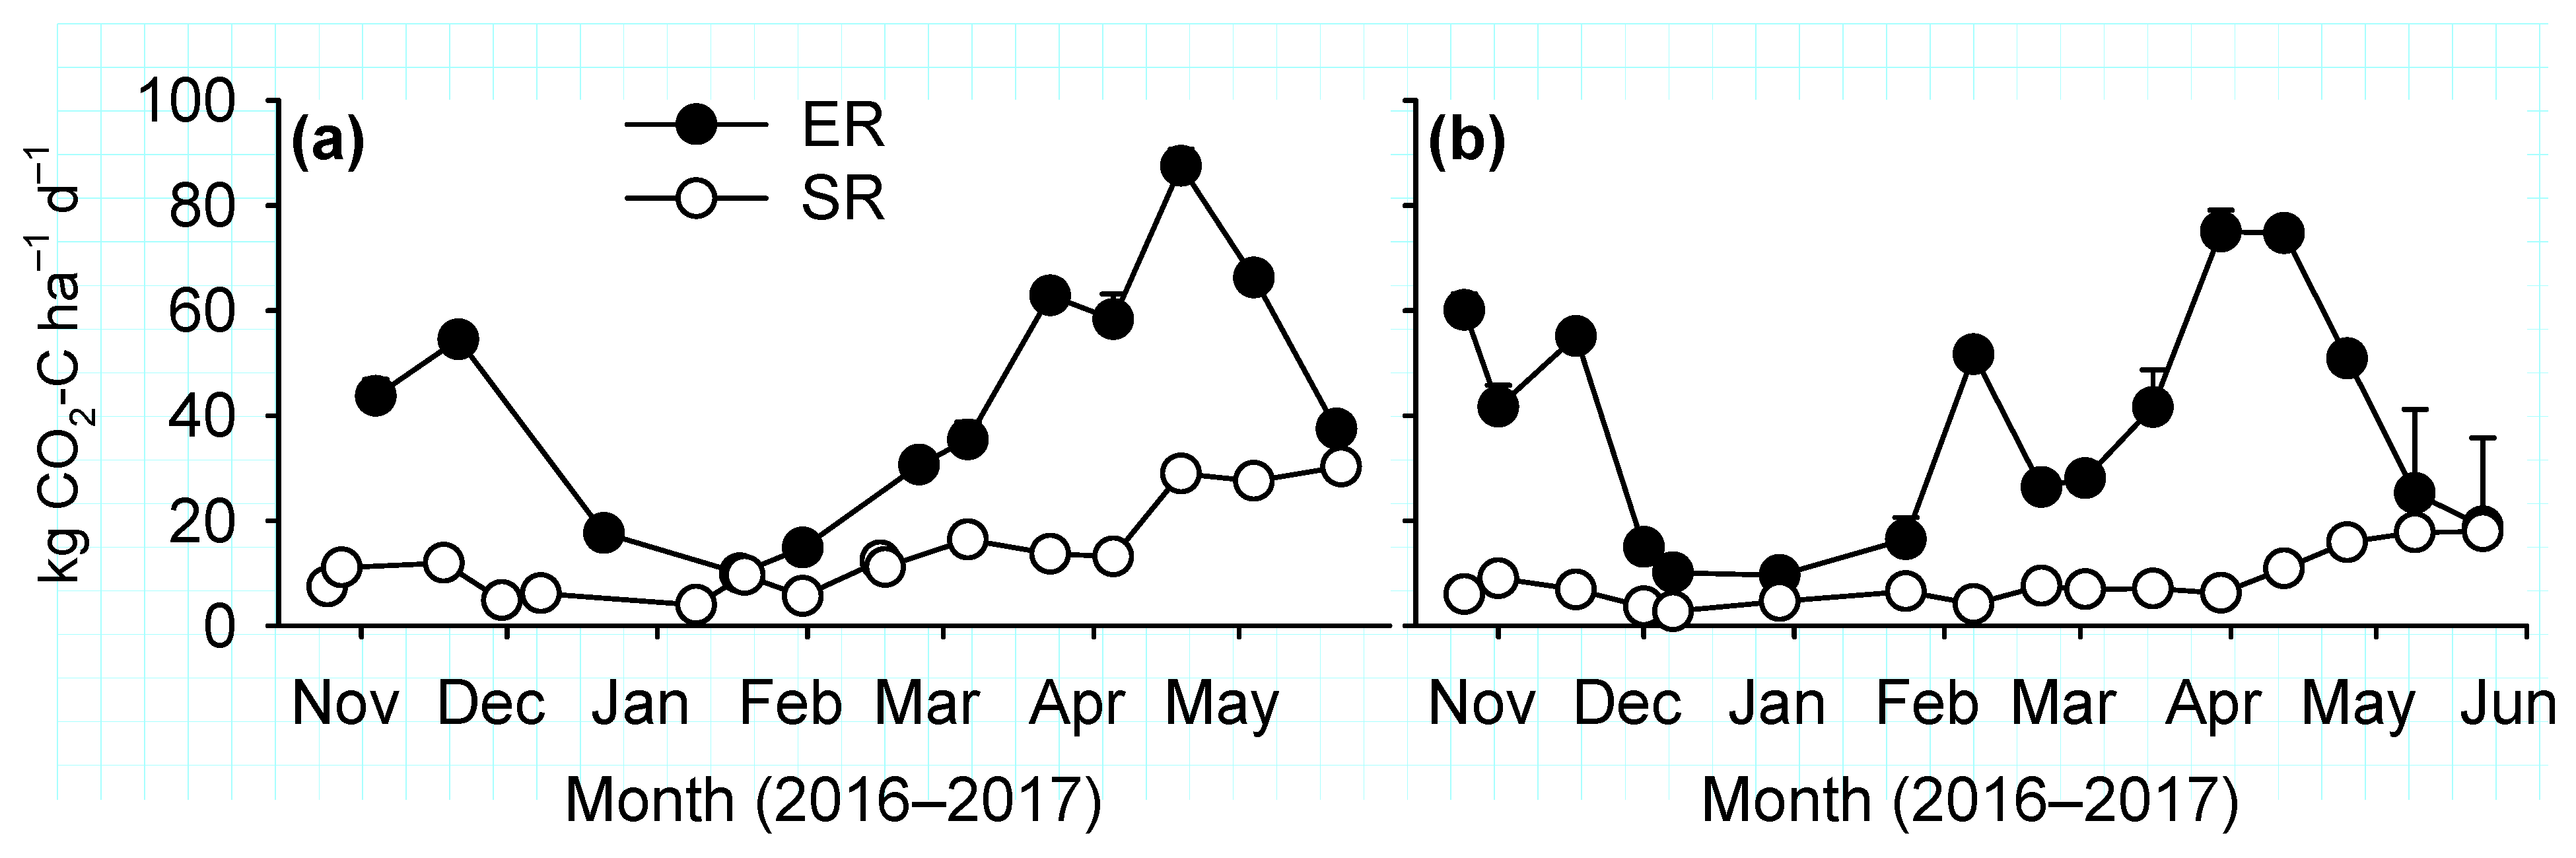
We observed minimal and inconsistent influences of tillage system on canopy fluxes of CO2 from winter wheat cultivated in central Oklahoma during this study. Albeit influence of tillage system on GPP was statistically significant, the difference was only ~10%, and opposite responses were recorded on the two sites. As with GPP, ER differed by ~10% among tillage systems, and opposite responses were noted on the two sites. Consistent differences in GPP and ER rates on the two sites indicated the difference in ER rates between tillage systems was mostly due to differences in plant growth. A possible reason for similar canopy CO2 fluxes from the contrasting tillage systems might be related to the lower intensity tillage applied under CT, which was restricted to the upper 20 cm of soil, and residues were left on the soil surface. Previous studies in the SGP have documented similar yield responses of winter wheat to NT and CT systems [3,22,23], and were corroborated by similar levels of GPP for tillage systems in this study. The short distance between sites, and difference in soil properties and fertility, allowed a test of effects of nitrogen and tillage treatments across a broad set of landscapes. Generally, soil in the bottomland areas are considered highly fertile in the region, and hence highly productive. In the upland site, which is less fertile and has a shallower profile than the bottomland site, a CT system would have contributed for better cycling of nutrients through decomposition of biomass residues. This might have contributed for better growth of winter wheat under CT system which contributed for greater canopy CO2 fluxes.
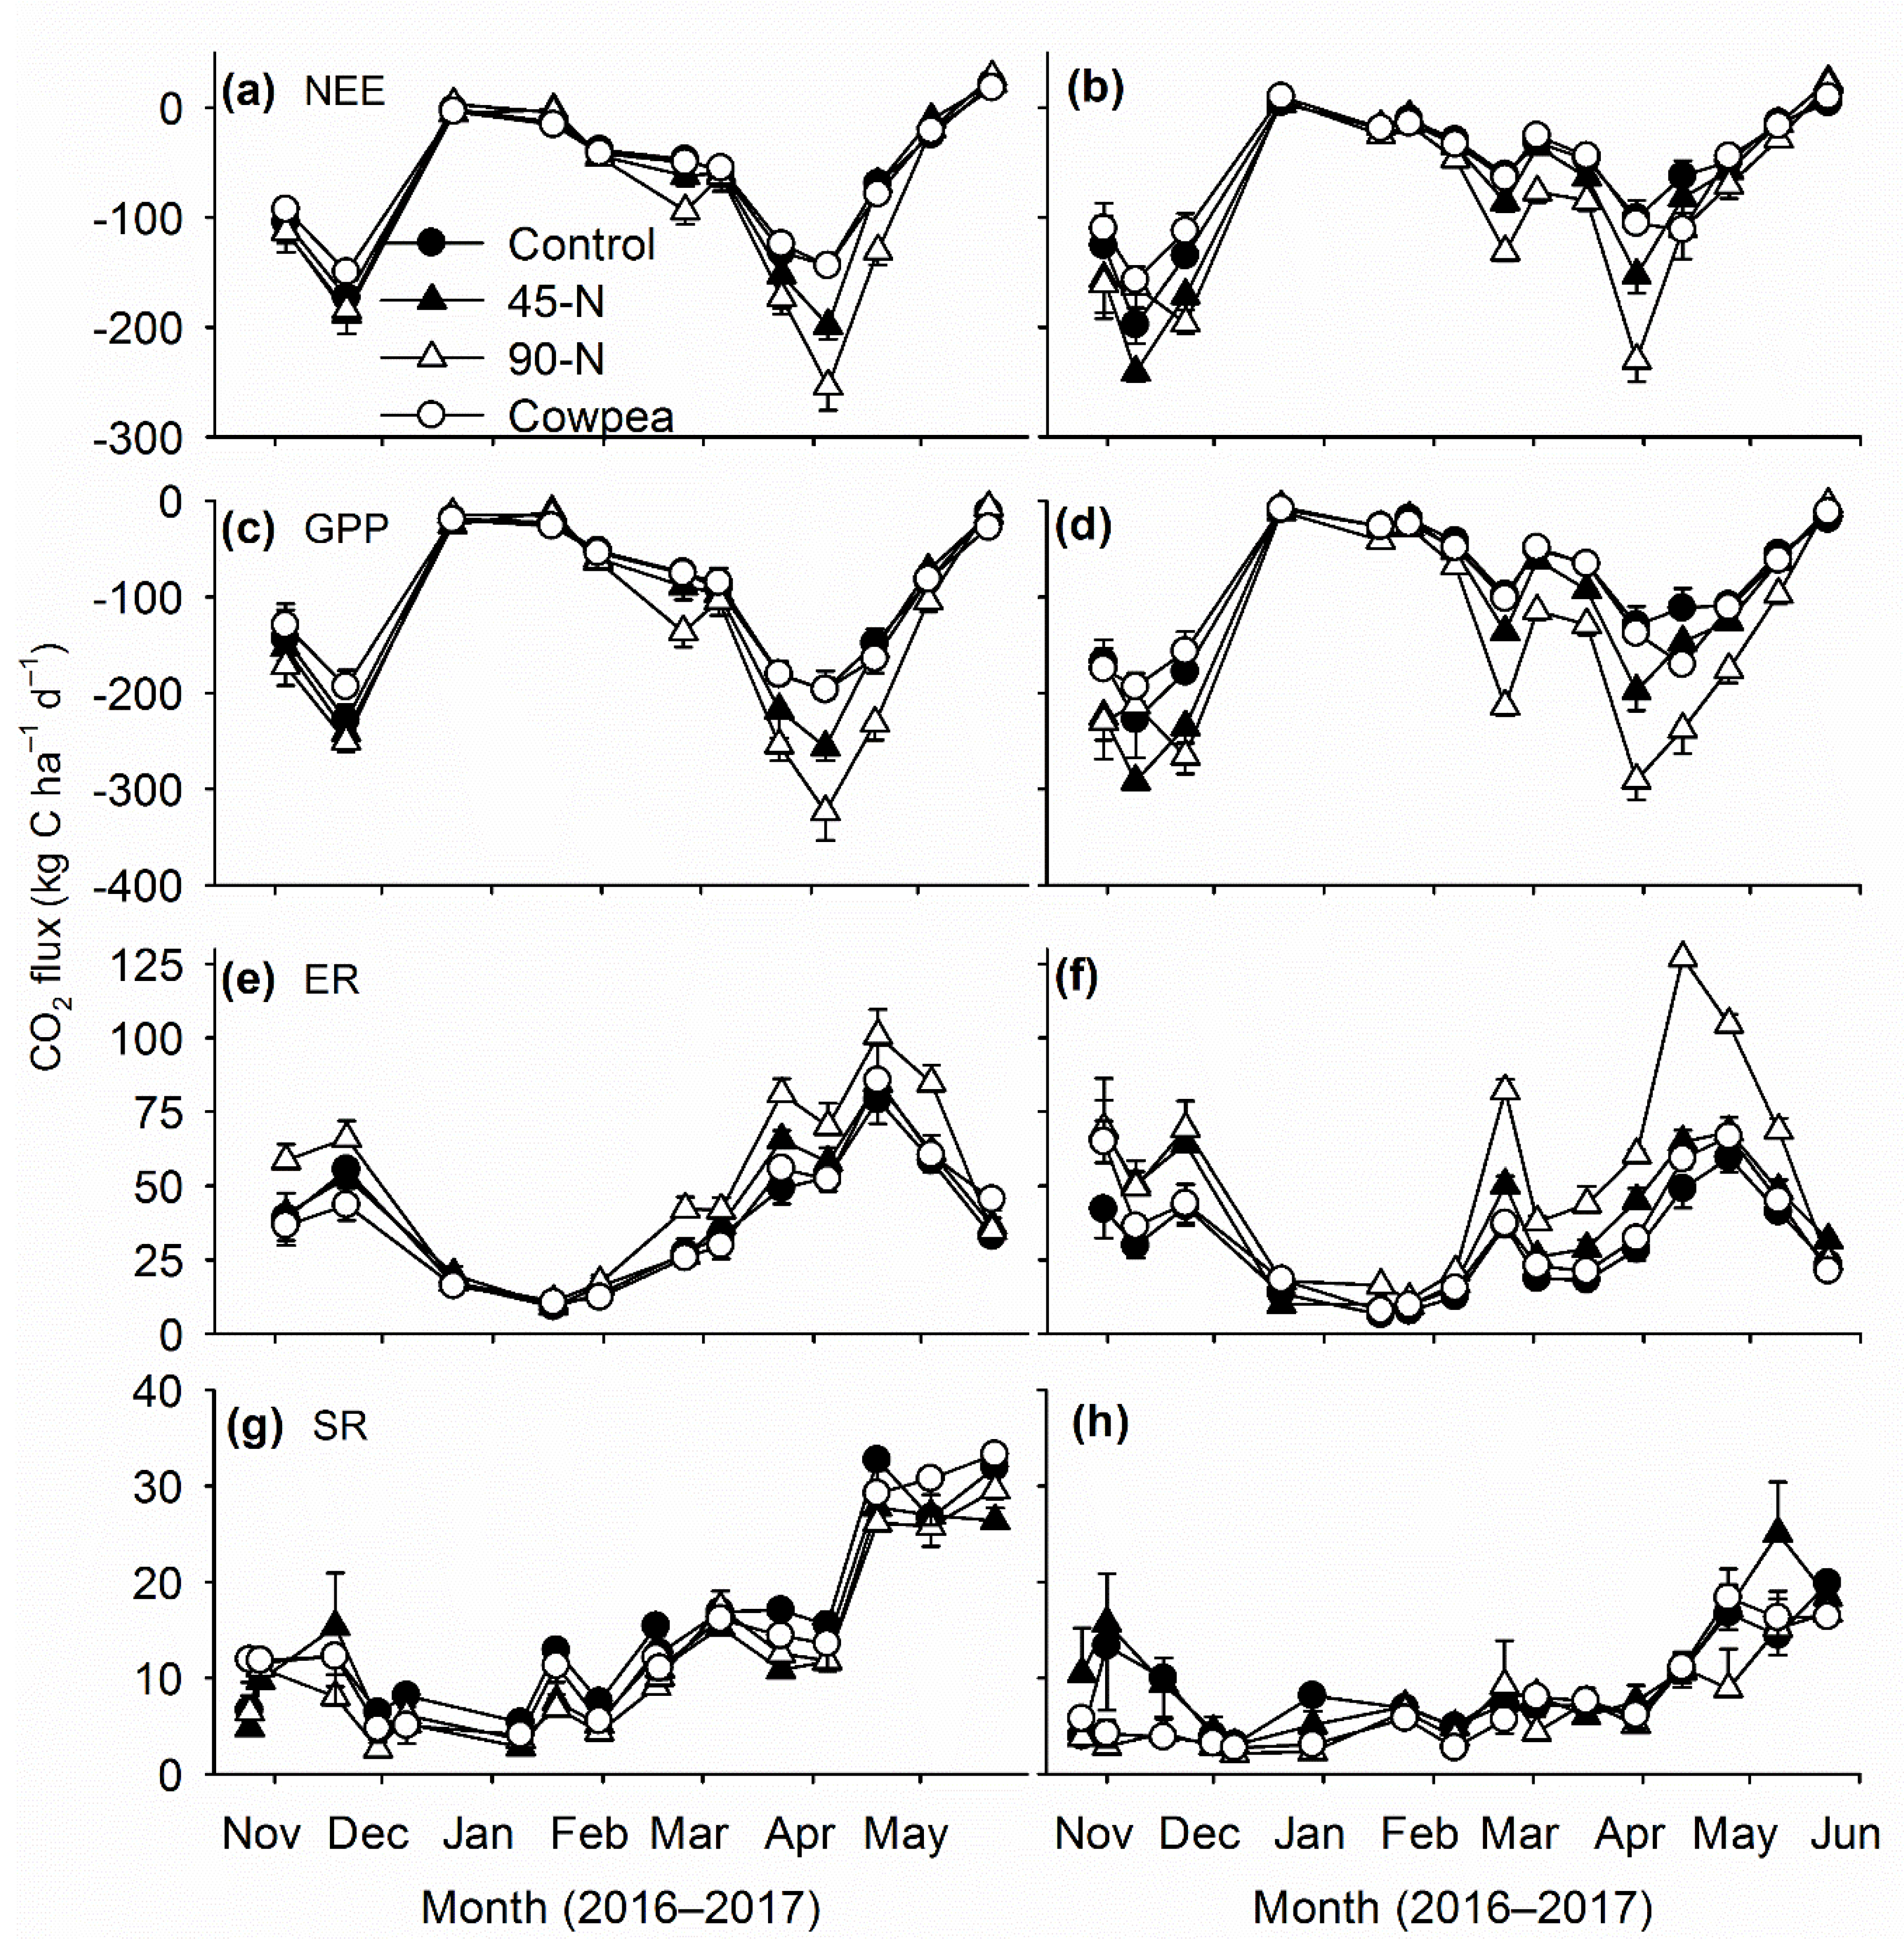
Contrary to system of tillage, large and consistent responses of canopy CO2 fluxes to N rates were seen on both sites. Canopy fluxes of CO2 increased with increasing rates of N fertilizer, which indicated strong growth responses of winter wheat to amounts of applied N fertilizer. Increased GPP fluxes with increasing level of N fertilizer corroborate results from previous studies in the SGP, where most studies reported strong positive responses of grain or forage yield of winter wheat to amount of applied N fertilizer [4,24,25]. The results of canopy CO2 fluxes also corroborate results on crop growth and yield of winter wheat, which was reported in a parallel study [26]. Higher rates of ER fluxes in fertilized treatments was mostly contributed by increased plant respiration due to better crop growth, as influence of rates of N fertilizer on soil respiration was not significant.
The similar magnitudes and dynamics of canopy CO2 fluxes from cowpea and 0-N treatments indicated that cowpea was not an effective source of green N for winter wheat. Additionally, the flux rates from cowpea treatments were significantly lower than from the 45-N and 90-N treatments. These results corroborate the previous findings in the region, as poor growth and yield responses of winter wheat to legume-based green N are reported frequently [3,4,25,27,28]. Lack of interaction effects between the tillage systems and N treatments indicated that cowpea-based green manure could not replace inorganic N fertilizers in either tillage system. In 2016, cowpea produced 1.1 (±0.2) and 1.9 (±0.5) Mg ha−1 aboveground dry biomass (mean ± standard deviation) on CT and NT plots at bottomland site, 1.7 (±0.7) and 2.0 (±0.6) Mg ha−1 aboveground dry biomass on CT and NT plots at upland site. The biomass contained about 32–80 kg N ha−1 at termination. The proportion of biologically fixed N by cowpea was not determined in this study but a previous study indicated that cowpea terminated 50 days after planting derived 55%–60% of total N in biomass from the atmosphere [29]. Thus, although cowpea might have increased the pool of N in soils through biological fixation, the biomass N was not transferred effectively to the following crop of winter wheat. This resulted to poor growth of winter wheat, and canopy CO2 fluxes remained similar to the unfertilized treatment. Future research should focus on improving biomass and N productivity of summer legumes and management approaches, such as timing of termination to synchronize N mineralization from decomposing green manures and N demand of winter wheat.
Increased soil respiration is expected after inclusion of cover crops in a monoculture due to increased inputs of C [30,31]. However, this was not observed during the current study, as the cowpea treatment did not have higher soil respiration rates than treatments without cover crops. A possible reason for the similar level of soil respiration from cowpea and fertilized treated plots might be due to similar, or lower, annual yields of biomass produced by the cowpea treatment. Winter wheat yields were lower from the cowpea treatment than the 45-N and 90-N treatments in the previous years. Although grain of winter wheat was harvested, residue was retained in the field, and thus, the fertilized treatments (45-N and 90-N) provided greater amounts of winter wheat residues than cowpea treatments. Another possible reason for similar SR fluxes was decomposition of a large proportion of cowpea biomass during the period between termination of cowpea and start of the flux measurements. Cowpea was terminated on the 17th of August in 2016, to conserve moisture to support germination and early growth of winter wheat, but SR fluxes were measured from the 25th of October. A total of 140 mm rainfall was received during this period which might have created soil conditions conducive to decomposition of cowpea biomass since soil moisture is one of the key environmental factor to control decomposition of cover crop residues in these study sites [16,21]. A recent study documented that legume green manures with low C/N ratio (<15) may lose a large proportion of biomass C within a month after termination, when soil moisture and temperature are favorable for biomass decomposition [16]. The cowpea biomass in this study had average C/N ratio of 15 at termination. Thus, although cowpea could have increased SR fluxes immediately after termination in August, long-term increases in soil respiration, an indicator of improved soil health, was not observed.
In this study, we did not observe strong responses of N2O emissions in response to N fertilizers and cowpea green manures, since emissions from all treatments remained low. The first three months during flux measurements were dry, with only 53 mm precipitation received during October through December 2016. Therefore, soil conditions were not conducive for denitrification, a major microbial pathway for N2O production in the soil [32]. Although frequent large precipitation events occurred in February and April, emissions did not increase during that time period. The low emissions during these periods was possibly due to efficient uptake of available inorganic N in soil by winter wheat, which was growing rapidly as evidenced by high rates of GPP flux. Legume green manures generally increase emissions of N2O after termination [15,33], but no significant N2O emissions were detected from the cowpea treatment in this study. Since there was a gap between termination of cowpea and inception of measurement, and significant amounts of rainfall were received during the gap, rainfall induced pulses of N2O emissions from the cowpea treatment were likely missed. Nevertheless, our results indicated that cowpea neither transferred biomass N effectively to a following crop of winter wheat, nor the N in biomass contributed to increased N2O emissions during the active growing period of winter wheat. Further studies are required to understand the environmental fate of biologically fixed N of summer legumes in the SGP, and to develop systems of crop management that allow effective transfer of N to crops of winter wheat.

5. Conclusions

We tested the influence of tillage system, rate and from of nitrogen fertilizers on canopy and soil fluxes of CO2 and soil fluxes of N2O during a growing season of winter wheat cultivated in the US SGP. Canopy fluxes of CO2 (net ecosystem exchange, gross primary production and ecosystem respiration) varied by 10% between no-till and conventional till, and opposite responses were observed on the two study sites. Results indicated the two forms of tillage applied to winter wheat production in the US SGP influence crop growth in a similar way. Application of nitrogen fertilizer had a stronger influence on canopy fluxes of CO2 than cowpea-based green N, since the fluxes increased with increasing rates of nitrogen fertilizer. Tillage and fertilizer treatments did not influence soil respiration but large seasonal dynamics were observed from all treatments. Fluxes of N2O remained low from all treatments throughout the study and no response to tillage systems or fertilizer treatments were observed. Overall, results from this study indicate canopy fluxes of CO2, an indicator of growth and yield by winter wheat, were controlled more by forms and rates of nitrogen fertilizers than system of tillage. Since cowpea was not effective at improving gross photosynthesis as a green manure compared to an unfertilized control, future studies should focus on improving the fertilizer value of summer legumes grown to supply N for winter wheat in the US SGP.

Author Contributions

Conceptualization, T.P.K.; data curation, T.P.K.; formal analysis, T.P.K.; funding acquisition, P.H.G.; investigation, T.P.K.; methodology, T.P.K. and B.K.N.; project administration, P.H.G.; resources, B.K.N.; writing—original draft, T.P.K.; writing—review and editing, T.P.K., P.H.G. and B.K.N. All authors have read and agreed to the published version of the manuscript.

Funding

This research received no external funding.

Acknowledgments

The authors wish to recognize ARS technicians Delmar Shantz, Kathie Wynn, Kory Bollinger, and Jeff Weik for their assistance in managing the experiment, collecting, and analyzing samples. Mention of trademarks, proprietary products, or vendors does not constitute guarantee or warranty of products by USDA and does not imply its approval to the exclusion of other products that may be suitable. All programs and services of the USDA are offered on a nondiscriminatory basis, without regard to race, color, national origin, religion, sex, age, marital status or handicap.

Conflicts of Interest

The authors declare no conflict of interest.

References

  1. Oklahoma Agricultural Statistics. 2018; Oklahoma Department of Agriculture, Food and Forestry. Available online: https://www.nass.usda.gov/Statistics_by_State/Oklahoma/Publications/Annual_Statistical_Bulletin/ok-bulletin-2018.pdf (accessed on 15 November 2019).
  2. Patrignani, A.; Lollato, R.P.; Ochsner, T.E.; Godsey, C.B.; Edwards, J.T. Yield gap and production gap of rainfed winter wheat in the southern Great Plains. Agron. J. 2014, 106, 1329–1339. [Google Scholar] [CrossRef] [Green Version]
  3. Northup, B.K.; Rao, S.C. Effects of legume green manures on forage produced in continuous wheat systems. Agron. J. 2016, 108, 101–108. [Google Scholar] [CrossRef]
  4. MacKown, C.T.; Heitholt, J.J.; Rao, S.C. Agronomic feasibility of a continuous double crop of winter wheat and soybean forage in the southern Great Plains. Crop Sci. 2007, 47, 1652–1660. [Google Scholar] [CrossRef]
  5. Rao, S.C.; Northup, B.K. Capabilities of four novel warm-season legumes in the southern Great Plains: Grain production and quality. Crop Sci. 2009, 49, 1103–1108. [Google Scholar] [CrossRef] [Green Version]
  6. Farahani, H.J.; Peterson, G.A.; Westfall, D.G. Dryland cropping intensification: A fundamental solution to efficient use of precipitation. Adv. Agron. 1998, 64, 197–223. [Google Scholar]
  7. Tilman, D.; Cassman, K.G.; Matson, P.A.; Naylor, R.; Polasky, S. Agricultural sustainability and intensive production practices. Nature 2002, 418, 671. [Google Scholar] [CrossRef] [PubMed]
  8. Hossain, I.; Epplin, F.M.; Horn, G.W.; Krenzer, E.R. Wheat Production and Management Practices Used by Oklahoma Grain and Livestock Producers; Oklahoma Agric. Exp. Stn. B-818.; Oklahoma State University: Stillwater, OK, USA, 2004. [Google Scholar]
  9. Hansen, N.C.; Allen, B.L.; Baumhardt, R.L.; Lyon, D.J. Research achievements and adoption of no-till, dryland cropping in the semi-arid US Great Plains. Field Crops Res. 2012, 132, 196–203. [Google Scholar] [CrossRef] [Green Version]
  10. Kessavalou, A.; Mosier, A.R.; Doran, J.W.; Drijber, R.A.; Lyon, D.J.; Heinemeyer, O. Fluxes of carbon dioxide, nitrous oxide, and methane in grass sod and winter wheat-fallow tillage management. J. Environ. Qual. 1998, 27, 1094–1104. [Google Scholar] [CrossRef]
  11. Bista, P.; Norton, U.; Ghimire, R.; Norton, J.B. Effects of tillage system on greenhouse gas fluxes and soil mineral nitrogen in wheat (Triticum aestivum, L.)-fallow during drought. J. Arid Environ. 2017, 147, 103–113. [Google Scholar] [CrossRef]
  12. Abdalla, M.; Osborne, B.; Lanigan, G.; Forristal, D.; Williams, M.; Smith, P.; Jones, M.B. Conservation tillage systems: A review of its consequences for greenhouse gas emissions. Soil Use Manag. 2013, 29, 199–209. [Google Scholar] [CrossRef]
  13. Peterson, L.B.; Hanna, L.; Steiner, J.L. Reduced soil disturbance: Positive effects on greenhouse gas efflux and soil N losses in winter wheat systems of the southern plains. Soil Till. Res. 2019, 191, 317–326. [Google Scholar] [CrossRef]
  14. Hendrix, F.P.; Han, C.R.; Groffman, P.M. Soil respiration in conventional and no-tillage agroecosystems under different winter cover crop rotations. Soil Till Res. 1988, 12, 135–148. [Google Scholar] [CrossRef]
  15. Kandel, T.P.; Gowda, P.H.; Somenahally, A.; Northup, B.K.; DuPont, J.; Rocateli, A.C. Nitrous oxide emissions as influenced by legume cover crops and nitrogen fertilization. Nutr. Cycl. Agroecosyst. 2018, 112, 119–131. [Google Scholar] [CrossRef]
  16. Singh, H.; Kandel, T.P.; Gowda, P.H.; Somenahally, A.; Northup, B.K.; Kakani, V.G. Influence of contrasting soil moisture conditions on carbon dioxide and nitrous oxide emissions from terminated green manures. Agrosyst. Geosci. Environ. 2019, 2, 190012. [Google Scholar] [CrossRef] [Green Version]
  17. Nielsen, D.C.; Lyon, D.J.; Hergert, G.W.; Higgins, R.K.; Holman, J.D. Cover crop biomass production and water use in the Central Great Plains. Agron. J. 2015, 107, 2047–2058. [Google Scholar] [CrossRef]
  18. Kandel, T.P.; Gowda, P.H.; Northup, B.K.; Rocateli, A.C. Winter wheat yield and nitrous oxide emissions in response to cowpea-based green manure and nitrogen fertilization. Exp. Agric. 2019, in press. [Google Scholar] [CrossRef]
  19. USDA-NRCS. Soil Survey of Canadian County, Oklahoma, Supplement Manuscript; USDA and Oklahoma Agricultural Experiment Station: Stillwater, OK, USA, 1999. [Google Scholar]
  20. Kutzbach, L.; Schneider, J.; Sachs, T.; Giebels, M.; Nykänen, H.; Shurpali, N.J.; Martikainen, P.J.; Alm, J.; Wilmking, M. CO2 flux determination by closed-chamber methods can be seriously biased by inappropriate application of linear regression. Biogeosciences 2007, 4, 1005–1025. [Google Scholar] [CrossRef]
  21. Kandel, T.P.; Gowda, P.H.; Northup, B.K.; Rocateli, A.C. Soil respiration from winter wheat-based cropping systems in the US Southern Great Plains as influenced by tillage managements. Acta Agric. Scand. Sect. B-Soil Plant Sci. 2019, 69, 377–385. [Google Scholar] [CrossRef]
  22. Sij, J.; Belew, M.; Pinchak, W. Nitrogen management in no-till and conventional-till dual-use wheat/stocker systems. Texas J. Agric. Nat. Resour. 2016, 24, 38–49. [Google Scholar]
  23. Baumhardt, R.L.; Schwartz, R.C.; Scanlon, B.R.; Reedy, R.C.; Marek, G.W. Long-term conventional and no-tillage effects on field hydrology and yields of a dryland crop rotation. Soil Sci. Soc. Am. J. 2017, 81, 200–209. [Google Scholar] [CrossRef]
  24. Thomason, W.E.; Raun, W.R.; Johnson, G.V. Winter wheat fertilizer nitrogen use efficiency in grain and forage production systems. J. Plant Nutr. 2000, 23, 1505–1516. [Google Scholar] [CrossRef]
  25. Bidlack, J.E.; MacKown, C.T.; Rao, S.C. Dry matter and nitrogen content of chickpea and winter wheat grown in pots for three rotations. J. Plant Nutri. 2007, 30, 1541–1553. [Google Scholar] [CrossRef]
  26. Kandel, T.P.; Gowda, P.H.; Northup, B.K.; Rocateli, A.C. Impacts of tillage systems, nitrogen fertilizer rates and a legume green manure on light interception and yield of winter wheat. Cogent Food Agric. 2019, 5, 1580176. [Google Scholar] [CrossRef]
  27. Rao, S.C.; Northup, B.K. Grass pea (Lathyrus Sativus L.) as a nitrogen source for continuous no-till winter wheat. Crop Sci. 2011, 51, 1824–1831. [Google Scholar] [CrossRef]
  28. Northup, B.K.; Rao, S.C. Double-cropped warm-season legumes influence wheat grain in the U.S. southern Plains. Agron. J. 2015, 107, 1666–1672. [Google Scholar]
  29. Da Silva Júnior, E.B.; Favero, V.O.; Xavier, G.R.; Boddey, R.M.; Zilli, J.E. Rhizobium inoculation of cowpea in Brazilian cerrado increases yields and nitrogen fixation. Agron. J. 2018, 110, 722–727. [Google Scholar] [CrossRef]
  30. Mitchell, J.P.; Shrestha, A.; Mathesius, K.; Scow, K.M.; Southard, R.J.; Haney, R.L.; Schmidt, R.; Munk, D.S.; Horwath, W.R. Cover cropping and no-tillage improve soil health in an arid irrigated cropping system in California’s San Joaquin Valley, USA. Soil Tillage Res. 2017, 165, 325–335. [Google Scholar] [CrossRef] [Green Version]
  31. Nunes, M.R.; Van Es, H.M.; Schindelbeck, R.; Ristow, A.J.; Ryan, M. No-till and cropping system diversification improve soil health and crop yield. Geoderma 2018, 328, 30–43. [Google Scholar] [CrossRef]
  32. Inatomi, M.; Hajima, T.; Ito, A. Fraction of nitrous oxide production in nitrification and its effect on total soil emission: A meta-analysis and global-scale sensitivity analysis using a process-based model. PLoS ONE 2019, 14, e0219159. [Google Scholar] [CrossRef]
  33. Kandel, T.P.; Gowda, P.H.; Northup, B.K.; Rocateli, A.C. Incorporation and harvest management of hairy vetch-based green manure influence nitrous oxide emissions. Renew. Agric. Food Syst. 2019, 1–10. [Google Scholar] [CrossRef]
Figure 1. Mean monthly (a) temperature and (b) total precipitation during the study period (October 2016 to May 2017; grey bars), compared to the long-term (1981–2010) mean in the study area (black circles).
Agronomy 10 00320 g001
Figure 2. Dynamics of (a,b) soil temperature, (c,d) photosynthetically active radiation (PAR), and (e,f) volumetric water content (VWC) during flux measurements at plots managed by no-till and conventional-till. (g,h) Daily average precipitation during the study period. Data (panels a-f) are presented as averages (n = 12) and standard errors across all N treatments under a tillage system. Unidirectional error bars are shown for clarity.
Agronomy 10 00320 g002
Figure 3. Dynamics of (a,b) net ecosystem exchange (NEE) of CO2, (c,d) gross primary production (GPP), (e,f) ecosystem respiration (ER), and (g,h) soil respiration (SR) fluxes from plots managed by no-till and conventional-till. Each point represents average fluxes across all N treatments under a tillage system. Error bars represent the spatial variations at plots (standard error, n = 12). Unidirectional error bars are shown for clarity.
Agronomy 10 00320 g003
Figure 4. Dynamics of (a,b) net ecosystem exchange (NEE) of CO2, (c,d) gross primary production (GPP), (e,f) ecosystem respiration (ER), and (g,h) soil respiration (SR) fluxes in response to N treatments. Each point represents averages across tillage systems under an N treatment. Error bars represent the spatial variations at plots (standard error, n = 6). Unidirectional error bars are shown for clarity.
Agronomy 10 00320 g004
Figure 5. Dynamics of ecosystem respiration (ER), and soil respiration (SR) at (a) upland and (b) lowland sites. Each point represents site-specific averages across all tillage systems and nitrogen treatments. Error bars represent the spatial variations at plots (standard error, n = 24). Unidirectional error bars are shown for clarity.
Agronomy 10 00320 g005
Figure 6. Dynamics of N2O flux from different N treatments in upland (a) and bottomland (b) sites. Each point represent averages across tillage systems and nitrogen treatments. Error bars represent the spatial variations at plots (standard error, n = 6). Unidirectional error bars are shown for clarity.
Agronomy 10 00320 g006
Figure 7. Soil concentrations of (a) ammonium (NH4+) and (b) nitrate (NO3) in the 0–0.15 m soil depth in upland (left panels) and bottomland (right panels) sites during two sampling dates. Data are shown as average and standard errors (n = 3). The different letters above the bars represent significance difference among N treatments within a sampling date. Influence of tillage system was not significant at any sampling dates for NH4+ and NO3 concentrations.
Agronomy 10 00320 g007
Table 1. Significance of the effects of tillage system (T), nitrogen treatments (N), measurement date (D) and their interaction on net ecosystem exchange (NEE), gross primary production (GPP), ecosystem respiration (ER) and soil respiration (SR) fluxes. Significant p-values (p < 0.05) are presented with bold fonts. Data were analyzed separately for upland (Up) and bottomland (Bot) sites.
InfluenceNEEGPPERSR
UpBotUpBotUpBotUpBot
Tillage (T)<0.010.17<0.010.030.00<0.010.16<0.01
Nitrogen (N)0.090.010.07<0.010.06<0.010.170.32
N × T0.480.140.170.310.030.690.090.08
Date (D)<0.01<0.01<0.01<0.01<0.01<0.01<0.01<0.01
D × N<0.01<0.01<0.01<0.010.02<0.010.990.01
D × T0.210.840.270.580.18<0.010.920.76
D × N × T0.370.800.170.920.330.200.850.36
Table 2. Averages of CO2 fluxes [net ecosystem exchange (NEE), gross primary production (GPP), ecosystem respiration (ER) and soil respiration (SR)] across measurement dates. Unit of all CO2 fluxes are kg CO2-C ha−1 day−1. Numbers with the different letters within columns (a, ab, b, bc, c) were significantly different (p < 0.05) within a treatment. Statistically analyses were done separately for upland (Up) and bottomland (Bot) sites.
TreatmentNEE GPP ER SR
UpBotUpBotUpBotUpBot
Tillage System
CT−77 a−66−123 a−104 b45 a37 b138 b
NT−67 b−71−108 b−112 a41 b40 a149 a
Nitrogen Treatment
0-N (control)−65 b−58 bc−104 b−87 c39 b29 c159
45-N−73 ab−73 ab−116 ab−113 b42 ab40 b1210
90-N−87 a−88 a−140 a−142 a52 a54 a126
Cowpea−63 b−56 c−103 b−89 c40 b33 bc148

