Article

Response of Common Bean Cultivars and Lines to Aluminum Toxicity

by
José dos Santos Neto
1,2,*,
Jessica Delfini
1,2,
Tiago Willian Silva
1,
Anderson Akihide Hirose
2,
João Marcos Novais
2,
Leandro Simões Azeredo Gonçalves
2 and
Vânia Moda-Cirino
1
1
Instituto Agronômico do Paraná, Área de Melhoramento e Genética Vegetal, Londrina 86.047-902, Paraná, Brazil
2
Programa de Pós-Graduação em Agronomia, Universidade Estadual de Londrina, Londrina 86.057-970, Paraná, Brazil
*
Author to whom correspondence should be addressed.
Agronomy 2020, 10(2), 296; https://doi.org/10.3390/agronomy10020296
Submission received: 26 November 2019 / Revised: 13 December 2019 / Accepted: 15 December 2019 / Published: 19 February 2020
(This article belongs to the Section Crop Breeding and Genetics)

Abstract

:
The soils in the common bean-producing regions (Phaseolus vulgaris L.) of Brazil are usually acid and conta\y66\yin toxic levels of aluminum (Al) for plants. This ion causes yield losses by inhibiting root cell expansion, thus reducing water and nutrient uptake. This study investigates the optimal Al concentration for the screening of genotypes in hydroponics cultivation and tries to identify cultivars and lines for cultivation in Al-toxic soils. The study consisted of two series of experiments. In the first one, four cultivars were evaluated at five Al concentrations (0, 2.5, 5, 7.5 and 10 ppm) and in the second, four independent tests were carried out (1-carioca, 2-black, 3-red, and 4-white), each with seven genotypes and two Al concentrations (0 and 4 ppm). The optimized concentration of Al in the first stage was 4 ppm, which allowed the early identification of genotypes with less affected development under Al toxicity in the second stage. The common bean cultivars IPR Quero-Quero (carioca group), BRS Esplendor (black group), KID 44 (red group), and WLine 5 (white group) may be indicated for cultivation under Al toxicity.

1. Introduction

Common bean (Phaseolus vulgaris L.) is considered one of the most important legumes for direct human consumption, especially in developing regions such as Central and South America and Southwest Africa. In the countries of these regions, common bean is the main source of protein, vitamins, and minerals [1,2]. In the international scenario, Brazil holds the position of the world’s largest common bean producer, growing the crop on 3.18 million hectares, with a mean annual yield of 1069 kg ha1 [3]. The country is also one of the largest consumers of the legume, consumed routinely by about 72% of the population [4].
In Brazil, common bean is cultivated year-round in a wide diversity of ecosystems. Consequently, several adverse environmental conditions interfere in the cultivation of the crop. Aluminum (Al) toxicity is one of the most limiting factors to plant development, especially in acid soils [5]. Approximately one-third of the common bean-producing areas in Brazil are located in regions with sandy soil, low fertility, and high acidity and Al concentration, negatively affecting the plant development and causing yield losses [6,7,8,9].
The use of lime and gypsum to neutralize Al is a common practice [10]. However, since the correctives are incorporated only into a thin surface layer, Al remains soluble in the subsoil. This restricts the root system to the surface layer, which can cause difficulties in water uptake from deeper layers, making the plants more drought-susceptible [11].
The existence of genetic variability for response to Al toxicity in common bean has motivated researchers to identify better-adapted genotypes and develop cultivars with desirable agronomic characteristics under this stress condition, which is contributing efficiently to increase the yield and improve yield stability [12,13]. Therefore, the development of tolerant cultivars represents a sustainable and economical solution, which can provide yield gains in Al-contaminated soils.
For the development of tolerant cultivars, genotypes with favorable characteristics for cultivation under Al stress must be identified. Considering that Al directly affects the root system, the hydroponic cultivation is advantageous for interaction studies of this element with plants, since it enables free access to the root system and the possibility of monitoring and controlling pH, Al concentrations and other ions that are relevant for the expression of sensitivity or tolerance responses [14,15]. To this end, the Al concentrations in nutrient solution at which the genotypes can be efficiently discriminated must be determined.
With a view to the need of establishing methods for the identification of Al-tolerant common bean genotypes, this study tries to define the optimal Al concentration for an early and efficient screening of genotypes in hydroponic cultivation and also identify cultivars and lines that can be used in breeding programs for Al tolerance.

2. Material and Methods

The study was methodologically divided into two stages. In the first, an experiment was carried out to determine optimized Al concentration in nutrient solution for common bean genotype discrimination. In the second, the concentration determined in the previous stage was used to screen the tested genotypes. All tests were carried out in a greenhouse of the Agronomic Institute of Paraná (IAPAR), at Londrina city, Paraná, Brazil, (23°21′22.99″ S, 51°9′48.01″ W; 570 m above sea level).

2.1. Stage 1: Determination of the Optimized Al Concentration

The experiment was carried out between May and August 2016, at a mean temperature of 17.5 ± 5 °C and relative air humidity of 71.3%. The experiments were arranged in a randomized block design with four replications and the treatments arranged in a 4 × 5 factorial scheme, with four genotypes (BRS Realce, IAC Formoso, IPR Curió and IPR Garça) (Table 1) and five Al concentrations (0, 2.5; 5, 7.5, and 10 parts per million—ppm).
The cultivars were sown in 128-cell plug trays filled with substrate and in growth stage V2, upon the opening of the primary leaves (±seven days after sowing), healthy seedlings were transplanted to 3.35 L pots containing Hoagland–Arnon nutrient solution [16], modified by Pavan and Bingham [17]. Each experimental plot consisted of one pot with one plant. The amount of each nutrient (in ppm) in the final solution was N (111); P (3.1); K (23.36); Ca (20.04); Mg (4.86); S (67.41); B (0.5); Zn (0.1); Fe (5.0); Mo (0.05); Mn (0.5) and Cl (0.65). Aluminum chloride hexahydrate (AlCl3.6H2O) was used as an aluminum source. The pH of the solution was maintained at 4.0 ± 0.1, with the addition of 1 N HCl or NaOH, and the initial electrical conductivity was 0.3 dS cm2. The nutrient solution was continuously aerated and exchanged whenever the electrical conductivity dropped to 40% of the initial value.
The plants were evaluated at the stage of physiological maturity (R8) for the following variables:
Plant height (PH) and root length (RL): with a centimeter graded ruler, the plant height was measured from the root collar to the tip of the main stem and the root length from the first roots on the stem to the tip of the largest root.
Root volume (RV): the root was inserted in a measuring cylinder, and the volume (in mL) calculated based on the displacement of the water column measured.
Shoot (SD) and root dry weight (RD): shoots and roots were wrapped in paper bags, oven-dried for 72 h at 65 °C and then weighed on an analytical balance.
Yield components: number of pods per plant (PN), number of grains per plant (GN), grain weight per plant (GW), 100-grain weight (W100) and harvest index (HI) latter computed by the equation:
HI   =   GW ( SD + RD )
The data were subjected to the Bartllet homogeneity analysis of error variances and Lilliefors error normality. A two-way analysis of variance was performed, with Scott–Knott’s mean clustering test (p < 0.05) for comparison of cultivars within each Al concentration and regression analysis for Al concentrations (p < 0.05). These analyses were performed using the software Sisvar [18]. Pearson’s correlation analysis (p < 0.01) was also performed with software R [19], package ‘corrplot’ [20].

2.2. Stage 2: Screening of Mesoamerican and Andean Genotypes

Four independent trials were carried out, two with Mesoamerican common bean genotypes (market classes carioca and black) and two of Andean origin (red and white market classes), each with seven genotypes. The experiments lasted from April to October 2017, when the mean temperature was 19.9 ± 4 °C) and relative air humidity 69.4%. The evaluated genotypes are described in Table 2.
The experiments were arranged in a randomized block design with eight replications and the treatments arranged in a 2 × 7 factorial scheme, testing the combinations of seven genotypes and two concentrations of Al (0 and 4 ppm), in the form of aluminum chloride hexahydrate (AlCl3.6H2O). Each experimental plot consisted of one pot with one plant.
The genotypes were sown in 128-cell plug trays containing substrate and at growth stage V2, upon the opening of the primary leaves (± seven days after sowing). Uniform seedlings were transplanted into 3.35 L plastic pots, leaving one plant per pot (experimental unit). The pH of the solution was maintained at 4.0 ± 0.1 by adding 1 N HCl or NaOH, and the initial electrical conductivity was 0.3 dS cm2. The composition of the nutrient solution was the same as described in item 2.1, i.e., it was not exchanged during the plant cultivation period. The solution was permanently aerated and the solution level maintained constant at 3.35 L per pot by adding distilled water at pH 4.
At the beginning of growth stage V4, when the third trifoliolate leaf is formed (±20 days after transplanting), root and shoot samples were collected and the following variables were measured: maximum root length (RL), root volume (RV) and root dry weight (RD), by the same methodologies as described in Section 2.1. The reduction rate (RR) was also calculated for the three variables, according to the equation [21,22]:
RR ( % )   =   ( 0   ppm 4   ppm 0   ppm ) ×   100
where 0 ppm corresponds to the value of the variable of plants grown in AL-free solution (control) and 4 ppm corresponds to the value of the variable of plants grown in the presence of 4 ppm aluminum.
The data of the four trials were subjected separately to the Bartllet homogeneity analysis of error variances and Lilliefors error normality. A two-way analysis of variance was performed, with the F test (p < 0.05) for comparison of the effects of Al concentrations within each cultivar and Scott–Knott’s mean clustering test (p < 0.05) for comparison of cultivars as affected by each Al concentration. These analyses were performed using software Sisvar [18]. With the mean data of the four trials, principal component analysis was performed using R software [19], package ‘factoextra’ [23].

3. Results

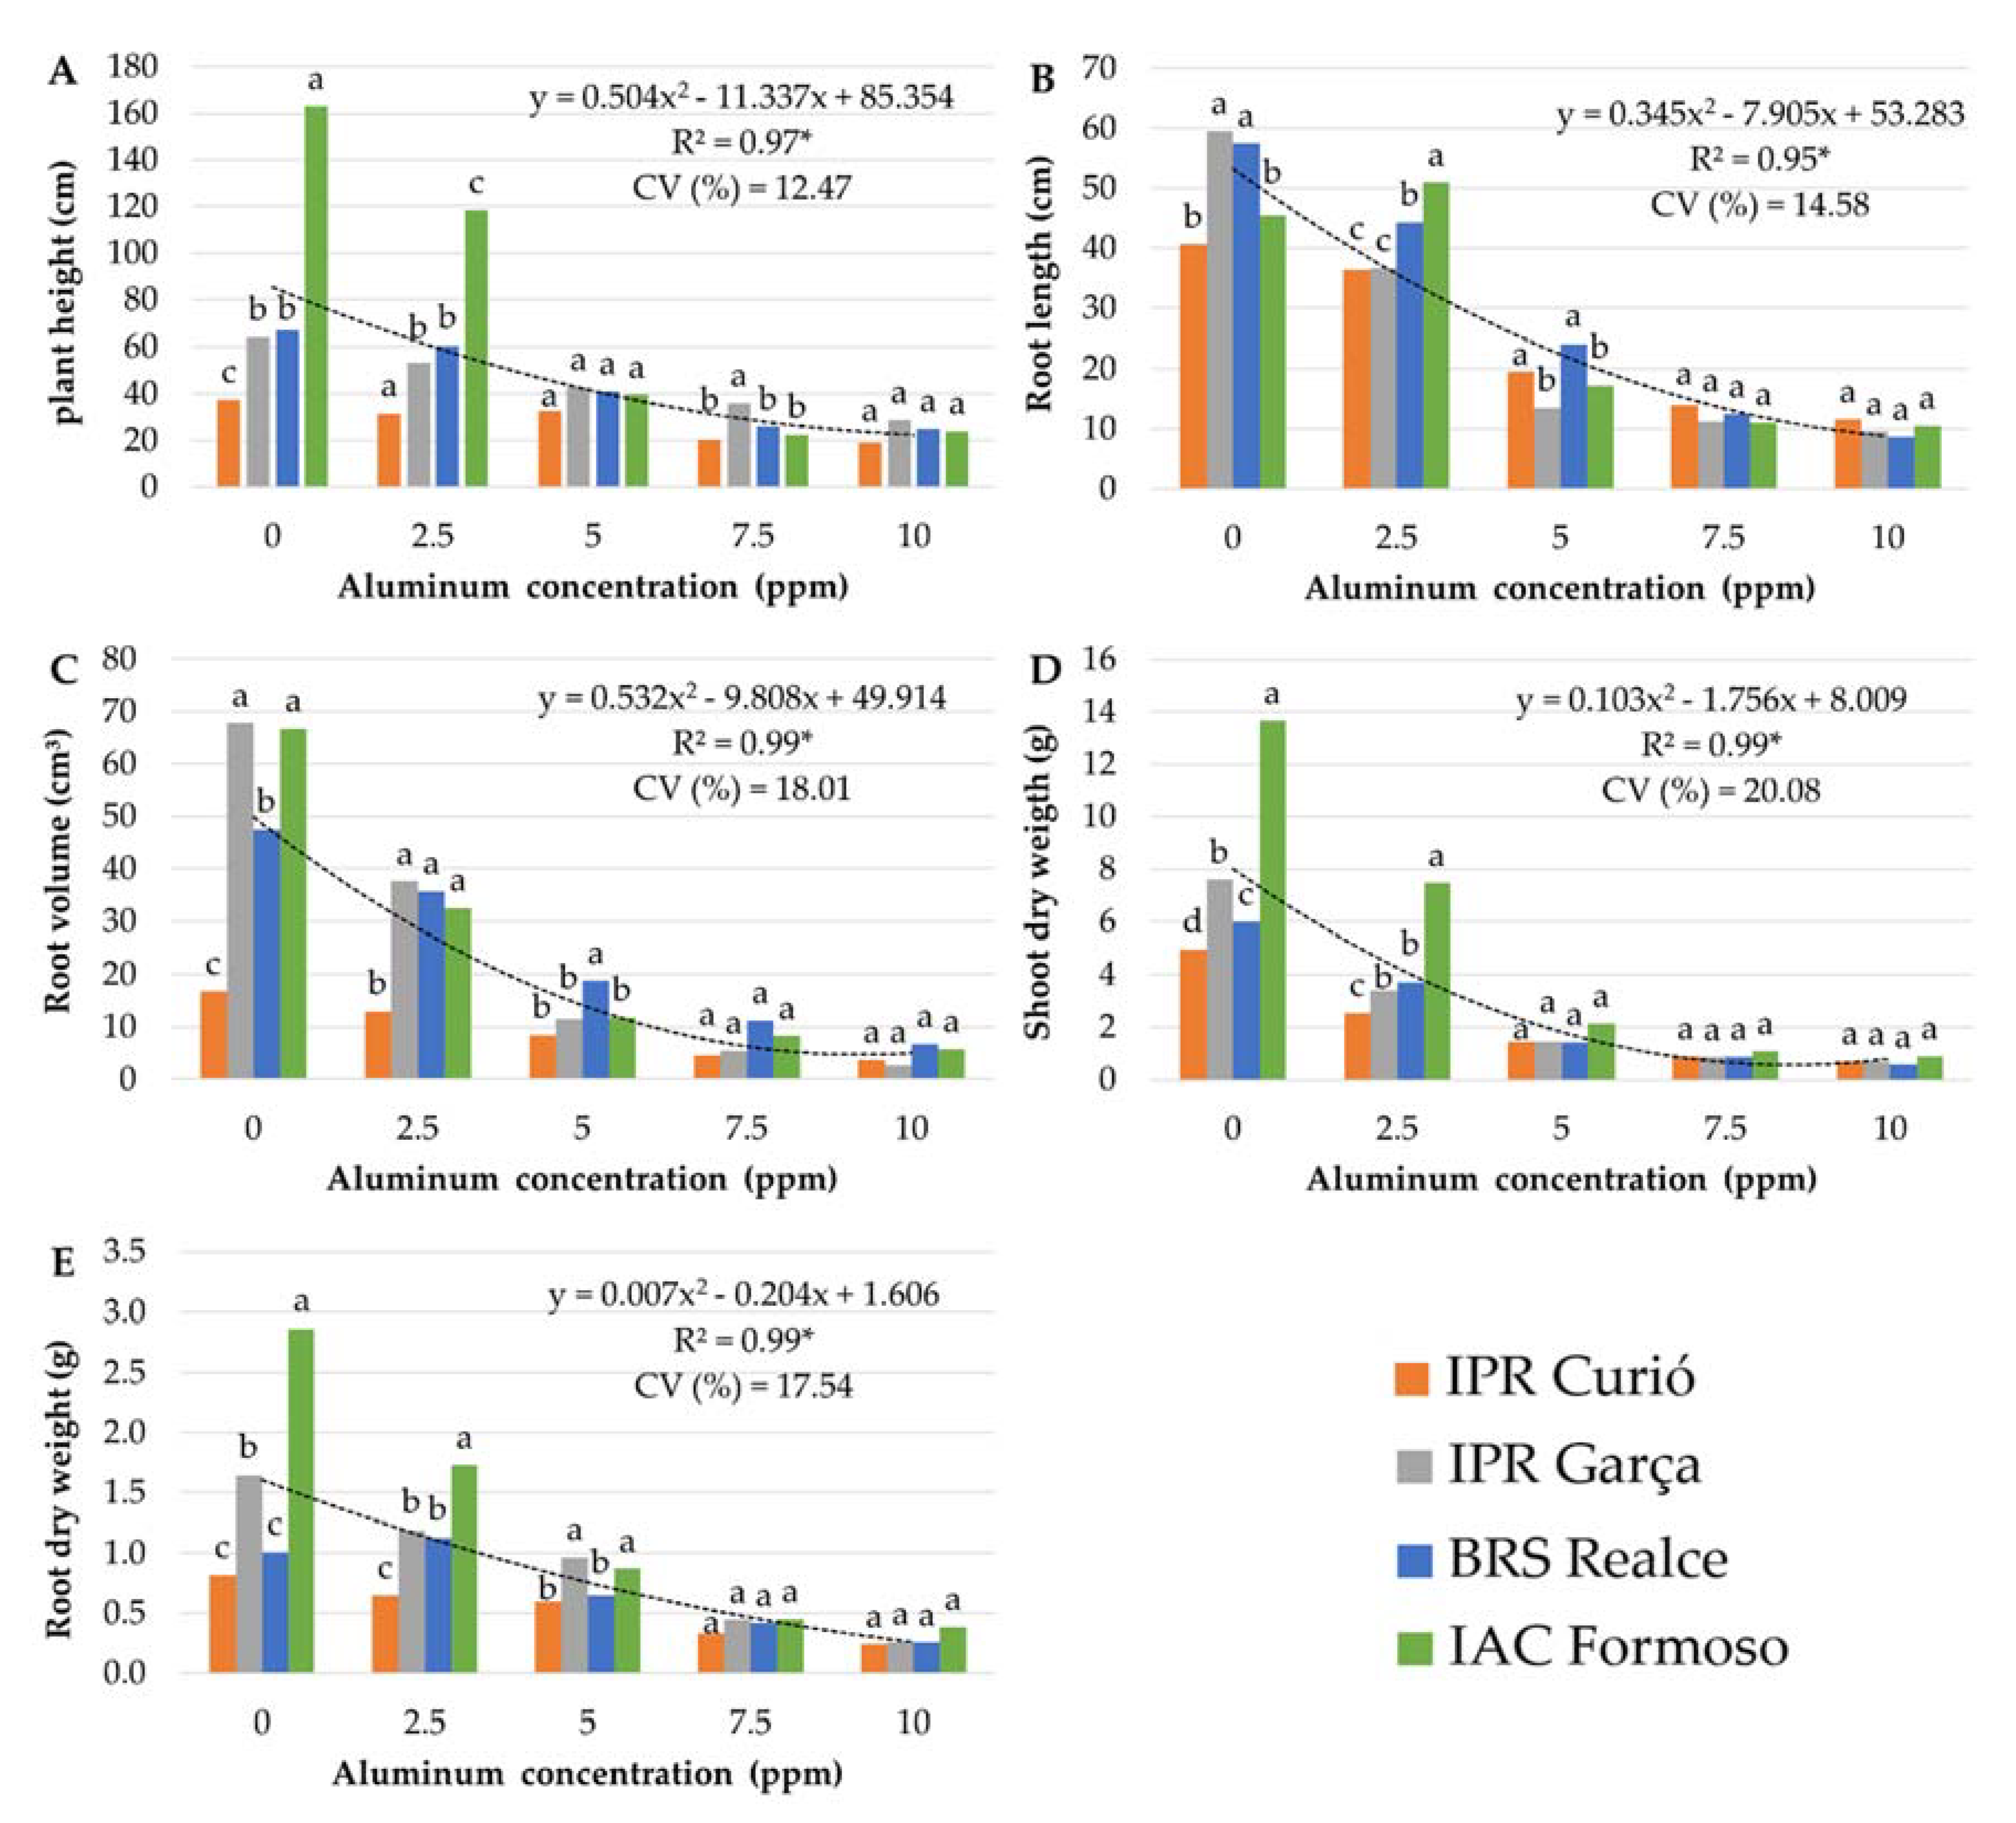
3.1. Stage 1: Determination of the Optimized Al Concentration

Analysis of variance showed a significant effect of the Al × genotype interaction for all analyzed variables, demonstrating that the genotypes responded differently to Al concentrations in solution. Analyzing the morphological variables, the difference between the cultivars was greater when grown in Al-free solution, while under increasing Al concentrations, the differential response was lower (Figure 1). For the variables PH and SD, there was practically no differences between the genotypes at a concentration of ≥5 ppm (Figure 1A,D) and for RL, RV, and RD at ≥7.5 ppm (Figure 1B,C,E).
Regression analysis showed that increasing Al concentrations decreased the response in the variables, with a quadratic polynomial fit (Figure 1). Based on the regression equation, the minimum response points for the variables RV and SD were 9.22 and 8.52 ppm Al (Figure 1C,D). For the variables PH, RL and RD, the minimum point was outside the studied concentration range (Figure 1A,B,E).
Figure 2 shows the results of the yield-related variables. For PN, GN, and GW, there was practically no difference between the cultivars at an Al concentration of ≥5 ppm (Figure 2A–C). For W100, the difference between the genotypes in the absence of Al was maintained up to an Al concentration of 10 ppm (Figure 2D), evidencing that this characteristic is little influenced by Al stress. For HI, only the highest Al concentrations were able to alter the response of the cultivars (Figure 2E).
The response of all yield-related variables tended to decrease at increasing Al concentrations, especially of PN, GN, and GW, which had a quadratic polynomial fit with minimum response points of 8.81, 9.41, and 8.76 ppm Al, respectively (Figure 2). For W100 and HI, the adjustment was linear, and it was not possible to establish a minimum point within the range studied.
The correlation between the studied variables showed that most of the variables were negatively correlated with the Al concentrations factor so that the response of the variables decrease with increasing Al concentrations in the solution (Figure 3). The correlation of W100 and PH with the Al concentrations was lower, and HI was also weakly correlated with the other variables, whereas the variable RL was most closely correlated with the Al factor.
Based on the analyzed variables, it can be inferred that the tested Al concentrations were enough to interfere negatively with plant development and that at ≥5 ppm Al, the differentiation of common bean genotypes was less clear. Root length was most closely correlated with the Al concentrations factor, as well as with the yield-related variables, which shows that this variable can be used for the early screening in common bean genotypes stressed by Al in nutrient solution. Based on the results of stage 1, the concentration of 4 ppm Al was determined for the screening stage of cultivars, and bean lines and the root-related traits (RL, RV, and RD) were chosen as response variables.

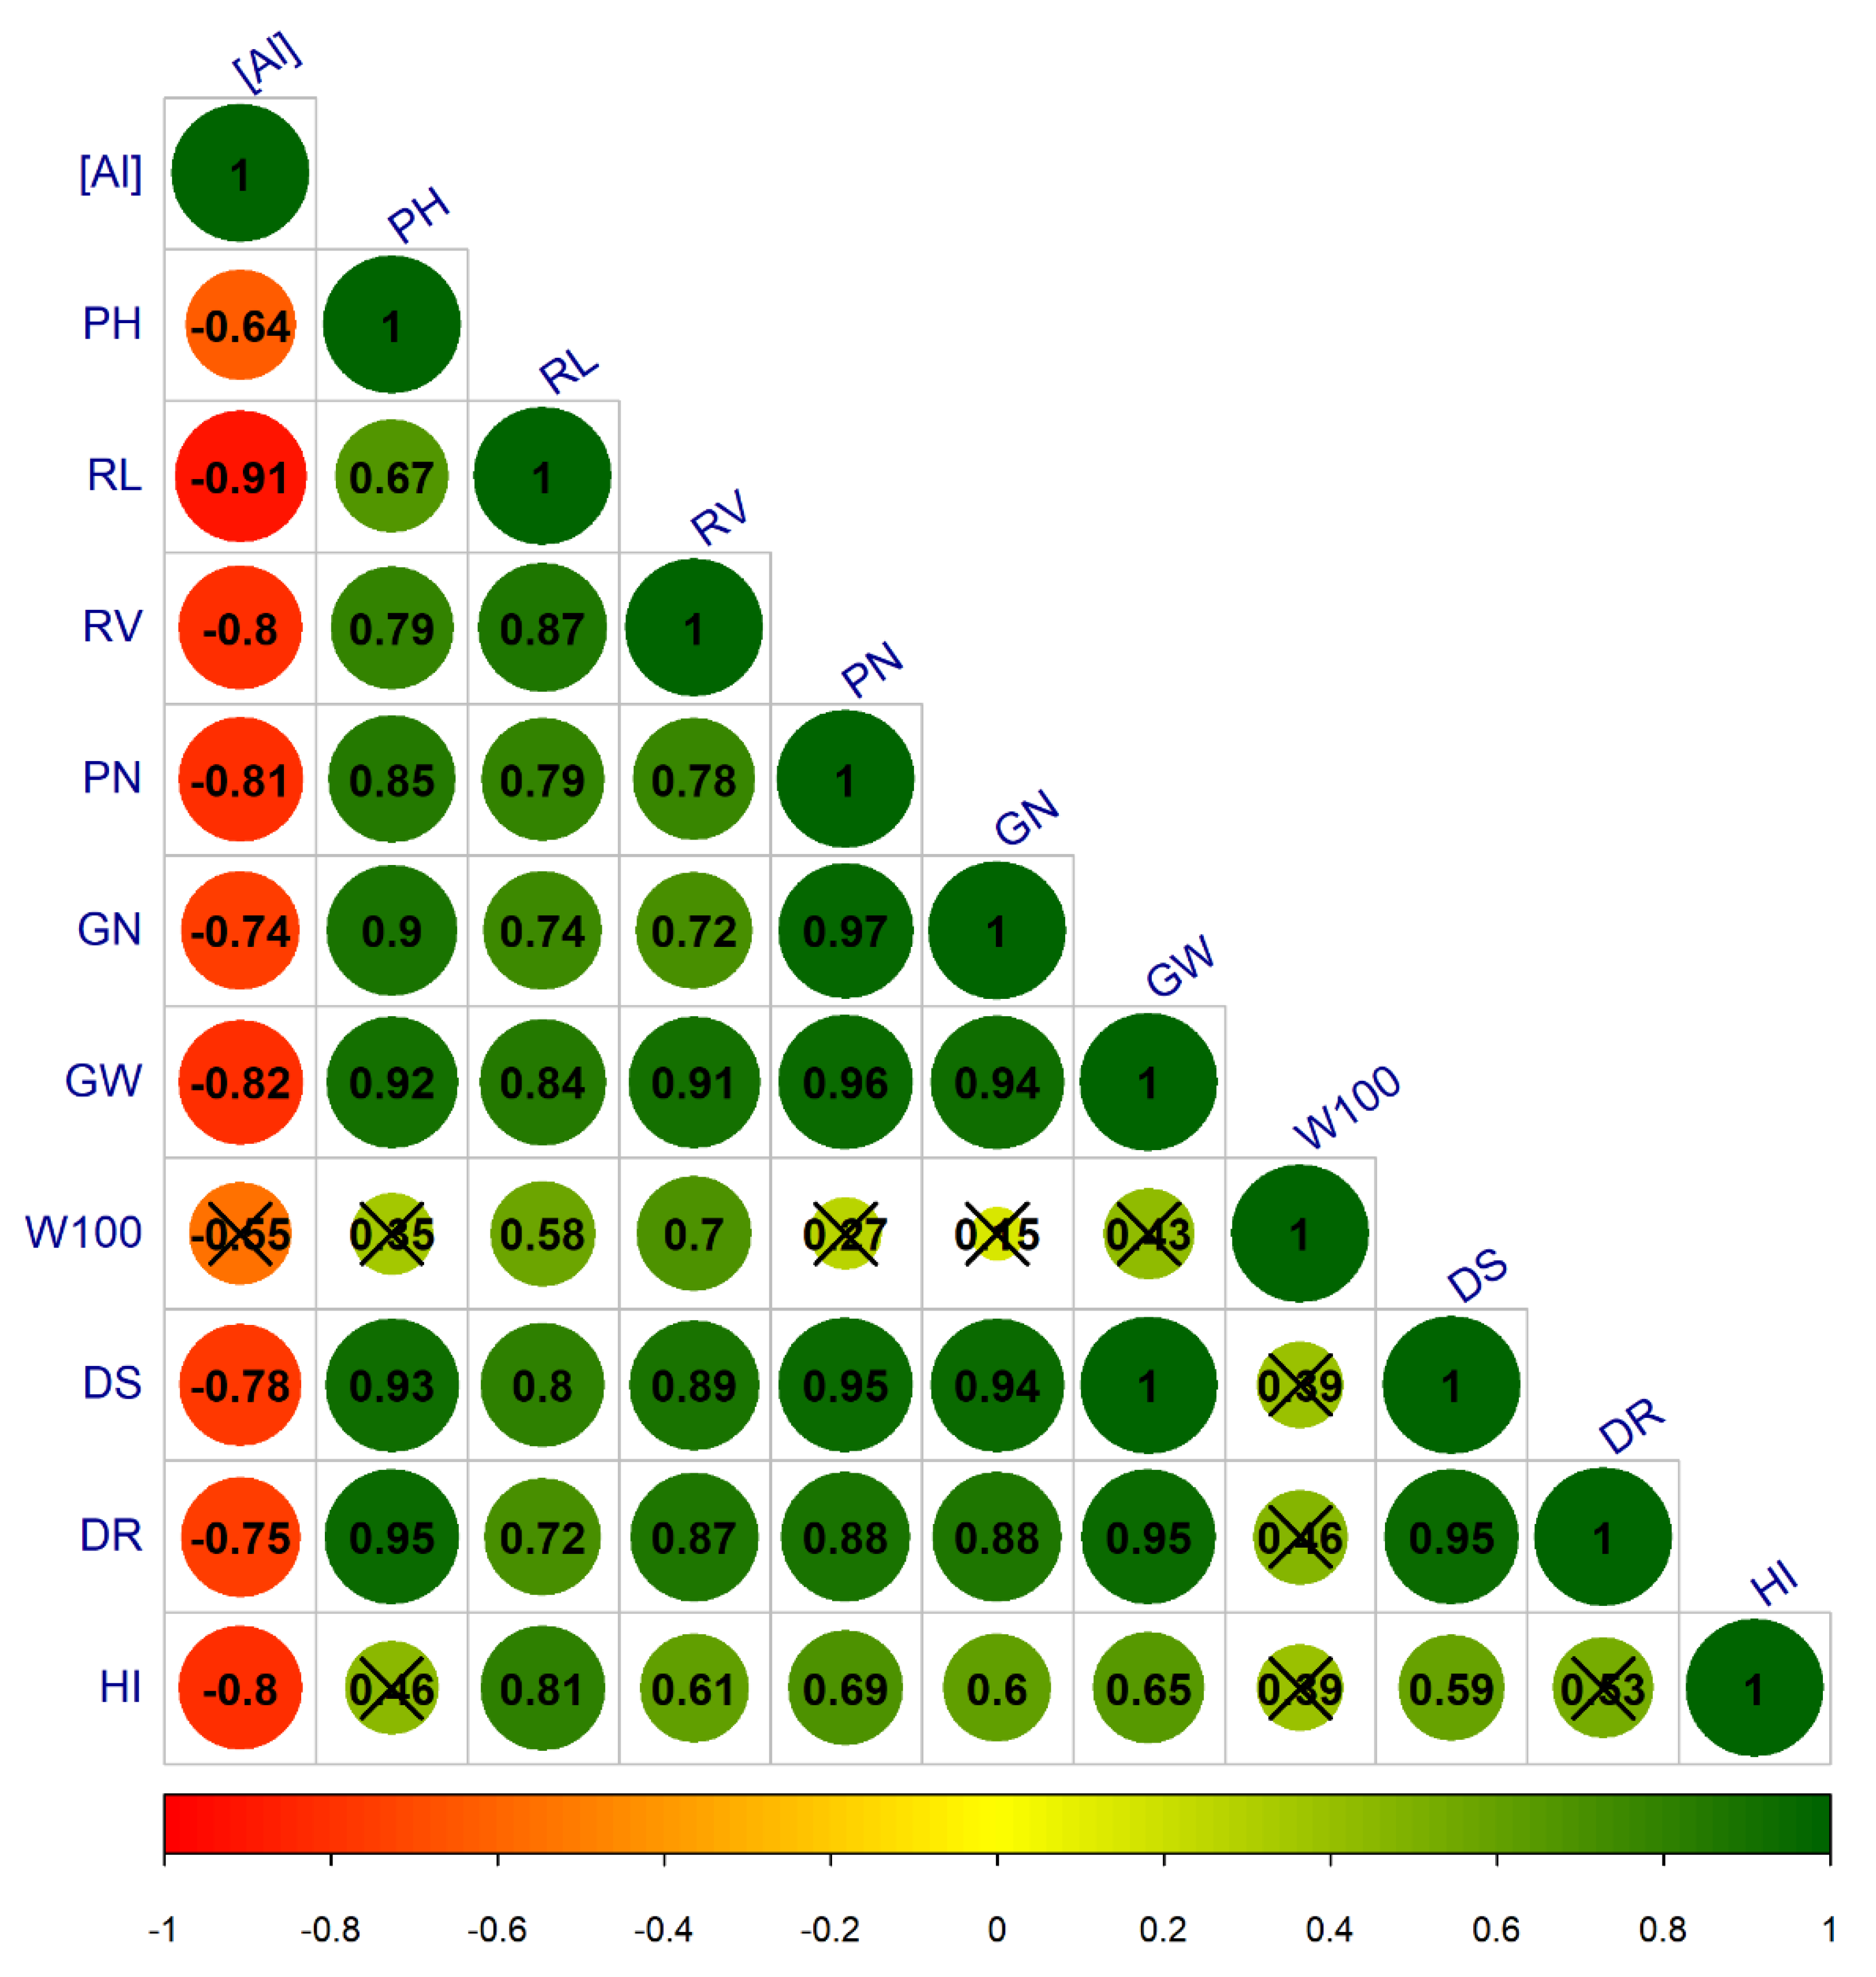
3.2. Stage 2: Genotype Screening

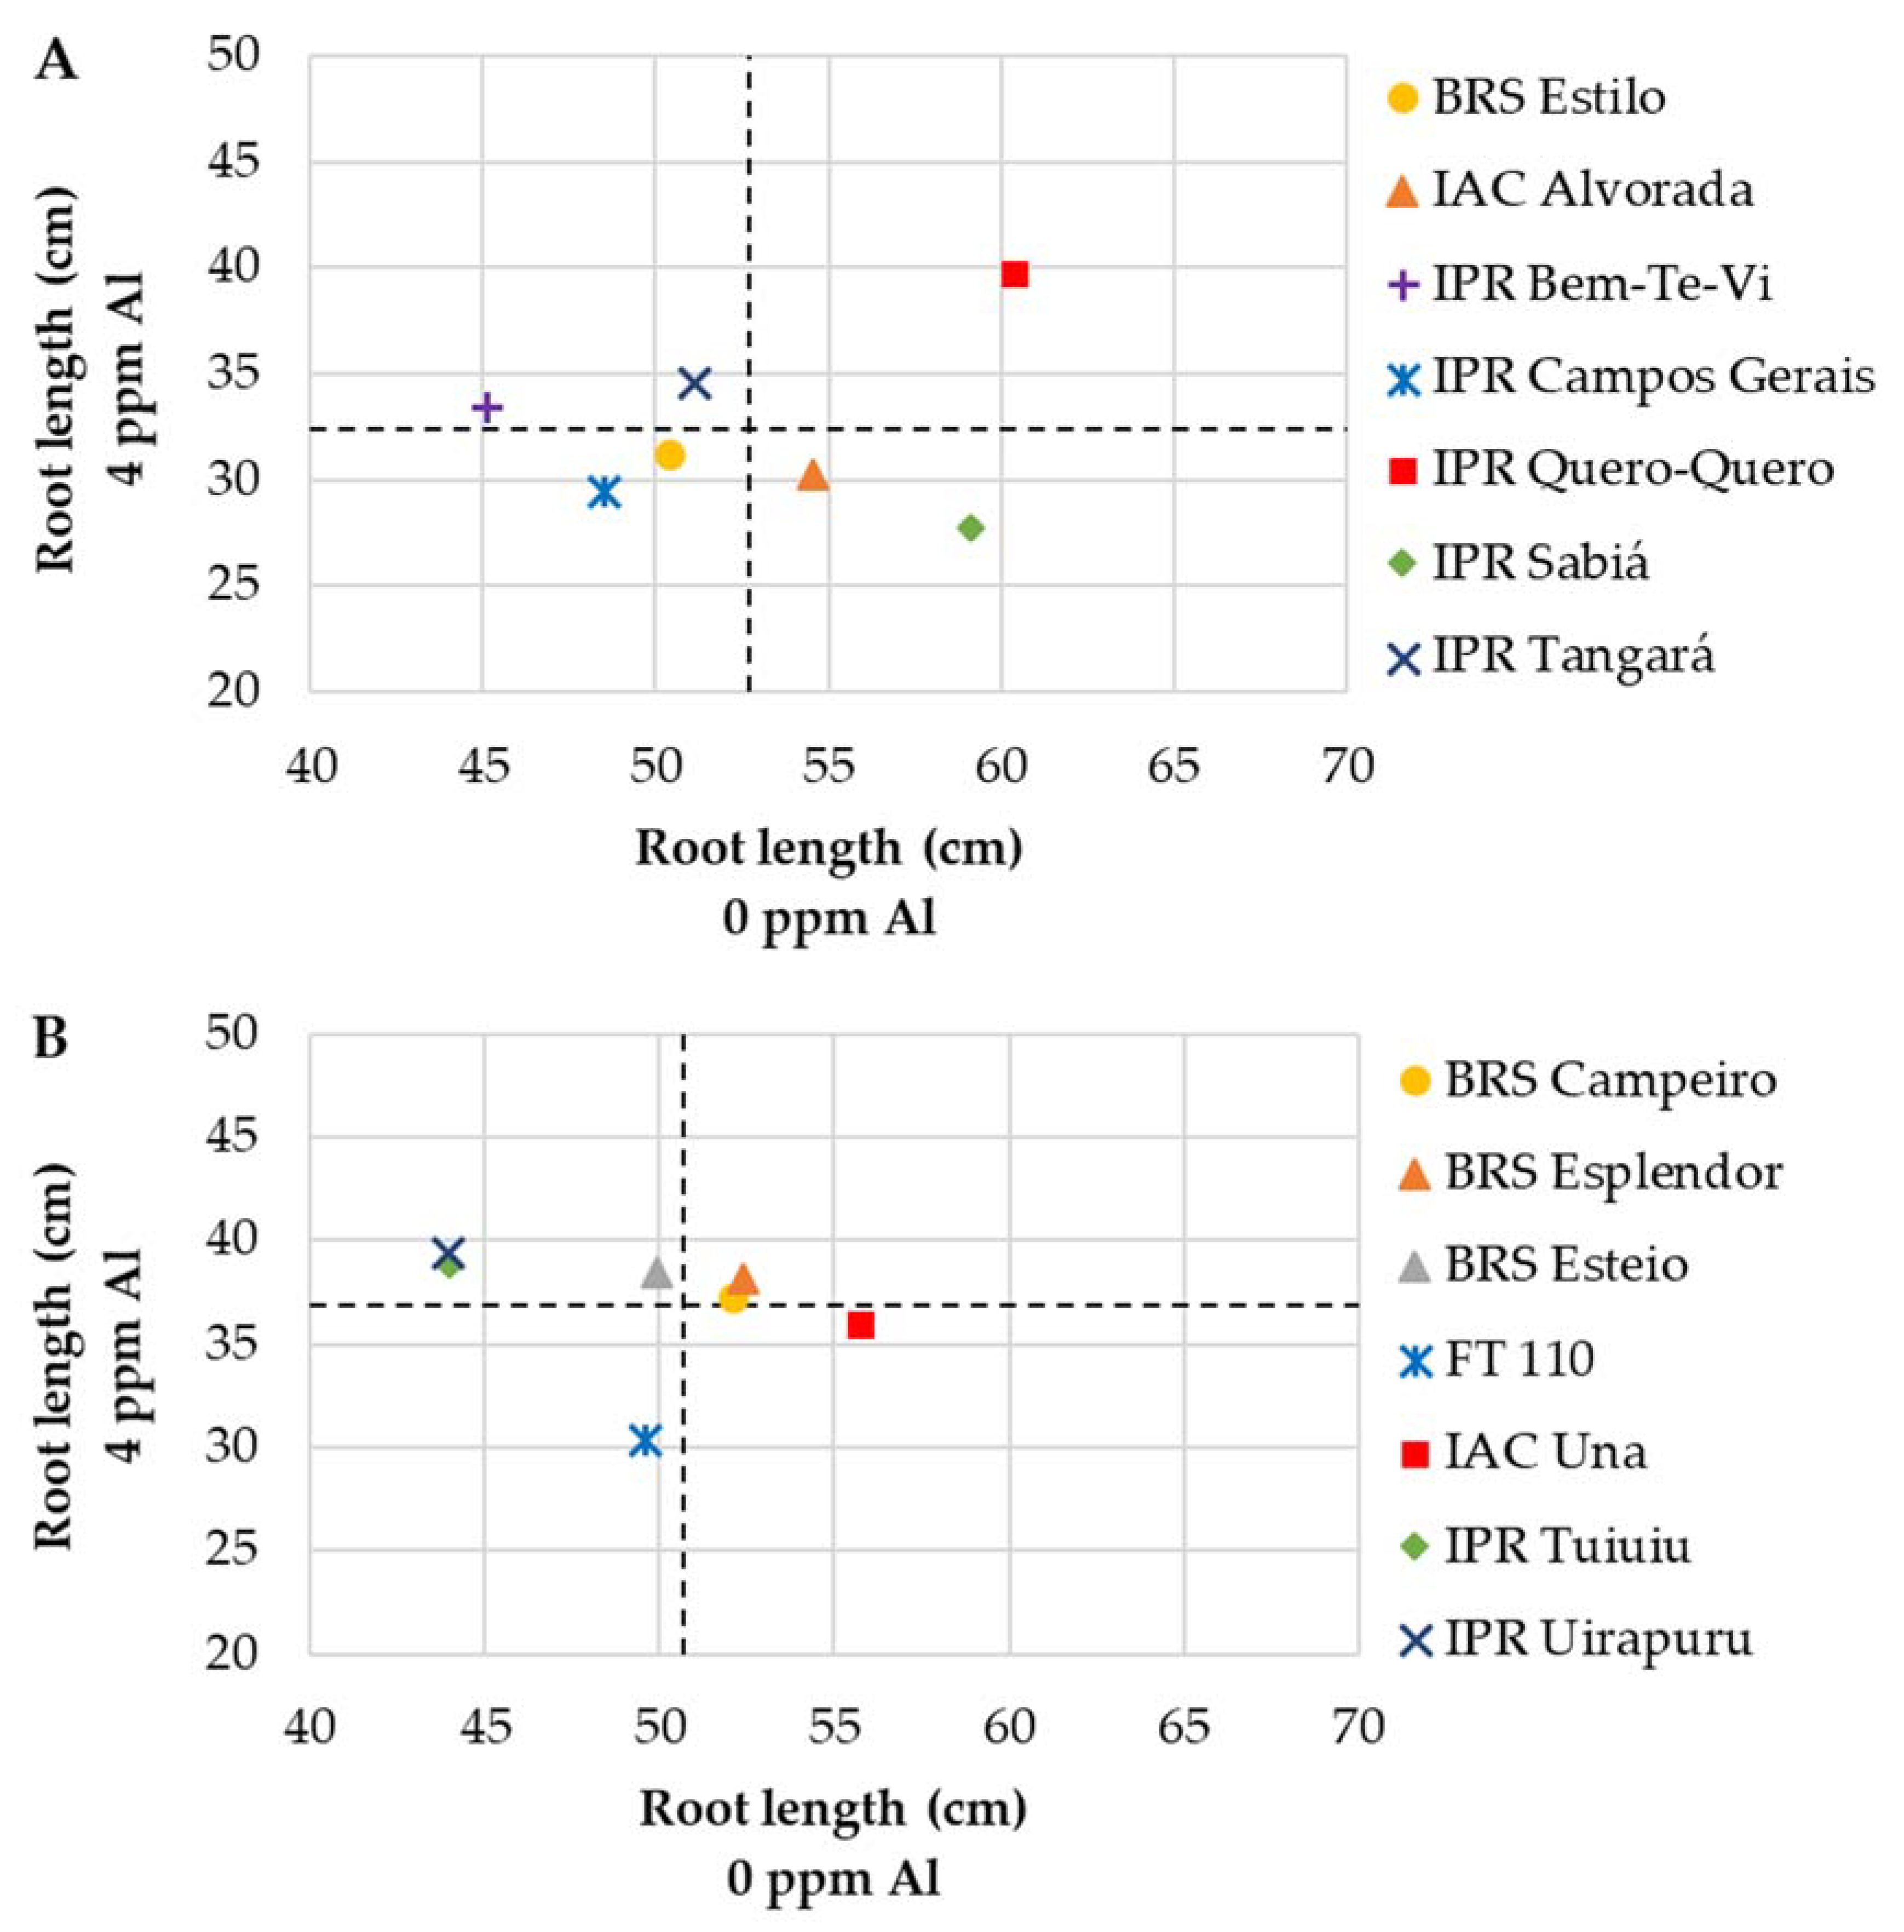
3.2.1. Mesoamerican Genotypes

The variable RL was most strongly influenced by the Al presence so that all cultivars in the market class carioca were significantly affected when subjected to a concentration of 4 ppm Al. In the market class black, the root length of all cultivars except for IPR Tuiuiú was significantly reduced (Table 3). For RV and RD, the effect of Al presence was less pronounced, with lower reduction indices, which can be explained by the fact that, despite the reduced root length, the roots were thicker, thus compensating for the lost volume and dry matter under stress conditions.
In the presence of 4 ppm Al, the best-performing cultivar of the market class carioca was IPR Quero-Quero, the only one in the group with the highest mean for all three root-related variables. For the black market class, the cultivars with the best results were BRS Esplendor, IAC Una, and IPR Tuiuiú, which were grouped with higher means for RL, RV, and RD (Table 3).
The highest reduction (RR) indices were observed for variable RL, followed by RV and RD. In the carioca group, the RR for RL was 38%, while for the black group, it was 26.86%. The cultivars with the lowest RR for RL were IPR Bem-Te-Vi in the carioca group and IPR Tuiuiú in the black group. However, when grown in Al-free solution, both cultivars were classified in the group with the shortest RL (Table 3).
When analyzing only RL (Figure 4), the cultivar IPR Quero-Quero of the market class carioca was the only one with an above-average root length both under Al-stress (4 ppm) as well as in the absence of Al and was assigned to the ideal quadrant (Figure 4A). Of the black group, the cultivars BRS Esplendor and BRS Campeiro had above-mean values (Figure 4B).

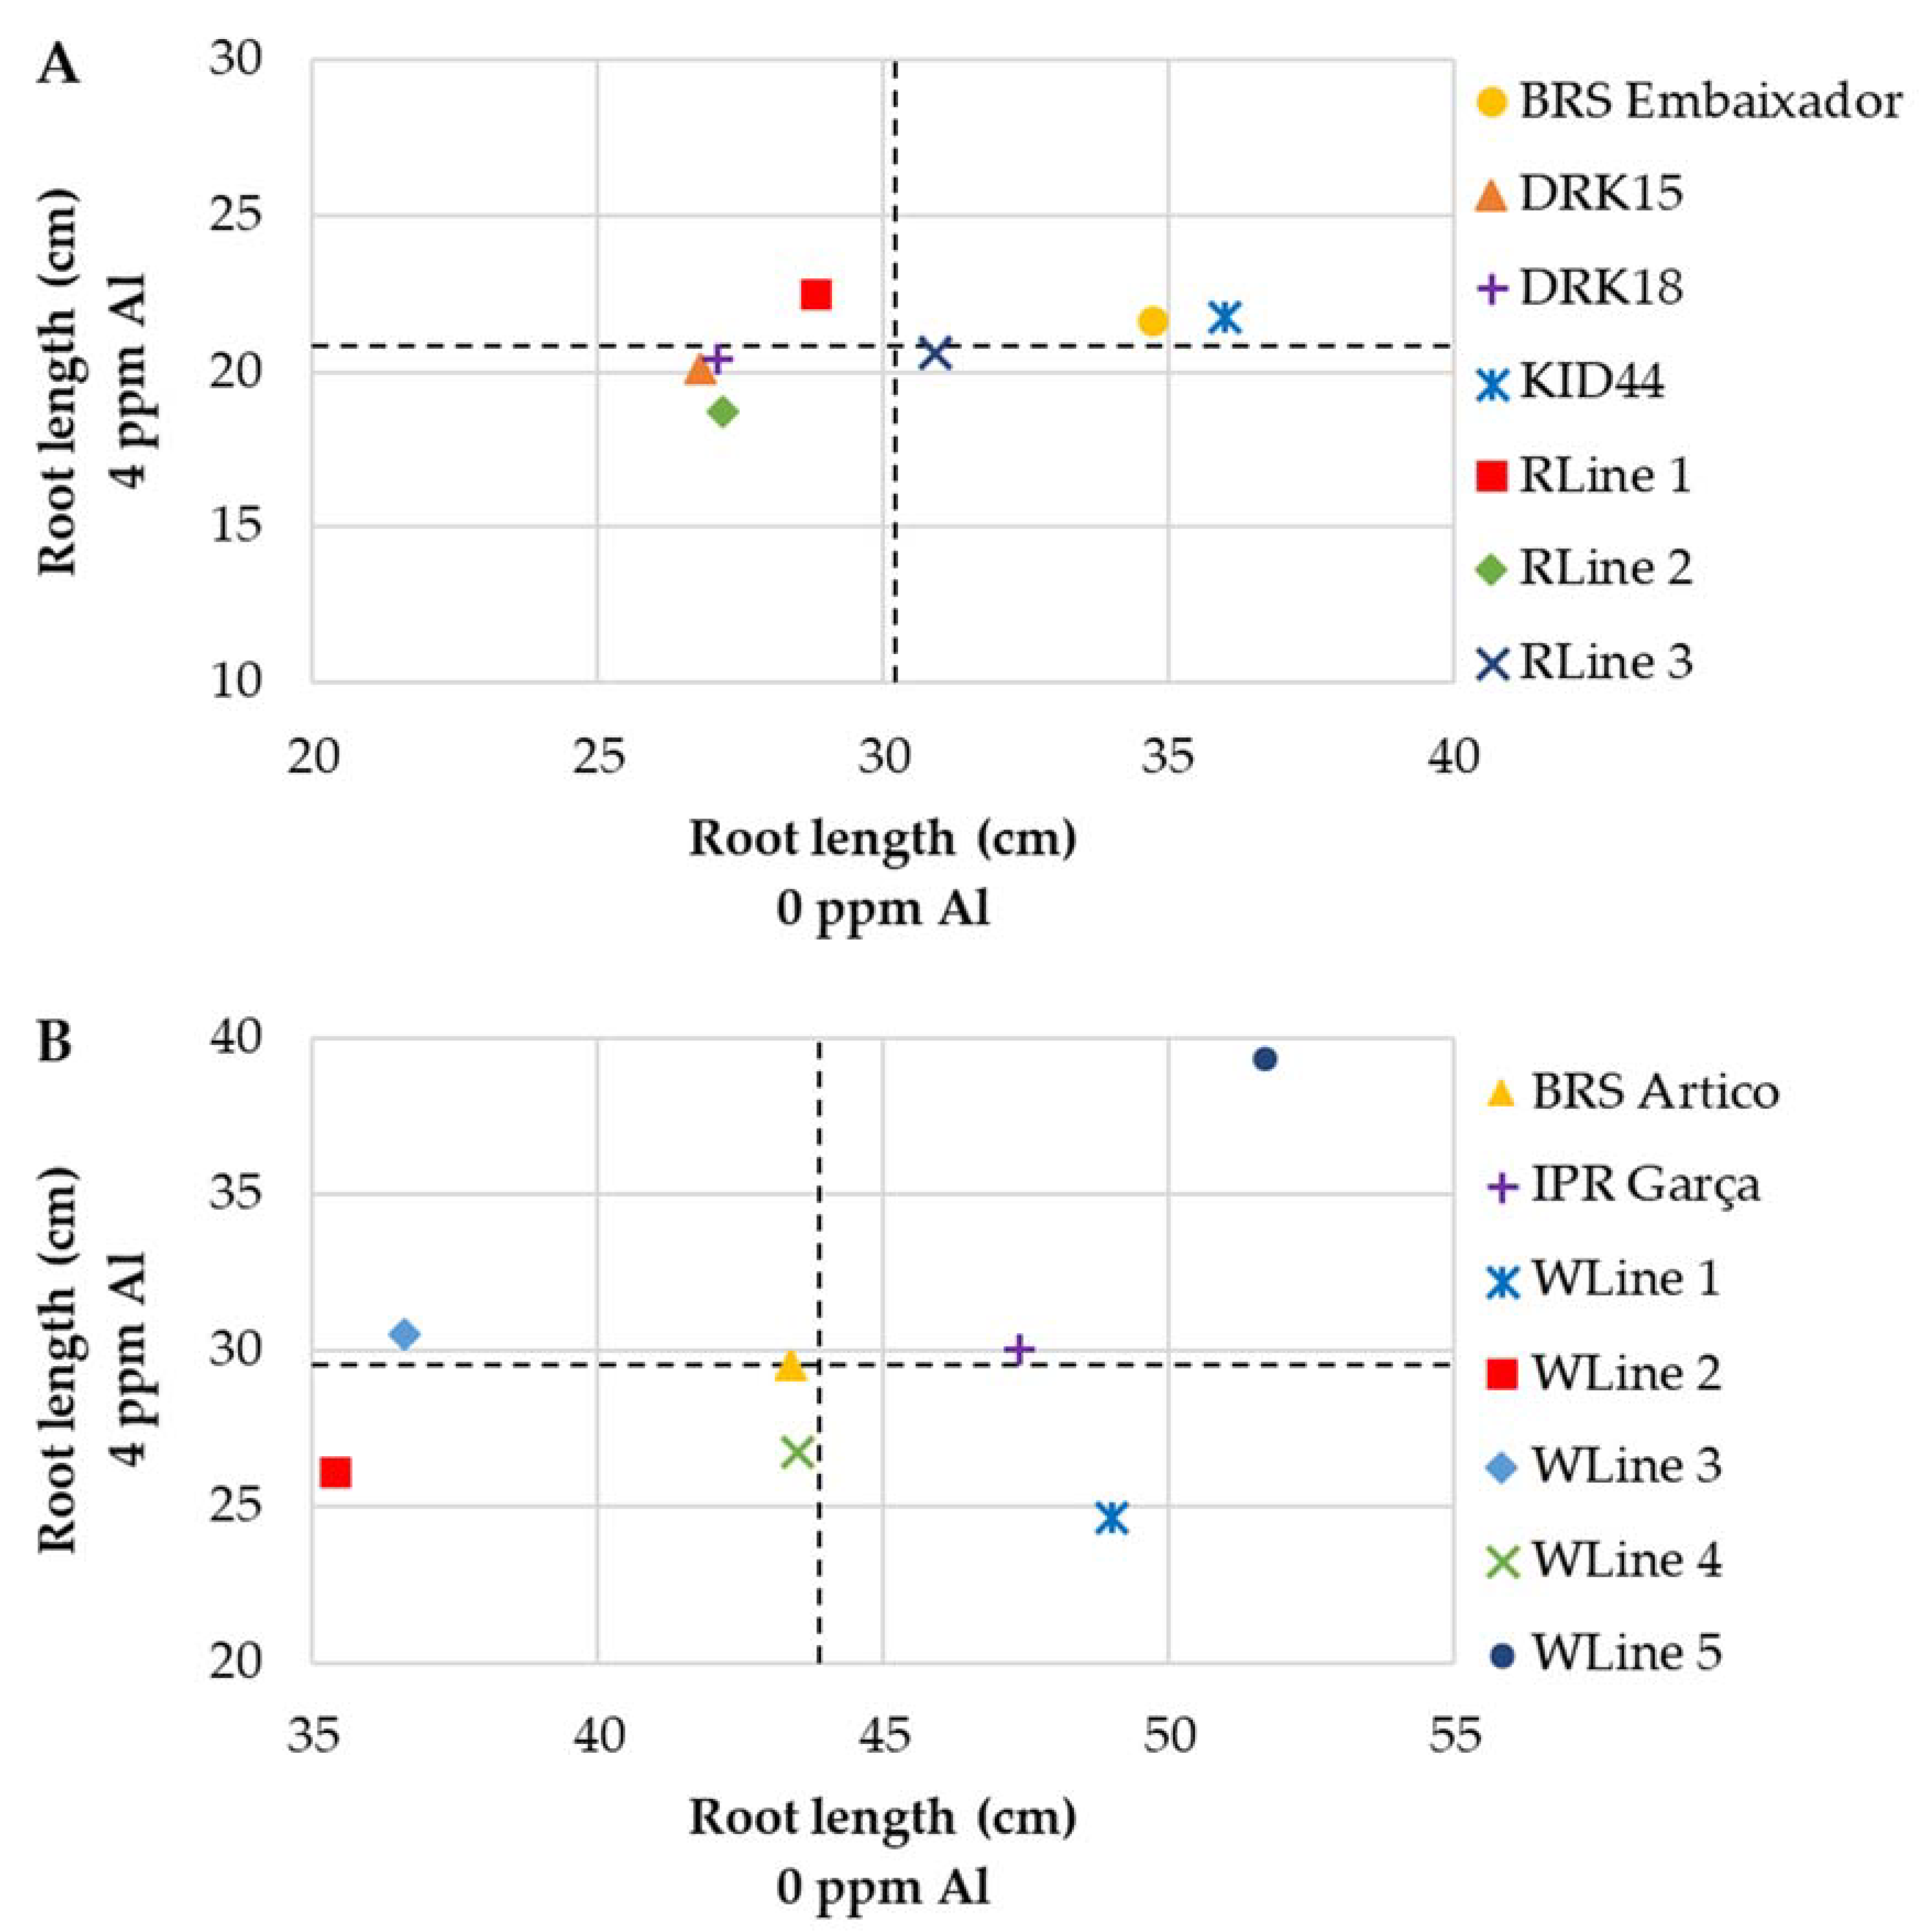
3.2.2. Andean Genotypes

As similarly observed earlier for the genotypes of Mesoamerican origin, the variable most influenced by Al in solution was RL, for both the red and white market classes (Table 4). The root length of all cultivars and lines of the red and white groups was significantly reduced when cultivated in Al-contaminated solution. For RV and RD, the difference between the condition without and with Al stress was less pronounced, so that no significant difference between the tested genotypes was observed for RD.
When subjected to 4 ppm Al, the best-performing genotypes of the red group were DRK18, KID44, and RLine 1, and line Wline5 of the white group, since they were classified in the group with highest mean in all three root variables (Table 4). For lines DRK18 and RLine 1 of the red group, the lowest reduction rates (RR) were observed for RL. However, when these lines were grown in an Al -free solution, their root length was also shorter, indicating that the lower RR was not associated with a higher tolerance of these lines.
For the lines WLine 1 and WLine 5 of the white group, the RR was the lowest for RL. However, WLine 1 also had the shortest RL when grown at 0 ppm Al, while WLine 5 had the longest RL in the absence and presence of AL. In a comparison of the RR for RL of both groups, they were similar (30.57% for the red and 32.14% for the white group).
Considering only RL (Figure 5), the cultivars BRS Embaixador and KID 44 of the red group were allocated in the ideal quadrant, with above-average values​​ in the presence and absence of Al (Figure 5A). The performance of the cultivars IPR Garça and WLine 5 of the white group was above-average when cultivated at 0 and 4 ppm Al (Figure 5B).
Analyzing Table 4 and Figure 5, the lines KID44 of the red and WLine 5 of the white group performed better under Al stress.

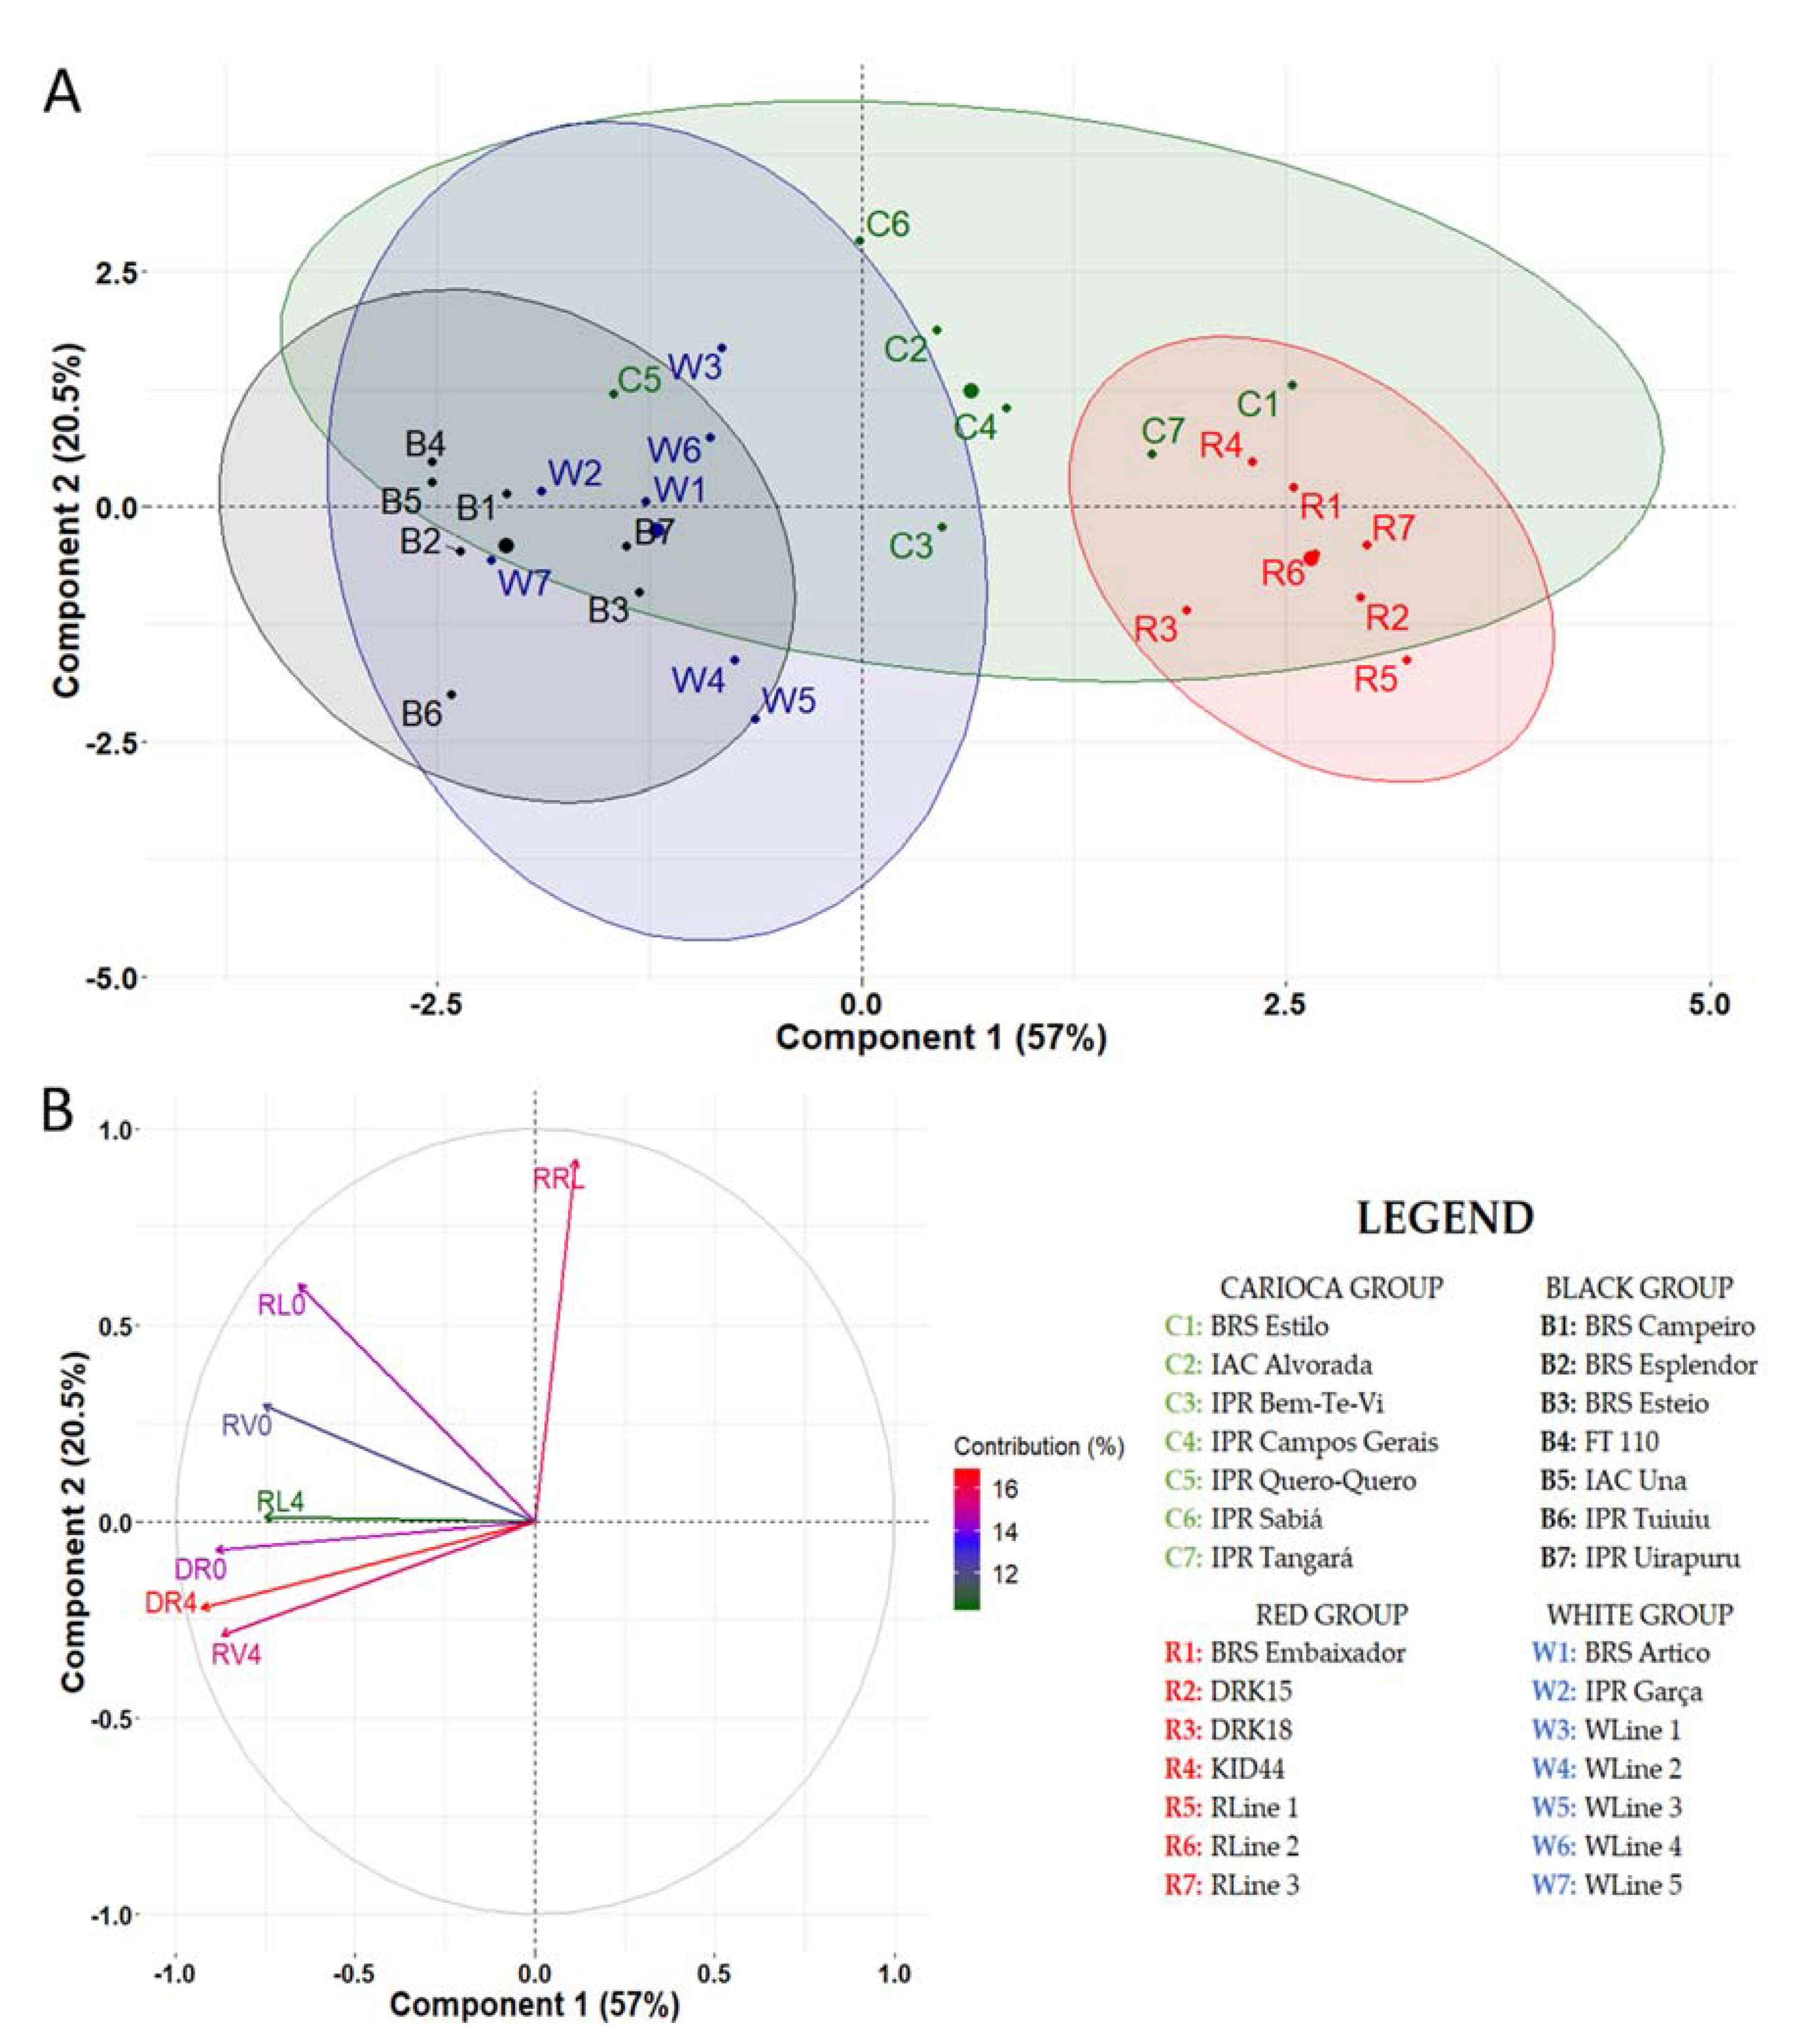
3.2.3. Mesoamerican × Andean Genotypes

The principal component analysis (PCA), including all genotypes, showed that the first two components explained 77.5% of the variation (Figure 6). In Component 1, the variables that contributed most to explain the formation were RD at 4ppm, RD at 0ppm, and RV at 4ppm, while for the Component 2, the variables that contributed most were the reduction rate for RL and RL at 0 ppm (Figure 6B). The PCA showed that the black group was less sensitive to Al toxicity, while the red group was the most sensitive and the Carioca group had the highest variability in Al-stress response (Figure 6A).

4. Discussion

The presence of Al in acid soils is considered one of the main problems for the cultivation of agricultural species. It is estimated that approximately 50% of the areas with agricultural potential in the world have problems with Al, causing productivity losses of 25% to 80% depending on the species and levels of Al [24]. In Brazil, the soils of more than 200 million hectares of arable land are acidic and contain Al [25], and common bean (P. vulgaris) is highly sensitive to the toxicity of this element. Moreover, as an additional challenge, nitrogen-fixing bacteria-legume plants are also sensitive to Al and soil acidity [26].
The common bean cultivars used in stage 1 have different growth habits, cycles, grain color, seed size and diversity centers, which are characteristics that represent great genetic variability [27]. In Al-free solution, the cultivars expressed this variability by means of distinct responses to the analyzed variables (Figure 1 and Figure 2). However, as the Al concentration in the nutrient solution increased, these differences were reduced to the point where it was impossible to differentiate the cultivars.
In a study on common bean responses to aluminum toxicity, Toth and Grusak [5] concluded that genotypes have the ability to respond differently to Al stress. However, for observations of this differential response, it is necessary to use adequate evaluation methods.
The results of this study (item 3.1) show that high Al concentrations, at ≥ 5 ppm, are not efficient in discriminating genotypes. According to Zeffa et al. [28], at a concentration of 10 ppm Al in nutrient solution, genotypes could not be differentiated by root length in stage V4. Higher Al concentrations were shown to be effective in discriminating bean genotypes when plant roots are exposed to toxicity for a short period of time, i.e., between 24 and 72 hours [15,29,30].
The establishment of Al concentration, as well as variables that allow the differentiation of cultivars and lines, is fundamental for the identification of promising genotypes for cultivation under Al toxicity. According to Blair, López-Marín, and Rao [12], root-related variables such as root length, total root length and mean root diameter are useful variables in the selection of Al-tolerant genotypes. Root length was most closely correlated with Al concentrations in solution and also the variable that grouped the cultivars and lines tested most clearly in the second stage of the study (Table 3 and Table 4; Figure 3 and Figure 4).
According to Rangel, Rao, and Horst [31], the first response of common bean plants under Al toxicity is the inhibition of root growth, with Al accumulation in the root apex. Thus, tolerant genotypes may have a longer RL and less Al accumulation in the meristematic root regions. Considering the importance of root evaluation for the determination of Al-tolerant genotypes [29], the use of hydroponics is essential for accurate measurements of the root system [32,33].
As showed above, root-related characteristics are highly influenced by Al concentration demonstrating the potential to distinguish early bean genotypes in a hydroponic crop. Efficient methods for the identification of Al toxicity tolerant genotypes are very important in bean breeding programs since, in some steps, it is necessary to evaluate a large number of genotypes. These steps range from germplasm characterization to evaluation of promising breeding lines.
The reduction rate for the variables RV and RD was lower (%) and less capable of differentiating the genotypes than RL. Common bean plants exposed to Al toxicity tend to thicken the roots, resulting in a less altered root volume and dry root weight compared to Al-free cultivation [28].
The evaluation of the root system, mainly of RL, detected genotypes with a better development in the presence of Al toxicity. Considering the Mesoamerican diversity center, the cultivars IPR Quero-Quero (Carioca group) and BRS Esplendor (Black group), and for the Andean diversity center, the lines KID 44 (Red group) and WLine 5 (White group) may be indicated for cultivation under Al-toxicity conditions (Table 3 and Table 4, Figure 3 and Figure 4) and for future breeding programs focused on the development of new Al-tolerant cultivars.
Studies evaluating dozens of common bean genotypes from different regions and diversity centers in nutrient solution also reported a great variability in Al-toxicity responses, with the identification of Al-tolerant and -sensitive genotypes [5,12,13]. According to Blair, López-Marín, and Rao [12], genotypes from the Andean diversity center tend to be more tolerant to Al toxicity, contrary to the results of this study, which indicated that genotypes of the black group (Mesoamerican) were most Al-tolerant.
The inheritance of Al tolerance in common bean is quantitative [34], and the expression of phenotypic characteristics that may contribute to an improved development of a genotype under Al toxicity depends on the molecular responses, physiological, and biochemical mechanisms [33,35,36].
The two main mechanisms favoring plant development on soils with aluminum toxicity consist of exclusion (apoplastic mechanism) and tolerance (symplastic mechanism). The exclusion mechanism uses physical–chemical barriers to prevent aluminum from passing through the plasma membrane and entering the cells, while the tolerance mechanism immobilizes the element by exuding organic acids, in particular citrate, forming complexes with Al in the rhizosphere and decreasing the root–metal interaction [24,30,37,38].
Common beans exposed to Al toxicity increase the expression of citrate transporter gene family MATE (multidrug and toxin extrusion family protein), although citrate transporter expression is a prerequisite for citrate exudation, genotypic tolerant of aluminum in common bean depends on the ability to sustain citrate synthesis to maintain the cytosolic citrate reserve which allows exudation [39].
Considering that the market class carioca is the most widely produced and consumed in Brazil [40], grown on a cultivation area of 1.44 million hectares [3] and that a great part of these areas are acid and Al-contaminated soils, the cultivar IPR Quero-Quero, registered and protected by the Ministry of Agriculture—MAPA, may be an option under Al toxicity conditions. However, genotypes that behaved as tolerant to aluminum in a hydroponic condition are not necessarily tolerant to Al toxicity, so phenotypic assessments are necessary for acid soil conditions with high Al saturation to prove tolerance [41].

5. Conclusions

Concentrations of >5 ppm Al in nutrient solution are not recommended for screening of common bean genotypes.
Root length is most closely correlated with increasing Al concentrations and is most adequate to differentiate genotypes.
An Al concentration of 4 ppm Al was effective in discriminating the tested cultivars and lines, allowing the early identification of genotypes with improved development under Al toxicity.
The common bean cultivars IPR Quero-Quero (Carioca group), BRS Esplendor (Black group), KID 44 (Red group), and WLine 5 (White group) can be grown under Al toxicity conditions or used in breeding programs for the development of new Al-tolerant cultivars.

Author Contributions

conceptualization, J.d.S.N. and V.M.-C.; methodology, J.d.S.N. and V.M.-C.; software, J.d.S.N., J.D. and L.S.A.G.; validation, J.d.S.N., J.D. and L.S.A.G.; formal analysis, J.d.S.N., T.W.S., A.A.H. and J.M.N.; investigation, J.d.S.N., T.W.S., A.A.H. and J.M.N.; resources, J.d.S.N. and V.M.-C.; data curation, J.d.S.N., J.D., T.W.S., A.A.H. and J.M.N.; writing—original draft preparation, J.d.S.N., J.D., T.W.S., A.A.H. and J.M.N.; writing—review and editing, J.d.S.N., J.D., L.S.A.G. and V.M.-C.; visualization, J.d.S.N., J.D. and L.S.A.G.; supervision, L.S.A.G. and V.M.-C.; project administration, J.d.S.N.; funding acquisition, V.M.-C. All authors have read and agreed to the published version of the manuscript.

Funding

This research received no external funding.

Acknowledgments

This research was supported by the Paraná State’s resource through the Instituto Agronômico do Paraná – IAPAR.

Conflicts of Interest

The authors declare no conflict of interest.

References

  1. Rezende, A.A.; Teresa, M.; Pacheco, B.; Sônia, V. Nutritional and protein quality of dry Brazilian beans (Phaseolus vulgaris L.). Food Sci. Technol. 2017, 2061, 1–7. [Google Scholar] [CrossRef] [Green Version]
  2. Campos-Vega, R.; Loarca-Piña, G.; Oomah, B.D. Minor components of pulses and their potential impact on human health. Food Res. Int. 2010, 43, 461–482. [Google Scholar] [CrossRef]
  3. CONAB, Companhia Nacional de Abastecimento. Acompanhamento da Safra Brasileira de Grãos. Available online: https://www.conab.gov.br/info-agro/safras (accessed on 16 June 2019).
  4. Souza, A.M.; Pereira, R.A.; Yokoo, E.M.; Levy, R.B.; Sichieri, R. Most consumed foods in Brazil: National dietary survey 2008–2009. Rev. Saude Publica 2013, 47, 190–199. [Google Scholar] [CrossRef] [PubMed]
  5. Tóth, B.; Grusak, M.A. Aluminum-toxicity responses in Phaseolus vulgaris L. genotypes. Columella 2017, 4, 95–100. [Google Scholar] [CrossRef]
  6. Broughton, W.J.; Hernández, G.; Blair, M.; Beebe, S.; Gepts, P.; Vanderleyden, J. Beans (Phaseolus spp.)—Model food legumes. Plant Soil 2003, 252, 55–128. [Google Scholar] [CrossRef] [Green Version]
  7. Giannakoula, A.; Moustakas, M.; Mylona, P.; Papadakis, I.; Yupsanis, T. Aluminum tolerance in maize is correlated with increased levels of mineral nutrients, carbohydrates and proline, and decreased levels of lipid peroxidation and Al accumulation. J. Plant Physiol. 2008, 165, 385–396. [Google Scholar] [CrossRef]
  8. Carvalho, M.D.C.S.; Nascente, A.S. Application of lime, phosphogypsum and fertilization rates affect soil fertility and common bean development in no-tillage system in a Cerrado Oxisol. Acta Sci. Agron. 2018, 40, 39322. [Google Scholar] [CrossRef]
  9. Freddi, O.S.; Tavanti, R.F.R.; Carvalho, M.P.; Montanari, R.; Andreotti, M. Restrictions of the Common Bean Productivity in Direct Seeding System in The Brazilian Cerrado. Nativa 2017, 5, 237–243. [Google Scholar] [CrossRef] [Green Version]
  10. Hartwig, I.; Bertan, I.; Maia, L.C.; Fonseca, D.A.R. Associated mechanisms of aluminum tolerance in plants. Semin. Ciências Agrárias 2007, 28, 219–228. [Google Scholar] [CrossRef] [Green Version]
  11. Yang, Z.B.; Rao, I.M.; Horst, W.J. Interaction of aluminium and drought stress on root growth and crop yield on acid soils. Plant Soil 2013, 372, 3–25. [Google Scholar] [CrossRef] [Green Version]
  12. Blair, M.W.; López-Marín, H.D.; Rao, I.M. Identification of aluminum resistant Andean common bean (Phaseolus vulgaris L.) genotypes. Braz. J. Plant Physiol. 2009, 21, 291–300. [Google Scholar] [CrossRef]
  13. Domingues, A.M.; Silva, E.; Freitas, G.; Ganança, J.F.; Slaski, J.J.; Ângelo, M.; Carvalho, P. Aluminium tolerance in bean traditional cultivars from Madeira. Rev. Ciências Agrárias 2013, 36, 148–156. [Google Scholar]
  14. Akhter, A.; Wagatsuma, T.; Khan, M.S.H.; Tawaraya, K. Comparative Studies on Aluminum Tolerance Screening Techniques for Sorghum, Soybean and Maize in Simple Solution Culture. Am. J. Plant Physiol. 2009, 4, 1–8. [Google Scholar] [CrossRef]
  15. Butare, L.; Rao, I.; Lepoivre, P.; Polania, J.; Cajiao, C.; Cuasquer, J.; Beebe, S. New genetic sources of resistance in the genus Phaseolus to individual and combined aluminium toxicity and progressive soil drying stresses. Euphytica 2011, 181, 385–404. [Google Scholar] [CrossRef]
  16. Hoagland, D.R.; Arnon, D.I. The water-culture method for growing plants without soil. Circ. Calif. Agric. Exp. Stn. 1950, 347, 1–32. [Google Scholar]
  17. Pavan, M.A.; Bingham, F.T. Toxidez de alumínio em cafeeiros cultivados em solução nutritiva. Pesqui. Agropecu. Bras. 1982, 17, 1293–1302. [Google Scholar]
  18. Ferreira, D.F. Sisvar: A computer statistical analysis system. Ciência e Agrotecnologia 2011, 35, 1039–1042. [Google Scholar] [CrossRef] [Green Version]
  19. R Core Team. R: A Language and Environment for Statistical Computing; R Core Team: Vienna, Austria, 2017. [Google Scholar]
  20. Wei, T.; Simko, V. R Package “Corrplot”: Visualization of a Correlation Matrix (Version 0.84). 2017. Available online: https://github.com/taiyun/corrplot (accessed on 19 September 2019).
  21. Costa França, M.G.; Pham Thi, A.T.; Pimentel, C.; Pereyra, R.O.R.; Zuily-Fodil, Y.; Laffray, D. Differences in growth and water relations among Phaseolus vulgaris cultivars in response to induced drought stress. Environ. Exp. Bot. 2000, 43, 227–237. [Google Scholar] [CrossRef]
  22. Molina, J.C.; Moda-Cirino, V.; Júnior, N.D.S.F.; de Faria, R.T.; Destro, D.; Da, N.; Fonseca Júnior, S.; Teixeira, R.F.; Destro, D. Response of common bean cultivars and lines to water stress. Crop Breending Applies Biotechnol. 2001, 1, 363–372. [Google Scholar] [CrossRef]
  23. Kassambara, A.; Mundt, F. Factoextra: Extract and Visualize the Results of Multivariate Data Analyses (R Package Version 1.0.5). 2017. Available online: https://CRAN.R-project.org/package=factoextra (accessed on 19 September 2019).
  24. Sade, H.; Meriga, B.; Surapu, V.; Gadi, J.; Sunita, M.S.L.; Suravajhala, P.; Kavi Kishor, P.B. Toxicity and tolerance of aluminum in plants: Tailoring plants to suit to acid soils. BioMetals 2016, 29, 187–210. [Google Scholar] [CrossRef]
  25. Buol, S.W. Soils and agriculture in Central-West and North Brazil. Sci. Agric. 2009, 66, 697–707. [Google Scholar] [CrossRef] [Green Version]
  26. Hungria, M.; Vargas, M.A.T. Environmental factors affecting N2 fixation in grain legumes in the tropics, with an emphasis on Brazil. F. Crop. Res. 2000, 65, 151–164. [Google Scholar] [CrossRef]
  27. Mensack, M.M.; Fitzgerald, V.K.; Ryan, E.P.; Lewis, M.R.; Thompson, H.J.; Brick, M.A. Evaluation of diversity among common beans (Phaseolus vulgaris L.) from two centers of domestication using ‘omics’ technologies. BMC Genom. 2010, 11, 686. [Google Scholar] [CrossRef] [PubMed] [Green Version]
  28. Zeffa, D.M.; Filho, R.S.; Moda-Cirino, V.; Pavan, M.A. Genetic Variability for Tolerance to Aluminum Toxicity in Cultivars and Promising Lines of Beans. UNOPAR Científica Ciências Exatas e Tecnológicas 2011, 10, 21–28. [Google Scholar]
  29. Yang, Z.; Eticha, D.; Albacete, A.; Rao, I.M.; Roitsch, T.; Horst, W.J. Physiological and molecular analysis of the interaction between aluminium toxicity and drought stress in common bean (Phaseolus vulgaris). J. Exp. Bot. 2012, 63, 3109–3125. [Google Scholar] [CrossRef]
  30. Rangel, A.F.; Rao, I.M.; Braun, H.P.; Horst, W.J. Aluminum resistance in common bean (Phaseolus vulgaris) involves induction and maintenance of citrate exudation from root apices. Physiol. Plant. 2010, 138, 176–190. [Google Scholar] [CrossRef]
  31. Rangel, A.F.; Rao, I.M.; Horst, W.J. Spatial aluminium sensitivity of root apices of two common bean (Phaseolus vulgaris L.) genotypes with contrasting aluminium resistance. J. Exp. Bot. 2007, 58, 3895–3904. [Google Scholar] [CrossRef]
  32. Gupta, N.; Gaurav, S.S.; Kumar, A. Molecular Basis of Aluminium Toxicity in Plants: A Review. Am. J. Plant Sci. 2013, 2013, 21–37. [Google Scholar] [CrossRef] [Green Version]
  33. Yang, Z.; Eticha, D.; Rao, I.M.; Horst, W.J. Alteration of cell-wall porosity is involved in osmotic stress-induced enhancement of aluminium resistance in common bean (Phaseolus vulgaris L.). J. Exp. Bot. 2010, 61, 3245–3258. [Google Scholar] [CrossRef] [Green Version]
  34. López-Marín, H.D.; Rao, I.M.; Blair, M.W. Quantitative trait loci for root morphology traits under aluminum stress in common bean (Phaseolus vulgaris L.). Theor. Appl. Genet. 2009, 119, 449–458. [Google Scholar] [CrossRef]
  35. Bojórquez-Quintal, E.; Escalante-Magaña, C.; Echevarría-Machado, I.; Martínez-Estévez, M. Aluminum, a Friend or Foe of Higher Plants in Acid Soils. Front. Plant Sci. 2017, 8, 1–18. [Google Scholar] [CrossRef] [PubMed]
  36. Bian, M.; Zhou, M.; Sun, D.; Li, C. Molecular approaches unravel the mechanism of acid soil tolerance in plants. Crop J. 2013, 1, 91–104. [Google Scholar] [CrossRef] [Green Version]
  37. Wang, H.; Huang, J.; Liang, W.; Liang, X.; Bi, Y. Involvement of putrescine and nitric oxide in aluminum tolerance by modulating citrate secretion from roots of red kidney bean. Plant Soil 2013, 366, 479–490. [Google Scholar] [CrossRef]
  38. Zhang, M.; Ma, Y.; Horst, W.J.; Yang, Z.B. Spatial-temporal analysis of polyethylene glycol-reduced aluminium accumulation and xyloglucan endotransglucosylase action in root tips of common bean (Phaseolus vulgaris). Ann. Bot. 2016, 118, 1–9. [Google Scholar] [CrossRef] [PubMed] [Green Version]
  39. Eticha, D.; Zahn, M.; Bremer, M.; Yang, Z.; Rangel, A.F.; Rao, I.M.; Horst, W.J. Transcriptomic analysis reveals differential gene expression in response to aluminium in common bean (Phaseolus vulgaris) genotypes. Ann. Bot. 2010, 105, 1119–1128. [Google Scholar] [CrossRef] [PubMed] [Green Version]
  40. Oliveira, D.P.; Vieira, N.M.B.; Souza, H.C.; De Morais, A.R.; Pereira, J.; Andrade, M.J.B. Qualidade tecnológica de grãos de cultivares de feijão-comum na safra das águas. Semin. Agrar. 2012, 33, 1831–1838. [Google Scholar] [CrossRef] [Green Version]
  41. Butare, L.; Rao, I.; Lepoivre, P.; Cajiao, C.; Polania, J.; Cuasquer, J.; Beebe, S. Phenotypic evaluation of interspecific recombinant inbred lines (RILs) of Phaseolus species for aluminium resistance and shoot and root growth response to aluminium-toxic acid soil. Euphytica 2012, 186, 715–730. [Google Scholar] [CrossRef]
Figure 1. Response of morphological variables of common bean cultivars exposed to increasing Al concentrations in nutrient solution. (A) plant height (cm) (PH); (B) root length (cm) (RL); (C) root volume (cm3) (RV); (D) shoot dry weight (g) (DS); (E) root dry weight (g) (RD); CV (%) = coefficient of variation. Means followed by the same letter did not differ significantly between cultivars within each Al concentration by the Scott–Knott test (p ≤ 0.05). * significant regression analysis at 5% probability.
Agronomy 10 00296 g001
Figure 2. Yield components of common bean cultivars at increasing Al concentrations in nutrient solution. (A) number of pods per plant (PN); (B) number of grains per plant (GN); (C) grain weight per plant (g) (GW); (D) 100-grain weight (g) (W100); (E) harvest index (HI); CV (%) = coefficient of variation. Means followed by the same letter did not differ significantly between cultivars within each Al concentration by the Scott–Knott test (p ≤ 0.05). * significant regression analysis at 5% probability.
Agronomy 10 00296 g002
Figure 3. Pearson’s correlation analysis for Al concentrations in nutrient solution, morphological variables, and yield components based on the evaluation of common bean cultivars. [Al]—Al concentrations; (PH)—plant height; (RL)—root length; (RV)—root volume; (PN)—number of pods per plant; (GN)—number of grains per plant; (GW)—grain weight; (W100)—100 grain weight; (SD)—shoot dry weight; (RD)—root dry weight; (HI)—harvest index. (X) = not significant at 1% probability.
Agronomy 10 00296 g003
Figure 4. Relationship between root length (cm) of commercial bean cultivars of the market classes carioca (A) and black (B) grown in Al-free nutrient solution (0 ppm) and exposed to Al-stress (4 ppm).
Agronomy 10 00296 g004
Figure 5. Relationship between root length (cm) of common bean cultivars of the red (A) and white market classes (B) in nutrient solution grown in Al-free solution (0 ppm) and under Al stress (4 ppm).
Agronomy 10 00296 g005
Figure 6. Principal component analysis of cultivars and bean lines grown in nutrient solution at 0 and 4 ppm aluminum. (A) Distribution of genotypes in the two most important components. (B) Contribution of variables to the formation of components; Variables: RL0: root length—0 ppm Al; RL4: root length—4 ppm Al; RRL: reduction root length; RV0: root volume—0 ppm Al; RV4: root volume—4 ppm Al; DR0: root dry weight—0 ppm Al; DR4: root dry weight—4 ppm Al.
Agronomy 10 00296 g006
Table 1. Characteristics of common bean cultivars used in the test to determine the optimized Al concentration.
CultivarInstitution 1OriginGroupGrowth HabitCycle
BRS RealceEmbrapaAndeanRedDeterminateEarly
IAC FormosoIACMesoamericanCariocaIndeterminateMedium
IPR CurióIAPARMesoamericanCariocaDeterminateEarly
IPR GarçaIAPARAndeanWhiteDeterminateEarly
1 Embrapa: Brazilian Agricultural Research Corporation; IAC: Agronomic Institute of Campinas; IAPAR: Agronomic Institute of Paraná.
Table 2. List of Mesoamerican and Andean genotypes evaluated under Al toxicity.
CultivarsInstitution 1OriginGroup Growth Habit Cycle
BRS EstiloEmbrapaMesoamericanCariocaIndeterminateMedium
IAC AlvoradaIACMesoamericanCariocaIndeterminateMedium
IPR Bem-Te-ViIAPARMesoamericanCariocaIndeterminateMedium
IPR Campos GeraisIAPARMesoamericanCariocaIndeterminateMedium
IPR Quero-QueroIAPARMesoamericanCariocaIndeterminateMedium
IPR SabiáIAPARMesoamericanCariocaIndeterminateMedium
IPR TangaráIAPARMesoamericanCariocaIndeterminateMedium
BRS CampeiroEmbrapaMesoamericanBlackIndeterminateMedium
BRS EsplendorEmbrapaMesoamericanBlackIndeterminateMedium
BRS EsteioEmbrapaMesoamericanBlackIndeterminateMedium
FT 110FT SementesMesoamericanBlackIndeterminateMedium
IAC UnaIACMesoamericanBlackIndeterminateMedium
IPR TuiuiúIAPARMesoamericanBlackIndeterminateMedium
IPR UirapuruIAPARMesoamericanBlackIndeterminateMedium
BRS EmbaixadorEmbrapaAndeanRedDeterminateEarly
DRK15CIATAndeanRedDeterminateEarly
DRK18CIATAndeanRedDeterminateEarly
KID44CIATAndeanRedDeterminateEarly
RLine 1IAPARAndeanRedDeterminateEarly
RLine 2IAPARAndeanRedDeterminateEarly
RLine 3IAPARAndeanRedDeterminateEarly
BRS ÁrticoEmbrapaAndeanWhiteDeterminateEarly
IPR GarçaIAPARAndeanWhiteDeterminateEarly
WLine 1IAPARAndeanWhiteDeterminateEarly
WLine 2IAPARAndeanWhiteDeterminateEarly
WLine 3IAPARAndeanWhiteDeterminateEarly
WLine 4IAPARAndeanWhiteDeterminateEarly
WLine 5IAPARAndeanWhiteDeterminateEarly
1 Embrapa: Brazilian Agricultural Research Corporation; IAC: Agronomic Institute of Campinas; IAPAR: Agronomic Institute of Paraná; CIAT: International Center for Tropical Agriculture.
Table 3. Common bean cultivars of Mesoamerican origin, market classes carioca and black, grown in Al-free and Al-contaminated nutrient solution.
GenotypesRoot Length (cm)Root Volume (cm3)Root Dry Weight (g)
0 ppm4 ppmRR(%)0 ppm4 ppmRR(%)0 ppm4 ppmRR(%)
Carioca Group
BRS Estilo50.4 Ab31.2 Bb384.5 Ab3.4 Bd260.22 Ac0.18 Ac16
IAC Alvorada54.6 Aa30.3 Bb445.8 Aa4.9 Bb150.28 Ab0.26 Aa5
IPR Bem-Te-Vi45.1 Ab33.4 Ba265.4 Aa4.7 Ab130.32 Aa0.27 Aa15
IPR Campos Gerais48.5 Ab29.4 Bb395.4 Aa4.9 Ab100.27 Ab0.27 Aa0
IPR Quero-Quero60.4 Aa39.8 Ba346.4 Aa6.0 Aa60.30 Aa0.31 Aa0
IPR Sabiá59.1 Aa27.8 Bb535.9 Aa4.4 Bc260.36 Aa0.31 Aa14
IPR Tangará51.1 Ab34.6 Ba324.4 Ab4.1 Ac70.22 Ac0.24 Ab0
CV(%)16.4914.1418.56
Black Group
BRS Campeiro52.1 Aa37.3 Ba296.4 Aa5.7 Ab110.42 Aa0.41 Ab3
BRS Esplendor52.4 Aa38.1 Ba275.6 Ab6.2 Aa00.44 Aa0.46 Aa0
BRS Esteio49.9 Aa38.5 Ba235.2 Ab5.9 Ab00.34 Ab0.44 Ba0
FT 11049.6 Aa30.4 Bb396.4 Aa6.2 Aa30.46 Aa0.52 Ba0
IAC Una55.7 Aa36.0 Ba355.7 Ab6.7 Ba00.43 Aa0.46 Aa0
IPR Tuiuiu44.0 Ab38.9 Aa126.0 Aa6.2 Aa00.45 Aa0.45 Aa0
IPR Uirapuru51.1 Aa39.4 Ba235.7 Ab5.2 Ab90.40 Ab0.38 Ab4
CV(%)13.8112.5213.30
RR: Reduction rate of the variable (%) measured in plants grown in the presence of Al; means followed by the same capital letter did not differ significantly between Al concentrations by the F test (p ≤ 0.05); means followed by the same lowercase letter did not differ significantly between genotypes by the Scott–Knott test (p ≤ 0.05).
Table 4. Common bean cultivars of Andean origin, red and white market classes, grown in Al-free and Al-contaminated nutrient solution.
GenotypesRoot Length (cm)Root Volume (cm3)Root Dry Weigth (g)
0 ppm4 ppmRR(%)0 ppm4 ppmRR(%)0 ppm4 ppmRR(%)
Red group
BRS Embaixador34.7 Aa21.6 Ba384.7 Ab4.0 Ab150.28 Aa0.25 Aa11
DRK1526.8 Ab20.1 Ba255.1 Aa3.8 Bb260.25 Aa0.23 Aa9
DRK1827.1 Ab20.4 Ba255.7 Aa5.0 Aa120.26 Aa0.25 Aa4
KID4436.0 Aa21.7 Ba405.1 Aa4.7 Aa80.24 Aa0.23 Aa2
RLine 128.8 Ab22.5 Ba224.0 Ab4.6 Aa00.23 Aa0.20 Aa13
RLine 227.2 Ab18.7 Ba315.2 Aa4.2 Bb200.29 Aa0.21 Ba26
RLine 330.9 Ab20.6 Ba334.5 Ab4.3 Ab60.25 Aa0.22 Aa13
CV(%)14.5816.2417.64
White group
BRS Artico43.4 Ab29.5 Bb326.6 Aa6.0 Ab90.38 Aa0.38 Aa1
IPR Garça47.4 Aa30.0 Bb376.1 Aa6.6 Aa00.41 Aa0.45 Aa0
WLine 149.0 Aa24.6 Bb506.1 Aa5.6 Ab80.43 Aa0.36 Aa16
WLine 235.4 Ac26.1 Bb265.1 Ab6.6 Ba00.40 Aa0.45 Aa0
WLine 336.6 Ac30.5 Bb175.0 Ab6.5 Ba00.36 Aa0.42 Aa0
WLine 443.5 Ab26.7 Bb396.6 Aa5.5 Bb170.41 Aa0.35 Aa15
WLine 551.7 Aa39.3 Ba246.1 Aa6.8 Ba00.35 Aa0.41 Aa0
CV(%)14.9615.9321.83
RR: Reduction rate of the variable (%) measured in plants grown in the presence of Al; means followed by the same capital letter did not differ significantly between Al concentrations by the F test (p ≤ 0.05); means followed by the same lowercase letter showed no significant differences between genotypes by the Scott–Knott test (p ≤ 0.05).

